How Does ACA Marketplace Enrollment in 2026 Vary Across Congressional Districts?
Enrollment in the Affordable Care Act (ACA) Marketplaces fell in 2026 for the first time in seven years, following the expiration of the enhanced premium tax credits at the end of 2025. Nationally, effectuated enrollment declined from 21.8 million people in 2025 to 19.2 million in February 2026, a 12% drop, and is expected to further decline through the remainder of 2026. A KFF survey of 2025 Marketplace enrollees found that 1 in 10 reported they had become uninsured in early 2026. For remaining enrollees, health costs have risen substantially, with premium payments rising 58% on average, and deductibles up by 37% or about $1,000 per person.
Changes in enrollment, however, were not evenly distributed across the country. Marketplace enrollment changed substantially from one state to another, and even within states. In some congressional districts, a sizable portion of the population are enrolled in ACA Marketplace plans, such as several districts in Florida in which almost 30% of the population is enrolled.
This analysis estimates how Marketplace enrollment varies both within and across states using both publicly available data on federally facilitated Exchanges (FFEs) from the Centers for Medicare and Medicaid Services (CMS) and data provided by state-based Exchanges (SBEs). Enrollment estimates are rounded to the nearest thousand. Key takeaways include:
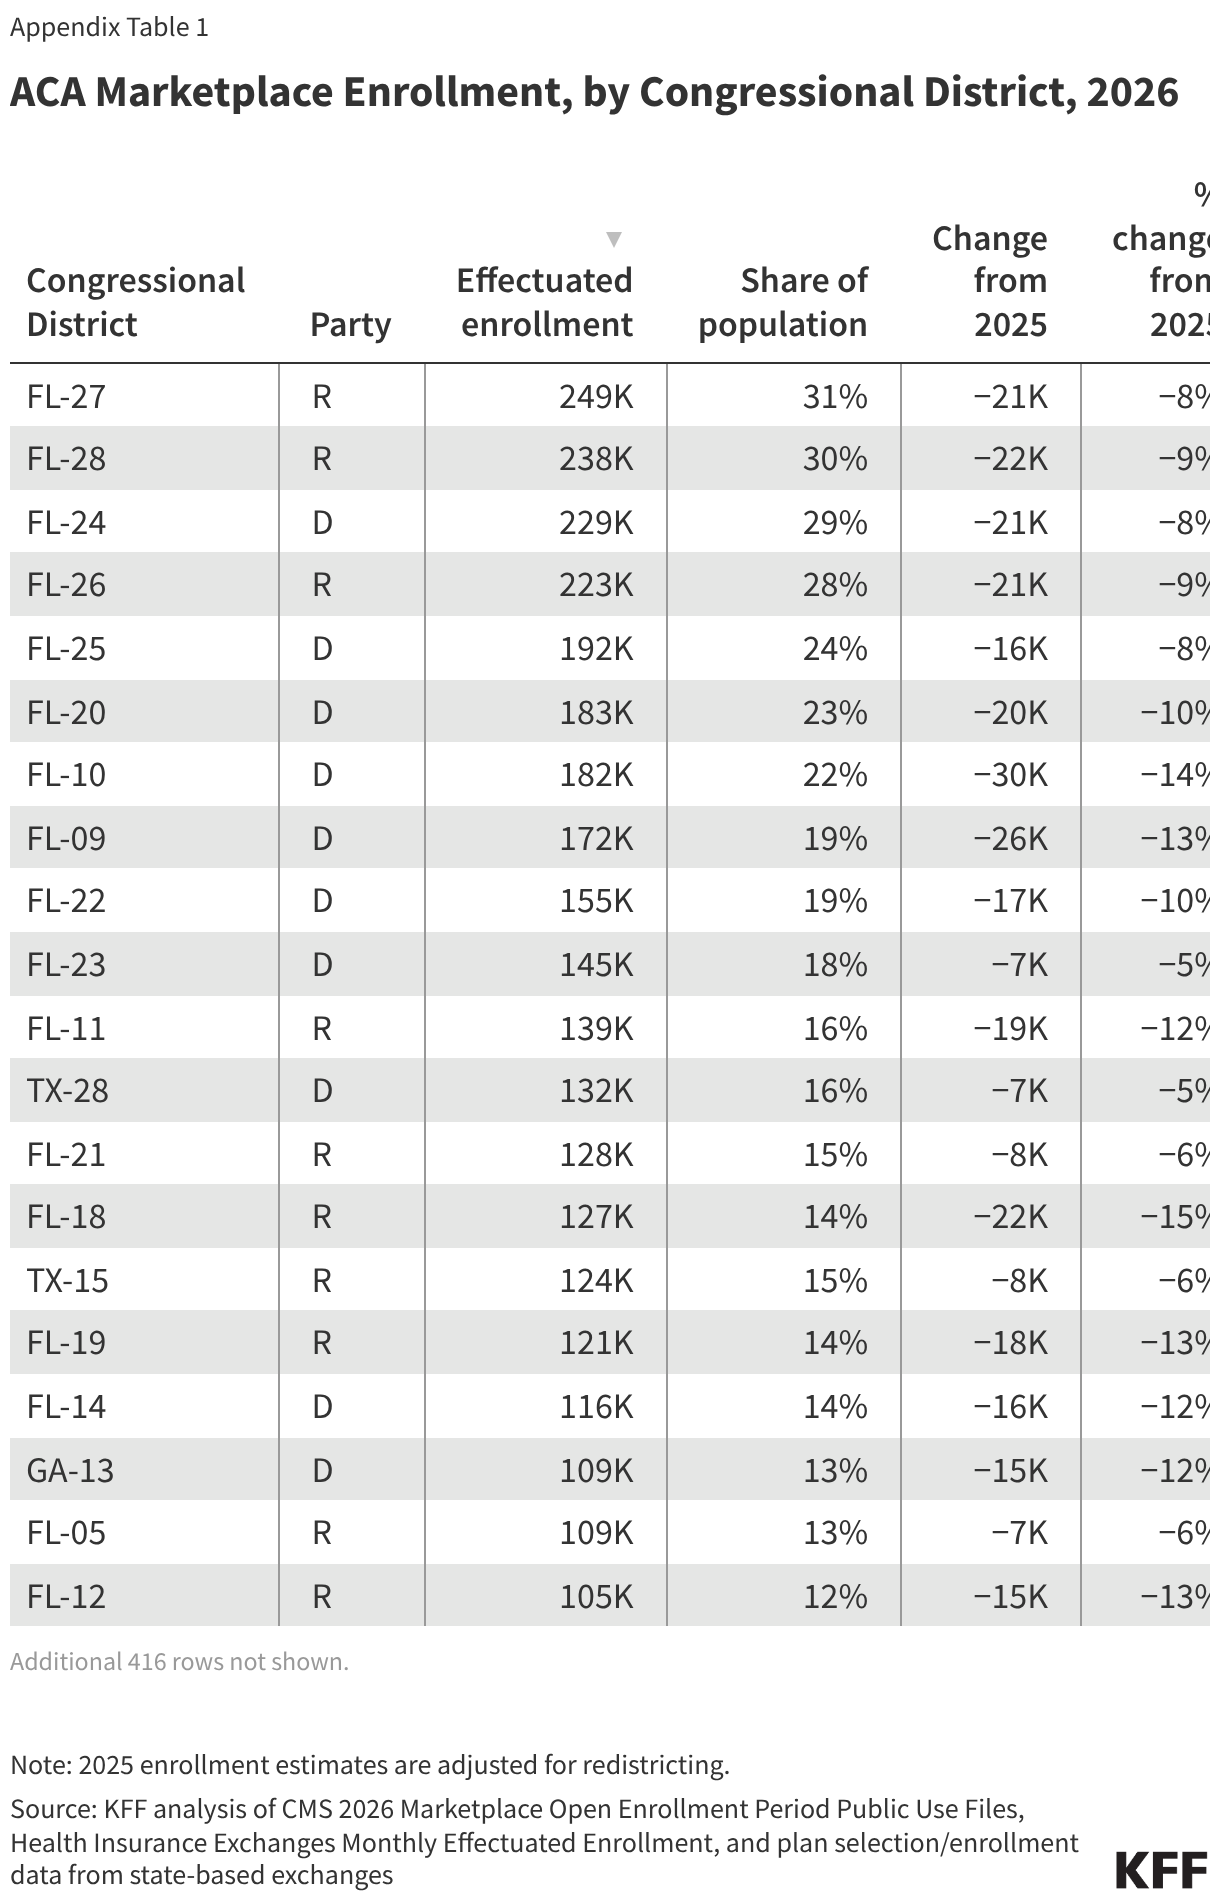
- Marketplace enrollment varies widely by congressional district: from as low as 2,000 people to 249,000 people.
- In 12 Democratic districts and 16 Republican districts, more than 100,000 people are enrolled in an ACA plan, based on the incumbent representative. All these districts are in Florida, Texas, or Georgia.
- Marketplace enrollment fell more sharply in Republican-held congressional districts, which account for 55% of current enrollees but 67% of the enrollment decline between 2025 and 2026.
- The top 10 Republican districts with the highest number of Marketplace enrollees are: FL-27 (249,000), FL-28 (238,000), FL-26 (223,000), FL-11 (139,000), FL-21 (128,000), FL-18 (127,000), TX-15 (124,000), FL-19 (121,000), FL-05 (109,000), and FL-12 (105,000).
- The top 10 Democratic districts with the highest number of Marketplace enrollees are: FL-24 (229,000), FL-25 (192,000), FL-20 (183,000), FL-10 (182,000), FL-09 (172,000), FL-22 (155,000), FL-23 (145,000), TX-28 (132,000), FL-14 (116,000), and GA-13 (109,000).
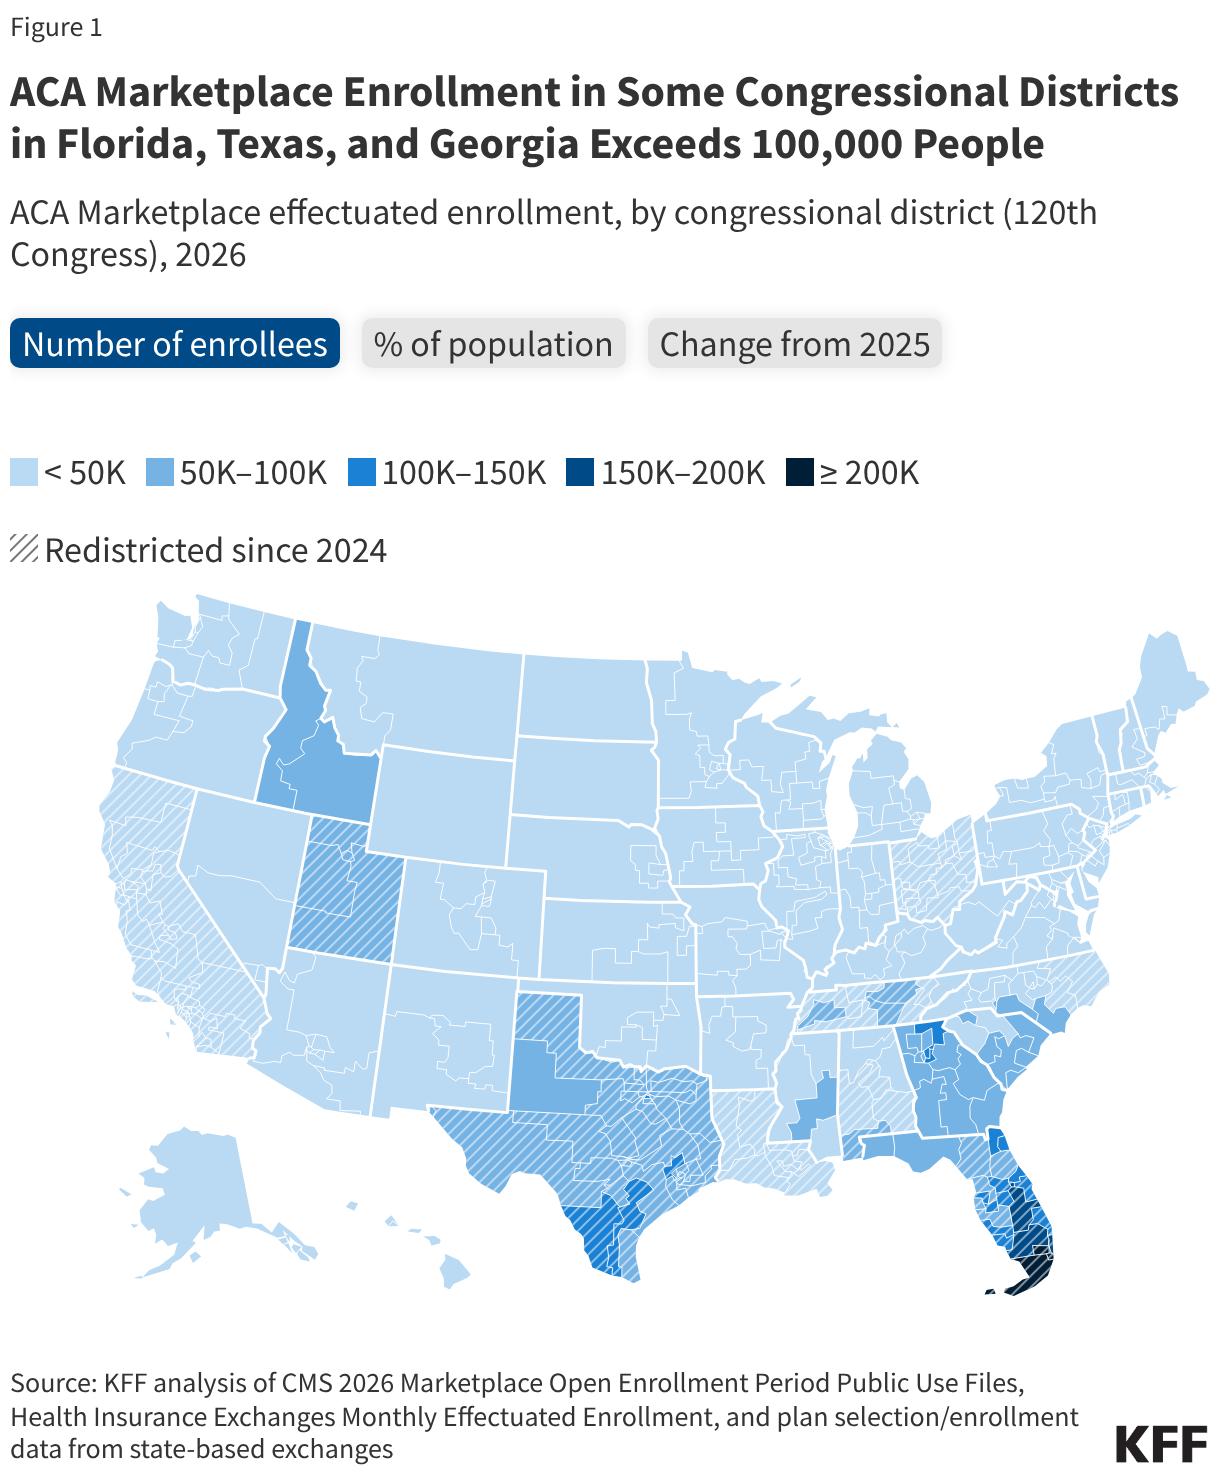
The number of people enrolled in an ACA Marketplace plan varies widely across the country, reflecting differences in demographics, eligibility, the availability of other sources of coverage, and state Marketplace policies. Enrollment is generally highest in the South, where several states have not expanded Medicaid, leaving some low-income people eligible for subsidized Marketplace coverage instead. Florida has 21 congressional districts with more than 100,000 Marketplace enrollees, including the 11 districts with the highest enrollment nationwide. Texas and Georgia also have districts with more than 100,000 enrollees.
Marketplace enrollment is estimated to account for a large share of the population in several Florida districts, including 31% in FL-27, 30% in FL-28, 29% in FL-24, and 28% in FL-26. Districts in Georgia, Texas, and Utah also have Marketplace enrollment representing at least 10% of the population. Most ACA Marketplace enrollees (55%) live in a Republican-held congressional district. This is roughly proportionate to Republicans’ share of House seats. Two-thirds of the enrollment decline between 2025 and 2026 occurred in Republican-held districts (67%).
Marketplace enrollment is much lower in states with broader public coverage options. Twenty-four of the 25 congressional districts with the lowest estimated Marketplace enrollment are in New York, each with less than 10,000 enrollees. Minnesota, Oregon, Kentucky, and Hawaii also have low ACA Marketplace enrollment. In the majority of their congressional districts, less than 3% of the population are enrolled in an ACA plan. All five states have expanded Medicaid eligibility up to 138% of the federal poverty line (FPL), and New York, Minnesota, and Oregon additionally offer Basic Health Plans that cover low-income residents.
ACA Marketplace enrollment represents a substantial share of the population in many states, but the share varies widely. Overall, the share of state populations enrolled in ACA Marketplace plans tends to be highest across the South, where several states have not expanded Medicaid, while shares are generally lower in the Northeast and Midwest. Thirteen states have greater than 5% of their population enrolled in ACA Marketplace coverage; they were all won by President Trump in 2024.
Florida has the highest share, with 16% of its population enrolled in a Marketplace plan, followed by Georgia (11%), Texas (10%), and Utah (10%). In contrast, enrollment accounts for less than 2% of the population in New York (1%), Hawaii (2%), Minnesota (2%), and the District of Columbia (2%).
Methods
To estimate effectuated enrollment by congressional district, effectuated enrollment was first determined at the county level and then allotted to congressional district. For states operating state-based exchanges (SBE), 2026 county enrollment data provided by the exchanges directly are February or first quarter effectuated enrollment, measured as of at least March 15. When county effectuated enrollment was not available, it was estimated by multiplying county plan selection counts by the state-level effectuation rate. This method was used to estimate enrollments for all counties in 2025, and in 2026, counties in FFM states and SBE states where only plan selection data were available (California, Idaho, Maryland, and Pennsylvania). County plan selections were obtained from the CMS Open Enrollment Period (OEP) County-Level Public Use File (PUF) for FFE states or directly from the SBE; state-level effectuation rate was derived from the OEP State-Level PUF and CMS’s Monthly Effectuated Enrollment data. Allocation of county effectuated enrollment to congressional district was based on the 2020 decennial census distribution using the Census Bureau block equivalency file for the 120th Congress for all states except Missouri, which retained the block equivalency of the 119th Congress.
Population estimates from 2026 are not yet available so data for 2025 were used, which may slightly overestimate the share of population enrolled in Marketplace coverage in states with large recent population growth. (For reference, state population change from 2024 to 2025 ranged from -0.3% in Vermont to +1.5% in South Carolina.) To estimate the population of each congressional district, state population estimates from Vintage 2025 of the Census Bureau Population Estimates Program were allocated to congressional districts using the population distribution from the Census Bureau 2024 American Community Survey 1-year estimates. A different method was used for states that recently redistricted: Alabama, California, Florida, Louisiana, North Carolina, Ohio, Tennessee, Texas, and Utah. In these states, the Vintage 2025 county population estimates were allocated to congressional district using the distribution from the 2020 decennial census.
Congressional district maps of effectuated enrollment account for redistricting ahead of the 120th Congress. 2024 House race vote margins were marked as NA for districts with boundary changes after the 2024 election ahead of the 120th Congress. These were identified by comparing Census Bureau block equivalency files for the 119th and 120th Congress for all states other than Missouri.
Appendix