Medicare

New & Noteworthy

Data Visualization

The Facts About Medicare Spending

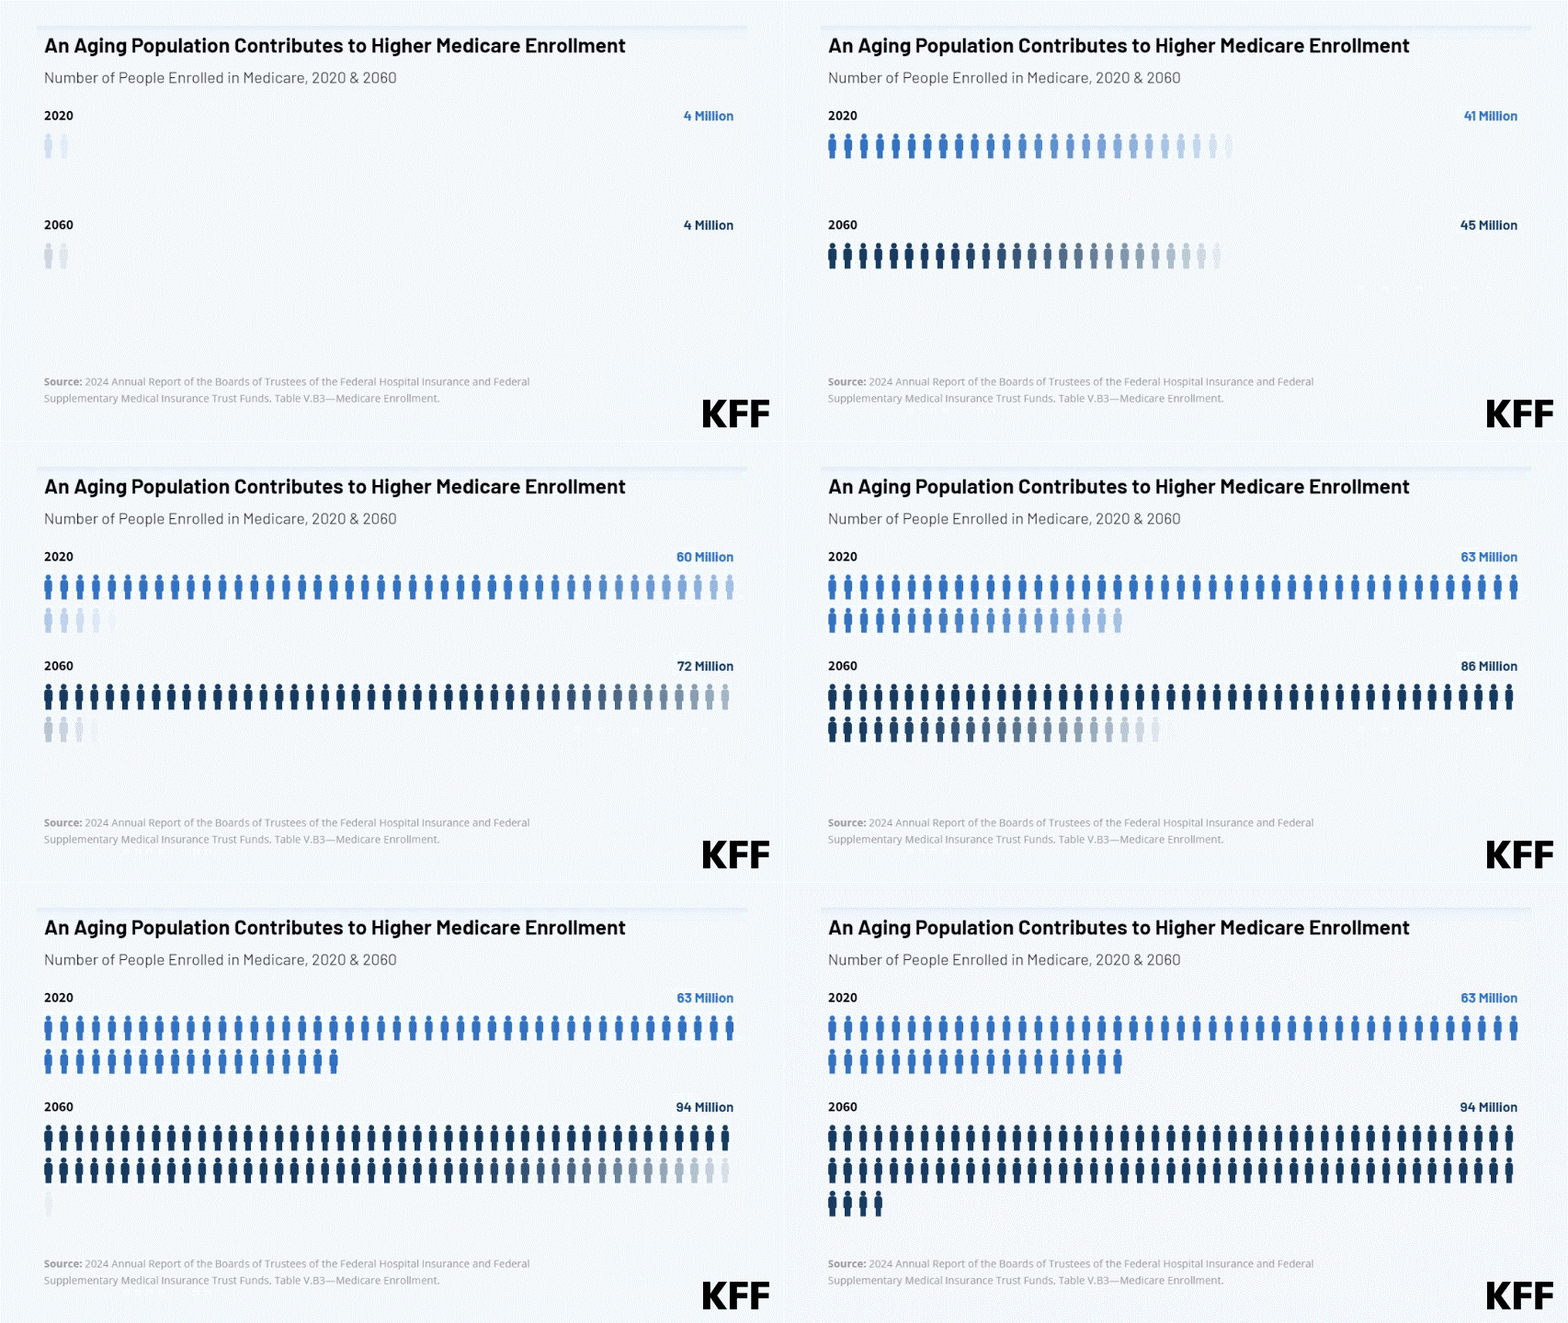
This interactive provides the facts on Medicare spending. Medicare, which serves 67 million people and accounts for 12 percent of the federal budget and 21 percent of national health spending, is often the focus of discussions about health expenditures, health care affordability and the sustainability of federal health programs.

Explore data on enrollment growth, Medicare spending trends overall and per person, growth in Medicare spending relative to private insurance, spending on benefits and Medicare Advantage, Part A trust fund solvency challenges, and growth in out-of-pocket spending by beneficiaries.

Related: FAQs on Medicare Financing and Trust Fund Solvency

Read More

Subscribe to KFF Emails

Choose which emails are best for you.
Sign up here

Filter

351 - 360 of 1,568 Results

  • Most Office-Based Physicians Accept New Patients, Including Patients With Medicare and Private Insurance

    Issue Brief

    This brief examines the share of non-pediatric office-based physicians accepting new patients with Medicare or private insurance and how these rates have changed over time and vary by physician specialties, geographic areas, and physician and practice characteristics across Medicare and private insurance. This analysis further examines the extent to which non-pediatric physicians are opting out of Medicare, by specialty and state.

  • New Interactive Provides Essential Facts and Trends Related to Medicare Spending

    News Release

    A new KFF interactive provides essential facts and trends about spending on Medicare, the federal health insurance program that covers 65 million seniors and people with disabilities, or nearly 1 in 5 Americans. In 2020, Medicare spending accounted for 12 percent of the federal budget and 20 percent of national health care spending.

  • Help with Medicare Premium and Cost-Sharing Assistance Varies by State

    Issue Brief

    This data note provides an overview of programs that help beneficiaries with modest incomes with their Medicare costs, including the Medicare Savings Programs and the Part D Low-Income Subsidy, and highlights findings from corresponding state-level profiles of eligibility and enrollment.

  • Medicare State Profiles

    Interactive

    These state profiles capture the variations across states in the number and characteristics of Medicare beneficiaries through the Medicare Savings Programs and Medicare’s Part D Low-Income Subsidy.

  • The Growth in Share of Medicare Advantage Spending

    Feature

    Earlier this week, the Biden Administration announced the final Medicare Advantage rates for 2023, which are projected to result in an average increase in Medicare Advantage plan revenue of 8.5% compared to 2022 - the highest average expected increase in recent years.

  • Medicare Part B Drugs: Cost Implications for Beneficiaries in Traditional Medicare and Medicare Advantage

    Issue Brief

    In the face of rising prescription drug costs, a large majority of the public supports federal efforts to lower drug spending. Policymakers are considering several proposals that would lower prescription drug costs. To better understand the potential out-of-pocket cost exposure that Medicare beneficiaries may face for Part B drugs, which are typically administered by physicians and other health care providers, we analyzed cost-sharing liability for these drugs in traditional Medicare and cost-sharing requirements in Medicare Advantage plans.

  • Half of Admissions in the Large Group Market Are Paid Above 150% of Medicare Rates, Excluding Maternity Admissions

    Issue Brief

    This analysis looks at in-network payment rates for inpatient hospital stays, other than maternity/newborn admissions, among large employer plans relative to Medicare payment rates. We find that a cap of 150% of Medicare rates would affect 52% of in-network admissions and 36% of in-network spending, while a cap of 300% of Medicare rates would affect 13% of in-network admissions and 13% of in-network spending, with variation across types of admissions.

  • Prices Increased Faster Than Inflation for Half of all Drugs Covered by Medicare in 2020

    Issue Brief

    Recent legislation would require drug companies to pay rebates to the federal government when annual increases in prescription drug prices for Medicare and private insurance exceed the rate of inflation. As context for understanding the possible impact of this proposal, this analysis compares price changes for drugs covered by Medicare Part B (administered by physicians) and Part D (retail prescription drugs) between 2019 and 2020 to the inflation rate over the same period.