Medicare

New & Noteworthy

Data Visualization

The Facts About Medicare Spending

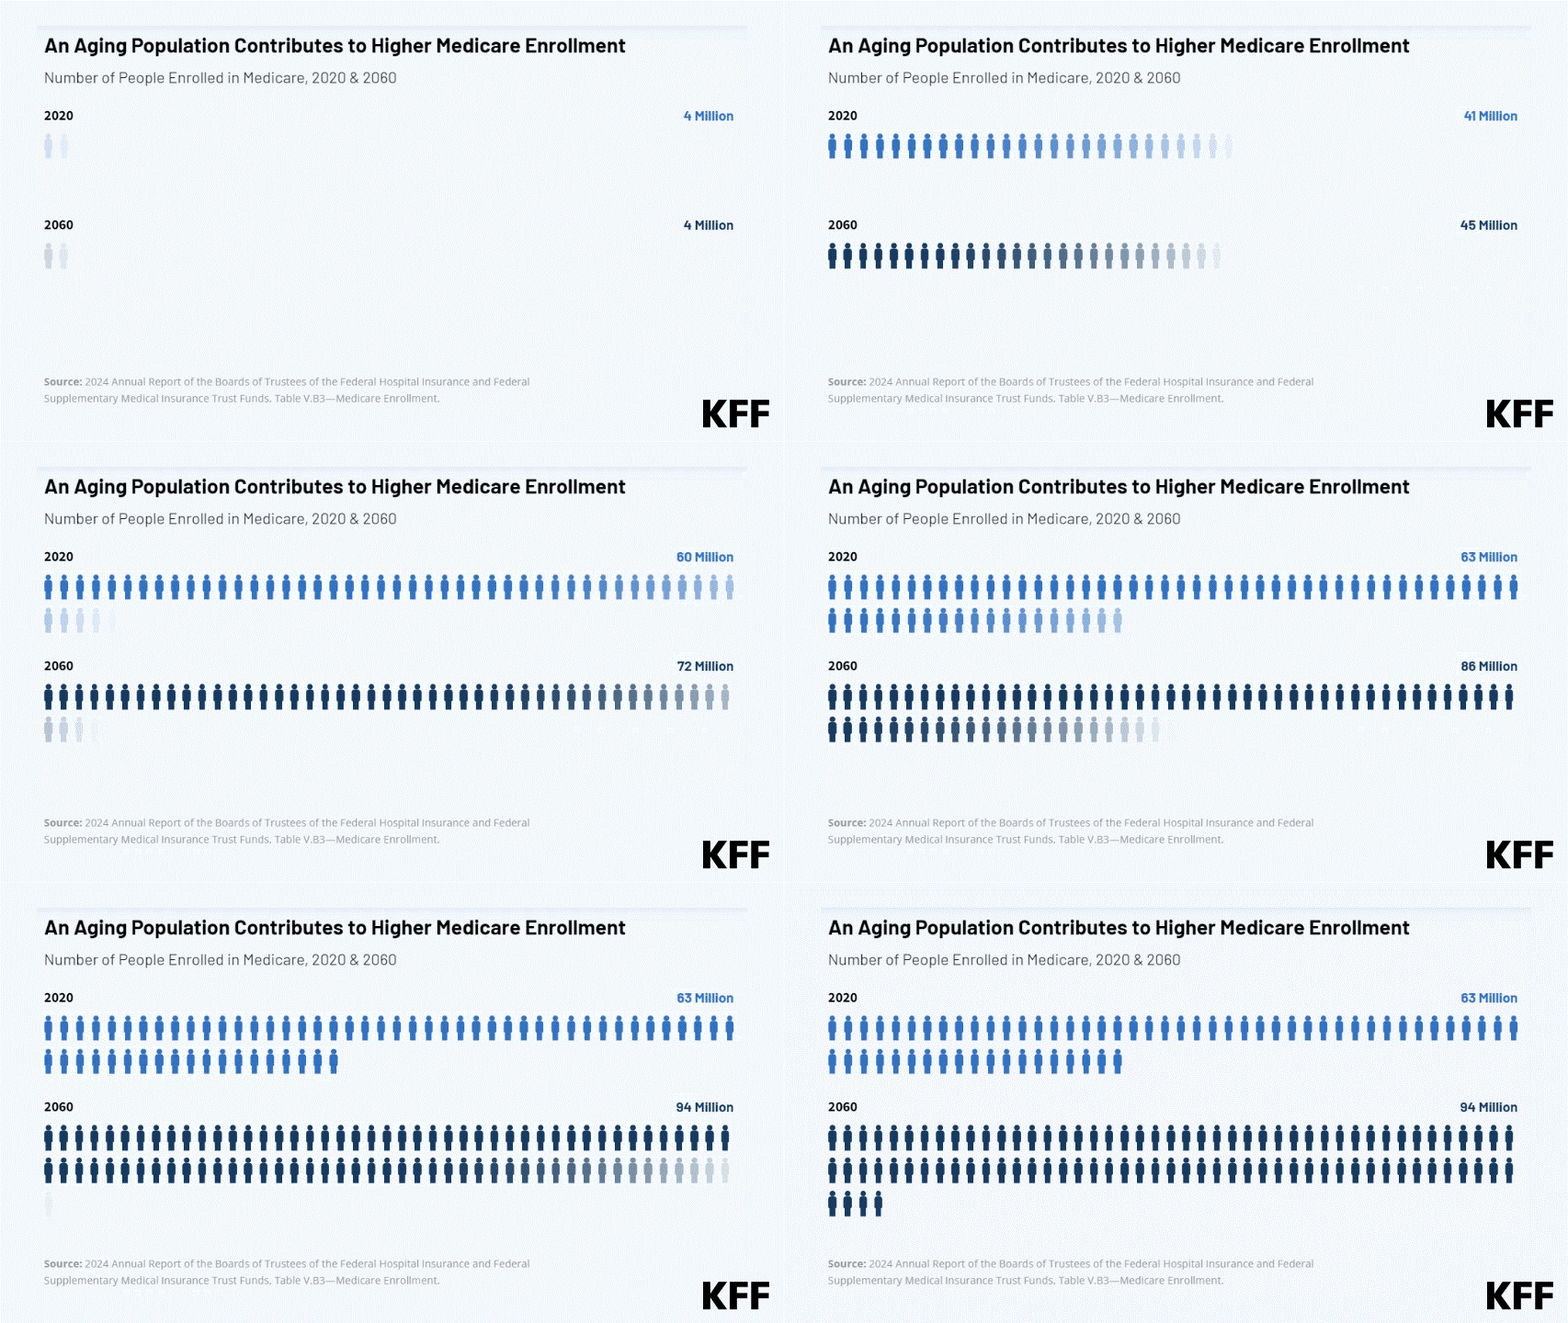
This interactive provides the facts on Medicare spending. Medicare, which serves 67 million people and accounts for 12 percent of the federal budget and 21 percent of national health spending, is often the focus of discussions about health expenditures, health care affordability and the sustainability of federal health programs.

Explore data on enrollment growth, Medicare spending trends overall and per person, growth in Medicare spending relative to private insurance, spending on benefits and Medicare Advantage, Part A trust fund solvency challenges, and growth in out-of-pocket spending by beneficiaries.

Related: FAQs on Medicare Financing and Trust Fund Solvency

Read More

Subscribe to KFF Emails

Choose which emails are best for you.
Sign up here

Filter

1,301 - 1,310 of 1,569 Results

  • Visualizing Health Policy: The Role of Medicaid and Medicare in Women’s Health Care

    Other

    This month’s Visualizing Health Policy infographic provides information about the role of Medicaid and Medicare in women’s health care: the proportion of US women who are covered by Medicaid and Medicare; how women comprise the majority of those covered by the Medicaid and Medicare programs and the majority of those receiving long-term services and supports (such as home health care); how women on Medicaid are poorer and sicker than women with private coverage; how Medicaid is a primary payer for women’s reproductive health services; and how women on Medicare spend more than their male counterparts on medical care and also have higher rates of health problems and social challenges.

  • Medicare Advantage 2013 Spotlight: Enrollment Market Update

    Issue Brief

    This Data Spotlight provides an overview of Medicare Advantage enrollment patterns in March 2013, and examines variations by plan type, state, and firm. It also analyzes trends in premiums paid by beneficiaries enrolled in Medicare Advantage plans, including variations by plan type, and describes the out-of-pocket limits and prescription drug coverage in the Part D “donut hole” provided by the plans in 2013.

  • Old and Poor: America’s Forgotten

    Video

    While the Census Bureau’s official poverty measure shows 9 percent of seniors nationally live in poverty, the share climbs to about one in seven seniors (15 percent) under the Bureau’s alternative Supplemental Poverty Measure, which takes into account out-of-pocket health expenses and geographic differences in the cost of living. Produced by the Kaiser Family Foundation, Old and Poor: America's Forgotten provides a portrait of seniors who are living in poverty, in both urban and rural areas across the United States.

  • Independent Payment Advisory Board (IPAB) Process: A Timeline

    Feature

    IPAB Timeline Download Source Kaiser Family Foundation, “The Independent Payment Advisory Board: A New Approach to Controlling Medicare Spending,” 2011, https://www.kff.org/health-reform/issue-brief/the-independent-payment-advisory-board-a-new/.

  • Modifying Traditional Medicare’s Benefit Design Could Reduce Federal Spending But With Cost Tradeoffs Between Beneficiaries and The Federal Government

    News Release

    Revamping traditional Medicare’s benefit design and restricting “first-dollar” supplemental coverage could reduce federal spending, simplify cost sharing, protect against high medical costs, decrease out-of-pocket spending for many beneficiaries, and provide more help to those with low incomes -- but would be unlikely to achieve all of these goals simultaneously.