Legislative Summary: State Children’s Health Insurance Program – Fact Sheet

Published: Nov 29, 1997

State Children’s Health Insurance Program Summary

November 1997

Nearly 10 million children are uninsured, often resulting in difficulties in obtaining needed health care. To expand coverage to low-income uninsured children, Congress enacted the State Children’s Health Insurance Program (CHIP) as part of the Balanced Budget Act (BBA) of 1997 (P.L. 105-33). This new program allocates $20.3 billion in federal matching funds over five years to states to expand insurance for children. States can use the federal funds to expand coverage either through a separate state program or by broadening their Medicaid programs — or both.

Eligibility

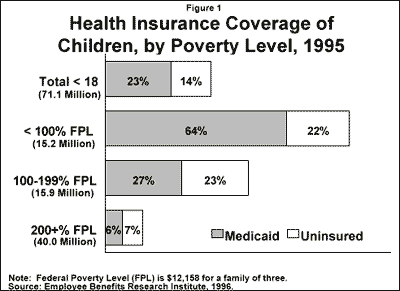
The intent of CHIP is to expand health insurance coverage to uninsured children under age 19 in families with incomes below 200% of poverty (Figure 1). Children with private insurance or who are covered by or qualify for Medicaid are ineligible for CHIP, as are those who are residents of public institutions or whose families are eligible for state employee health benefits. Undocumented children and legally resident children arriving in the U.S. after August 22, 1996 are ineligible for coverage but may qualify for emergency Medicaid assistance. States that implement their child health insurance programs through Medicaid may use federal funds to cover legally resident children in the country prior to August 22, 1996.
1345-fig1.gif

States that choose to operate a separate state child insurance program can establish eligibility based on geographic area, age, income and resources, residency, and disability status, as well as limit duration of coverage. States cannot exclude children based upon a preexisting condition or diagnosis, and cannot cover higher income children before lower income children.

If states use the Medicaid option, children become entitled to full Medicaid coverage. States that have already broadened Medicaid income eligibility levels above 150% of the federal poverty level (FPL) can expand coverage to children up to 50 percentage points above the current level. For example, a state with eligibility set at 175% FPL could expand to 225% FPL.

Benefits and Cost-sharing

The benefit package options available to states fall into three general categories: Benchmark, benchmark-equivalent, or Medicaid.

  • Benchmark Packages: States can offer one of three existing benefit packages: including the Federal Employees Blue Cross/Blue Shield PPO plan; coverage available to state employees; or coverage offered by the HMO with the state’s largest commercially enrolled population.
  • Benchmark-Equivalent Coverage: States can use a package with aggregate value greater than or equal to a benchmark plan. Hospital, physician, laboratory and x-ray, and well baby/child services must be included at a value at least actuarially equivalent to the benchmark benefit package. If prescription drugs, mental health, vision, and hearing services are included in the benchmark plan, then they must be part of the benchmark-equivalent coverage with a value of at least 75% of the benchmark plan’s actuarial value.
  • Medicaid: States that expand Medicaid must provide the complete benefit package, which includes well-child care, immunizations, prescription drugs, doctor visits, hospitalization, and EPSDT, as well as long-term care for disabled children. The Medicaid benefit package for children is broad and should satisfy the benchmark requirement in a state that administers a separate CHIP program.

The Secretary has the authority to approve a different benefit package that is determined to be appropriate for low-income children. The existing New York, Florida, and Pennsylvania child health programs are deemed to satisfy federal requirements for benefits.

Under the new program, states cannot impose cost-sharing for preventive services including well-baby and well-child care and immunizations. For children with family incomes below 150% FPL, cost-sharing must be “nominal” as under the Medicaid statute. Medicaid currently permits premiums of $15 to $19 per month per family and co-payments of up to $3 per service. Cost-sharing for children with incomes above 150% FPL can be imposed based on an income-related sliding scale, but total cost sharing cannot exceed 5% of family income. Coverage can be provided directly by the state Medicaid program, an insurer, or any other entity considered to be qualified by the state.

Financing

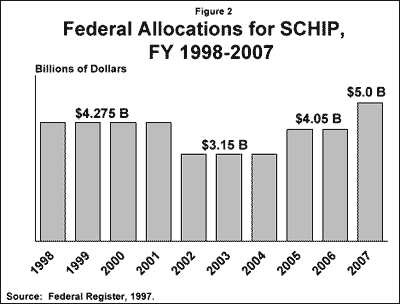
The BBA authorizes $20.3 billion in federal funds from FY 1998 through FY 2002 and $19.4 billion over the second five years. Over the ten-year period, the funds are allocated as follows: $4.275 billion per year in FY 1998-2001, falling to $3.15 billion annually in FY 2002 through 2004, and then rising to $4.05 billion from FY 2005 through 2006, and reaching $5 billion for 2007, for a total of $40 billion.
1345-fig2.gif

Annual federal allocations to states are based on the states’ share of low-income and uninsured children using estimates from the Current Population Survey, conducted by the U.S. Census Bureau. The allotment formula changes over time to adjust for reductions in the number of uninsured children.

States do not receive their allotments automatically. States must have their child health plan approved by HHS and are required to contribute state funds in order to draw down, or “match” their federal allotment. The state share cannot include beneficiary cost-sharing and is subject to the same provider tax and donation limitations specified in the Medicaid statute.

Under the new state program, states receive an “enhanced” federal matching rate based on their Medicaid matching rate. The CHIP enhanced rate essentially reduces by 30 percent the share states pay as compared to what they would contribute under their Medicaid match. For example, a state with a federal match of 60% under Medicaid would receive an “enhanced” rate of 72% under the new program. In essence, the state would pay 28 cents of every dollar spent under the new children’s program. No state may receive a matching rate greater than 85% and the minimum annual payment for a state is $2 million. States can receive an enhanced matching rate for providing Medicaid coverage to an expanded group of children. All Medicaid rules, including the entitlement to coverage, would apply to the newly covered group of children. States would continue to receive the regular Medicaid matching rate after their CHIP allotment was depleted.

While the states have considerable latitude in designing and structuring their CHIP programs, there are some limits on what federal CHIP payments can be used for:

  • No more than 10 percent of federal payments can be used for outreach, administrative costs or direct service payments to clinics or hospitals. The Secretary can authorize waivers to allow states to create community-based programs or to purchase family coverage.
  • States cannot adopt Medicaid eligibility criteria that are more restrictive than those in effect as of June 1, 1997.
  • Maintenance of effort is also required in state-only programs in New York, Pennsylvania, and Florida.
  • Abortions cannot be covered by federal or state funds except to save the life of the mother or in the case of rape or incest.

Child-Related Medicaid Provisions

In addition to the creation of the new state child health insurance program, several changes to Medicaid were made to strengthen coverage for children under the Balanced Budget Act of 1997. States can now opt to:

  • Extend presumptive eligibility to children — This means that services provided to uninsured children will be covered by Medicaid before eligibility determination is complete. For children who are determined to be eligible for the new program, the costs will be paid through new program funds.
  • Offer 12 month continuous eligibility to children — States can provide up to one year of continuous eligibility for children under Medicaid, regardless of any changes in family income during that period.
  • Accelerate the phase-in to cover poor children born before September 30, 1983. In the past, states could cover these children under Section 1902(r)(2) at state option or through a Section 1115 waiver. The BBA of 1997 clarifies this option. Some 27 states have used these options to expand coverage to older children.

States must also restore Medicaid eligibility to disabled children who lost SSI under the 1996 welfare reform legislation. The Balanced Budget Act also includes numerous provisions that grant states increased flexibility over their Medicaid programs. These include the ability to mandate managed care enrollment without a waiver and greater control over provider payment through the repeal the Boren Amendment and a phase-out of cost-based reimbursement for Federally Qualified Health Centers.
Working Families at Risk: Coverage, Access, Cost and Worries

Published: Nov 29, 1997

Many Working Families Struggle To Get Needed Care And Pay Medical Bills

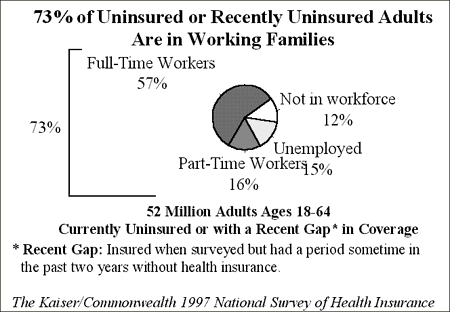
Three-Quarters of the Currently or Recently Uninsured Are in Working Families

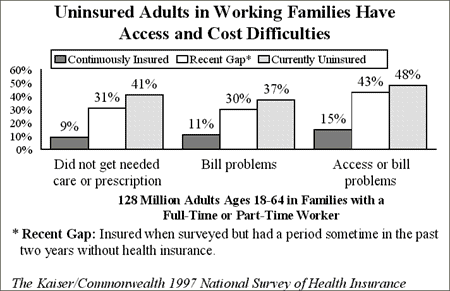
Nearly Half of Uninsured Adults in Working Families Have Access or Bill Problems

Embargoed for release until: 10:00 a.m., EST, Monday, December 8, 1997

For further Information contact: Chris Ferris (202)347-5270 or Mary Mahon (212)606-3853

Washington, D.C.– Three in four American adults who do not have health insurance or who have experienced a recent gap in coverage are part of working families — they are either full- or part-time workers or the spouse of a worker — according to a new survey released by the Kaiser Family Foundation and The Commonwealth Fund. The Kaiser/Commonwealth 1997 National Survey of Health Insurance also finds that as a result of being currently or recently uninsured, many working-age adults and their families face barriers to getting or paying for needed health care.

“This survey serves as a reminder that the problems of the working uninsured are still with us,” said Drew Altman, President of the Kaiser Family Foundation. “The low-wage working uninsured deserve special attention when the country considers the next incremental step in expanding health insurance coverage.”

1347-fig1.gif

Going without health coverage is not a matter of choice for most of the uninsured. About half (51%) of all uninsured adults report that they do not have insurance because they cannot afford it. Another quarter (25%) say they do not have health insurance because they lost their job or their employer does not offer benefits. Only 4% are uninsured because they have poor health or were denied health benefits.

Families with incomes below the median U.S. family income of $35,000 are most affected by lack of insurance. Three in five (59%) adults in families who earned less than $20,000 annually were uninsured or had a recent gap (sometime in the past two years) in health coverage. One-third (31%) who earned between $20,000 and $35,000 annually also were currently or recently uninsured.

The survey also finds that low-wage working families are at high risk overall. Two in five (41%) adults in working families said they had problems paying medical bills or went without needed care in the past year. More than half (56%) of adults in low-wage working families who are uninsured, and 50% of those with a recent gap in coverage, had problems with access to care or paying medical bills in the last year.

“This survey shows us that people are not uninsured because of preexisting conditions or because they opted out of coverage,” explained Karen Davis, President of The Commonwealth Fund. “Many working families simply cannot afford the high cost of health insurance premiums.”

Insurance Matters

Lack of health insurance leads directly to barriers to health care and problems paying medical bills. Nearly half of the working uninsured (48%) report difficulties with access or costs, while only 15 percent of people who had continuous coverage report these problems. The survey also finds that nearly one-quarter (24%) of uninsured adults say they had not filled a prescription they needed in the past year. One in six (17%) report that they had to change their families’ way of life significantly to pay medical bills.

1347-fig2.gif

“Many uninsured working families incur unmanageable financial burdens due to medical emergencies or serious illness, or even worse, go without health care at all,” noted Davis.

Survey respondents who had temporary gaps in health coverage and were uninsured at some point in the past two years face problems similar to those of the currently uninsured. One in five (21%) did not fill a prescription in the past year, and two in five (40%) postponed care in the past year due to costs. By comparison, about one in four of the uninsured (24%) did not fill a prescription; about half (55%) had delayed care.

Medicare Scores Highly Compared to Insurance of Working Families

In marked contrast to the situation of working families, the elderly ages 65 and over covered by Medicare are much more satisfied with their health insurance coverage. Medicare, which provides coverage for the elderly ages 65 and older, results in beneficiaries having greater access to health care and better financial protections than most low- and moderate-income working families. Despite more serious health problems, for example, only 7 percent of the elderly report problems getting health care in the past year, compared with 20 percent of all adults under age 65, and 42 percent of uninsured working-age adults. Medicare beneficiaries are also much more likely to be very satisfied with their health insurance (64%) and choice of doctors (74%) than are adults with job-based health coverage or Medicaid beneficiaries.


Methodology:

The Kaiser/Commonwealth 1997 National Survey of Health Insurance, which was conducted between November 1996 and March 1997 by Louis Harris and Associates, Inc., was designed and analyzed by staff at the Kaiser Family Foundation and The Commonwealth Fund. The survey sample consisted of 4,001 adults ages 18 and older, including 3,761 adults surveyed by telephone and 240 in-person interviews of people without telephones in their homes. The data were weighted to the March 1996 Current Population Survey for accurate representation of Americans by sex, race, age, education, and health insurance status.

The Kaiser Family Foundation, based in Menlo Park, California, is a nonprofit, independent national health care philanthropy and is not associated with Kaiser Permanente or Kaiser Industries. The Foundation’s work is focused on four main areas: health policy, reproductive health, and HIV policy in the United States, and health and development in South Africa.

The Commonwealth Fund, a New York City-based national foundation, undertakes independent research on health and social issues. Its mission is to enhance the common good by looking for new opportunities to help Americans live healthy and productive lives, and to assist specific groups with serious and neglected problems.

This press release is also available on the World Wide Web at www.kff.org or www.cmwf.org. Copies of the release and the accompanying chart pack can be ordered from the Kaiser Foundation’s toll-free publications request line (800/656-4533). Ask for document #1347.

National Survey of Americans on AIDS/HIV – Toplines/Survey

Published: Nov 29, 1997

1997 National Survey of Americans on AIDS/HIV

Public Knowledge And Attitudes About AIDS/HIV : Survey II

Princeton Survey Research Associates For The Kaiser Family Foundation

Questionnaire and National Toplines

December 4, 1997

Methodology

The 1997 National Survey of Americans on AIDS/HIV was designed by staff of the Kaiser Family Foundation and conducted for the Family Foundation by Princeton Survey Research Associates. The survey was conducted by telephone with 1,205 adults (age 18 or older) nationwide between September 17-October 19, 1997. The margin of sampling error is plus or minus 3 percentage points.

The Foundation last surveyed Americans on AIDS/HIV in December 1995. Where available trend data or information are noted. Some select questions also provide further trend information from other sources, each source is noted by an appropriate footnote reference.

Select questions were asked of a random half of the respondents. These questions are identified by “Form 1” or “Form 2,” indicating which half answered that particular question. There were 598 respondents in the “Form 1” group and 607 respondents in the “Form 2” group. The margin of error for this split sample is plus or minus 4 percentage points.

National Topline

1. My first question is… What do you think is the most urgent health problem facing this nation today? (Open-end. Do not read answer categories. Wait for reply before probe) Is there another health problem you think is almost as urgent?

Current 12/95 1/901 38 AIDS 44 49 38 Cancer 27 31 21 Health insurance/access/cost 25 13 16 Heart 11 na2 5 Drugs 4 17 3 Smoking/Cigarettes na na 2 Elderly 4 12 2 Excess weight/Obesity na na 2 Diabetes *3 na 14 Other 15 na 8 Don’t know/Refused 8 9

Total exceeds 100% due to multiple responses.

2. Now I’d like you to think about the way the problem of AIDS is affecting this country today. Do you think the problem of AIDS is about the same as it has been, that the country is making progress in this area, or that the country is losing ground?

Based on form 1 respondents.

Current 12/95 3/944 14 About the same 15 22 52 Country making progress 32 23 27 Country losing ground 48 49 7 Don’t know/Refused 5 6 100 100 100

3. Thinking about the way AIDS is affecting your local community today, is the problem of AIDS about the same as it has been, is your community making progress, is your community losing ground, or has AIDS never been a problem in your community?

Based on form 1 respondents.

Current 12/95 19 About the same 23 14 Community making progress 11 11 Community losing ground 18 41 Never been a problem 38 15 Don’t know/Refused 10 100 100

4. Now I’d like you to think about the way the problem of AIDS is affecting this country today. Do you think AIDS is a more urgent problem for the country than it was a few years ago, is it a less urgent problem, or is it about as urgent as it was?

Based on form 2 respondents.

48 More urgent 12 Less urgent 38 About as urgent 2 Don’t know/Refused 100

5. Thinking about the way the problem of AIDS is affecting your local community today, do you think AIDS is a more urgent problem for your community than it was a few years ago, is it a less urgent problem, is it about as urgent as it was, or has AIDS never been a problem in your community?

Based on form 2 respondents.

25 More urgent 9 Less urgent 28 About as urgent 25 Never been a problem 13 Don’t know/Refused 100

6. How serious a problem do you think AIDS is for people you know? For people you know, do you think AIDS is…(read)

Current 12/95 34 A very serious problem 43 19 A somewhat serious problem 17 17 Not too serious a problem, or 15 25 Not a serious problem at all? 22 5 Don’t know/Refused 3 100 100

7. Bearing in mind the different ways people can be infected with H-I-V, the virus that causes AIDS–how concerned are you, personally, about becoming infected with HIV? Are you…(read)

Current 12/95 5/915 24 Very concerned 22 27 17 Somewhat concerned 18 21 21 Not too concerned, or 22 22 38 Not at all concerned? 38 30 * Don’t know/Refused * * 100 100 100

8. Are you more concerned about becoming infected with HIV than you were a few years ago, less concerned, or about as concerned?

27 More concerned 24 Less concerned 47 About as concerned 2 Don’t know/Refused 100

9. Do you, yourself, have any sons or daughters aged 21 years or younger?

43 Yes 57 No * Don’t know/Refused 100

10. How concerned are you about a son or daughter becoming infected with HIV? Are you…(read)

Based on parents of children aged 21 or younger.

Current 12/95 52 Very concerned 53 21 Somewhat concerned 24 16 Not too concerned, or 10 11 Not at all concerned 11 * Don’t know/Refused 2 100 100 (n=541) (n=666)

11. Are you more concerned about a son or daughter becoming infected with HIV than you were a few years ago, less concerned, or about as concerned?

Based on parents of children aged 21 or younger.

46 More concerned 9 Less concerned 44 About as concerned 1 Don’t know/Refused 100 (n=541)

12. Do you think AIDS is a major threat to public health in this country today, or is not a major threat to public health?

83 Major threat 14 Not a major threat 3 Don’t know/Refused 100

13. I’m going to read a list of groups in your local community. For each one, please tell me how much you think they are doing to help fight against AIDS. As far as you know, how much are (insert first item — rotate) doing to help fight against AIDS? Is this group doing a lot, some, only a little or nothing at all? How much do you think (insert next item — rotate) are doing?

Based on form 1 respondents.

A lot Some Only a little Nothing at all DK/Ref. a. Local church or religious leaders 18 29 24 12 17 =100 b. Local government and political leaders 11 34 30 13 12 =100 c. Local public schools 23 34 20 6 17 =100 d. Local health care providers, such as doctors, health clinics and hospitals 38 32 12 4 14 =100

14. And how about those outside of your local community . . . As far as you know, how much is (insert items in order) doing to help fight against AIDS– a lot, some, only a little or nothing at all?

Based on Form 1 respondents.

A lot Some Only a little Nothing at all DK/Ref. a. Your state government 15 43 24 6 12 =100 b. President Clinton 21 39 21 8 11 =100 c. The federal government 20 42 23 6 9 =100

15. I’m going to read a list of groups in your local community. For each one, please tell me your impression of how much this group cares about the fight against AIDS and makes it a priority. First, what about… (insert first item — rotate)–is it your impression that they care a lot about the fight against AIDS, some, only a little or not at all? How much do you think (insert next item — rotate) care?

Based on form 2 respondents.

A lot Some Only a little Nothing at all DK/Ref. a. Local church or religious leaders 39 34 15 5 7 =100 b. Local government and political leaders 17 42 27 8 6 =100 c. Local public schools 44 31 12 4 9 =100 d. Local health care providers, such as doctors, health clinics and hospitals 59 25 7 3 6 =100

16. And what is your impression of how much those outside of your local community care about the fight against AIDS and make it a priority . . . (First/Next) (insert items in order)–do you think (it/he) cares a lot about the fight against AIDS, some, only a little, or not at all?

Based on form 2 respondents.

A lot Some Only a little Nothing at all DK/Ref. a. Your state government 22 53 19 3 3 =100 b. President Clinton 31 39 16 7 7 =100 c. The federal government 21 47 22 5 5 =100

Return to top

1997 National Survey of Americans on AIDS/HIV:Press Release Survey Part One Part Two Part Three Part Four Part Five Chart Pack

Overview of Medicaid Managed Care Provisions in the Balanced Budget Act of 1997

Published: Nov 29, 1997

This report describes the new legal and policy framework within which the shift of state Medicaid programs from fee-for-service to managed care will take place over the next few years.

Overview of Medicaid Managed Care Provisions in the Balanced Budget Act of 1997 – Report

Published: Nov 29, 1997


Overview of Medicaid Managed Care Provisions in the Balanced Budget Act of 1997

Prepared by Andy SchneiderThe Center on Budget and Policy Priorities

for The Kaiser Commission on the Future of Medicaid

December 1997

This paper was prepared for The Kaiser Commission on the Future of Medicaid with support from The Henry J. Kaiser Family Foundation. The views represented in this report are those of the author and do not necessarily represent the views of The Kaiser Commission on the Future of Medicaid.

Contents

Overview

  1. Summary
  2. Medicaid Managed Care: An Overview
  3. Statutory Pathways to Mandatory Medicaid Managed Care
  4. Standards for State Contracting with Medicaid MCOs
  5. Payment Rates for Medicaid MCOs
  6. Organizational Qualifications for Medicaid MCOs
  7. Access and Quality Standards for Medicaid MCOs
  8. Beneficiary Protections
  9. Accountability of Medicaid MCOs for Compliance with State and Federal Standards
  10. Primary Care Case Management Option and Rural Beneficiaries
  11. Implications for Safety Net Providers

Conclusion

Appendices:

A. Standards for State Contracts with Medicaid MCOs

B. Index to Statutory Provisions Relating to Medicaid Managed Care

Overview of Medicaid Managed Care Provisions in the Balanced Budget Act of 1997

The Balanced Budget Act of 1997 (P.L. 105-33) dramatically expands the authority of state Medicaid agencies to provide covered health care services through managed care organizations (MCOs). The Act enables states, without obtaining waivers from the Secretary of Health and Human Services, to require most Medicaid beneficiaries to enroll in MCOs that do business only with the Medicaid program. It also allows states, again without obtaining waivers, to limit the number of participating Medicaid MCOs. These provisions are likely to have a major effect on access to covered hospital and physician services by low-income women and children and other Medicaid beneficiary populations.1 The implications of these provisions for beneficiaries, for states, for “safety net” hospitals and clinics, and for MCOs are the focus of this analysis. The budgetary and policy context in which these changes were enacted is discussed elsewhere.2

1. Summary

The Balanced Budget Act did not launch the shift of Medicaid from fee-for-service to managed care. That transition has been under way for several years, prompted largely by state efforts to restrain Medicaid expenditure growth and nurtured by federal waivers.3 A recent Urban Institute analysis finds that between 1991 and 1996, enrollment of Medicaid beneficiaries in managed care nationally grew from 9.5 percent to 40.1 percent of total Medicaid enrollment.4 Even before passage of the Balanced Budget Act, CBO projected that, between fiscal years 1996 and 2002, federal matching payments to Medicaid MCOs would increase, on average, more than 15 percent annually, from $7 billion, or 11 percent of federal spending on Medicaid benefits, to $17 billion, or 14 percent.5

What the Balanced Budget Act has done is to alter fundamentally the managed care policy options available to states under the federal Medicaid statute. In the past, states that wanted to require Medicaid beneficiaries to enroll in MCOs that do business mainly or exclusively with Medicaid had to obtain a waiver from the Secretary of Health and Human Services (HHS). Under the Balanced Budget Act, they will now be able to do so without seeking a waiver. State managed care initiatives currently rely heavily on the use of mostly Medicaid MCOs. In 1996, for instance, 7.7 million Medicaid beneficiaries were enrolled in 355 fully capitated managed care plans in 35 states, according to a recent analysis by Mathematica Policy Research. Of these, 3.6 million, or 48 percent, were in 156 managed care plans in which Medicaid beneficiaries accounted for more than 75 percent of total enrollment.6 The Balanced Budget Act gives states the flexibility to rely more heavily on MCOs that primarily or exclusively enroll Medicaid beneficiaries. These could include MCOs that are for-profit, MCOs that are owned by non-profit or public “safety net” providers, as well as MCOs specializing in particular services like mental health.

Under the Act, states that want to limit Medicaid beneficiaries living in urban areas to a choice between two MCOs can do so without seeking a waiver from the Secretary of HHS. States can also restrict beneficiaries living in rural areas to a single MCO. In either case, all the MCOs that a state allows to participate may do business primarily or exclusively with Medicaid. For this purpose, the managed care plans with which the state contracts can be fully capitated – that is, at financial risk for providing hospital, physician, and other covered services to Medicaid beneficiaries – or a primary care case manager (PCCM), which does not assume financial risk for the provision of covered hospital services.

This new authority translates into additional bargaining power for state Medicaid programs vis-a-vis managed care plans. States can use this leverage to obtain more favorable rates from participating plans and to limit participants to those that demonstrate the highest levels of quality in services provided. However, this bargaining power can also raise the financial rewards to winning MCOs substantially, by limiting competition, thus giving each MCO a far larger market share and a heftier revenue stream. The Medicaid managed care business can be extremely lucrative.7 The potential for favorable results in the Medicaid market has attracted venture capital firms, where, as a rule of thumb, the expected rate of return is roughly one and one-half to three times the normal market rate of return.8 This venture capital will help finance new entrants into the Medicaid managed care market as well as the expansion of firms already participating.

One attraction of Medicaid managed care as an investment opportunity is that the conversion of Medicaid beneficiaries into mandatory MCO enrollees creates large monthly flows of capitation payments. An MCO with a mandatory enrollment of, say, 30,000 Medicaid-eligible women and children at an average capitation rate of $90 per month will realize a monthly cash flow of $2.7 million and annual revenues of $32.4 million without accounting for interest. The prospect of such large revenue streams — and the potential returns to be realized in the Medicaid managed care business — are likely to prove highly attractive in many states. As new entrants seek to acquire market share and incumbent plans attempt to protect or expand their existing positions by bringing financial and other resources to bear, the state Medicaid contracting process requires careful monitoring to assure its integrity.

The Medicaid managed care business is not always financially rewarding. There is considerable variation from state to state in the Medicaid payment and regulatory policies toward MCOs. This in turn produces variations in the attraction of Medicaid as a business proposition for managed care plans. A recent review of Medicaid managed care in the trade press indicates that some investor-owned MCOs have either halted new Medicaid enrollment or withdrawn from the Medicaid market altogether in a number of states, including Arizona, Illinois, New York, Ohio, Oregon, and Tennessee. The article attributes this trend primarily to low Medicaid payment rates.9

The Balanced Budget Act alters the statutory options available to states with respect to Medicaid managed care, but it does not change the sometimes conflicting interests of states in pursuing this policy path. On the one hand, states have an interest in ensuring that their low-income families have access to basic health care services. Medicaid managed care, when properly implemented, can improve both the accessibility and quality of basic health care services for Medicaid beneficiaries, particularly in those communities in which the quality and continuity of fee-for-service care are substandard.

On the other hand, states want to limit their Medicaid expenditures. The shift from fee-for-service to managed care enables them to curb Medicaid spending on a per beneficiary basis without formally and publicly narrowing the benefits package that they offer under their Medicaid programs. States also have an interest in limiting per beneficiary payments to MCOs and allowing the MCOs to narrow the covered services enrollees actually get. How these sometimes conflicting interests are resolved will vary from state to state.

This analysis describes the new legal and policy framework within which the shift of state Medicaid programs from fee-for-service to managed care will take place over the next few years. The analysis does not duplicate section-by-section summaries of the Balanced Budget Act’s Medicaid managed care provisions.10 Instead, it focuses on those provisions that are likely to have the most influence in shaping the transition to managed care and its impact on Medicaid beneficiaries:

  • standards relating to state procedures for contracting with MCOs,
  • standards for MCO organizational qualifications,
  • standards relating to Medicaid payment rates for MCOs,
  • standards relating to accessibility and quality of care in MCOs,
  • beneficiary protections,
  • accountability of MCOs for compliance with these standards, and
  • provisions affecting safety net providers.

The interpretation of many of these provisions here is necessarily preliminary, since as of December 19, 1997, the Health Care Financing Administration (HCFA) has issued administrative guidance to the states or to MCOs with respect to only some of these amendments.11

2102-pix_black.gif

Endnotes

1. CBO, Budgetary Implications of the Balanced Budget Act of 1997, August 12, 1997. CBO does not attribute any federal savings to these provisions. In CBO’s view, the only budget effect of the legislation’s Medicaid managed care provisions is to increase federal spending somewhat ($0.1 billion over five years and $0.3 billion over ten) due to the requirement that Medicaid MCOs pay for hospital emergency visits whenever a “prudent layperson” would seek emergency care. 2. Andy Schneider, Overview of Medicaid Provisions in the Balanced Budget Act of 1997, P.L. 105-33, Center on Budget and Policy Priorities, Revised, September 8, 1997. www.cbpp.org/908mcaid.cfm. 3. For a detailed state-by-state survey of the scope of Medicaid managed care, see Jane Horvath et al., Medicaid Managed Care: A Guide for States, 3rd Edition, National Academy for State Health Policy, January 1997 4. Stephen Zuckerman, Alison Evans, and John Holahan, Questions for States as They Turn to Medicaid Managed Care, Urban Institute, August, 1997. 5. CBO Memorandum, Behind the Numbers: An Explanation of CBO’s January 1997 Medicaid Baseline, April 1997, p. 9. 6. Suzanne Felt-Lisk and Sara Yang, “Changes in Health Plans Serving Medicaid, 1993-1996,” Health Affairs, September/October 1997, at 127. 7. A recent report on a Medicaid-only MCO operating in Philadelphia found that between 1989 and 1996, the organization had generated pretax profits of $119 million (a return of 7,600 percent on a $200,000 investment, according to a 1994 audit), and had paid its four founders a total of $26.8 million in bonuses. Craig McCoy and Karl Stark, “An HMO Finds Lots of Money in Poverty,” Philadelphia Inquirer, August 3, 1997. A recent review of a Medicaid MCO contract by the HHS Inspector General found that one contractor realized a profit of $22.9 million over a three-year period, exceeding the IG’s “benchmark for reasonableness” by $4 million. Office of Inspector General, Department of Health and Human Services, State of Wisconsin’s Medicaid Managed Care Program Financial Safeguards, February 1997, p. 3. 8. For example, venture capital firms have invested $38 million in Americaid Community Care, which targets the Medicaid market in large urban areas like Houston and Chicago. A managing partner of Acacia Venture Partners of San Francisco, which has invested $5.5 million in Americaid, believes that Medicaid is “an exciting market, one largely ignored by the large, commercial HMOs.” Debra Gordon, “Virginia Beach-based HMO Takes the Medicaid Gamble,” The Virginian-Pilot, July 26, 1997. 9. The article quotes a health stock analyst as follows: “States have gotten reckless in cutting rates because they couldn’t care less about the Medicaid population. Only the worst HMOs, those that desperately need Medicaid will stay in.” Harris Meyer, “Medicaid: States Serve Up a Real Turkey,” Hospitals and Health Networks, November 20, 1997, p. 22. 10. For a summary section-by-section overview, see Sara Rosenbaum and Julie Darnell, A Comparison of the Medicaid Provisions in the Balanced Budget Act of 1996 (P.L. 105-33) With Prior Law, Kaiser Commission on the Future of Medicaid, September 1997. For a detailed section-by-section analysis, see National Health Law Program, National Center for Youth Law, National Senior Citizens Law Center, and Center for Medicare Advocacy, The Balanced Budget Act of 1997 – Reshaping the Health Safety Net for America’s Poor, October 1997 at www.healthlaw.org. 11. This guidance currently takes the form of letters to state Medicaid Directors. Copies are available on the HCFA Website, www.hcfa.gov/medicaid/bbahmpg.cfm.

pix_black.gif

Return to top

Overview of Medicaid Managed Care Provisions in the Balanced Budget Act of 1997

Report Part One Part Two Part Three Part Four Part Five Part Six Part Seven Part Eight


National Survey of Americans and Health Care Providers on Emergency Contraception

Published: Nov 29, 1997

1997 Kaiser Family Foundation Survey of Americans on Emergency Contraception

Conducted for the Henry J. Kaiser Family Foundation By Princeton Survey Research Associates

Topline For Men

May 13-May 26, 1997

Introduction:

Hello, my name is _____, and I’m calling from Princeton Survey Research of Princeton, New Jersey. We are conducting a confidential national opinion survey about some important health issues.

N = 300 men, age 18-44 Margin of error: plus or minus 5 percent * Men were asked a subset of the women’s questions.

1. My first question is, In general, how would you describe your own health? Is it excellent, good, only fair, or poor?

35Excellent55Good7Only fair3Poor*Don’t know0Refused100 2. These next few questions are about your own sexual behavior. Please keep in mind that all of your answers are confidential. First, have you had sexual intercourse within the last six months?

82Yes17No0Gay (Vol.)*Don’t know1Refused100 3. Have you ever had sexual intercourse?

Based on those who have not had sexual intercourse within the last six months (n=55)

76Yes24No0Gay (Vol.)0Don’t know0Refused100 4. Do you have a partner who is currently pregnant or trying to get pregnant?

Based on those who have had sexual intercourse within the last six months (n=245)

15Yes85No*Gay (Vol.)0Don’t know*Refused100 5. Have you or your partner, if you have one, been sterilized, or have any condition that makes it impossible for your partner to ever get pregnant? (Birth Control Devices Not Included)

Based on those who have had sexual intercourse within the last six months and whose partners are not pregnant or trying to get pregnant (n=210)

25Yes73No0Gay (Vol.)1Don’t know1Refused100 6. When you have sexual intercourse, how often do you and your partner use birth control or do anything else to try to prevent pregnancy? Would you say … (Read)

Based on those who have had sexual intercourse within the last six months, whose partners are not pregnant or trying to get pregnant, and who are able to conceive (n=166)

12Never8Only sometimes,19Most of the time, or59All of the time use birth control?0Don’t know (Do Not Read)2Refused (Do Not Read)100 7. I am going to read a list of birth control methods. We are interested in which of these methods you use most often. Please tell me which of these you or your most recent partner use by saying “yes” when I mention it. You can say “yes” to more than one type of birth control if you currently use more than one method at the same time. Here’s the list. (Read 1 – 10 In Order. Record Up To Three Mentions. If Respondent Has More Than One Current Partner, Ask About His Main Partner.)

Based on those who have had sexual intercourse within the last six months, whose partners are not pregnant or trying to get pregnant, who are able to conceive, and who use birth control at least sometimes (n=143)

71Condoms60Birth control pills4A diaphragm or cervical cap1An IUD, or intrauterine device7Depo-Provera, or contraceptive shots1Norplant, or contraceptive implants9Spermicides, or foams and suppositories with spermicides10The rhythm method, or having sex only during the safe time of the month18Withdrawal or “pulling out”2Refused (Do Not Read)1Some other method? (Specify)20Don’t know0Refused 8. If a woman has just had sex and thinks she might become pregnant, is there anything she can do in the next few days to prevent the pregnancy? (Accept Multiple “Yes” Responses)

21Yes, there is something (Unspecified)*Yes, there is something — RU-486/French abortion pill (Vol.)2Yes, there is something — birth control pills (Vol.)3Yes, there is something — morning-after pills (Vol.)1Yes, there is something — emergency contraceptive pills (Vol.)1Yes, there is something — other (Specify)34No, there is not anything1Too late to prevent pregnancy (Vol.)38Not sure/Don’t know*Refused9. What could she do in the next few days to prevent the pregnancy? (Do Not Read. Record Only One Response.)

Based on respondents who said yes to Q8 but did not specify a method (n=60)

19Take morning-after pills2Take emergency contraceptive pills15Take birth control pills11Take RU-486/French abortion pill0Insert an IUD6Get an abortion15Other32Not sure/Don’t know (Do Not Probe)0Refused100 10. Have you ever heard of emergency contraceptive pills? (Accept Multiple “Yes” Responses)

Based on those who did not mention emergency contraceptive pills for Q8 or Q9 (n=298)

19Yes, have heard of it (Unspecified)2Yes, is RU-486 (Vol.)2Yes, is birth control pills (Vol.)1Yes, it is the same thing as morning-after pills (Vol.)*Yes, is other (Specify)76No, have not heard of it*Not sure/Don’t know0Refused

Return to top

1997 Kaiser Family Foundation Survey of Americans on Emergency Contraception Survey Part Four Part One Part Two Part Three Part Five Press Release Report

Legislative Summary: State Children’s Health Insurance Program

Published: Nov 29, 1997

This Fact Sheet summarizes eligibility, benefits and cost-sharing, and financing rules of the State Children’s Health Insurance Program as well as other child-related Medicaid provisions from the Balanced Budget Act of 1997.

Survey of Consumer Experiences in Managed Care – News Release

Published: Oct 31, 1997

New Survey Offers Insight Into Experiences of Managed Care Consumers

Majority of Sacramento Managed Care Consumers Report No Difficulty with Their Plan, But Over a Quarter Had Problems

For Immediate Release:Wednesday, November 19, 1997

Contacts:Heather Balas,Kaiser Family Foundation, (650) 854-9400

Katie Salvas,Sierra Health Foundation, (916) 922-4755

Magdalena Beltran-del Omo,The California Wellness Foundation, (818) 589-6600

Lauren Schaefer,Health Rights Hotline, (916) 551-2147

Medicaid Beneficiaries Report Highest Rate of Difficulty

Sacramento, California — Much national attention is currently focused on managed care issues, with a Presidential advisory commission considering a “bill of rights” for health care consumers and California policy-makers awaiting recommendations from a managed care task force. A new Survey of Consumer Experiences With Managed Care conducted in the Sacramento, California area – a region with one of the highest rates of managed care enrollment in the country – may help inform state and national debates about managed care regulation, offering new insight into difficulties people have with health plans and how they go about resolving them.

The survey finds that the majority of Sacramento managed care consumers cited no difficulties with their health insurance in the previous year, but that more than a quarter (27%) reported some problems. Of those managed care consumers experiencing problems, the most commonly reported difficulties included:

  • Delay or denial of care or payment (42%), such as disputes over coverage, delays or denials in authorization for care, and disagreement over the scope of benefits covered by the plan.
  • Limited access to physicians (32%), such as difficulty getting an appointment or limited access to specialists.
  • Concerns about quality of care (11%), including perceived problems with inappropriate or inadequate treatment, facilities, or diagnoses, or with obtaining test results.

The report found that consumers did not appear to know of the availability of existing resources, particularly from state agencies. Of the 1,014 managed care consumers in the survey who reported difficulties – of whom many had major problems unresolved after over two months – only four individuals reported calling either the California Departments of Corporations or Insurance for assistance or to complain. A total of 2% of consumers with difficulties contacted any state or local agency.

Thirty-eight percent contacted their health plan and 37% contacted their doctor, while a quarter took no action. (32% used two or more resources.) Of those who took no action, 26% didn’t think it would do any good, 24% thought it was not worth the time, and 14% did not know what to do.

About the same number of consumers resolved their difficulty relatively quickly as those whose problem took two months or longer to settle. Over a third of consumers (36%) resolved their difficulty in less than a month, while 13% achieved resolution in one to two months. Another 13% took two months or longer to resolve their problem, and 35% had not resolved their problem at the time of the interviews. (Almost three-fourths of unresolved problems were at least two months old.)

The survey was conducted to provide baseline information for a multi-year evaluation of a pilot consumer assistance program, the Health Rights Hotline, funded by the Kaiser Family Foundation, Sierra Health Foundation, and The California Wellness Foundation with initial support of $1.6 million for the first two years of the project. The program is the largest test of an independent assistance program for consumers in managed care in the nation. Over the next three years, additional data on cases handled by the Health Rights Hotline and a full-scale evaluation of its effectiveness will be conducted.

Len McCandliss, president of Sierra Health Foundation, said, “With over 90% of privately insured Sacramentans enrolled in managed care, the community has long been considered an HMO ‘laboratory.’ We believe that very soon practically every community in the nation will resemble Sacramento in terms of managed care prevalence.”

Medicaid and Medicare

Low-income people enrolled in managed care through Medicaid (called Medi-Cal in California) experienced the highest rate of difficulty (42%). People insured through Medicare managed care (who account for 45% of all elderly and disabled Medicare beneficiaries in Sacramento county) experienced the lowest rate of difficulty (17%).

Reported Consequences of Difficulties

To provide information about the severity of the difficulties consumers experienced, the survey asked people several questions about the consequences they attributed to their difficulties (as opposed to the consequences of any underlying health condition). Of the 27% of people who reported a difficulty with their health plans:

  • 30% attributed a personal financial loss to the difficulty, including 12% who reported a financial loss of greater than $200.
  • 31% attributed time lost from work, school, or other major activity to the difficulty, including 16% who reported losing two days or more.
  • About one in ten (11%) reported experiencing a worsening of a health condition or developing a new condition as a result of the difficulty.

“Quality health care has to work for patients,” said Gary Yates, president and CEO of The California Wellness Foundation. “These results show that while the majority of consumers reported no problems with their care, we must strive to make the system work for everyone. We see that even consumers with long-term continuity and familiarity with managed care have experienced difficulties.”

Consumer services

Most consumers said they would have used the services of an independent group to resolve their difficulty, had the option been available. The most popular requests were: a mechanism for lodging a complaint to prevent future problems for others (66%); information about consumer rights (62%); referral to other resources (60%); and assistance in understanding their health plan’s policies and procedures (54%).

“At a time when people across the country are complaining about managed care, this project is trying to find solutions,” said Drew Altman, president of the Kaiser Family Foundation, referring to the Health Rights Hotline. “It is the leading community-based effort in the nation giving people concrete help for their health plan problems.”


Methodology

The Survey of Consumer Experiences in Managed Care was developed and analyzed by the Lewin Group of Fairfax, Virginia. The survey was administered by Survey Methods Group, Inc., of San Francisco, California. Screening interviews were conducted in June and August, 1997 with representatives from 4,419 Sacramento households contacted at random by phone. Of these 3,768 were managed care consumers, upon whom survey results were based. For Medicare and Medicaid beneficiaries, managed care enrolles were identified based on the names of their plans. Since traditional fee-for-service coverage is virtually non-existent in the Sacramento area, all privately insured people were categorized as being in managed care. The margin of error is +/- 3% for most questions. These findings are preliminary; a final report will be released at a later date.

Additional information, including a complete copy of this preliminary report, can be obtained by calling the Kaiser Family Foundation’s toll-free publication request line at 800-656-4533 and requesting document #1344.

The Kaiser Family Foundation, based in Menlo Park, California, is a nonprofit, independent national health care philanthropy and is not associated with Kaiser Permanente or Kaiser Industries. Sierra Health Foundation, located in Sacramento, supports health and health-related activities in Northern California. Based in Woodland Hills, The California Wellness Foundation’s mission is to improve the health and wellness of the people of California.

Health Rights Hotline

The Survey of Consumer Experiences in Managed Care was conducted as part of a broader program to support and evaluate the Health Rights Hotline, a free, independent source of information and assistance for health care consumers in California’s El Dorado, Placer, Sacramento, and Yolo counties. The Health Rights Hotline, which began providing services in June 1997, is the first program of its kind in the nation to assist consumers regardless of the type of health plan they have and regardless who pays for care – whether an employer, individual, Medicare, Medi-Cal, or CHAMPUS. The Health Rights Hotline – a program of the Center for Health Care Rights in Los Angeles – is funded for a four-year pilot period to:

  • improve consumers’ access to health care by educating and assisting them to be responsible, informed, and empowered;
  • improve the health care system in the four-county Sacramento area by collecting and analyzing information on the types of issues consumers face, and providing feedback to health plans, health care providers, purchasers, regulators, and the public regarding consumers’ experiences; and
  • test this program as a model for other consumer-oriented programs in California and the nation.

“The survey results point to the role that independent consumer assistance organizations like the Health Rights Hotline can play in helping consumers navigate an often confusing system,” noted Peter Lee, Health Rights Hotline Project Director.

The Health Rights Hotline is open 9 a.m. to 6 p.m., and can be reached toll-free by consumers in the four-county service area at (888) 354-4474 or (916) 551-2100.

Medicaid Facts: Medicaid’s Role for Children – Fact Sheet

Published: Oct 30, 1997

In 1995, 17.5 million children — one-quarter of all children under age 18 — had Medicaid coverage for health care services. Medicaid, the federal/state health program for the poor, pays for a broad range of services for children including well-child care, immunizations, prescription drugs, doctor visits, and hospitalization, and a range of long-term care services for children with disabilities.

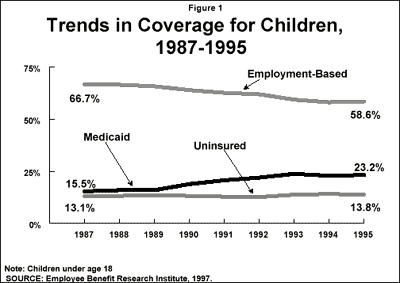
Medicaid plays a particularly strong role for low-income children, covering two-thirds (64%) of all poor children and a quarter( 27%) of children with incomes between 100% and 199% of the federal poverty level (FPL). While employer-based insurance coverage of children declined from 1987 to 1995, expansions in Medicaid have resulted in greater coverage of children in low-income families (Figure 1). During this same period, Medicaid enrollment grew from about 10 million — 15.5% of all children — to 17.5 million children (23.2%).

Despite the importance of Medicaid today, about 10 million children are uninsured. Lack of insurance is particularly high among low-income children. Seventy percent of uninsured children are in families with incomes below 200% of poverty. The new State Child Health Insurance Program, enacted as part of the Balanced Budget Act of 1997, is intended to provide coverage to this group.

2078-img1.gif

Eligibility

Being poor does not automatically qualify a child for Medicaid. In the past 15 years, Medicaid eligibility for children has been broadened considerably through federal legislation and state optional expansions. Prior to 1986, Medicaid primarily served children who received AFDC cash assistance. Today, children qualify for Medicaid based on their age and income.

Medicaid coverage is especially prominent among young children, covering 33% of infants and 29% of children ages 1 to 5. Because recent expansions focused on young children, older children are less likely to qualify for Medicaid. Medicaid covers 22% of children between the ages of 6 to 12 years and 17% of teens between the ages of 13 to 18 years.

Medicaid Coverage of Children:

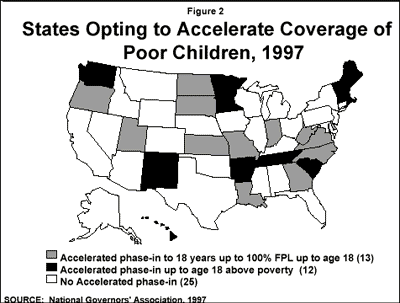
States are mandated to cover certain groups of children based on age and income criteria. By 2002, all states will be required to have phased-in coverage of children under age 19 with incomes below poverty. States can choose to expand Medicaid eligibility beyond federal minimum standards by raising age and income levels for children (Figure 2). They can also use Section 1115 research and demonstration waivers to broaden eligibility. In total, 41 states have expanded Medicaid coverage to children in one or more age or income levels. Federal coverage requirements for children are as follows:

  • Up to age 6 with family incomes up to 133% FPL. For infants, 35 states have chosen to expand coverage beyond 133% FPL and 13 have expanded for children age one to six.


  • Age 6 to 14 with family incomes below 100% FPL. Fifteen states have opted to expand eligibility beyond 100% FPL.
  • Age 15 to 19 if family income meets the AFDC criteria of August 1996 (state average is 41% of FPL) with coverage phased-in for poor children born before 9/30/83. 25 states have opted to accelerate this phase-in to cover older children up to age 18 with income below 100% FPL (Figure 2).
  • Children with disabilities also qualify for Medicaid assistance on the basis of SSI eligibility. Medicaid covers about 1 million additional children with physical or mental disabilities.


2078-img2.gif

Because states established varied Medicaid income eligibility levels for children, and because of state variations in per capita income there is considerable variation in Medicaid coverage, ranging from 13% of children in Colorado to 47% in West Virginia. Similarly, Medicaid pays for 39% of all births nationally, but coverage varies from 21% of births in Massachusetts to 61% in Georgia.

The Balanced Budget Act (BBA) of 1997 creates new options for states to strengthen and expand Medicaid coverage for children. The new State Children’s Health Insurance Program (CHIP) was enacted as part of the Balanced Budget Act (BBA) of 1997. This new capped federal program allocates $20.3 billion over five years in the form of a matched grant to states to expand coverage to uninsured low-income children through either a separate state program or by broadening Medicaid — or both. The funds became available on October 1, 1997 and are targeted to uninsured children under 19 with income below 200% of poverty who are not eligible for Medicaid or not covered by private insurance.

Provisions of the Balance Budget Act also included some important changes to Medicaid. It clarifies the state Medicaid option to accelerate the phase-in for children born before September 30, 1983. In addition, the new law gives states the option to extend presumptive eligibility to children, meaning that services provided to low-income uninsured children will be covered by Medicaid before the Medicaid eligibility determination process is complete. States can also offer 12 month continuous eligibility to children, regardless of any changes in family income during that period.

Services and Costs

Federal guidelines require that Medicaid cover a comprehensive set of services with nominal or no cost-sharing for children. Access to these services is important because poor children experience more health problems than more affluent children. Children with Medicaid are eligible to receive physician and outpatient services, prescription drugs, inpatient hospital care, and long-term care services.

Medicaid coverage also entitles children to early and periodic screening, diagnostic, and treatment (EPSDT) services including a comprehensive health and developmental history and physical exam, immunizations, laboratory tests including blood lead levels, and health education. Children found to have conditions requiring further attention are covered for needed treatment.

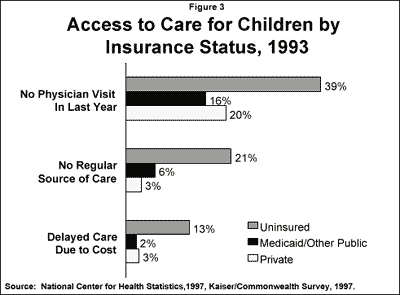
The importance of health insurance in securing access to health care services is well documented. Despite their complex health and social needs, children with Medicaid coverage have access to care that is similar to higher income privately insured children (Figure 3).

2078-img3.gif

In 1995, Medicaid spent $25.4 billion on health care services for 17.5 million children in low-income families and about $7.1 billion for one million disabled children. The majority (93%) of the expenditures for non-disabled children are for acute care services, with one third for inpatient hospital care.

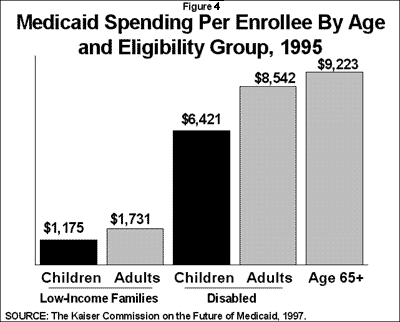
While low-income children represent half of the 35 million Medicaid beneficiaries, they account for only 16.7% of overall Medicaid spending. In 1995, Medicaid spent an average of $1,175 per low-income child enrolled in the program. On average, children cost less to care for than older Medicaid beneficiaries, but some disabled children have very costly health and long-term care needs. Medicaid spent an average of $6,421 per year per child qualifying on the basis of disability (Figure 4).

2078-img4.gif

Issues and Challenges

Expanding Coverage.

To broaden coverage of low-income uninsured children, Congress enacted the new State Child Health Insurance Program and included provisions to allow states to facilitate enrollment and continuity of coverage under Medicaid. Key issues facing state Medicaid agencies include how the new children’s program will be structured, financed, and implemented, as well as how it will be integrated with or build on the state’s existing Medicaid program.

Participation.

An estimated 3 million of the 9.8 million uninsured children are eligible for but not enrolled in Medicaid. This is largely due to enrollment barriers or lack of awareness of the program. States can streamline the eligibility process and facilitate enrollment. For example, 25 states allow mail-in eligibility applications and 29 states have dropped the asset test. Medicaid eligibility policy has also changed markedly as a result of the 1996 welfare law, which eliminated the automatic link between cash assistance and Medicaid. Ongoing and intensified outreach and educational efforts will be necessary to assure that all the children who are eligible for assistance under Medicaid are enrolled.

Managed Care.

In 1996, 40% of beneficiaries were enrolled in managed care, mostly low-income children and their parents. The BBA of 1997 expands state flexibility by allowing states to mandate Medicaid managed care enrollment without requiring states to obtain a Section 1115 or 1915(b) waiver. States will still need a waiver to mandatorily enroll special needs children, but will be able to enroll other non-disabled children. Managed care has the potential to improve access to preventive and primary care, but given the vulnerable nature of the Medicaid population, it requires careful implementation and monitoring to assure quality and access.