Participation in Welfare and Medicaid Enrollment
This paper examines Medicaid enrollment and its relation to the rise and fall of enrollment in Aid to Families with Dependent Children (AFDC) or Temporary Assistance to Needy Families (TANF) programs.
The independent source for health policy research, polling, and news.
This paper examines Medicaid enrollment and its relation to the rise and fall of enrollment in Aid to Families with Dependent Children (AFDC) or Temporary Assistance to Needy Families (TANF) programs.
Part 5
Appendix Table 1: Medicaid Eligibility Levels for Pregnant Women and Children Pregnant Women, Infants and Children(as of May 20, 1998) Other Eligibility Categories Pregnant Women and Infants Children Under Age 6 Children Ages 6 to 14 Children Ages 14 to 19 Asset Test Required for Children (4) Max. AFDC Payments (7/16/96) (5) Medically Needy, 1996 (percent of Federal Poverty Level) United States 133 133 100 45 49 Alabama 133 133 100 100 No 15 N/A Alaska 133 133 100 90 No 76 N/A Arizona 140 133 100 30 No 32 N/A Arkansas (2,3,4) (133) (200) 200 200 200 Yes 19 25 California (1) 200 133 100 100 No 56 86 Colorado (1,4) 133 133 100 37 Yes 39 N/A Connecticut 185 185 185 185 No 81 71 Delaware 185 133 100 100 No 31 N/A District of Columbia 185 133 100 37 No 37 N/A Florida (1) 185 133 100 100 No 28 28 Georgia 185 133 100 100 No 39 35 Hawaii 185 133 100 100 No 57 57 Idaho (4) 160 160 160 160 Yes 29 N/A Illinois 200 133 130 133 No 35 45 Indiana 150 133 100 100 No 27 N/A Iowa (4) 185 133 100 37 Yes 39 52 Kansas 150 133 100 100 No 40 44 Kentucky 185 133 100 46 No 49 28 Louisiana 133 133 100 17 No 18 N/A Maine 185 133 125 125 No 51 42 Maryland (2) 185 185 185 33 No 34 40 Massachusetts (1) 185 133 133 133 No 52 72 Michigan 185 150 150 150 No 45 52 Minnesota (3) 275 275 275 275 No 49 66 Mississippi 185 133 100 32 No 34 N/A Missouri 185 133 100 100 No 27 N/A Montana (4) 133 133 100 48 Yes 41 46 Nebraska 150 133 100 100 No 34 45 Nevada (4) 133 133 100 31 Yes 32 N/A New Hampshire 300 185 185 185 No 51 60 New Jersey (1) 185 133 133 133 No 41 52 New Mexico 185 185 185 185 No 36 N/A New York (1) 185 133 100 51 No 61 76 North Carolina 185 133 100 100 No 50 34 North Dakota (4) 133 133 100 100 Yes 40 47 Ohio 150 150 150 30 No 32 N/A Oklahoma 185 185 185 185 No 28 42 Oregon (4) 133 133 100 100 Yes 43 57 Pennsylvania (1) 185 133 100 37 No 39 43 Rhode Island (3,4) 250 250 250 250 Yes 51 69 South Carolina 185 150 150 150 No 18 N/A South Dakota 133 133 100 100 No 47 N/A Tennessee (3) 400 400 400 400 No 54 23 Texas (4) 185 133 100 17 Yes 17 25 Utah (4) 133 133 100 100 Yes 53 53 Vermont (3) (200) (225) 225 225 225 No 59 81 Virginia 133 133 100 100 No 22 33 Washington (185) (200) 200 200 200 No 50 62 West Virginia 150 133 100 100 No 24 27 Wisconsin 185 185 100 45 No 48 64 Wyoming (4) 133 133 100 52 Yes 55 N/A SOURCE: Center on Budget and Policy Priorities. 1998 and National Governors’ Association. 1996 and 1997. N/A: No medically needy programNote: The 1998 Federal poverty guideline for a family of three was $13,650; for Alaska $17,070 and Hawaii $15,700.(1) The state operates separate child health insurance programs for children not eligible for Medicaid. Such Programs may provide benefits similar to Medicaid or they may provide a limited benefits package and may include premiums and cost-sharing.(2) Children covered under Medicaid expansion programs in Arkansas and Maryland receive reduced benefits package pursuant to federal waivers.(3) The Medicaid programs in AR, MN, RI, TN, and VT may impose some cost-sharing-premiums and/or co-payments for some children pursuant to federal waivers.(4) The states noted count assets, in addition to income, in determining Medicaid eligibility for children; Utah does not consider assets for young children. An assets test in NOT required in Arkansas for its Medicaid expansion program.(5) The United States figure represents the median maximum AFDC payment level.
Appendix Table 2: Expansion Population Eligibility in State Medicaid Programs Operating Under Statewide Section 1115 Demonstration Waivers*State ExpansionPopulation FamilyIncomeRequire-ment ResourceRequire-ment CategoricalRequire-mentWaived Premium/Cost-Sharing EnrollmentCap Alabama Children aged 6-19 < 133% FPL N/A Change in income requirement No premium/cost-sharing No Women for 24 months post-partuma < 133% FPL Pregnancy Arizona Children up to age 14 < 100% FPL N/A Change in income requirement $1-5 copay, depending on service. No copay for prescription drugs, prenatal care, EPSDT care, nursing facility services, and primary care visits not scheduled by the patient. No Pregnant women and infants < 140% FPL N/A Change in income requirement Arkansas Children up to age 19 < 200% FPL No resource test Change in income requirement $5 copay for prescriptions, $10 copay for outpatient services, percentage copay for hospital per diem No Delaware Low-income children and adults < 100% FPL N/A Changes income requirement for children, waives requirement of pregnancy, disability, or dependent children No premium/cost-sharing No Hawaii Low-income children and adults < 300% FPL < $2,000 for single person, < $3,000 for couple Changes income requirement for children, waives requirement of pregnancy, disability, or dependent children All persons (except pregnant women) making over 100% FPL pay 100% of medical, dental, and catastrophic care premiums. Sliding payment scale for children under 200% FPL. No Kentucky No eligibility expansion Maryland No eligibility expansion Massachusetts Low-income employed < 200% FPL No resource test Dependent child, pregnancy, disability Cost-sharing on a sliding scale based on income No Low-income unemployed < 133% FPL No resource test Dependent child, pregnancy, disability Unemployed persons receiving state or federal unemployment benefits < 400% FPL No resource test Dependent child, pregnancy, disability State ExpansionPopulation FamilyIncomeRequire-ment ResourceRequire-ment CategoricalRequire-mentWaived Premium/Cost-Sharing EnrollmentCap Minnesota Pregnant women and children up to age 19 < 275% FPL No resource test Changes income requirement Premiums range from 1.5 to 8.8% gross income, $4/month premium for families with children < 150% FPL, non-pregnant adults pay 10% of inpatient hospital costs with $1,000 maximum No Planned extension to low-income adults N/A N/A Dependent child, pregnancy, disability New Jersey Low-income individuals < 200% FPL < $7,500 for individual, < $15,000 per family Dependent child, pregnancy, disability Individuals with income below 200% FPL receive fully subsidized care; individuals with income below 300% FPL receive partially subsidized care. No Low-income individuals < 300% FPL < $7,500 resources for individual, < $15,000 per family New York Home Relief population N/A Dependent child, pregnancy, disability No premium/cost-sharing No Women for 24 months post-partuma< 185% FPL Pregnancy Ohio No eligibility expansion Oklahoma No eligibility expansion Oregon Low-income children and adults < 100% FPL < $5,000 Dependent child, pregnancy, disability Cost-sharing on sliding scale for adult, non-pregnant new eligibles. No Rhode Island Pregnant women and children under age 8 < 250% FPL N/A Change in income requirement Individuals with family incomes between 185-250% FPL subject to cost-sharing requirements. No Women for 24 months post-partuma < 250% FPL Pregnancy Tennessee Uninsurable individuals N/A No resource test Dependent child, pregnancy Individuals with family incomes > 100% FPL subject to cost-sharing requirements on sliding scale based on income. Enrollment capped at 1,775,000b Persons ineligible for employer- or government-sponsored health plans No resource test Dependent child, pregnancy, disability Vermont Low-income children and adults < 150% FPL N/A Dependent child, pregnancy, disability No premium/cost-sharing *Based on data collected by the George Washington University Center for Health Policy Research. N/A indicates that this information was not clear based on the information reviewed.a. Only family planning services are covered under this extension.b. Tennessee does not cap enrollment of traditional eligibles meeting the state’s 1993 Medicaid eligibility criteria and uninsurable persons. The enrollment of uninsured persons is limited by the difference between 1,775,000 and the sum of traditional eligibles and uninsurable persons.
1 Thomas Selden, Jessica Banthin, and Joel Cohen, “Medicaid’s Problem Children: Eligible but not Enrolled,” Health Affairs. May/June 1998: 192-200.
2 Medicaid eligibility policy vis-a-vis the disabled and the elderly will be the focus of subsequent analyses.
3 See Lake Snell Perry & Associates, Barriers to Medi-Cal Enrollment and Ideas for Improving Enrollment: Findings from Eight Focus Groups with Parents of Potentially Eligible Children. Kaiser Family Foundation, September 1998.
4 See Kaiser Commission on Medicaid and the Uninsured, “Medicaid Eligibility and Enrollment Projects,” September 1998; Donna Cohen Ross, Child Health Outreach Handbook , Center on Budget and Policy Priorities, July, 1998; Sarah Shuptrine, Vicki Grant, and Genny McKenzie, Southern Regional Initiative to Improve Access to Benefits for Low-income Families with Children, Southern Institute on Children and Families, February 1998.
5 Congressional Budget Office, Behind the Numbers: An Explanation of CBO’s January 1997 Medicaid Baseline, April 1997, p. 7.
6 For detailed state-by-state data on the number and type of beneficiaries covered, see David Liska, Brian Bruen, Alina Salganicoff, Peter Long, and Bethany Kessler, Medicaid Expenditures and Beneficiaries: National and State Profiles and Trends, 1990-1995, Third Edition, Kaiser Commission on the Future of Medicaid, November 1997.
7 Statement of Bruce C. Vladeck, Administrator, Health Care Financing Administration, “1998 Budget for Medicaid and Medicare Part B” presented to the House Commerce Committee, Subcommittee on Health and Environment, February 12, 1997.
8Choices Under the New State Child Health Insurance Program: What Factors Shape Cost and Coverage? Kaiser Commission on Medicaid and the Uninsured, January 1998.
9MCH Update: State Medicaid Coverage of Pregnant Women and Children, National Governors’ Association, September 1997, www.nga.org.
10 See David Super, Sharon Parrott, Susan Steinmetz, Cindy Mann, The New Welfare Law, Center on Budget and Policy Priorities, August 14, 1996, http://www.cbpp.org.
11 For a discussion of eligibility rules relating to two-parent families, see Jocelyn Guyer and Cindy Mann, Taking the Next Step: States Can Now Take Advantage of Federal Medicaid Matching Funds to Expand Health Care Coverage to Low-Income Working Parents, Center on Budget and Policy Priorities, July 1998, www.cbpp.org.
12 63 Fed. Reg. 42270 (August 7, 1998.)
13 Jeff Harris and Jane Horvath, The Administrative Impact of the Medicaid Eligibility Resource Test, Kaiser Commission on the Future of Medicaid, April 1993.
14 Marilyn Moon, The Urban Institute, Asset Limits and Medicaid, Kaiser Commission on the Future of Medicaid, April 1993.
15 See Leighton Ku and Bethany Kessler, The Number and Cost of Immigrants on Medicaid: National and State Estimates, Urban Institute, December 1997. For a discussion of the impact of the welfare law changes on elderly legal immigrants, see Robert B. Friedland and Veena Pankaj, Welfare Reform and Elderly Legal Immigrants, Henry J. Kaiser Family Foundation, July, 1997. For a review of the options remaining to states with respect to coverage of this population through either federally-funded or state-funded programs, see Kelly Carmody, State Options to Assist Legal Immigrants Ineligible for Federal Benefits, Center on Budget and Policy Priorities, February 1998, http://www.cbpp.org.
16 Sara Rosenbaum, Medicaid and Migrant Farmworker Families: Analysis of Barriers and Recommendations for Change, National Association of Community Health Centers, 1991.
17 Guyer and Mann. July 1998.
18www.hcfa.gov/init/chip-map.cfm
19 Guyer and Mann. July 1998.
20 For a summary of the expansion populations covered by some states under section 1115 waivers, see Sara Rosenbaum and Julie Darnell, Statewide Medicaid Managed Care Demonstrations under Section 1115 of the Social Security Act: A Review of the Waiver Applications, Letters of Approval, and Special Terms and Conditions, Kaiser Commission on the Future of Medicaid, May 1997.
21 Under section 1931 of the Social Security Act, States have the option of liberalizing their financial eligibility standards for adults in one-parent and certain two-parent families by adopting “less restrictive” income or resource methodologies. They do not, however, have the option to liberalize the non-financial eligibility rules. In order to receive federal Medicaid matching funds for the coverage of childless non-disabled adults who do not meet these family composition requirements, states must obtain a waiver from the Secretary of HHS under section 1115.
22 Schoen, C., B. Lyons, D. Rowland et al, “Insurance Matters for Low-Income Adults: Results from a Five-State Survey” Health Affairs, Sept/Oct 1997.
23 Selden, Banthin, and Cohen, May/June 1998.
24 See Alina Salganicoff and Patricia Seliger Keenan, Child Health Facts: National and State Profiles of Coverage, Kaiser Commission on Medicaid and Uninsured, January 1998. Return to top
Policy Brief Part 1 Part 2 Part 3 Part 4 Part 5Library Index
How Well Does the Employment-Based Health Insurance System Work for Low-Income Families?
September 1998
Most Americans receive health insurance coverage through the workplace. Unfortunately, however, many workers are left out, especially low-wage workers and their families. Being a low paid worker does not mean just that wages are low. It also means a lower likelihood of receiving health insurance protection on the job. Low-wage workers have never been as likely as the better paid to get coverage from their employers. And, as employers try to limit what they spend on coverage, the gap is growing worse. Although recent employer actions have reduced coverage for workers at all wage levels, low-wage workers have been the hardest hit.
Medicaid has made an enormous difference to health insurance protection for low-income families. But Medicaid eligibility is limited to the poorest of the poor, especially mothers and children. Although Medicaid has been expanded in recent years to reach near-poor pregnant women and children, many low-income working families have not been eligible for coverage. Employer protection is therefore critical for workers with low and modest incomes.
The purpose of this Issue Paper is to describe the nature of employer coverage; its decline, especially among low-wage workers and low-income families; and the factors that are undermining its reach. In summary, this paper documents the following:
Low wage workers are least likely to have employer coverage.
As coverage has declined, the gap between high wage and low wage workers has grown.
The decline in coverage for low-wage workers is a function of the decline in employer offerings and participation.
Who’s Covered and Who’s Left Out? The large majority of Americans have some kind of private or public health insurance, but more than 41 million nonelderly Americans are uninsured. Since almost all Americans over age 65 are covered by Medicare, lack of insurance is primarily a problem for working age adults and for children. In 1995, about 72% of the nonelderly had private health insurance (mostly employer coverage and some private, nongroup coverage) and 12% were covered by Medicaid. Approximately 16% of the nonelderly were uninsured [Figure 1].1
Whether individuals have any insurance coverage and what kind of insurance they have are closely related to family income. Over half of the uninsured are in families with incomes below 200% of poverty. In 1995, 88% of individuals in families with incomes above 200% of poverty had private (primarily employer-sponsored) health insurance and only 11% were uninsured. Not surprisingly, health insurance coverage for poor families looks very different. Only a small proportion of poor families (with incomes below 100% of the federal poverty level) have employer coverage. A large proportion are covered by Medicaid, but a substantial proportion remain uninsured. In 1995, 55% of individuals in poor families were covered by Medicaid and only 22% had private insurance. Despite Medicaid’s substantial contribution, however, 23% of the poor lacked health insurance [See Figure 1].
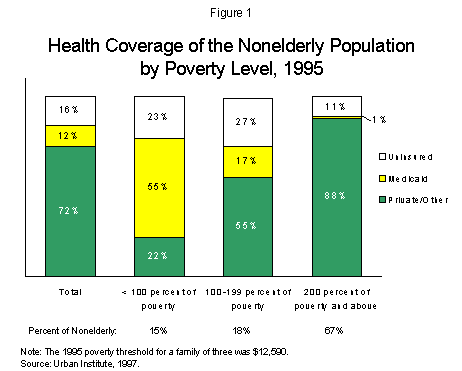
Near-poor families (those with incomes between 100-199% of poverty) are somewhat worse off than poor families with respect to health insurance coverage. Affordable private health insurance is only available to individuals in near-poor families if it is employer-sponsored. Only 55% of individuals in near-poor families had private (primarily employer-sponsored) insurance in 1995, compared to 88% of individuals in families with incomes above 200% of poverty. For certain groups, such as pregnant women and children, Medicaid has played a strong role, but Medicaid’s income and categorical restrictions result in limited coverage of the near-poor–only 17% of individuals in near-poor families had Medicaid coverage. As a result, 27% were uninsured [See Figure 1].
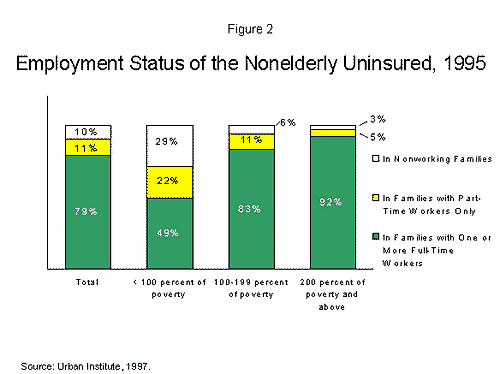
Lack of insurance does not mean that the poor and near-poor are not working. Rather, the vast majority of the uninsured are workers or are in working families. In 1995, most uninsured adults and children–79 percent–lived in families where there was at least one full-time worker. Another 11% lived in families where there was at least one part-time worker. Only 10% of the uninsured lived in families where there were no employed adults [Figure 2]. The same is true even of the poor and near-poor uninsured. Among the near-poor, the proportion of uninsured who are in full-time workers’ families (83 percent) is nearly as high as among higher income workers (92 percent). The differences in their insurance coverage are therefore not explained by substantially different levels of employment.
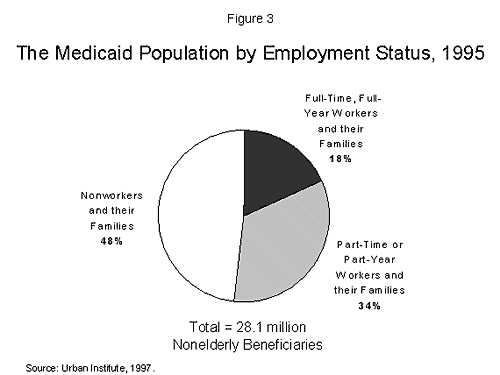
Although Medicaid’s coverage of the near-poor is limited by its eligibility criteria, many working families do qualify for Medicaid. About half of Medicaid’s nonelderly beneficiaries (low-income, working age adults and children) are in working families. In 1995, 18% of Medicaid’s nonelderly beneficiaries were in families where the family head worked full-time and full-year, while 34% were in families where at least one adult worked part-time or part-year [Figure 3].
Why Don’t Low-Income Families Have Employer Coverage?
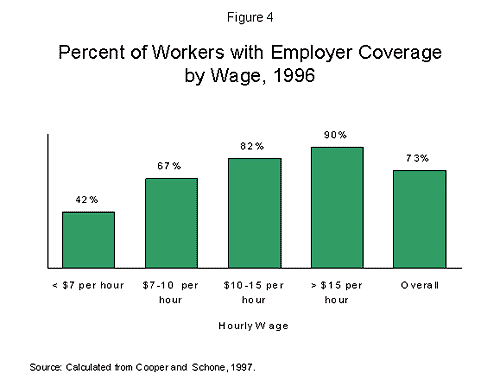
Since most of the uninsured and half of low-income adults and children with Medicaid coverage are in working families, an important question is why so many low-income working families lack employer coverage. There are a number of factors associated with jobs without health care coverage, but a key factor is low wages. Figure 4 presents data on employer coverage rates for workers differentiated by wage.2 These data show there is a strong positive relationship between wages and health insurance coverage. In 1996, 90% of workers who earned more than $15 per hour had employer coverage, while only 42% of workers who earned less than $7 per hour had employment-related health insurance.
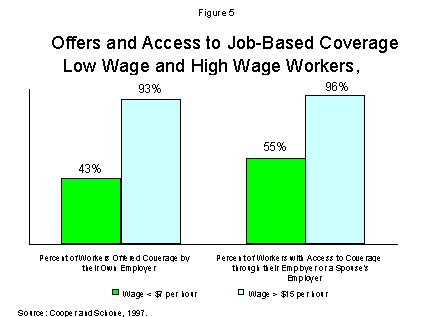
The primary problem for low-wage workers is that their employers not only pay them low wages, but they also offer them lower nonwage compensation-including health insurance and pensions.3 In 1996, only 43% of workers who earned less than $7 per hour were offered health benefits by their employer, compared to 93% of workers who earned more than $15 per hour [Figure 5].
Uninsured low wage workers, like all uninsured workers, are in large as well as small firms, and are in firms that offer coverage to none of their workers as well as firms that offer coverage to some. Although data make it difficult to distinguish precisely between these categories, an estimate from available data suggests that uninsured workers are about equally split between firms that do not offer coverage and firms that offer coverage to some workers.4
Unfortunately, many low-wage employees offered limited benefits do not have alternative access to employment-based coverage through a spouse or other family member. Even when other sources of insurance are taken into account, the gap between low and high-wage workers is still quite large. In 1996, 55% of low-wage workers had access (through their own employer or a family member’s employer) to employer coverage, compared to 96% of high-wage workers [See Figure 5].
How Well Does the Employment-Based Health Insurance System Work for Low-Income Families?Policy Brief Part 1 Part 2 Part 3
This 1998 partnership survey between KFF and Glamour explores experiences with and knowledge of STIs among men and women in the U.S.
This policy paper describes key requirements of consumer protection regulation under Medicare, Medicaid and federal and state laws as they apply to private health insurance. These include choice and availability of plans, disclosure of information, marketing, access, quality, and the grievance and appeals process. The discussion highlights differences and similarities across public programs and private insurance and compares public and private insurance protection with provisions of the Consumer Bill of Rights (CBRR) developed by the President’s Advisory Commission on Consumer Protection and Quality in the Health Care Industry.
HIPAA Compliance Strategies In California: Reforming the State’s Individual Health Insurance Market — Policy Brief
A policy brief on reform of the individual insurance market and implementation of the Health Insurance Portability and Accountability Act (HIPAA) in California. The brief is based, in part, on discussion at a California Health Policy Roundtable held in Sacramento, California on March 12, 1998.
Note: This publication is no longer in circulation. However, a copy may still exist in the Foundation’s internal library that could be reproduced. Please email order@kff.org if you would like to pursue this option.
This chartbook provides an overview of health care spending and trends in health plan enrollment. It highlights health insurance premiums and costs, health insurance benefits, the structure of the health care market. Data on the stock markets role within the health care industry and implications of health insurance trends for consumers and the safety net is also included.
Health News Index July/August, 1998
The July/August 1998 edition of the Kaiser Family Foundation/Harvard Health News Index includes questions about major health stories covered in the news, including questions about Patients’ Rights and Medicare. The survey is based on a national random sample of 1,200 Americans which measures public knowledge of health stories covered by the news media during the previous month. The Health News Index is designed to help the news media and people in the health field gain a better understanding of which health stories in the news Americans are following and what they understand about those health issues. Every two months, Kaiser/Harvard issues a new index report.
This report presents findings based upon the KPMG health benefits survey of private and public employers and explores the extent of ERISA preemption on health plans covering U.S. workers. Included is estimated data on the total number of workers covered by fully and partly self-insured health plans in 1993 and 1995, a summary of the ERISA provisions and case law dealing with health plans and an analysis of potential changes to ERISA.
Note: This publication is no longer in circulation. However, a few copies may still exist in the Foundation’s internal library that could be xeroxed. Please contact us if you would like to pursue this option.
A national survey of 800 African Americans, plus an additional general population sample of 800 Americans, examining perceptions about the media’s coverage of health issues that most concern and impact African Americans. This survey was conducted jointly by the Foundation and the National Association of Black Journalists (NABJ) for presentation at the NABJ’s annual conference being held in Washington, DC on Friday, July 31st, 1998.