Two National Surveys: Views of Americans and Health Care Providers on Medical Abortion

Published: Aug 31, 1998

Will 1999 Be The Year For Mifepristone (RU-486)?And, An Update on Women’s Other Options for Very Early Abortion

September 16, 1998

Briefing Participants:

Janet Benshoof PresidentCenter for Reproductive Law & Policy120 Wall Street, 18th FloorNew York, NY 10005Press Contact: Margie Kelly212/514-5534

Jacqueline E. Darroch, PhDSenior Vice PresidentThe Alan Guttmacher Institute120 Wall StreetNew York, NY 10005

Vanessa Northington Gamble, MD, PhDAssociate ProfessorHistory of Medicine and Family Medicine, and DirectorCenter for the Study of Race and Ethnicity in MedicineUniversity of Wisconsin-Madison Medical School1300 University AvenueMadison, WI 53706-1532608/265-5996

Elizabeth Newhall, MDPartnerEverywoman’s Health, P.C., and Medical DirectorDowntown Women’s Center401 North Graham, #445Portland, OR 97227503/284-5220

Felicia H. Stewart, MDDirector of Reproductive Health ProgramsKaiser Family Foundation2400 Sand Hill RoadMenlo Park, CA 94025Press Contact: Tina Hoff,650/854-9400, ext. 210

Carolyn Westhoff, MD, MSAssociate Professor of Clinical Obstetrics and Gynecology and Public HealthNew York Presbyterian HospitalColumbia Presbyterian CampusColumbia University630 West 168th Street, Room 16-80New York, NY 10032Press Contact: Karin Eskenazi212/305-5587

Beverly Winikoff, MDSenior Medical AssociateThe Population CouncilOne Dag Hammarskjold PlazaNew York, NY 10017Press Contact: Sandra Waldman212/339-0525

Other Resources:

Mifepristone and Methotrexate Research

Mitchell D. Creinin, MDDirector of Family Planning & Family Planning ResearchDepartment of OB/GYN & Reproductive ScienceUniversity of Pittsburgh School of MedicineMagee-Women’s Hospital300 Halket StreetPittsburgh, PA 15213-3180412/641-1440

David Grimes, MDVice President of Biomedical AffairsFamily Health InternationalPO Box 13950Research Triangle Park, NC 27709-3950919/544-7040

Richard Hausknecht, MDMedical DirectorPlanned Parenthood of New York City208 East 72nd StreetNew York, NY 10021212/369-1116

Mifepristone Clinical Trials

Lawrence LaderPresidentAbortion Rights Mobilization51 Fifth Avenue, 10th FloorNew York, NY 10003212/255-0682

Eric Schaff, MDAssociate ProfessorDepartment of Family MedicineUniversity of Rochester885 South AvenueRochester, NY 14620716/442-7470

Methotrexate Clinical Trials

Michael Burnhill, MDVice President of Medical AffairsPlanned Parenthood Federation of America810 Seventh AvenueNew York, NY 10019-5818Press Contact: Steve Plever212/261-4310

Manual Vacuum Aspiration Research

Paul Blumenthal, MDAssociate ProfessorJHU Department of OB/GYNJohns Hopkins Bay View Medical Center4940 Eastern AvenueBaltimore, MD 21224410/550-0335

Forrest C. Greenslade, PhDPresidentIPASPO Box 100Carrboro, NC 27510919/967-7052

Patients’ Experiences With Medical Abortion

S. Marie Harvey, DrPHCo-DirectorPacific Institute for Women’s Health2999 Overland Avenue, Suite 111Los Angeles, CA 90064310/842-6828

Provider Training

Jodi MageeExecutive DirectorPhysicians for Reproductive Choice & Health1780 Broadway, 10th FloorNew York, NY 10019Press Contact: Ciara Wilson212/765-2322

Vicki SaportaExecutive DirectorNational Abortion Federation1755 Massachusetts, NW, Suite 600Washington, DC 20036Press Contact: Stephanie Mueller202/667-5881

Policy And Politics

Elizabeth CavendishLegal DirectorNational Abortion & Reproductive Rights Action League (NARAL)1156 15th Street, NW, Suite 700Washington, DC 20005202/973-3000

Marie BassProject DirectorReproductive Health Technologies Project1818 N Street, NW, Suite 450Washington, DC 20036202/530-2900

Return to top

Will 1999 Be The Year For Mifepristone (RU-486)?

Press Release Fact Sheet Q&A Resource List

Will 1999 Be The Year For Mifepristone (RU-486) And, An Update on Women’s Other Options for Very Early Abortion – Fact Sheet

Published: Aug 31, 1998

Abortion in the U.S.

  • Most abortions in the U.S. today are performed surgically, typically using vacuum aspiration (VA).
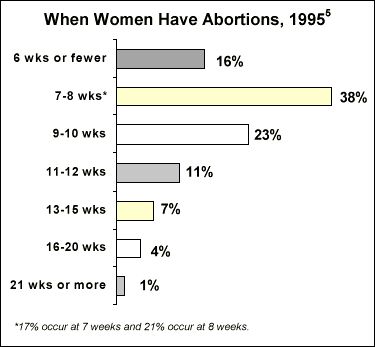
  • 9 in 10 abortions occur within the first 12 weeks of pregnancy.5
  • Surgical abortions can be performed as early as pregnancy is first detected, using electric VA or manual vacuum aspiration (MVA).21
  • Medical abortions are procedures using medications to induce abortion, such as mifepristone (also called RU-486) or methotrexate in combination with misoprostol.

Unintended Pregnancy And Surgical Abortion

  • Almost half (49%) of the 6.3 million pregnancies each year are unintended; 54% of unintended pregnancies end in abortion.
  • In 1994, there were about 1.43 million abortions in the United States; the abortion rate was 24.2 per 1,000 women aged 15-44.10
  • The U.S. abortion rate and the percent of pregnancies ending in abortion have declined slightly but steadily since 1980. Since 1990, all measures of abortion, including the annual incidence, have declined.6
  • About 15,000 women have abortions each year because they became pregnant after rape or incest.6
  • 48% of women 15*44 have at least one unplanned pregnancy sometime in their lives; 28% have one or more unplanned births, 30% have one or more abortions and 11% have both.9
  • An estimated 43% of women will have an abortion by the time they are 45, given current abortion rates.9

Who Has Abortions

  • 55% of women having abortions are younger than 25; 33% are aged 20-24 and 22% are teenagers.8
  • Six in 10 abortions occur to white women; however, their abortion rate is below that of minority women. Black women are nearly 3 times as likely as white women to have an abortion and Hispanic women are about twice as likely.8
  • Two-thirds of all abortions are to never-married women.8
1432-fig1.gif

Who Provides Surgical Abortions

  • 93% of abortions take place in clinics or doctors’ offices.6
  • The number of known current abortion providers (hospitals, abortion clinics, family planning clinics that offer surgical services, and physicians’ offices) declined by 8% between 1988 and 1992 (from 2,582 to 2,380).6
  • In 1992, just 12% of all ob/gyn residency programs provided routine first-trimester abortion training; three in 10 programs offered no first-trimester training.12
  • According to a national survey of ob/gyns in 1997, 36% of ob/gyns say they “ever perform” surgical abortions.18

Barriers & Access To Surgical Abortion Services

  • 84% of all U.S. counties lacked an abortion provider in 1992.6V52% of all abortion facilities provide services only through the 12th week of pregnancy.7
  • In 1992, 4 in 10 clinics and physicians’ practices would not perform surgical abortions before 6 weeks since the beginning of a woman’s last menstrual period (LMP). Another quarter of facilities do not perform abortions until even later in pregnancy.7
  • One-quarter of women who have non-hospital abortions travel at least 50 miles from their home to the abortion facility.7
  • From 1996 to 1997, the number of arsons doubled and bombings tripled against abortion providers.13

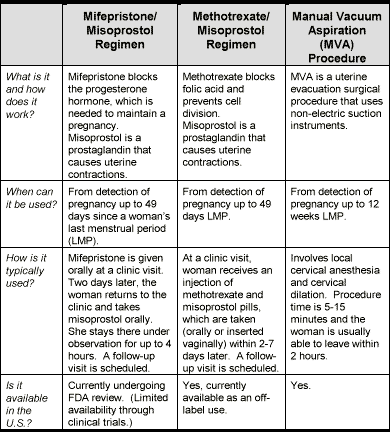
Very Early Abortion Methods3,14,21

1432-fig2.gif

Medical Abortion

  • Among women participating in the U.S. clinical trials who underwent an abortion within 49 days (7 weeks) LMP, the use of mifepristone (with misoprostol) was 92% effective in terminating pregnancy.16
  • Two percent of women who had a mifepristone abortion 49 days LMP in clinical trials required hospitalization, surgical intervention, and/or intravenous-fluid administration.16
  • Several published studies on the use of methotrexate (with misoprostol) for abortion have found the drug to be up to 96% effective in terminating pregnancy within 63 days LMP.1,2,4
  • Of 178 women who underwent pregnancy termination with methotrexate within 63 days LMP in one study, 7 required surgical intervention.1
  • A review of 12 international published studies conducted between 1979 and 1993 of patient attitudes and reactions to early first-trimester medical abortion found that 60-70% of women chose medical abortion when offered a choice between surgical and medical abortion.19
  • Over 2,000 U.S. women, who had a medical abortion with mifepristone and misoprostol during the U.S. clinical trials (1994-1995), found the method highly acceptable: 96% would recommend it to others, 91% would choose it again and 88% found it very or moderately satisfactory.20

Who Pays For Surgical Abortions

  • In 1993, the average amount paid for a non-hospital abortion at 10 weeks was $296; however, the cost ranged from $140 to more than $1,700.7
  • About 13% of all abortions are paid for with public funds, virtually all of which are state funds. Currently, 16 states pay for all or some abortions for poor women.15
  • In the private sector, over two-thirds of typical fee-for-service and managed care plans routinely cover abortions.17

Provider & Public Opinion On Medical Abortion

  • As of 1997, most providers said they were at least somewhat familiar with mifepristone; fewer were familiar with methotrexate.18
  • About half of all ob/gyns (54%) said they would offer mifepristone abortions if approved in the U.S., including 35% of ob/gyns who do not perform surgical abortions.18
  • Among providers familiar with mifepristone, most said they considered it safe (96% of ob/gyns) and effective (94% of ob/gyns).18
  • As of 1997, 43% of women and 51% of men had heard of either mifepristone or methotrexate; among women who had heard of the methods, 72% knew they could be used to end a pregnancy.18

References

1. Creinin M, Darney P. “Methotrexate and Misoprostol for Early Abortion.” Contraception. 1993; 48:339-348.

2. Creinin M. “Methotrexate for Abortion at 42 Days Gestation.” Contraception. 1993; 48:519-525.

3. Expanding Options For Early Abortions Packet. Overview and Fact Sheets. Reproductive Health Technologies Project, Washington D.C.: 1998.

4. Hausknecht R. “Methotrexate and Misoprostol to Terminate Early Pregnancy.” The New England Journal of Medicine. 1995;333:537-540.

5. Henshaw S. “Abortion Services in the United States, 1995-1996.” Family Planning Perspectives. (Forthcoming, Nov/Dec 1998).

6. Henshaw S, Van Vort J. “Abortion Services in the United States, 1991 and 1992.” Family Planning Perspectives. 1994; 26:100-106, 112.

7. Henshaw S. “Factors Hindering Access to Abortion Services.” Family Planning Perspectives. 1995; 27:54-59, 87.

8. Henshaw S, Kost K. “Abortion Patients in 1994-1995: Characteristics and Contraceptive Use.” Family Planning Perspectives. 1996; 28:140-147, 158.

9. Henshaw S. “Unintended Pregnancy in the United States.” Family Planning Perspectives. 1998; 30:24-29.

10. “Induced Abortion.” Facts in Brief. Jan. 1997, New York, N.Y. The Alan Guttmacher Institute.

11. Forrest JD. “Timing of Reproductive Life Stages.” Family Planning Perspectives. 1993; 82.

12. MacKay H, Trent MacKay A. “Abortion Training in Obstetrics and Gynecology Residency Programs in the United States, 1991-1992.” Family Planning Perspectives. 1995; 27:112-115.

13. National Abortion Federation Website (http://www.prochoice.org)

14. Schaff E, Eisinger S, Franks P, Kim S. “Methotrexate and Misoprostol for Early Abortion.” Fam Med. 1996;28:198-203.

15. Sollom T, Gold R, Saul R. “Public Funding for Contraceptive, Sterilization and Abortion Services, 1994.” Family Planning Perspectives. 1996; 28:166-173.v

16. Spitz I, Benton L, Bardin W, Robbins A. “The Safety and Efficacy of Early Pregnancy Termination with Mifepristone and Misoprostol: Results from the First Multicenter U.S. Trial.” The New England Journal of Medicine. 1998; 338:1241-1247.

17. Uneven & Unequal: Insurance Coverage and Reproductive Health Services. 1994, New York, N.Y. The Alan Guttmacher Institute.

18. Views of Americans and Health Care Providers on Medical Abortion: What They Know, What They Think, and What They Want.. 1998, Menlo Park, CA. Kaiser Family Foundation.

19. Winikoff B. “Acceptability of Medical Abortion in Early Pregnancy.” Family Planning Perspectives. 1995;27:142-148 & 185.

20. Winikoff B, Ellertson C, Elul B, Sivin I. “Acceptability and Feasibility of Early Pregnancy Termination by Mifepristone-Misoprostol.” Archives of Family Medicine. 1998; 7:360-366.

21. Winkler J, Blumenthal P, Greenslade F. “Early Abortion Services: New Choices for Providers and Women.” Advances in Abortion Care. 1996; 5. Carrboro, NC. IPAS.

Will 1999 Be The Year For Mifepristone (Ru-486)? And, An Update on Women’s Other Options for Very Early Abortion

Published: Aug 31, 1998

National Survey of Women’s Health Care Providers on Medical Abortion

September 16, 1998

One in Two Ob/Gyns Say They are Likely to Offer Mifepristone (RU-486) If Approved by FDA, And Almost Half Who Do Not Now Provide Abortions Say They Would Provide the Medical Alternative

Many Family Practice Physicians, Nurse Practitioners and Physician AssistantsAlso Report Interest

Menlo Park, CA – In the coming year, the Food and Drug Administration (FDA) is expected to complete its review of mifepristone (sometimes referred to as RU-486 or the “French abortion pill”), a medical alternative to early surgical abortion. If approved, a national survey of obstetrician/gynecologists (ob/gyns) finds that more than half (54%) say they are “very” or “somewhat” likely to prescribe the drug for patients seeking abortions, including almost as many (35%) who do not now provide surgical abortions.

In addition, many family practice physicians (45%) and nurse practitioners and physician assistants (54%) also express interest in offering mifepristone if approved, potentially significantly expanding the number of providers offering some form of abortion. In this survey, 3 percent of family practice physicians, and 2 percent of nurse practitioners and physician assistants, reported “ever performing” surgical abortion.

Available in France, England and Sweden for much of the last decade, mifepristone has been used by more than one half million women in Europe. In the United States, it has so far only been available to a limited number of women participating in clinical trials. Methotrexate, a FDA approved cancer drug which has also been found effective in ending pregnancy, is currently available in the United States, although information about how widely it is being offered is limited.

“The level of provider interest in mifepristone, especially among those not now providing abortions, could mean expanded access for women,” says Felicia H. Stewart, MD, Director of Reproductive Health Programs, Kaiser Family Foundation.

The survey findings are being presented today at a briefing in New York that provides an update on the availability of mifepristone and other medical alternatives to surgical abortion in the U.S. The briefing is part of an ongoing series, Emerging Issues in Reproductive Health, sponsored by The Henry J. Kaiser Family Foundation, The Alan Guttmacher Institute, and the National Press Foundation.

When this survey was conducted in the Spring of 1997, fewer providers expected to offer methotrexate over the coming year, even though it is already available here, than said they would likely prescribe mifepristone if approved: 19 percent of ob/gyns, 11 percent of family practice physicians, and 13 percent of nurse practitioners and physician assistants. In fact, more providers say if a choice were available they would choose mifepristone over methotrexate for their patients.

A companion survey of Americans between the ages of 18-44 conducted at the same time as the survey of providers finds that about half have heard of either mifepristone or methotrexate (43% of women, 51% of men). Among women of “reproductive age” who are aware of the medications, 72 percent know they can be used to end a pregnancy.


Methodology

The Kaiser Family Foundation’s National Survey of Health Care Providers on Medical Abortion is a national random-sample telephone survey of 756 health care providers, including 305 obstetrician/gynecologists, 238 family practice physicians, and 229 nurse practitioners and physician assistants practicing in the United States. It was designed by staff at the Kaiser Family Foundation and Fact Finders, Inc. and conducted by Fact Finders, Inc. between March 5 and June 12, 1997. The margin of error ranges from plus or minus two to seven percent for particular questions.

The Kaiser Family Foundation’s National Survey of Americans on Medical Abortion is a random-sample telephone survey of 1,000 women and 300 men aged 18-44 years old living in the continental United States. It was designed by staff at the Foundation and Princeton Survey Research Associates (PSRA) and conducted by PSRA between May 13 and June 8, 1997. The margin of sampling error is plus or minus three percent for women and plus or minus six percent for men.

A summary report on the findings, including the questionnaire and top line data, are available by calling the Kaiser Family Foundation’s publication request line at 1-800-656-4533 (Ask for #1431).

How Well Does the Employment-Based Health Insurance System Work for Low-Income Families?

Published: Aug 30, 1998

Part 3

What Explains the Coverage Decline?

Rapidly rising health care costs-or, more precisely, employers’ responses to costs-have contributed to the widespread erosion of employer coverage. As employers have shifted costs to workers, participation has dropped. Low-wage workers have been disproportionately affected by rising costs, losing access to coverage as well as finding participation more difficult. Their problems have been exacerbated by structural changes in labor markets, which have weakened the tie between jobs and health insurance.9

Constrained Employer Spending. A key factor behind the decline in employer coverage has been the rapid rise in health care costs. The cost of health insurance grew rapidly in the 1980s and early 1990s, far exceeding the growth in consumer prices generally. Between 1988 and 1996, the average premium for family coverage rose 9.8% per year, the premium for individual coverage increased 7.5% per year, while prices overall increased about 4% annually.10

Employers’ primary response to rapidly rising health care costs has not been to drop health care coverage for full-time workers. However, employers have constrained spending by requiring workers to pay a larger share of health insurance premiums, by tightening eligibility requirements for part-time workers (whose coverage has long been restricted) and, increasingly, in recent years, by replacing regular full-time employees with part-time and contingent workers.11

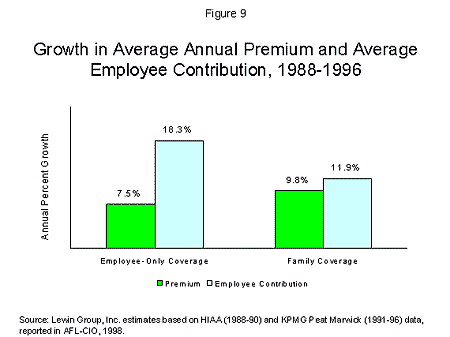
Workers’ average monthly contributions for single and family coverage rose steadily between 1988 and 1996 as workers paid a larger share of higher premiums.12 In fact, as shown in Figure 9, workers’ contributions rose more rapidly than premiums as employers shifted more of the costs of health insurance to workers, especially for non-family coverage. While average premiums for non-family coverage rose an average of 7.5% per year between 1988 and 1996, employees’ contributions rose much more rapidly–increasing by 18.3% per year.13

2107-fig9.gif

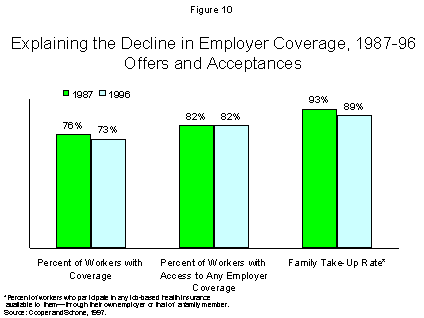
As employers have shifted costs to workers, some workers have dropped coverage, while those who have kept coverage are paying more. As shown in Figure 10, the proportion of workers participating in employer plans to which they had access fell from 93% in 1987 to 89% in 1996. Access to employer coverage was basically unchanged over this period–about 82 percent. Although the fact remains that most (about 70 percent) of the working uninsured lack access to coverage, the decline in coverage between 1987 and 1996 mostly reflects a drop in participation.14

2107-fig10.gif

This overall pattern obscures a worsening of access, as well as participation, for low-wage workers. Although participation rates have dropped most rapidly for the lowest wage workers, access to employer coverage has also declined for these workers. For example, among workers earning more than $15 per hour, the proportion with access to employer coverage increased from 92% in 1987 to 96% in 1996. In contrast, the proportion of low-wage workers (those earning less than $7 per hour) with access to employer coverage declined 5 percentage points over this same time period, from 60% to 55% [Table 2]. The large drop in coverage rates for the lowest wages workers is thus explained by a combination of declining participation and a decline in employer offerings.

Changes in Low-wage Labor Markets. For low-wage workers, costs and employer cost containment are not the only factors producing this deterioration. Structural changes in labor markets, that have occurred throughout the 1980s and 1990s, have contributed to the decline in coverage.

The main change in the labor market over the past two decades has been the widespread deterioration of wages, especially for those workers who initially had low wages, were without a college degree, were in blue collar or service occupations, or were in younger age brackets.15 From 1989 to 1996, the real hourly wage of the typical (median) worker fell 5.2%, while the wages of high-wage workers (90th percentile) increased 0.4%, and wages for low-wage workers (20th percentile) declined by 2.3%. Among low-wage men, the wage declines were even greater. Wages for low-wage men fell 6.4% between 1989-96.16 That is, wages for workers at the middle and at the bottom of the pay scale have not only failed to keep up with health care costs, they have declined in real terms. The large drop in participation rates for the lowest wage workers is understandable in light of the deterioration in wages for these workers. Employer actions that have led to coverage declines for all workers have thus had a disproportionate effect on the lowest wage workers.

Table 2 Change in Access, Family Take-up and Coverage, by Wage1987-1996 Wage Level 1987 1996 Change 1987-96

Coverage $15 87 90 +3

Access to Employer Coverage* $15 92 96 +4

Family Take-Up Rate** $15 94 94 0 * Percent of workers with access to job-based insurance through their own employer or a family member s employer.** Percent of workers with access to job-based insurance who are actually covered by it.Source: Cooper and Schone, 1997.

The decline in access for low-wage workers also is rooted in structural labor market changes. Shifts in employment to low-paying sectors may account for most of this decline in access. As jobs have shifted from high-paying industries like manufacturing to low-paying sectors like retail trade and services, health insurance coverage has declined.17 In addition, the proportion of the workforce in “nontraditional” work arrangements–such as regular part-time work, contingent work, and self-employment–has grown in the past decade. The expansion of employment in these jobs is not large enough to explain much of the decline in coverage; nevertheless, since these jobs are less likely to come with health insurance benefits, the expansion of nontraditional work has contributed to the overall decline in coverage.18

Conclusion

Over the past decade, there has been a decline in employment-based health insurance coverage. The fall in coverage is a widespread phenomenon that goes beyond low-income families. However, often overlooked is that low-wage workers and low-income families–who started out at a disadvantage, with low rates of coverage–have borne the brunt of the decline. The gap in coverage between low-wage and high-wage workers has grown between 1987 and 1996 because the decline in coverage has been greatest for low-wage workers. Although Medicaid plays an important role in providing insurance coverage for many low-income families, including working families, Medicaid’s eligibility levels are constrained. Workers without children are, for the most part, precluded from coverage. Beyond Medicaid’s reach, therefore, many low-income working families are likely to be uninsured.

This paper was prepared for the Kaiser Commission on Medicaid and the Uninsured by Ellen O’Brien and Judith Feder, Institute for Health Care Research and Policy, Georgetown University.

Notes

1 In this Issue Paper, we rely on Current Population Survey estimates of employer health coverage and trends. Estimates of the proportion of families with various sources of insurance by income level are based on the Urban Institute’s TRIM-II model, which produces a different total estimate because it adjusts for the undercount of Medicaid beneficiaries in the CPS.

2 Workers ages 21-64 who are not self-employed.

3 The tax treatment of employment-based health insurance provides an incentive for employers to provide compensation to workers in the form of health coverage rather than in the form of wages subject to current taxation. The tax preference that the exclusion provides is substantial and has resulted in widespread access to health coverage. Yet, despite this fact–as this Paper describes–coverage rates for the lowest wage workers have traditionally been quite low and have declined significantly in the past two decades. The specific provisions of the exclusion provide a partial explanation. To qualify for the exclusion of employer-provided health coverage, employers’ health plans do not need to cover all workers. Although the tax code requires “non-discrimination”–a self-insured health plan may not discriminate in favor of highly compensated individuals as to ability to participate–employees who have not completed three years of service, those under age 25, and part-time or seasonal employees may be excluded from consideration. Moreover, insured health plans, as opposed to self-insured plans, are generally not subject to non-discrimination rules.

4 According to the Employee Benefits Supplement to the Current Population Survey, 51 million of the nearly 89 million private wage and salary workers in 1993 (or about 57% of private industry workers) had health care coverage through their employer. Of the 38 million workers without such coverage, about 50% were in firms that did not offer coverage, and 40% were in firms that offered benefits to at least some employees. (Information on whether the employer sponsored a health plan was not available for the remaining 10% of workers). See tabulations of the CPS Employee Benefits Supplement in U.S. Department of Labor. Report on the American Workforce (Washington, DC: GPO, 1995).

5 Based on an average premium for family coverage of $5,349 in 1996. KPMG Peat Marwick data cited in AFL-CIO, Paying More and Losing Ground: How Employer Cost-Shifting is Eroding Coverage of Working Families (Washington, DC: AFL-CIO,1998), p. 16.

6 These are “family take-up rates.” They measure the proportion of workers who take-up any employer plan available to them — through their own employer or through a family member’s employer. Workers’ participation rates in their own employer plans are lower (63% of the lowest wage workers and 85% of the highest wage workers participated in own employer plans they were offered) since some workers turn down their employer’s plan and choose to be covered under a family member’s plan.

7 Because of changes to the survey beginning with the March 1995 CPS, however, the estimates of employer coverage rates for 1994-96 are not comparable to data for prior years. The observed increase in employer coverage rates may be an artifact of changes in the survey questions.

8 John Holahan, Colin Winterbottom, and Shruti Rajan, “A Shifting Picture of Health Insurance Coverage,” Health Affairs 14(Winter 1995): 253-264.

9 On the more rapid drop in coverage for less educated workers see Peter Gottschalk, Trends in Wages and Health Insurance Status of Less Educated Workers. Menlo Park, CA: The Henry J. Kaiser Family Foundation; and Sherry Glied and Mark Stabile, “Graduation to Health Insurance Coverage: 1981-1996,” Working Paper 6276. (Cambridge, MA: National Bureau of Economic Research, 1997). Other studies of the decline in employer coverage include: Richard Kronick, “Health Insurance 1979-1989: The Frayed Connection between Employment and Insurance,” Inquiry 28(Winter 1991): 318-332; Deborah Chollet, “Employer-Based Health Insurance in a Changing Workforce,” Health Affairs 13(Spring 1, 1994): 315-26; Gregory Acs, “Trends in Health Insurance Coverage Between 1988 and 1991,” Inquiry 32(Spring 1995): 102-110; and Stephen Long and Joel Rogers, “Do Shifts Toward Service Industries, Part-time Work, and Self-Employment Explain the Rising Uninsured Rate?” Inquiry 32(Spring 1995): 111-117; and Paul Fronstin and Sarah Snider, “An Examination of the Decline in Employer Sponsored Health Insurance Between 1988 and 1993,” Inquiry 33(Winter 1996/1997): 317-325.

10 Data from KPMG Peat Marwick and Health Insurance Association of America, cited in General Accounting Office. “Private Health Insurance: Continued Erosion of Coverage Linked to Cost Pressures.” GAO/HEHS-97-122 (Washington, DC: GPO, 1997).

11 See Arne Kalleberg, Edith Rassell, and Ken Hudson, et. al., Nonstandard Work, Substandard Jobs (Washington, DC: Economic Policy Institute, 1997) and Thomas Rice, Nadereh Pourat, Rebecka Levan, et. al., “Trends in Job-Based Health Insurance Coverage.” (Los Angeles, CA: UCLA Center for Health Policy Research, June 1998).

12 The total nonfederal employer premium contribution fell from 85.1% to 83.9% between 1990 and 1996. In 1996 alone, this 1.2-percentage-point decrease in the employer’s share would represent a cost-shift of $3.6 billion to employees enrolled in employer-sponsored health plans. See Katherine R. Levit, Helen C. Lazenby, Bradley R. Braden, et. al. “National Health Spending Trends in 1996,” Health Affairs 17(January/February 1998), p. 46.

13 KPMG Peat Marwick data for 1991-1996 and HIAA data for 1988-1990 cited in AFL-CIO, “Paying More and Losing Ground: How Employer Cost-Shifting is Eroding Coverage of Working Families” (Washington, DC: AFL-CIO,1998), p. 16.

14 Philip Cooper and Barbara Schone. “More Offers, Fewer Takers for Employment Based Health Insurance: 1987 and 1996,” Health Affairs 16(November/December 1997): 142-149.

15 Lawrence Mishel, Jared Bernstein, and John Schmitt. The State of Working America, 1996-97 (Armonk, NY: M.E. Sharpe, 1997), p. 139.

16 Lawrence Mishel, Jared Bernstein, and John Scmitt. “Finally Real Wage Gains.” Issue Brief #127, July 17, 1998. Washington, DC: Economic Policy Institute.

17 See especially Chollet (1994).

18 See Arne Kalleberg, Edith Rassell, and Ken Hudson, et. al., Nonstandard Work, Substandard Jobs (Washington, DC: Economic Policy Institute, 1997). Return to top

Policy Brief Part 1 Part 2 Part 3Library Index

Participation in Welfare and Medicaid Enrollment

Published: Aug 30, 1998

Part 2

In addition to the state exit studies,24 another source of evidence about the impacts of loss of cash assistance can be found in the set of evaluations of the impacts of welfare-work initiatives. Several program evaluations contain data which may suggest that one unintended consequence of state efforts to increase employment among families receiving assistance could be a decline in health care coverage:

  • The National JOBS Program Evaluation measured the impacts of employment efforts at a set of sites around the country using experimental design, where one set of families were subject to program participation requirements and another set were not. Three sites operated a “labor force attachment” model, focusing on rapid job placements. In those sites, two years after families entered the study, the employment rates were higher for the experimental group (42.5% versus 34.4% for a control group) but the percent covered by Medicaid or private health insurance during the month before the survey was lower for the experimental group (77.4% versus 82.7% for the control group.) Thus, the focus on rapid employment had led to an eight percentage point increase in the number of families with employment, but a five percentage point decline in the number covered by either Medicaid or private health insurance.25
  • In Florida’s Project Independence, 45% of a sample of those subject to Project Independence requirements were employed at some point in a two-year period and their most recent job did not provide health benefits; for the control group, the comparable figure was 37%.26
  • The Riverside County GAIN Program has often been recognized for its large impacts in raising employment rates among those subject to its requirements. The evaluation of the program found that in a survey interview two to three years after orientation, 27% of those subject to program requirements (as compared with 18% of members of a control group) reported that Medicaid or other health insurance did not personally cover them.27

Thus, in each of these instances, the program was successful in raising employment entries, but one unintended consequence was a decline in health care coverage for affected families.

3. Findings from State Benefit Termination/Sanction Studies Concerning Medicaid Consequences of Loss of AFDC/TANF

Another set of studies focus specifically on families losing assistance due to sanctions. As noted, until fairly recently, state sanction policies only terminated assistance to the parent rather than to the entire family when a single parent failed to comply with program requirements, but in the last years of AFDC, states began to make use of full-family terminations, and under TANF, such policies have become widespread. The use of full-family terminations has raised many questions about the impacts of such policies on the well-being of parents and children, though to date, there are only a handful of studies that expressly look at the impacts of such terminations.

When a sanction occurs, it is possible that the parent’s Medicaid coverage is being terminated as a matter of sanction policy, but under the law applicable both before and after TANF, the imposition of the penalty on the parent should not have affected the childrens’ Medicaid coverage.

One of the first indications that loss of cash assistance might be associated with loss of Medicaid came in a review issued by the General Accounting Office of early state experiences with benefit terminations. At the time of the report (May 1997) most states did not have significant numbers of benefit terminations for noncompliance with program rules. Three states with early experiences were Massachusetts, Iowa, and Wisconsin. In each of these three states, the level of Medicaid coverage fell substantially after benefit termination. Surveys conducted in the range of two to five months after termination of benefits showed:

  • in Massachusetts, the share of families in which at least one family member received Medicaid fell from 100% to 58.5%;
  • in Wisconsin, the share of families in which at least one family member received Medicaid fell from 100% to 53.5%;
  • in Iowa, the share of families in which at least one family member received Medicaid fell from 86.3% to 54.4%.

Declines were also seen in food stamp receipt. The GAO noted that “officials in all three states expressed surprise at the amount of the decline in receipt of food stamps and Medicaid among households losing AFDC benefits.”28

Iowa engaged in a more detailed study of families whose assistance was denied or terminated for failure to comply with requirements to enter into or follow through with a Family Investment Agreement (FIA).29 Data in that study suggests that in about one-third of sanctioned families, neither the parent nor children were receiving Medicaid, and that in about 28% of sanctioned families, neither the parent nor children were receiving either Medicaid or employer-based coverage. As Iowa’s program was originally designed, a family that did not comply with requirements would enter into a “Limited Benefit Plan,” in which the family would receive the same level of assistance for a three month period, receive reduced assistance for another three months, and then enter into a six month period of ineligibility; during this time, the family should have remained Medicaid-eligible if financially eligible, although families entering employment while subject to a Limited Benefit Plan (LBP) would not qualify for transitional Medicaid. The evaluation included a survey of families in Months 10 or 11. By that point, most (52.6%) families whose assistance was terminated under the LBP rules had been employed at least once since losing cash assistance. For those who had been employed, their most recent job had offered health insurance in 36% of the cases, though only 11% of the employed had actually received employer-based insurance.30 In total, then, about 5.6% of respondents (10.6% of the 52.6% who had entered employment) were receiving employer-based health coverage, and a total of 66.4% of respondents were receiving Medicaid. Thus, it appears that about 28% of those under sanction were not receiving either Medicaid or employer-based health care coverage.

An even larger drop in Medicaid receipt after sanctioning was found in Michigan. Michigan conducted a study examining the first 168 cases that received full-family sanctions when Michigan began to implement such sanctions in April 1996. Of the cases, almost a quarter (24%) were either reopened or in pending status. However, of those still closed, 41% were not active for Medicaid.31 Michigan officials note, however, that the sanction population may be significantly different from the overall population receiving cash assistance, and that the growth in the average number of individuals receiving Medicaid through Michigan’s transitional Medicaid program and Healthy Kids program in 1998 substantially exceeds the reduction in the number of individuals receiving TANF assistance.

C. Why would exiters lose Medicaid?

The exit/sanction studies make clear that a substantial share of children and parents leaving AFDC/TANF lose Medicaid, either immediately or in a short period of time. The studies do not, however, offer any explanation of why this Medicaid drop occurs. There are several possible explanations and different explanations may apply to different states or even to different offices. In addition, whatever the reasons for the drops in enrollment under prior law, a state wishing to prevent this result can, to a significant extent, prevent comparable drops under TANF through the state’s choices in implementing Section 1931 eligibility.

Some of the possible reasons for the drop in Medicaid enrollment after leaving AFDC/TANF are:

  • Family members may no longer be eligible. This is less likely to be the explanation for younger children, though it may explain some of the drop for parents and older children. As noted, the principal pathway to continued eligibility for parents and older children has been transitional Medicaid. However, under AFDC, transitional Medicaid would only have been available to those leaving AFDC due to employment or child or spousal support, and families often exit for other reasons. If the family did not exit due to employment, the family’s subsequent employment would not be sufficient to result in eligibility for transitional Medicaid. Even if the family exited AFDC due to employment, the family might not have qualified for transitional Medicaid if, for example, the family had not received AFDC for at least three of the last six months before exiting due to employment. And, once the family begins receiving transitional Medicaid, the family may lose eligibility for various reasons.32
  • Family members may not seek transitional Medicaid because they do not know about it. In South Carolina’s most recent exit study, 84% of respondents knew that children could continue to get Medicaid after leaving welfare but only 55% knew that adults who left welfare for work might continue to get Medicaid. Under the law, a state has an obligation to determine continuing eligibility even if the family does not request it, but a parent who does not know about transitional Medicaid may not understand the importance of reporting that she is leaving assistance due to employment.
  • States may not code families as leaving assistance due to employment although that is the reason for the exit. For example, in Maryland’s exit study (which does not provide information on health care coverage), 11.2% of a sample of closed cases had been coded as closed because “payee started work or has higher earnings” while state employment and wage data indicated that at least half of payees were working in the quarter in which they left assistance.33
  • State procedures may erroneously terminate Medicaid or not provide for an effective mechanism to determine continuing eligibility. For example, North Carolina officials recently announced their intention to investigate whether local social services workers erroneously cut off Medicaid for 24,000 children who were no longer receiving Medicaid two months after their family stopped receiving TANF.34
  • Parents may be discouraged or confused after loss of TANF assistance. Several researchers who were involved in conducting exit studies raised the possibility that after TANF assistance was terminated, families might fail to provide needed information for Medicaid redeterminations or choose not to do so because they wanted no further contact with the state or might even be confused as to whether Medicaid for family members had been terminated. A recent review of the impact of federal welfare changes on Medicaid noted that several states had acknowledged that problems in the redetermination process could be impacting Medicaid continuations.35

Whatever the reasons under prior law, it is important to appreciate that at least some of the drop-off in Medicaid enrollment can be prevented through attention to state administrative procedures and by state choices in implementing the Section 1931 eligibility criteria.

In attending to administrative procedures, a state can focus on outreach efforts and on attention to those stages at which drop-off or non-enrollment is most likely to occur. For example:

  • Massachusetts indicates that in the last two years, the state has expanded automatic enrollment of closed AFDC/TANF cases into the MassHealth (Medicaid) Program to extend to all closed AFDC/TANF case closings. In addition, the state indicates that it has undertaken an extensive marketing campaign to inform low income families about the availability of health insurance through the MassHealth Program, and has begun an automated outreach process to recipients denied eligibility for TANF at the point of application for assistance.
  • South Carolina indicates that after becoming aware of initial evidence of problems in ensuring uninterrupted Medicaid coverage, the state took measures to improve receipt of Medicaid for eligible families. The agency began showing a videotape to recipients to explain how and when support services continue after closure of the welfare case. Case managers were instructed to question clients who request voluntary closure of assistance cases to determine if the client had become employed; if earnings were verified, the case would be closed for earnings rather than voluntary closure so that the family could qualify for transitional benefits. The state’s efforts may have resulted in increased awareness of the availability of continued Medicaid benefits; in quarterly surveys, the share of respondents indicating awareness that children could continue to get Medicaid after leaving welfare increased from 79% to 84% between the first and third surveys; the share indicating awareness that adults leaving welfare for work may continue to get Medicaid increased from 40% to 55%.36
  • Indiana indicates that it has initiated an extensive outreach effort for Medicaid-eligible children that includes efforts to enroll children through sites such as health clinics, day care centers, schools, hospitals, and that the state has begun planning a strong media campaign for its outreach.37

As noted earlier, under Section 1931, a family’s Medicaid eligibility no longer is based on whether the family receives TANF and a state is free to broaden the effective income and resource rules that determine eligibility under Section 1931.38 Thus, if a state wishes to ensure that family members continue to be eligible for Medicaid after entering low-wage employment, the state may do so under Section 1931. A continuation of Section 1931 eligibility for those entering low-wage jobs would address some of the problems presented by the eligibility restrictions and administrative requirements of transitional Medicaid.39 Moreover, it could help to address the problems presented by the limited receipt of employer-based health care for families exiting TANF due to employment.

The TANF exit studies underscore the importance of using Section 1931 to broaden Medicaid eligibility for working poor families. Without such a broadening of eligibility, it seems likely that one consequence of TANF implementation will be fewer families receiving TANF, more families engaged in employment, and yet reduced health care coverage for poor parents and children.

This paper was prepared for the Kaiser Commission on Medicaid and the Uninsured by Mark Greenberg, Center for Law and Social Policy. The author would like to thank the Kaiser Family Foundation for their support of this project and Cindy Mann, Jocelyn Guyer, and all state officials who reviewed and commented on this paper.

1 A set of eligibility rules limited when and how long families could qualify for transitional Medicaid. Among the most significant, the family must have received AFDC for three of the last six months before exiting due to hours of employment, earnings, or loss of AFDC earnings disregards; and, in order to receive transitional Medicaid for the entire twelve months, the family would need to meet quarterly reporting requirements, maintain employment and have earnings not exceeding 185% of poverty. For a detailed discussion of transitional Medicaid rules under AFDC, see Greenberg, The JOBS Program: Answers and Questions (2nd ed., Center for Law and Social Policy, 1992), pp. 245-263.

2 More precisely, the income and resource requirement is that the individual must meet the income and resource standards for determining AFDC eligibility under the State AFDC Plan in effect on July 16, 1996, using the income and resource methodologies under that plan. The family composition rules are the AFDC definition of “dependent child” and the AFDC listing of the relatives living with a dependent child who could qualify for assistance. As a practical matter, single parent families and two-parent families that met prior AFDC-UP or AFDC-Incapacity rules will meet the family composition rules States wishing to broaden the circumstances under which two-parent families meet the family composition rules may do so by modifying the definition of when a two-parent family is considered to be “unemployed.” See 63 Fed. Reg. 42270-75 (August 7, 1998).

3 The law allows a state to: lower its income standards, but not below the standards applicable under its AFDC state plan on May 1, 1988; increase its income or resource standards by an amount not exceeding the Consumer Price Index; use “less restrictive” income and resource methodologies than those used under the plan as of July 16, 1996; and if the state had had an AFDC waiver that had the effect of expanding Medicaid eligibility, the state may elect to continue that policy for Section 1931 purposes even after the time that the waiver would have expired.

4 See Peller and Shaner, Medicaid Eligibility Standards for Low-Income Families and Children: State Implementation of the Personal Responsibility and Work Opportunity Reconciliation Act of 1996 (American Public Welfare Association, May 1998).

5 For example, a study of the caseload decline in Alabama concluded that the most important variable in explaining the decline was a reduction in the percentage of applications that were approved for assistance, with the percentage of approvals falling from 63% to 46% over an eighteen month period. Dawson, Demystifying the Caseload Reduction (Alabama Arise, 1997).

6 The HHS Temporary Assistance for Needy Families (TANF) Program First Annual Report to Congress (August 1998) reports that in recent years, the likelihood that an AFDC/TANF adult would be employed in the next year has increased. Of adults receiving AFDC in 1991, 18.8% were employed in March 1992; the share of previous-year recipients who were employed the next March increased each subsequent year, reaching 24.6% in 1996 and then increased to 31.5% in 1997.

7 Gallagher, et al., One Year After Federal Welfare Reform: A Description of State Temporary Assistance for Needy Families (TANF) Decisions as of October 1997 (Urban Institute, May 1998), p. V-6.

8 South Carolina Department of Social Services, Division of Program Quality Assurance, Survey of Former Family Independence Clients: Cases Closed During April through June 1997 (June 1998), p 11.

9 The South Carolina figures reported for this most recent period reflect an improvement in health care coverage as compared to earlier periods in which the same questions were asked. South Carolina’s survey is the third in a series of surveys looking at the circumstances of a sample of families after leaving cash assistance. In the first study (focusing on exiters from October-December 1996), 66% of children were covered by Medicaid and 81% had some form of coverage; in the second study (focusing on exiters from January-March 1997), 71% of children were covered by Medicaid and 81% had some form of coverage. As to adults, in the first study, 28% were covered by Medicaid and 47% had some form of coverage; in the second study, 27% were covered by Medicaid and 37% had some form of coverage. See South Carolina Department of Social Services, Division of Program Quality Assurance, Survey of Former Family Independence Clients: Cases Closed During October through December, 1996 (November 1997) and Survey of Former Family Independence Clients: Cases Closed During January through March 1997 (March 1998).

10 Bureau of Business and Economic Research, University of New Mexico, Survey of the New Mexico Closed-Case AFDC Recipients, July 1996 to June 1997 (September 1997).

11 Fein, The Indiana Welfare Reform Evaluation: Who Is On and Who is Off? (Abt Associates, September 1997) at pp. 7-9.

12 At the time of the survey, 64% of respondents not receiving TANF were working, and of those working 62% reported that they were in jobs offering health insurance. However, the survey does not indicate what share of families were actually receiving employment-based health insurance. Fein, The Indiana Welfare Reform Evaluation: Who Is On and Who is Off? (Abt Associates, September 1997) at pp. 7-9.

13 Management Reports and Data Analysis, DSHS Economic Services Administration, Washington’s TANF Single Parent Families Shortly After Welfare: Survey of Families Which Exited TANF between December 1997 and March 1998 (July 1998), supplemented by unpublished responses to survey questions.

14 Some part of the difference between these two figures may be attributable to the possibility that respondents gave different responses to different questions; some part may be attributable to the difference between coverage in current employment and coverage in employment at some point in the prior twelve months.

15 Management Reports and Data Analysis, DSHS Economic Services Administration, Washington’s TANF Single Parent Families Shortly After Welfare: Survey of Families Which Exited TANF between December 1997 and March 1998 (July 1998), supplemented by unpublished responses to survey questions.

16 Among those reporting being worse off, 49% reported no adult heath coverage, and 30% reported no child coverage. Among those reporting being about the same, 36% reported no adult health coverage and 21% reported no child coverage. Among those reporting being better off, 30% reported no adult health coverage and 16% reported no child coverage. Overall, 60% reported being better off, 22% reported being about the same, and 18% reported being worse off. Of those saying they were worse off 52% said they were likely to return to welfare within the next six months.

17 DSHS Economic Services Administration, A Baseline Analysis of TANF One-Parent Families: Findings from 1997 Client Survey (February 1998), at p.6.

18 DSHS Economic Services Administration, A Baseline Analysis of TANF One-Parent Families: Findings from 1997 Client Survey (February 1998), at p.6.

19 ancoske, Kemp and Lindhorts, Exiting Welfare: The Experiences of Families in Metro New Orleans (Welfare Reform Research Project, School of Social Work, Southern University at New Orleans, June 1998).

20 Mancoske, Kemp and Lindhorts, Exiting Welfare: The Experiences of Families in Metro New Orleans (Welfare Reform Research Project, School of Social Work, Southern University at New Orleans, June 1998).

21 Pawasarat, Employment and Earnings of Milwaukee County Single Parent AFDC Families: Establishing Benchmarks for Measuring Employment Outcomes Under “W-2” (University of Wisconsin-Milwaukee, Employment and Training Institute).

22 Pawasarat, Employment and Earnings of Milwaukee County Single Parent AFDC Families: Establishing Benchmarks for Measuring Employment Outcomes Under “W-2” (University of Wisconsin-Milwaukee, Employment and Training Institute). The actual level of non-receipt may be somewhat higher because Medicaid status is not available for 20% of cases in which the family had ceased receiving AFDC and was still receiving Food Stamps. Also, note that the family was coded as receiving Medicaid if any family member received Medicaid.

23 Summary of Surveys of Welfare Recipients Employed or Sanctioned for Noncompliance (March 1998) prepared for Tennessee Department of Human Services by Bureau of Business and Economic Research/Center for Manpower Studies, University of Tennessee, Memphis, Tennessee (March 1998).

24 One additional state study of exiters, from Kentucky, found that almost half of children were reported to have no health care coverage, though the low survey response rate and possible ambiguities in the wording of questions make it difficult to be confident of the survey results. Cummings and Nelson, From Welfare to Work: Welfare Reform in Kentucky (Center for Policy Research and Evaluation, Urban Studies Institute, University of Louisville, January 1998). A telephone survey was conducted in December 1997 of former TANF recipients who had been discontinued between January and November 1997. The response rate was low: only 17% (560 respondents out of 3225 attempts). About half (49%) of respondents reported that they had left assistance because they got a job. The survey asked “Are your children covered by health insurance?” According to respondents, almost half (48%) of children were not covered by health insurance; 49.5% of children were covered. However, there may be some ambiguity as to whether respondents whose children were covered by Medicaid would answer yes to the question. Another question included Medicaid on the list in a question, “Do you currently receive any of the following benefits…?” Only 28.4% of respondents responded yes, but the question could have been interpreted as being directed only at the adult respondent.

25 Executive Summary, The JOBS Evaluation: Early Findings on Program Impacts in Three Sites (U. S. Dept. Of Health and Human Services, 1995), Table ES-1. In sites emphasizing a “human capital development” approach, at the two-year point, the employment impacts were smaller and not statistically significant (35.1% of experimentals and 32.4% of controls were employed); there was also a small, and not statistically significant, difference in the percent covered by Medicaid or private health insurance in the prior month (79.2% of experimentals, 81.8% of controls. A subsequent report provides additional information on employment and other impacts in the JOBS evaluation sites, but the subsequent report does not provide further information on Medicaid/health coverage impacts. See Hamilton, et al., National Evaluation of Welfare-to-Work Strategies, Two-Year Findings on the Labor Force Attachment and Human Capital Development Programs in Three Sites (U.S. Department of Health and Human Services and U.S. Department of Education, December 1997).

26 Kemple, Friedlander, and Fellerath, Florida’s Project Independence: Benefits, Costs, and Two-Year Impacts of Florida’s JOBS Program (Manpower Demonstration Research Corp., 1995), p. 106.

27 Riccio, Friedlander, and Freedman, GAIN: Benefits, Costs, and Three-Year Impacts of a Welfare-to-Work Program (Manpower Demonstration Research Corporation, 1994), p.178.

28 GAO/HEHS-97-74, Welfare Reform: States’ Early Experiences with Benefit Termination (May 1997), pp. 42-43.

29 Fraker, Nixon, Losby, Prindle, and Else, Iowa’s Limited Benefit Plan (Mathematica Policy Research, May 1997), at p. 74. FIA describes the agreement between the individual and state specified goals, activities, and time frames for enacting these goals and the ultimate goal of self-sufficiency.

30 Of the 36.4% who had had health insurance available in their most recent job, 10.^% received the insurance, 10.6% did not receive the insurance due to its costs; and 15.2% did not receive it for another reason. Fraker, Nixon, Losby, Prindle, and Else, Iowa’s Limited Benefit Plan (Mathematica Policy Research, May 1997), at p. 74.

31 Colville, Moore, Smith and Smucker, A Study of AFDC Case Closures Due to JOBS Sanctions, April 1996 AFDC Case Closures (Michigan Family Independence Agency, May 1997).

32 For example, Kentucky officials note that they recently conducted a review of all cases discontinued effective March 1998 for a reason that would result in transitional Medicaid eligibility; 706 cases were identified, and transitional Medicaid had been established in each case. The next month, 51 of those cases were identified as losing transitional Medicaid eligibility, and a review of a random sample of half of those cases found the terminations to be valid, with the most frequent reasons being recipient request for termination, recipient having moved out-of-state, and reinstatement of TANF eligibility.

33 Born, Life After Welfare: Second Interim Report (School of Social Work, University of Maryland, March 1998)., pp. 18-19.

34 See Children’s Loss of Medicaid Probed, Raleigh News & Observer, June 12, 1998.

35 Ellwood and Ku, Welfare and Immigration Reforms: Unintended Side Effects for Medicaid (Health Affairs, May/June 1998, pp. 137, 141).

36 See South Carolina Department of Social Services, Division of Program Quality Assurance, Survey of Former Family Independence Clients: Cases Closed During April through June 1997 (June 1998), p. 20.

37 Most other states responding to a preliminary draft of this report also emphasized ongoing or newly initiated outreach efforts.

38 Technically, the mechanism that a state could use would be to adopt a “less restrictive methodology” for calculating income eligibility for Section 1931-based Medicaid. A state wishing to ensure that low-wage working families retained Medicaid eligibility might provide, for example, that the first $500 (or some other figure) from earnings would not be counted in determining whether the family met the income standards applicable to Section 1931 eligibility. The practical effect of this less restrictive methodology would be a broadening of the circumstances where low-wage working families qualified for Section 1931 Medicaid. For a more detailed discussion of state options in expanding coverage through use of Section 1931, see Guyer and Mann, Taking the Next Step: States Can Now Expand Health Coverage to Low-Income Working Parents Through Medicaid (Center on Budget and Policy Priorities, July 1998), http://www.cbpp.org/702mcaid.html.

39 For example, Washington State has implemented a more generous earned income disregard (50% of gross earnings), more liberal treatment of assets, and broader eligibility for two-parent families under TANF, and has extended those same standards to Section 1931 eligibility. Return to top

Policy Brief Part 1 Part 2Library Index
Sex in the 90s: 1998 National Survey of Americans on Sex and Sexual Health 1

Published: Aug 30, 1998

30. Are you currently involved in a sexual relationship?

Based on those not currently married or living as married; n=479

38 Yes 60 No 2 Don’t know/Refused 100

CURRENT RELATIONSHIP STATUS (Q29, Q30):60 Married/Living as 15 Unmarried and involved 24 Unmarried and not involved 1 Don’t know/Refused 100

31. How long have you (been married /been together with this person)?

Based on those married, living as married, or involved in a sexual relationship; n=916

20 2 years or less 25 3 to 9 years 20 10 to 19 years 35 20 years or more * Don’t know/Refused 100

32. These next few questions are about your sexual health and behavior. Please keep in mind that all of your answers are private. First, have you had sexual intercourse within the last TWELVE months?

75 Yes 25 No 5 Don’t know/Refused 100

33. Have you ever had sexual intercourse?

98 Yes 2 No * Don’t know/Refused 100

34. When you were growing up, did you have sex education courses in school?

Based on those currently or ever married, n=910

66 Yes 30 No 4 Don’t know/Refused 100

35. Since you become sexually active, about how many sexual partners have you had? Would you say more than twenty, eleven to twenty, seven to ten, three to six, two or one?

29 One 11 Two 24 3 to 6 11 7 to 10 10 11 to 20 9 More than 20 6 Don’t know/Refused 100

36. How often (do you and your spouse /do you and your partner/did you and your most recent partner) have sex . . .

9 Everyday or almost everyday 33 Several times a week 28 About once a week 11 About once a month 10 Less often than that 9 Don’t know/Refused 100

37. In general, how do think you compare with most of Americans your AGE…

a. Are you MORE comfortable talking about sexual issues than most Americans your AGE, LESS comfortable, or about as comfortable?

34 More comfortable 10 Less comfortable 51 About as comfortable 5 Don’t know/Refused 100

a. Do you think (you and your spouse have/you and your partner have/you and your most recent partner had) a BETTER sex life than most of Americans your age, NOT as good as sex life, or about the same?

Based on those who have had intercourse (excluding widows and widowers not currently involved in a relationship); n=1109

29 Better 9 Not as good 53 About the same 9 Don’t know/Refused 100

38. How often do you think the average American couple your AGE has sex . . .

7 Everyday or almost everyday 28 Several times a week 36 About once a week 10 About once a month 4 Less often than that 15 Don’t know /Refused 100

39. Thinking about (your SEXUAL relationship with your spouse, how often do you feel that the SEXUAL relationship is/your SEXUAL relationship with your partner, how often do you feel that the SEXUAL relationship your most recent SEXUAL relationship, how often did you feel that the SEXUAL relationship was) (INSERT) always, often, sometimes, or hardly ever?

Based on those who have had intercourse (excluding widows and widowers not currently involved in a relationship); n=1109

Always Often Sometimes Hardly ever Never (VOL.) DK/Ref. a. Loving 62 17 12 4 1 4 =100 b. Passionate 40 26 21 6 1 6 =100 c. Routine 10 13 32 32 6 7 =100 d. Creative 19 22 37 12 2 8 =100

40. How often (do you and your spouse/do you and your partner/did you and your most recent partner) (INSERT) very often, often, sometimes, or hardly ever?

Based on those who have had intercourse (excluding widows and widowers not currently involved in a relationship); n=1109

Always Often Sometimes Hardly ever Never (VOL.) DK/Ref. a. Do romantic things like eat by candlelight 8 18 35 30 6 3 =100 b. Act out your fantasies together 4 10 28 39 12 7 =100 c. Based on women; n=564Wear sexy lingerie 9 10 28 35 12 6 =100 d. Try different sexual positions 11 19 35 23 4 8 =100 e. Read books or watch videos about improving your sex life 2 3 14 52 26 3 =100 f. Go out on special evenings or “dates” or go away for weekends alone 11 22 37 22 5 3 =100

41. Still thinking about (your sexual relationship with your spouse, your sexual relationship with your partner/your most recent sexual relationship) please tell me whether each of the following topics is something you would (like/have liked) to talk about MORE, something you (talk/talked) about enough, or something that you (don”t/didn”t) need to talk about at all?

Based on those who have had intercourse (excluding widows and widowers not currently involved in a relationship); n=1109

More Enough No need to talk about DK/Ref. a. Concerns about AIDS or HIV or othersexually transmitted diseases 12 34 51 3 =100 b. Birth Control 8 27 62 3 =100 c. Your sex life generally 19 44 33 4 =100 d. Your sexual wants and desires 21 45 30 4 =100

READ: Now I have just a few more questions so we can learn more about the people who took part in our survey . . . 42. RECORD RESPONDENT”S GENDER

48 Male 52 Female 100

43. And, what is your age?

23 18-29 21 30-39 19 40-49 14 50-59 22 60 plus 1 Refused 100

44. What is the LAST grade or class you completed in school?

4 None, or grade 1 to 8 13 High school incomplete (Grades 9 – 11) 34 High school graduate (Grade 12), GED 3 Business, technical or vocational school after high school 23 Some college, no four-year degree 14 College graduate, four-year degree 8 Post-graduate or professional schooling, after college 1 Don’t know/Refused 100

45. Are you, yourself, of Hispanic or Latino background, such as Mexican, Puerto Rican, Cuban, or some other Spanish background?

7 Yes 92 No 1 Don’t know/Refused 100

46. What is your race? Are you white, black or African American, Asian or some other race?

84 White 11 Black 1 Asian 3 Other or Mixed race 1 Don’t know/Refused 100

47. Last year, that is in 1997, what was your total family income from all sources, BEFORE taxes? Just stop me when I get to the right category.

6 Less than $10,000 12 $10,000 to under $20,000 18 $20,000 to under $30,000 16 $30,000 to under $40,000 18 $40,000 to under $60,000 13 $60,000 to under $100,000 6 $100,000 or more 11 Don’t know/Refused 100

READ: Thank you very much for taking the time to answer the questions on this survey. We really appreciate it. Have a nice day/evening.

Return to top

Sex In The 90s:Kaiser Family Foundation/ABC Television 1998 National Survey of Americanson Sex and Sexual Health:Survey Part One Part Two Part Three ABC Television

Poll Finding

Sex in the 90s: 1998 National Survey of Americans on Sex and Sexual Health

Published: Aug 30, 1998

This survey takes an in-depth look at Americans’ attitudes about sex and sexual health issues in the 90s, including sex education, sex in the media, sexually transmitted disease and unintended pregnancy, and how we talk (or not) about sexual issues with children and partners.

Medicaid Eligibility for Families and Children – Issue Paper

Published: Aug 30, 1998

Medicaid Eligibility for Families and Children

September 1998

Measured by enrollment, Medicaid is the largest health insurer in the country. According to the Urban Institute’s estimates, Medicaid covered 41.3 million Americans in 1996; Medicare, in comparison, covered 38 million. Moreover, millions of low-income Americans without private health insurance coverage are eligible for Medicaid but are not enrolled in the program. For example, researchers at the Agency for Health Care Policy Research recently estimated that in 1996 about 4.7 million uninsured children were eligible for Medicaid but not enrolled.1 If all of these children were enrolled in Medicaid, the number of children without some form of health insurance coverage would drop by 40 percent.

There are numerous reasons why Medicaid does not cover all of the children or adults who qualify. This Issue Paper focuses on one of those reasons: the complexity of Medicaid eligibility policy. This complexity makes the program difficult for low-income Americans to understand and for state Medicaid officials to administer. Yet within this complexity are options that enable states, if they so choose, to use their Medicaid programs as a policy tool to reduce — potentially dramatically — the number of children and adults without basic health care coverage.

This paper begins with an overview of Medicaid eligibility policy. It then turns to two groups of Americans — low-income children and nondisabled adults under 65 — and summarizes the statutory and regulatory “pathways” to Medicaid eligibility available to individuals to them.2 The paper concludes with a discussion of policy options available to states under current law for increasing Medicaid eligibility for these two groups. It also reviews the policy options available to the federal government for altering current law to expand Medicaid eligibility.

The complexity of Medicaid eligibility policy is just one reason why Medicaid does not cover all of the children or adults who qualify. Other reasons include burdensome application forms and procedures, lack of outreach efforts, and negative perceptions of Medicaid among low-income families.3 These issues are the subject of other analyses and are being explored in related Kaiser Commission projects.4

As CBO has recognized, states have Aa great deal of flexibility in operating the Medicaid program.5 For this reason, Medicaid eligibility policy, like Medicaid coverage policy and Medicaid payment policy, varies from state to state. This paper does not attempt to describe Medicaid eligibility policy in each state.6 Instead, the focus is on the federal policies that structure the eligibility choices that states make.

I. Overview of Medicaid Eligibility Policy

Medicaid eligibility policy reflects the basic structure of the program. Medicaid is a means-tested, federal-state, individual entitlement program with historical ties to the Aid to Families with Dependent Children (AFDC) and Supplemental Security Income (SSI) cash assistance programs. Medicaid’s policy premise of means-testing explains much about its income and resource rules. Medicaid’s association with AFDC and SSI has guided Medicaid’s historical eligibility categories. Finally, because Medicaid is an individual entitlement, both the states and the federal government have relied on eligibility policy as a tool for limiting their financial exposure for the cost of covered benefits.

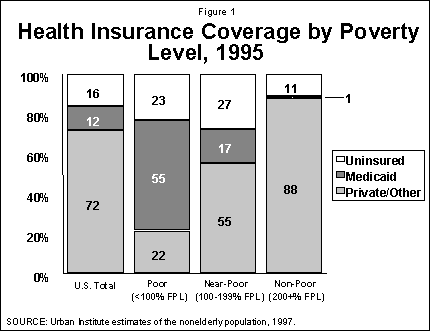
Medicaid’s role is to cover basic health and long-term care services for low-income Americans. However, being poor does not assure Medicaid coverage. As shown in Figure 1, Medicaid in 1995 covered only about 55 percent of the nonelderly poor, earning less than $12,590 for a family of three. Medicaid’s reach to individuals with incomes just above the poverty line is even more limited, covering only 17 percent of the near-poor. Despite Medicaid, low-income people are considerably more likely to be uninsured than those with higher incomes. While a portion of the low-income uninsured are eligible for Medicaid but not enrolled, a substantial share are excluded from Medicaid coverage by program eligibility rules that reflect policy choices at both the federal and state level.

2106-fig1.gif

At the federal level, eligibility policy choices are reflected in the authorization of federal Medicaid matching funds (on an open-ended basis) for the costs incurred by a state in paying for covered services on behalf of certain low-income individuals. Federal Medicaid matching funds are available to states for the costs of covering some categories of individuals but not others. If federal matching funds are not available for a particular category, it is unlikely that a state will extend Medicaid coverage to those categories of individuals, because the state would then bear the costs of care entirely at its own expense.

At the state level, eligibility policy choices are reflected in state decisions as to which optional eligibility categories and which income and resource criteria to adopt. There are certain eligibility groups — for example, pregnant women with family incomes at or below 133 percent of the federal poverty level ($1,513 per month for a family of three in 1998) — that all states opting to participate in Medicaid must cover. In addition, there are other categories for which states may receive federal matching funds if they choose to extend Medicaid coverage. However, the availability of federal matching funds for a particular category of individuals does not necessarily mean that a state will cover that category, since the state must still contribute its own matching funds toward the costs of coverage.

The terms on which federal Medicaid matching funds are available to states include five broad requirements relating to eligibility: categorical; income; resources; immigration status; and residency. Two of these broad requirements — income and resources — are financial in nature. The other three — categorical, immigration status, and residency — are non-financial. In order to qualify for Medicaid, an individual must meet both its financial and non-financial requirements.

Within each of these five broad requirements are “mandatory” and “optional” elements. It is important to understand the context in which these terms are used. State participation in Medicaid is voluntary, not mandatory. The federal government makes Medicaid matching funds available on an open-ended, entitlement basis to states that elect to participate in the program. In order to participate, states must offer coverage for basic benefits to certain populations — e.g., medically necessary physician and hospital services to certain low-income families and children.

States receive federal Medicaid matching funds for at least 50 percent and as much as 80 percent of the costs of this mandatory coverage, depending on the state. In exchange, states are also able to draw down federal Medicaid matching funds at the same rate for optional populations and services such as the low-income elderly and disabled at risk of nursing home and other expensive long-term care services. Similarly, within each of the five major eligibility requirements there are minimum policies states must follow and there are more expansive policies that states may adopt. According to the Health Care Financing Administration, 55 percent of all Medicaid spending paid for optional populations or optional services.7

A child or adult who establishes Medicaid eligibility is not, on the basis of that initial determination, entitled to maintain eligibility indefinitely. Federal Medicaid regulations require that states redetermine eligibility of a Medicaid beneficiary at least once every 12 months. This redetermination, like the original determination, is designed to ensure that a beneficiary continues to meet each of the financial and non-financial requirements for eligibility. Those beneficiaries, who due to a change in income, resources, or family composition no longer meet the eligibility requirements of their state through any pathway, lose their entitlement to Medicaid. There are some limited exceptions for certain categories such as pregnant women, who are entitled to continue Medicaid coverage for 60 days post-partum regardless of any change in financial or non-financial circumstances.

Fluctuations in monthly income are common among low-income families. These changes can lead to the loss of Medicaid coverage by a child or family whose income may spike during one part of the year but spends most of the year earning under the federal poverty level. This occurs commonly in states that use 1-month, 3-month, and 6-month redetermination periods. To address eligibility “churning,” the Balance Budget Act of 1997 gave states the option of extending Medicaid coverage with federal matching funds to children under 19 for a period of up to 12 months after the initial determination of eligibility regardless of any change in financial or non-financial circumstances that would otherwise make them ineligible. This option does not extend to low-income adults with dependent children.

Medicaid does not require that an individual who meets its categorical, income, resource, immigration status, and residency requirements also be uninsured. Medicaid treats insurance coverage as a payment source, not as an eligibility criterion. More specifically, private insurance coverage under Medicaid is a type of “third party liability” that the program uses to reduce its costs of coverage. In most cases, when a Medicaid beneficiary also has private coverage, the private insurer must pay first. Then Medicaid will pay for Medicaid-covered services for which the private insurer is not obligated to pay. This policy stands in sharp contrast to the approach taken under the new Child Health Insurance Program (CHIP), under which states are expressly prohibited from using federal CHIP matching funds to pay for services to children with private health insurance.8

Unlike employer-based insurance coverage, Medicaid eligibility is not directly tied to employment for many of the Medicaid coverage categories. For example, a pregnant woman whose income is equal to or less than 133 percent of the federal poverty level is eligible for Medicaid coverage in every state whether or not she worked before or during her pregnancy. On the other hand, as a result of the 1996 welfare law, a state has the option to deny Medicaid eligibility to non-pregnant women with dependent children with respect to whom the state has terminated cash assistance for refusal to work (states are not permitted to terminate Medicaid coverage to children for this reason).

The earnings flowing to an individual or a family from work will affect income eligibility for Medicaid. At income levels near Medicaid eligibility thresholds, a small increase in earnings can result in a loss in Medicaid eligibility even though the increase in earnings may not be sufficient to enable the worker to afford private health insurance coverage. To mitigate this disincentive to work or to increase the hours worked, states are required to extend “transitional” Medicaid coverage for up to one year to women (and their dependent children) who lose cash assistance due to earnings.

Figure 2: Major Medicaid Eligibility Pathways for Selected GroupsMandatory Coverage Optional Coverage Low-income Children Primary Pathways Infants under age 1 with income < 133% FPL Infants under age 1 with income < 185% FPL Children age 1 to 6 with income < 133% FPL Children age 1 to 6 with income < 185% FPL Children age 6 to 15 with income < 100% FPL Children age 6 to 15 with income < 133% or 185% FPL Section 1931 children Targeted low-income children (CHIP children) Children in welfare-to-work families Transitional coverage for children in welfare-to-work families Title IV-E foster care children Non-Title IV-E foster care children Title IV-E adoption assistance children Non-Title IV-E adoption assistance children Other Pathways Medically needy Ribicoff children Children with Disabilities Primary Pathways Supplemental Security Income (SSI) recipients Katie Beckett children Home or community-based waiver children Other Pathways SSI recipients as of 8/22/96 Medically needy Pregnant Women Primary Pathways Pregnant women with income < 133% FPL Pregnant women with income < 185% FPL Other Pathways Medically needy Low-Income Adults Primary Pathways Certain adults in low-income families with children Adults in two-parent households with dependent children Other Pathways Medically needy COBRA continuation beneficiaries Return to top

Medicaid Eligibility for Families and ChildrenPolicy Brief Part 1 Part 2 Part 3 Part 4 Part 5

Privatization of Public Hospitals

Published: Aug 30, 1998

This report examines the trends in the closure of public hospitals and their conversion to private ownership. It also provides case studies of communities where major privatizations have occurred.

Report (.pdf)

Summary of Findings (.pdf)

Report and Summary of Findings

Published: Aug 30, 1998

Privatization of Public Hospitals

Full Report available in PDF format.Summary available in PDF format.Return to top

Privatization of Public HospitalsReport