Medicaid Eligibility for Families and Children – Issue Paper

Published: Aug 30, 1998

Medicaid Eligibility for Families and Children

September 1998

Measured by enrollment, Medicaid is the largest health insurer in the country. According to the Urban Institute’s estimates, Medicaid covered 41.3 million Americans in 1996; Medicare, in comparison, covered 38 million. Moreover, millions of low-income Americans without private health insurance coverage are eligible for Medicaid but are not enrolled in the program. For example, researchers at the Agency for Health Care Policy Research recently estimated that in 1996 about 4.7 million uninsured children were eligible for Medicaid but not enrolled.1 If all of these children were enrolled in Medicaid, the number of children without some form of health insurance coverage would drop by 40 percent.

There are numerous reasons why Medicaid does not cover all of the children or adults who qualify. This Issue Paper focuses on one of those reasons: the complexity of Medicaid eligibility policy. This complexity makes the program difficult for low-income Americans to understand and for state Medicaid officials to administer. Yet within this complexity are options that enable states, if they so choose, to use their Medicaid programs as a policy tool to reduce — potentially dramatically — the number of children and adults without basic health care coverage.

This paper begins with an overview of Medicaid eligibility policy. It then turns to two groups of Americans — low-income children and nondisabled adults under 65 — and summarizes the statutory and regulatory “pathways” to Medicaid eligibility available to individuals to them.2 The paper concludes with a discussion of policy options available to states under current law for increasing Medicaid eligibility for these two groups. It also reviews the policy options available to the federal government for altering current law to expand Medicaid eligibility.

The complexity of Medicaid eligibility policy is just one reason why Medicaid does not cover all of the children or adults who qualify. Other reasons include burdensome application forms and procedures, lack of outreach efforts, and negative perceptions of Medicaid among low-income families.3 These issues are the subject of other analyses and are being explored in related Kaiser Commission projects.4

As CBO has recognized, states have Aa great deal of flexibility in operating the Medicaid program.5 For this reason, Medicaid eligibility policy, like Medicaid coverage policy and Medicaid payment policy, varies from state to state. This paper does not attempt to describe Medicaid eligibility policy in each state.6 Instead, the focus is on the federal policies that structure the eligibility choices that states make.

I. Overview of Medicaid Eligibility Policy

Medicaid eligibility policy reflects the basic structure of the program. Medicaid is a means-tested, federal-state, individual entitlement program with historical ties to the Aid to Families with Dependent Children (AFDC) and Supplemental Security Income (SSI) cash assistance programs. Medicaid’s policy premise of means-testing explains much about its income and resource rules. Medicaid’s association with AFDC and SSI has guided Medicaid’s historical eligibility categories. Finally, because Medicaid is an individual entitlement, both the states and the federal government have relied on eligibility policy as a tool for limiting their financial exposure for the cost of covered benefits.

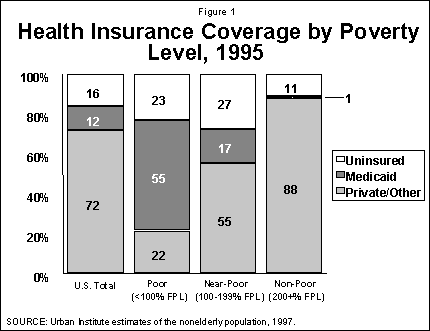
Medicaid’s role is to cover basic health and long-term care services for low-income Americans. However, being poor does not assure Medicaid coverage. As shown in Figure 1, Medicaid in 1995 covered only about 55 percent of the nonelderly poor, earning less than $12,590 for a family of three. Medicaid’s reach to individuals with incomes just above the poverty line is even more limited, covering only 17 percent of the near-poor. Despite Medicaid, low-income people are considerably more likely to be uninsured than those with higher incomes. While a portion of the low-income uninsured are eligible for Medicaid but not enrolled, a substantial share are excluded from Medicaid coverage by program eligibility rules that reflect policy choices at both the federal and state level.

2106-fig1.gif

At the federal level, eligibility policy choices are reflected in the authorization of federal Medicaid matching funds (on an open-ended basis) for the costs incurred by a state in paying for covered services on behalf of certain low-income individuals. Federal Medicaid matching funds are available to states for the costs of covering some categories of individuals but not others. If federal matching funds are not available for a particular category, it is unlikely that a state will extend Medicaid coverage to those categories of individuals, because the state would then bear the costs of care entirely at its own expense.

At the state level, eligibility policy choices are reflected in state decisions as to which optional eligibility categories and which income and resource criteria to adopt. There are certain eligibility groups — for example, pregnant women with family incomes at or below 133 percent of the federal poverty level ($1,513 per month for a family of three in 1998) — that all states opting to participate in Medicaid must cover. In addition, there are other categories for which states may receive federal matching funds if they choose to extend Medicaid coverage. However, the availability of federal matching funds for a particular category of individuals does not necessarily mean that a state will cover that category, since the state must still contribute its own matching funds toward the costs of coverage.

The terms on which federal Medicaid matching funds are available to states include five broad requirements relating to eligibility: categorical; income; resources; immigration status; and residency. Two of these broad requirements — income and resources — are financial in nature. The other three — categorical, immigration status, and residency — are non-financial. In order to qualify for Medicaid, an individual must meet both its financial and non-financial requirements.

Within each of these five broad requirements are “mandatory” and “optional” elements. It is important to understand the context in which these terms are used. State participation in Medicaid is voluntary, not mandatory. The federal government makes Medicaid matching funds available on an open-ended, entitlement basis to states that elect to participate in the program. In order to participate, states must offer coverage for basic benefits to certain populations — e.g., medically necessary physician and hospital services to certain low-income families and children.

States receive federal Medicaid matching funds for at least 50 percent and as much as 80 percent of the costs of this mandatory coverage, depending on the state. In exchange, states are also able to draw down federal Medicaid matching funds at the same rate for optional populations and services such as the low-income elderly and disabled at risk of nursing home and other expensive long-term care services. Similarly, within each of the five major eligibility requirements there are minimum policies states must follow and there are more expansive policies that states may adopt. According to the Health Care Financing Administration, 55 percent of all Medicaid spending paid for optional populations or optional services.7

A child or adult who establishes Medicaid eligibility is not, on the basis of that initial determination, entitled to maintain eligibility indefinitely. Federal Medicaid regulations require that states redetermine eligibility of a Medicaid beneficiary at least once every 12 months. This redetermination, like the original determination, is designed to ensure that a beneficiary continues to meet each of the financial and non-financial requirements for eligibility. Those beneficiaries, who due to a change in income, resources, or family composition no longer meet the eligibility requirements of their state through any pathway, lose their entitlement to Medicaid. There are some limited exceptions for certain categories such as pregnant women, who are entitled to continue Medicaid coverage for 60 days post-partum regardless of any change in financial or non-financial circumstances.

Fluctuations in monthly income are common among low-income families. These changes can lead to the loss of Medicaid coverage by a child or family whose income may spike during one part of the year but spends most of the year earning under the federal poverty level. This occurs commonly in states that use 1-month, 3-month, and 6-month redetermination periods. To address eligibility “churning,” the Balance Budget Act of 1997 gave states the option of extending Medicaid coverage with federal matching funds to children under 19 for a period of up to 12 months after the initial determination of eligibility regardless of any change in financial or non-financial circumstances that would otherwise make them ineligible. This option does not extend to low-income adults with dependent children.

Medicaid does not require that an individual who meets its categorical, income, resource, immigration status, and residency requirements also be uninsured. Medicaid treats insurance coverage as a payment source, not as an eligibility criterion. More specifically, private insurance coverage under Medicaid is a type of “third party liability” that the program uses to reduce its costs of coverage. In most cases, when a Medicaid beneficiary also has private coverage, the private insurer must pay first. Then Medicaid will pay for Medicaid-covered services for which the private insurer is not obligated to pay. This policy stands in sharp contrast to the approach taken under the new Child Health Insurance Program (CHIP), under which states are expressly prohibited from using federal CHIP matching funds to pay for services to children with private health insurance.8

Unlike employer-based insurance coverage, Medicaid eligibility is not directly tied to employment for many of the Medicaid coverage categories. For example, a pregnant woman whose income is equal to or less than 133 percent of the federal poverty level is eligible for Medicaid coverage in every state whether or not she worked before or during her pregnancy. On the other hand, as a result of the 1996 welfare law, a state has the option to deny Medicaid eligibility to non-pregnant women with dependent children with respect to whom the state has terminated cash assistance for refusal to work (states are not permitted to terminate Medicaid coverage to children for this reason).

The earnings flowing to an individual or a family from work will affect income eligibility for Medicaid. At income levels near Medicaid eligibility thresholds, a small increase in earnings can result in a loss in Medicaid eligibility even though the increase in earnings may not be sufficient to enable the worker to afford private health insurance coverage. To mitigate this disincentive to work or to increase the hours worked, states are required to extend “transitional” Medicaid coverage for up to one year to women (and their dependent children) who lose cash assistance due to earnings.

Figure 2: Major Medicaid Eligibility Pathways for Selected GroupsMandatory Coverage Optional Coverage Low-income Children Primary Pathways Infants under age 1 with income < 133% FPL Infants under age 1 with income < 185% FPL Children age 1 to 6 with income < 133% FPL Children age 1 to 6 with income < 185% FPL Children age 6 to 15 with income < 100% FPL Children age 6 to 15 with income < 133% or 185% FPL Section 1931 children Targeted low-income children (CHIP children) Children in welfare-to-work families Transitional coverage for children in welfare-to-work families Title IV-E foster care children Non-Title IV-E foster care children Title IV-E adoption assistance children Non-Title IV-E adoption assistance children Other Pathways Medically needy Ribicoff children Children with Disabilities Primary Pathways Supplemental Security Income (SSI) recipients Katie Beckett children Home or community-based waiver children Other Pathways SSI recipients as of 8/22/96 Medically needy Pregnant Women Primary Pathways Pregnant women with income < 133% FPL Pregnant women with income < 185% FPL Other Pathways Medically needy Low-Income Adults Primary Pathways Certain adults in low-income families with children Adults in two-parent households with dependent children Other Pathways Medically needy COBRA continuation beneficiaries Return to top

Medicaid Eligibility for Families and ChildrenPolicy Brief Part 1 Part 2 Part 3 Part 4 Part 5

Participation in Welfare and Medicaid Enrollment

Published: Aug 30, 1998

Part 2

In addition to the state exit studies,24 another source of evidence about the impacts of loss of cash assistance can be found in the set of evaluations of the impacts of welfare-work initiatives. Several program evaluations contain data which may suggest that one unintended consequence of state efforts to increase employment among families receiving assistance could be a decline in health care coverage:

  • The National JOBS Program Evaluation measured the impacts of employment efforts at a set of sites around the country using experimental design, where one set of families were subject to program participation requirements and another set were not. Three sites operated a “labor force attachment” model, focusing on rapid job placements. In those sites, two years after families entered the study, the employment rates were higher for the experimental group (42.5% versus 34.4% for a control group) but the percent covered by Medicaid or private health insurance during the month before the survey was lower for the experimental group (77.4% versus 82.7% for the control group.) Thus, the focus on rapid employment had led to an eight percentage point increase in the number of families with employment, but a five percentage point decline in the number covered by either Medicaid or private health insurance.25
  • In Florida’s Project Independence, 45% of a sample of those subject to Project Independence requirements were employed at some point in a two-year period and their most recent job did not provide health benefits; for the control group, the comparable figure was 37%.26
  • The Riverside County GAIN Program has often been recognized for its large impacts in raising employment rates among those subject to its requirements. The evaluation of the program found that in a survey interview two to three years after orientation, 27% of those subject to program requirements (as compared with 18% of members of a control group) reported that Medicaid or other health insurance did not personally cover them.27

Thus, in each of these instances, the program was successful in raising employment entries, but one unintended consequence was a decline in health care coverage for affected families.

3. Findings from State Benefit Termination/Sanction Studies Concerning Medicaid Consequences of Loss of AFDC/TANF

Another set of studies focus specifically on families losing assistance due to sanctions. As noted, until fairly recently, state sanction policies only terminated assistance to the parent rather than to the entire family when a single parent failed to comply with program requirements, but in the last years of AFDC, states began to make use of full-family terminations, and under TANF, such policies have become widespread. The use of full-family terminations has raised many questions about the impacts of such policies on the well-being of parents and children, though to date, there are only a handful of studies that expressly look at the impacts of such terminations.

When a sanction occurs, it is possible that the parent’s Medicaid coverage is being terminated as a matter of sanction policy, but under the law applicable both before and after TANF, the imposition of the penalty on the parent should not have affected the childrens’ Medicaid coverage.

One of the first indications that loss of cash assistance might be associated with loss of Medicaid came in a review issued by the General Accounting Office of early state experiences with benefit terminations. At the time of the report (May 1997) most states did not have significant numbers of benefit terminations for noncompliance with program rules. Three states with early experiences were Massachusetts, Iowa, and Wisconsin. In each of these three states, the level of Medicaid coverage fell substantially after benefit termination. Surveys conducted in the range of two to five months after termination of benefits showed:

  • in Massachusetts, the share of families in which at least one family member received Medicaid fell from 100% to 58.5%;
  • in Wisconsin, the share of families in which at least one family member received Medicaid fell from 100% to 53.5%;
  • in Iowa, the share of families in which at least one family member received Medicaid fell from 86.3% to 54.4%.

Declines were also seen in food stamp receipt. The GAO noted that “officials in all three states expressed surprise at the amount of the decline in receipt of food stamps and Medicaid among households losing AFDC benefits.”28

Iowa engaged in a more detailed study of families whose assistance was denied or terminated for failure to comply with requirements to enter into or follow through with a Family Investment Agreement (FIA).29 Data in that study suggests that in about one-third of sanctioned families, neither the parent nor children were receiving Medicaid, and that in about 28% of sanctioned families, neither the parent nor children were receiving either Medicaid or employer-based coverage. As Iowa’s program was originally designed, a family that did not comply with requirements would enter into a “Limited Benefit Plan,” in which the family would receive the same level of assistance for a three month period, receive reduced assistance for another three months, and then enter into a six month period of ineligibility; during this time, the family should have remained Medicaid-eligible if financially eligible, although families entering employment while subject to a Limited Benefit Plan (LBP) would not qualify for transitional Medicaid. The evaluation included a survey of families in Months 10 or 11. By that point, most (52.6%) families whose assistance was terminated under the LBP rules had been employed at least once since losing cash assistance. For those who had been employed, their most recent job had offered health insurance in 36% of the cases, though only 11% of the employed had actually received employer-based insurance.30 In total, then, about 5.6% of respondents (10.6% of the 52.6% who had entered employment) were receiving employer-based health coverage, and a total of 66.4% of respondents were receiving Medicaid. Thus, it appears that about 28% of those under sanction were not receiving either Medicaid or employer-based health care coverage.

An even larger drop in Medicaid receipt after sanctioning was found in Michigan. Michigan conducted a study examining the first 168 cases that received full-family sanctions when Michigan began to implement such sanctions in April 1996. Of the cases, almost a quarter (24%) were either reopened or in pending status. However, of those still closed, 41% were not active for Medicaid.31 Michigan officials note, however, that the sanction population may be significantly different from the overall population receiving cash assistance, and that the growth in the average number of individuals receiving Medicaid through Michigan’s transitional Medicaid program and Healthy Kids program in 1998 substantially exceeds the reduction in the number of individuals receiving TANF assistance.

C. Why would exiters lose Medicaid?

The exit/sanction studies make clear that a substantial share of children and parents leaving AFDC/TANF lose Medicaid, either immediately or in a short period of time. The studies do not, however, offer any explanation of why this Medicaid drop occurs. There are several possible explanations and different explanations may apply to different states or even to different offices. In addition, whatever the reasons for the drops in enrollment under prior law, a state wishing to prevent this result can, to a significant extent, prevent comparable drops under TANF through the state’s choices in implementing Section 1931 eligibility.

Some of the possible reasons for the drop in Medicaid enrollment after leaving AFDC/TANF are:

  • Family members may no longer be eligible. This is less likely to be the explanation for younger children, though it may explain some of the drop for parents and older children. As noted, the principal pathway to continued eligibility for parents and older children has been transitional Medicaid. However, under AFDC, transitional Medicaid would only have been available to those leaving AFDC due to employment or child or spousal support, and families often exit for other reasons. If the family did not exit due to employment, the family’s subsequent employment would not be sufficient to result in eligibility for transitional Medicaid. Even if the family exited AFDC due to employment, the family might not have qualified for transitional Medicaid if, for example, the family had not received AFDC for at least three of the last six months before exiting due to employment. And, once the family begins receiving transitional Medicaid, the family may lose eligibility for various reasons.32
  • Family members may not seek transitional Medicaid because they do not know about it. In South Carolina’s most recent exit study, 84% of respondents knew that children could continue to get Medicaid after leaving welfare but only 55% knew that adults who left welfare for work might continue to get Medicaid. Under the law, a state has an obligation to determine continuing eligibility even if the family does not request it, but a parent who does not know about transitional Medicaid may not understand the importance of reporting that she is leaving assistance due to employment.
  • States may not code families as leaving assistance due to employment although that is the reason for the exit. For example, in Maryland’s exit study (which does not provide information on health care coverage), 11.2% of a sample of closed cases had been coded as closed because “payee started work or has higher earnings” while state employment and wage data indicated that at least half of payees were working in the quarter in which they left assistance.33
  • State procedures may erroneously terminate Medicaid or not provide for an effective mechanism to determine continuing eligibility. For example, North Carolina officials recently announced their intention to investigate whether local social services workers erroneously cut off Medicaid for 24,000 children who were no longer receiving Medicaid two months after their family stopped receiving TANF.34
  • Parents may be discouraged or confused after loss of TANF assistance. Several researchers who were involved in conducting exit studies raised the possibility that after TANF assistance was terminated, families might fail to provide needed information for Medicaid redeterminations or choose not to do so because they wanted no further contact with the state or might even be confused as to whether Medicaid for family members had been terminated. A recent review of the impact of federal welfare changes on Medicaid noted that several states had acknowledged that problems in the redetermination process could be impacting Medicaid continuations.35

Whatever the reasons under prior law, it is important to appreciate that at least some of the drop-off in Medicaid enrollment can be prevented through attention to state administrative procedures and by state choices in implementing the Section 1931 eligibility criteria.

In attending to administrative procedures, a state can focus on outreach efforts and on attention to those stages at which drop-off or non-enrollment is most likely to occur. For example:

  • Massachusetts indicates that in the last two years, the state has expanded automatic enrollment of closed AFDC/TANF cases into the MassHealth (Medicaid) Program to extend to all closed AFDC/TANF case closings. In addition, the state indicates that it has undertaken an extensive marketing campaign to inform low income families about the availability of health insurance through the MassHealth Program, and has begun an automated outreach process to recipients denied eligibility for TANF at the point of application for assistance.
  • South Carolina indicates that after becoming aware of initial evidence of problems in ensuring uninterrupted Medicaid coverage, the state took measures to improve receipt of Medicaid for eligible families. The agency began showing a videotape to recipients to explain how and when support services continue after closure of the welfare case. Case managers were instructed to question clients who request voluntary closure of assistance cases to determine if the client had become employed; if earnings were verified, the case would be closed for earnings rather than voluntary closure so that the family could qualify for transitional benefits. The state’s efforts may have resulted in increased awareness of the availability of continued Medicaid benefits; in quarterly surveys, the share of respondents indicating awareness that children could continue to get Medicaid after leaving welfare increased from 79% to 84% between the first and third surveys; the share indicating awareness that adults leaving welfare for work may continue to get Medicaid increased from 40% to 55%.36
  • Indiana indicates that it has initiated an extensive outreach effort for Medicaid-eligible children that includes efforts to enroll children through sites such as health clinics, day care centers, schools, hospitals, and that the state has begun planning a strong media campaign for its outreach.37

As noted earlier, under Section 1931, a family’s Medicaid eligibility no longer is based on whether the family receives TANF and a state is free to broaden the effective income and resource rules that determine eligibility under Section 1931.38 Thus, if a state wishes to ensure that family members continue to be eligible for Medicaid after entering low-wage employment, the state may do so under Section 1931. A continuation of Section 1931 eligibility for those entering low-wage jobs would address some of the problems presented by the eligibility restrictions and administrative requirements of transitional Medicaid.39 Moreover, it could help to address the problems presented by the limited receipt of employer-based health care for families exiting TANF due to employment.

The TANF exit studies underscore the importance of using Section 1931 to broaden Medicaid eligibility for working poor families. Without such a broadening of eligibility, it seems likely that one consequence of TANF implementation will be fewer families receiving TANF, more families engaged in employment, and yet reduced health care coverage for poor parents and children.

This paper was prepared for the Kaiser Commission on Medicaid and the Uninsured by Mark Greenberg, Center for Law and Social Policy. The author would like to thank the Kaiser Family Foundation for their support of this project and Cindy Mann, Jocelyn Guyer, and all state officials who reviewed and commented on this paper.

1 A set of eligibility rules limited when and how long families could qualify for transitional Medicaid. Among the most significant, the family must have received AFDC for three of the last six months before exiting due to hours of employment, earnings, or loss of AFDC earnings disregards; and, in order to receive transitional Medicaid for the entire twelve months, the family would need to meet quarterly reporting requirements, maintain employment and have earnings not exceeding 185% of poverty. For a detailed discussion of transitional Medicaid rules under AFDC, see Greenberg, The JOBS Program: Answers and Questions (2nd ed., Center for Law and Social Policy, 1992), pp. 245-263.

2 More precisely, the income and resource requirement is that the individual must meet the income and resource standards for determining AFDC eligibility under the State AFDC Plan in effect on July 16, 1996, using the income and resource methodologies under that plan. The family composition rules are the AFDC definition of “dependent child” and the AFDC listing of the relatives living with a dependent child who could qualify for assistance. As a practical matter, single parent families and two-parent families that met prior AFDC-UP or AFDC-Incapacity rules will meet the family composition rules States wishing to broaden the circumstances under which two-parent families meet the family composition rules may do so by modifying the definition of when a two-parent family is considered to be “unemployed.” See 63 Fed. Reg. 42270-75 (August 7, 1998).

3 The law allows a state to: lower its income standards, but not below the standards applicable under its AFDC state plan on May 1, 1988; increase its income or resource standards by an amount not exceeding the Consumer Price Index; use “less restrictive” income and resource methodologies than those used under the plan as of July 16, 1996; and if the state had had an AFDC waiver that had the effect of expanding Medicaid eligibility, the state may elect to continue that policy for Section 1931 purposes even after the time that the waiver would have expired.

4 See Peller and Shaner, Medicaid Eligibility Standards for Low-Income Families and Children: State Implementation of the Personal Responsibility and Work Opportunity Reconciliation Act of 1996 (American Public Welfare Association, May 1998).

5 For example, a study of the caseload decline in Alabama concluded that the most important variable in explaining the decline was a reduction in the percentage of applications that were approved for assistance, with the percentage of approvals falling from 63% to 46% over an eighteen month period. Dawson, Demystifying the Caseload Reduction (Alabama Arise, 1997).

6 The HHS Temporary Assistance for Needy Families (TANF) Program First Annual Report to Congress (August 1998) reports that in recent years, the likelihood that an AFDC/TANF adult would be employed in the next year has increased. Of adults receiving AFDC in 1991, 18.8% were employed in March 1992; the share of previous-year recipients who were employed the next March increased each subsequent year, reaching 24.6% in 1996 and then increased to 31.5% in 1997.

7 Gallagher, et al., One Year After Federal Welfare Reform: A Description of State Temporary Assistance for Needy Families (TANF) Decisions as of October 1997 (Urban Institute, May 1998), p. V-6.

8 South Carolina Department of Social Services, Division of Program Quality Assurance, Survey of Former Family Independence Clients: Cases Closed During April through June 1997 (June 1998), p 11.

9 The South Carolina figures reported for this most recent period reflect an improvement in health care coverage as compared to earlier periods in which the same questions were asked. South Carolina’s survey is the third in a series of surveys looking at the circumstances of a sample of families after leaving cash assistance. In the first study (focusing on exiters from October-December 1996), 66% of children were covered by Medicaid and 81% had some form of coverage; in the second study (focusing on exiters from January-March 1997), 71% of children were covered by Medicaid and 81% had some form of coverage. As to adults, in the first study, 28% were covered by Medicaid and 47% had some form of coverage; in the second study, 27% were covered by Medicaid and 37% had some form of coverage. See South Carolina Department of Social Services, Division of Program Quality Assurance, Survey of Former Family Independence Clients: Cases Closed During October through December, 1996 (November 1997) and Survey of Former Family Independence Clients: Cases Closed During January through March 1997 (March 1998).

10 Bureau of Business and Economic Research, University of New Mexico, Survey of the New Mexico Closed-Case AFDC Recipients, July 1996 to June 1997 (September 1997).

11 Fein, The Indiana Welfare Reform Evaluation: Who Is On and Who is Off? (Abt Associates, September 1997) at pp. 7-9.

12 At the time of the survey, 64% of respondents not receiving TANF were working, and of those working 62% reported that they were in jobs offering health insurance. However, the survey does not indicate what share of families were actually receiving employment-based health insurance. Fein, The Indiana Welfare Reform Evaluation: Who Is On and Who is Off? (Abt Associates, September 1997) at pp. 7-9.

13 Management Reports and Data Analysis, DSHS Economic Services Administration, Washington’s TANF Single Parent Families Shortly After Welfare: Survey of Families Which Exited TANF between December 1997 and March 1998 (July 1998), supplemented by unpublished responses to survey questions.

14 Some part of the difference between these two figures may be attributable to the possibility that respondents gave different responses to different questions; some part may be attributable to the difference between coverage in current employment and coverage in employment at some point in the prior twelve months.

15 Management Reports and Data Analysis, DSHS Economic Services Administration, Washington’s TANF Single Parent Families Shortly After Welfare: Survey of Families Which Exited TANF between December 1997 and March 1998 (July 1998), supplemented by unpublished responses to survey questions.

16 Among those reporting being worse off, 49% reported no adult heath coverage, and 30% reported no child coverage. Among those reporting being about the same, 36% reported no adult health coverage and 21% reported no child coverage. Among those reporting being better off, 30% reported no adult health coverage and 16% reported no child coverage. Overall, 60% reported being better off, 22% reported being about the same, and 18% reported being worse off. Of those saying they were worse off 52% said they were likely to return to welfare within the next six months.

17 DSHS Economic Services Administration, A Baseline Analysis of TANF One-Parent Families: Findings from 1997 Client Survey (February 1998), at p.6.

18 DSHS Economic Services Administration, A Baseline Analysis of TANF One-Parent Families: Findings from 1997 Client Survey (February 1998), at p.6.

19 ancoske, Kemp and Lindhorts, Exiting Welfare: The Experiences of Families in Metro New Orleans (Welfare Reform Research Project, School of Social Work, Southern University at New Orleans, June 1998).

20 Mancoske, Kemp and Lindhorts, Exiting Welfare: The Experiences of Families in Metro New Orleans (Welfare Reform Research Project, School of Social Work, Southern University at New Orleans, June 1998).

21 Pawasarat, Employment and Earnings of Milwaukee County Single Parent AFDC Families: Establishing Benchmarks for Measuring Employment Outcomes Under “W-2” (University of Wisconsin-Milwaukee, Employment and Training Institute).

22 Pawasarat, Employment and Earnings of Milwaukee County Single Parent AFDC Families: Establishing Benchmarks for Measuring Employment Outcomes Under “W-2” (University of Wisconsin-Milwaukee, Employment and Training Institute). The actual level of non-receipt may be somewhat higher because Medicaid status is not available for 20% of cases in which the family had ceased receiving AFDC and was still receiving Food Stamps. Also, note that the family was coded as receiving Medicaid if any family member received Medicaid.

23 Summary of Surveys of Welfare Recipients Employed or Sanctioned for Noncompliance (March 1998) prepared for Tennessee Department of Human Services by Bureau of Business and Economic Research/Center for Manpower Studies, University of Tennessee, Memphis, Tennessee (March 1998).

24 One additional state study of exiters, from Kentucky, found that almost half of children were reported to have no health care coverage, though the low survey response rate and possible ambiguities in the wording of questions make it difficult to be confident of the survey results. Cummings and Nelson, From Welfare to Work: Welfare Reform in Kentucky (Center for Policy Research and Evaluation, Urban Studies Institute, University of Louisville, January 1998). A telephone survey was conducted in December 1997 of former TANF recipients who had been discontinued between January and November 1997. The response rate was low: only 17% (560 respondents out of 3225 attempts). About half (49%) of respondents reported that they had left assistance because they got a job. The survey asked “Are your children covered by health insurance?” According to respondents, almost half (48%) of children were not covered by health insurance; 49.5% of children were covered. However, there may be some ambiguity as to whether respondents whose children were covered by Medicaid would answer yes to the question. Another question included Medicaid on the list in a question, “Do you currently receive any of the following benefits…?” Only 28.4% of respondents responded yes, but the question could have been interpreted as being directed only at the adult respondent.

25 Executive Summary, The JOBS Evaluation: Early Findings on Program Impacts in Three Sites (U. S. Dept. Of Health and Human Services, 1995), Table ES-1. In sites emphasizing a “human capital development” approach, at the two-year point, the employment impacts were smaller and not statistically significant (35.1% of experimentals and 32.4% of controls were employed); there was also a small, and not statistically significant, difference in the percent covered by Medicaid or private health insurance in the prior month (79.2% of experimentals, 81.8% of controls. A subsequent report provides additional information on employment and other impacts in the JOBS evaluation sites, but the subsequent report does not provide further information on Medicaid/health coverage impacts. See Hamilton, et al., National Evaluation of Welfare-to-Work Strategies, Two-Year Findings on the Labor Force Attachment and Human Capital Development Programs in Three Sites (U.S. Department of Health and Human Services and U.S. Department of Education, December 1997).

26 Kemple, Friedlander, and Fellerath, Florida’s Project Independence: Benefits, Costs, and Two-Year Impacts of Florida’s JOBS Program (Manpower Demonstration Research Corp., 1995), p. 106.

27 Riccio, Friedlander, and Freedman, GAIN: Benefits, Costs, and Three-Year Impacts of a Welfare-to-Work Program (Manpower Demonstration Research Corporation, 1994), p.178.

28 GAO/HEHS-97-74, Welfare Reform: States’ Early Experiences with Benefit Termination (May 1997), pp. 42-43.

29 Fraker, Nixon, Losby, Prindle, and Else, Iowa’s Limited Benefit Plan (Mathematica Policy Research, May 1997), at p. 74. FIA describes the agreement between the individual and state specified goals, activities, and time frames for enacting these goals and the ultimate goal of self-sufficiency.

30 Of the 36.4% who had had health insurance available in their most recent job, 10.^% received the insurance, 10.6% did not receive the insurance due to its costs; and 15.2% did not receive it for another reason. Fraker, Nixon, Losby, Prindle, and Else, Iowa’s Limited Benefit Plan (Mathematica Policy Research, May 1997), at p. 74.

31 Colville, Moore, Smith and Smucker, A Study of AFDC Case Closures Due to JOBS Sanctions, April 1996 AFDC Case Closures (Michigan Family Independence Agency, May 1997).

32 For example, Kentucky officials note that they recently conducted a review of all cases discontinued effective March 1998 for a reason that would result in transitional Medicaid eligibility; 706 cases were identified, and transitional Medicaid had been established in each case. The next month, 51 of those cases were identified as losing transitional Medicaid eligibility, and a review of a random sample of half of those cases found the terminations to be valid, with the most frequent reasons being recipient request for termination, recipient having moved out-of-state, and reinstatement of TANF eligibility.

33 Born, Life After Welfare: Second Interim Report (School of Social Work, University of Maryland, March 1998)., pp. 18-19.

34 See Children’s Loss of Medicaid Probed, Raleigh News & Observer, June 12, 1998.

35 Ellwood and Ku, Welfare and Immigration Reforms: Unintended Side Effects for Medicaid (Health Affairs, May/June 1998, pp. 137, 141).

36 See South Carolina Department of Social Services, Division of Program Quality Assurance, Survey of Former Family Independence Clients: Cases Closed During April through June 1997 (June 1998), p. 20.

37 Most other states responding to a preliminary draft of this report also emphasized ongoing or newly initiated outreach efforts.

38 Technically, the mechanism that a state could use would be to adopt a “less restrictive methodology” for calculating income eligibility for Section 1931-based Medicaid. A state wishing to ensure that low-wage working families retained Medicaid eligibility might provide, for example, that the first $500 (or some other figure) from earnings would not be counted in determining whether the family met the income standards applicable to Section 1931 eligibility. The practical effect of this less restrictive methodology would be a broadening of the circumstances where low-wage working families qualified for Section 1931 Medicaid. For a more detailed discussion of state options in expanding coverage through use of Section 1931, see Guyer and Mann, Taking the Next Step: States Can Now Expand Health Coverage to Low-Income Working Parents Through Medicaid (Center on Budget and Policy Priorities, July 1998), http://www.cbpp.org/702mcaid.html.

39 For example, Washington State has implemented a more generous earned income disregard (50% of gross earnings), more liberal treatment of assets, and broader eligibility for two-parent families under TANF, and has extended those same standards to Section 1931 eligibility. Return to top

Policy Brief Part 1 Part 2Library Index
Sex in the 90s: 1998 National Survey of Americans on Sex and Sexual Health 2

Published: Aug 30, 1998

16. Do you think sex education courses should ONLY teach abstinence — that is NOT having sex until marriage — OR should courses teach about BOTH abstinence AND give teens enough information to help them prevent unplanned pregnancies and the spread of sexually transmitted diseases if they DO decide to have sex?

18 Only abstinence 81 Both 8 Don’t know/Refused 100

17. Do you think that HIGH SCHOOL health clinics should provide young people with condoms and other forms of birth control if students ask for them?

57 Yes 40 No 3 Don’t know/Refused 100

18. In general, at what age do you think most young people have sexual intercourse for the first time?Teens = (13-18) Perceptions Fall 1997 Survey* 15 12 or younger 2 11 13 5 15 14 12 21 15 18 17 16 29 6 17 16 5 18 or older 14 10 Don’t Know/Refused 4 100 100

*PSRA for The Kaiser Family Foundation and YM Magazine

19. When you were growing up, did you have sex education courses in school?

41 Yes 59 No * Don’t know/Refused 100

20. Still thinking back to when you were growing up, would you say you got a lot of information about sex from (INSERT), some, only a little or no information at all?

A lot Some Only a little No info. at all DK/Ref. Did not have sex education in school (Q19) a.Sex education in school Based on total 6 17 16 1 1 59 =100 Based on those who had sexed. in school; n=510 15 43 39 2 1 NA =100 b.Your parents 13 22 27 38 * NA =100

21. Thinking about your (AGE) year old, have you ever talked with him or her about…

Based on parents with at least one child age 8 to 18, (target child chosenrandomly for those with more than one child in age range); n=329

Yes No DK/Ref. a. The basics of reproduction — that is “the birds and bees” 79 21 0 =100 b. HIV/AIDS and other sexually transmitted diseases 80 20 0 =100 c. Issues about relationships and becoming sexually active 63 37 * =100 d. The importance of using protection, such as condoms, to preventpregnancy or disease if they become sexually active 52 48 0 =100

22. When you were growing up did your parents talk with YOU about (INSERT) or not?

Yes No DK/Ref. a. The basics of reproduction — that is “the birds and bees” 41 58 1 =100 b. Sexually transmitted diseases 21 78 1 =100 c. Issues about relationships and becoming sexually active 31 68 1 =100 d. The importance of using protection, such as condoms, to prevent pregnancy or disease if you became sexually active 25 75 * =100

23. Compared to your parents when you were growing up, do you think, (you were/you are/you would be) more open with your child(ren) about sex and sexual issues in general, less open, or about as open as your parents were with you?

79 More open 2 Less open 17 About as open 2 Don’t know/Refused 100

24. Americans have different views about sexual issues. For each of the following statements, please tell me if you strongly agree, somewhat agree, somewhat disagree, or strongly disagree. (First/Next)

Strongly agree Somewhat agree Somewhat disagree Strongly disagree DK/Ref. a. Americans overall are uptight aboutsex and sexual issues 27 36 21 14 2 =100 b. I personally have a hard time talking aboutsex and sexual issues 11 22 25 41 1 =100 c. If Americans were more OPEN talking aboutsex there would be LESS of a problem with unplanned pregnancy and sexually transmitted diseases in this country 41 27 16 14 2 =100 d. Sexual issues are private and should only bediscussed among intimate couples 26 25 25 23 1 =100

25. When you were growing up, did you have sex education courses in school?

85 Long-term monogamous relationships 9 Several relationships with different partners over a life time 6 Don’t know/Refused 100

26. What is your opinion about a married person having sexual relations with someone other than their marriage partner–is it always wrong, almost always wrong, wrong only sometimes, or not wrong at all?

January 1991* 79 Always 71 12 Almost always 17 6 Sometimes 10 2 Not wrong at all 1 1 Don’t Know/Refused 1 100 100

*PSRA for Troika Productions and Lifetime Television

27. For each of the following statements, please tell me if you strongly agree, somewhat agree, somewhat disagree, or strongly disagree.

Strongly agree Somewhat agree Somewhat disagree Strongly disagree DK/Ref. a. In general Americans have a hard timetalking about sex and sexual issues 27 39 19 13 2 =100 b. Making sex a forbidden subject only encouragesyoung people to want to have sex 36 29 18 16 1 =100 c. Sometimes it is harder for couples to TALKabout sexual issues like birth control and sexually transmitted diseases than to HAVE sex 29 38 17 13 3 =100

READ: Now some questions about you . . .

28. How would you rate your SEX life these days? Please use a ten point scale, where ten means great and one means terrible.

15 10 7 9 18 8 11 7 7 6 11 5 1 4 2 3 2 2 8 1 10 Not applicable/Abstinent (VOL.) 100 6.77 Mean 7.00 Median

29. Are you currently married, LIVING AS married, widowed, divorced, separated, or have you never been married?

56 Married 4 Living as married 8 Widowed 10 Divorced 3 Separated 19 Never married * Gay(VOL.) 0 Refused 100

Return to top

Sex In The 90s:Kaiser Family Foundation/ABC Television 1998 National Survey of Americanson Sex and Sexual Health:Survey Part One Part Two Part Three ABC Television

Sex in the 90s: 1998 National Survey of Americans on Sex and Sexual Health – Toplines/Survey

Published: Aug 30, 1998

Sex In The 90s:Kaiser Family Foundation/ABC Television 1998 National Survey of Americans on Sex and Sexual Health

Methodology:The Kaiser Family Foundation and ABC Television 1998 National Survey of Americans on Sex and Sexual Health is a random-sample telephone survey of 1,204 adults 18 and older living in the United States. It was designed by staff at the Foundation and Princeton Survey Research Associates (PSRA) and conducted by PSRA between April 24 and May 10, 1998. The margin of sampling error is plus or minus 3 percentage points.

Questionnaire and Toplines

INTRODUCTION: Hello, my name is _______ and I’m calling for Princeton Survey Research of Princeton, New Jersey. We are conducting a national opinion survey about some important social issues, like health and family.

First, I have some questions about some social issues in this country . . .

1. Unplanned pregnancy and sexually transmitted diseases are bigger problems in the United States than in many other Western countries, and people have many different explanations for why this is so. Please tell me whether YOU think each of the following contributes a lot, some, only a little or not at all to these problems in the U.S.

A lot Some Only a little Not at all DK/Ref. a. A lack of openness about sex and sexual issues 35 34 15 12 4 =100 b. Poverty and poor education 46 29 15 8 2 =100 c. A decline in moral values 65 20 8 5 2 =100 d. Too much casual sex in the movies and on TV 55 25 13 6 1 =100 e. Inadequate sex education in the schools 32 32 20 13 3 =100 2. Do you think the way TV programs show sex and nudity tends to ENCOURAGE irresponsible sexual behavior, DISCOURAGE irresponsible sexual behavior, or don’t you think it has much effect on people’s sexual behavior?

74 Encourages irresponsible sexual behavior 3 Discourages irresponsible sexual behavior 20 No effect 3 Don’t know/Refused 100 3. In your opinion, if TV characters in entertainment programs are talking about or engaging in sexual activity, should they talk about condoms or make other references to “safer sex,” or NOT?

77 Should 18 Should not 5 Don’t know/Refused 100

4. How well do you think the way sex is usually shown on TV and in the movies reflects your own sex life?Would you say . . .

3 Very well 16 Somewhat well 23 Not too well 50 Not well at all 8 Don’t know/Refused 100

5. To what extent do you think TV and movies send the message that. . . (INSERT). Do you think TV and movies send this message a lot, somewhat, only a little, or not at all?

A lot Some Only a little Not at all DK/Ref. a. To have a great sex life you must changepartners often 41 29 14 14 2 =100 b. You can have spontaneous sex without worryingabout the consequences 53 25 11 9 2 =100 c. Only thin, beautiful people can have great sex 53 22 8 14 3 =100 d. Older adults can have great sex 14 31 33 19 3 =100 e. To have a “normal” sex drive means alwaysbeing in the mood for sex 41 31 13 12 3 =100 READ: On a different topic . . .

6. Do you have any children — either adult children or children who are still growing up?

70 Yes, have children 30 No children * Refused 100

7. Are any of your children age 18 or under?

40 Yes, have children age 18 or under 30 No children under 18 0 Don’t know/Refused 30 Have no children at all/DK/Ref 100

8. Starting with the older, please tell me the ages of your children who are age 18 or under.RESULTS NOT REPORTED

AGE OF TARGET CHILD:

49 8-12 51 13-18 100 READ: Please answer the next few questions thinking about your (AGE) year old . . .

9. Have you ever had a conversation about a sexual issue with your (AGE) year old because of something one or both of you saw . . .

Based on parents with at least one child age 8 to 18, (target child chosen randomly for those with more than one child in age range); n=329

Yes No DK/Ref. a. On the news 63 36 1 =100 b. On a television show 70 30 0 =100

10. Thinking about the last time you had a conversation because of something you saw on television, which comes closer to how you felt …

Based on parents who had a conversation about a sexual topic with target child because of something on TV; n=257

65 It was a good opportunity for you and your child to talk about sexual issues 31 It raised a sexual issue you did not want to talk about with your child at that time 4 Don’t know/Refused 100 11. Thinking about sexual content on television. . . Have you ever (INSERT) because of sexual content you saw (on TV)?

Yes No DK/Ref. a. Q11a based on parents with at least one child age 18 or under; n=491Not allowed (one of your children/your child) to watch a certain show 76 24 * =100 b. Q11b-f based on totalTurned off the television 60 39 1 =100 c. Talked to a health care provider about a sexual topic 46 52 2 =100 d. Talked to a health care provider about a sexual topic 9 91 0 =100 e. Had a conversation with a sexual partner about a sexual topic 44 54 2 =100 f. Tried something new sexually 13 85 2 =100

READ: Next I have some questions about sex education . . .

12. In general would you say that young people today get information about sex and birth control at…

22 About the right time 24 Too soon 47 Too late 7 Don’t know/Refused 100

13. In general do you SUPPORT or OPPOSE sex education courses being taught to . . .

Support Oppose DK/Ref. a. High school age students — that is children age 15 to 18 85 12 3 =100 b. Junior high school age students — that is children age 12 to 14 76 21 3 =100 c. Elementary school age students — that is children 6 to 12 35 60 5 =100

14. If sex education is taught in HIGH SCHOOLS, do you think it should or should not…

Should Should Not DK/Ref. Sex education should not be taught at all a. Tell young people NOT to have sexualintercourse before marriage? 68 27 4 1 =100 b. Tell young people who ARE sexually activeto use protection, such as condoms, to prevent against pregnancy and disease? 92 5 2 1 =100 c. Teach the basic facts of human reproduction? 94 4 4 1 =100 d. Discuss how to know when you are readyto have sex? 74 19 6 1 =100 e. Discuss how to talk about sex with a partner? 74 21 4 1 =100

15. Some people believe that whether or not young people are sexually active, they should be given information to protect themselves from unplanned pregnancies and sexually transmitted diseases. Others believe that telling young people about birth control and sexually transmitted diseases only encourages them to have sex. Which come closer to your view?

83 They should be given information 14 Information only encourages them to have sex 3 Don’t know/Refused 100

Return to top

Sex In The 90s:Kaiser Family Foundation/ABC Television 1998 National Survey of Americanson Sex and Sexual Health:Survey Part One Part Two Part Three ABC Television

Participation in Welfare and Medicaid Enrollment

Published: Aug 30, 1998

This paper examines Medicaid enrollment and its relation to the rise and fall of enrollment in Aid to Families with Dependent Children (AFDC) or Temporary Assistance to Needy Families (TANF) programs.

Poll Finding

Summary of Findings: Privatization of Public Hospitals

Published: Aug 30, 1998

This Summary presents background, findings, and data from the Economic and Social Research Institute’s (ESRI) full report, Privatization of Public Hospitals. Section I provides background about public hospital conversions, including the role of public hospitals, reasons for conversion, the mechanisms of conversion and new ownership entities, and analysis of national and regional public hospital data. Section II provides a discussion of the five case studies of public hospital conversions and the key findings from the case studies. Attachment A is a table of public hospital conversions and closures by region and state.

Medicaid Eligibility for Families and Children

Published: Aug 30, 1998

Part 5

Appendix Table 1: Medicaid Eligibility Levels for Pregnant Women and Children Pregnant Women, Infants and Children(as of May 20, 1998) Other Eligibility Categories Pregnant Women and Infants Children Under Age 6 Children Ages 6 to 14 Children Ages 14 to 19 Asset Test Required for Children (4) Max. AFDC Payments (7/16/96) (5) Medically Needy, 1996 (percent of Federal Poverty Level) United States 133 133 100 45 49 Alabama 133 133 100 100 No 15 N/A Alaska 133 133 100 90 No 76 N/A Arizona 140 133 100 30 No 32 N/A Arkansas (2,3,4) (133) (200) 200 200 200 Yes 19 25 California (1) 200 133 100 100 No 56 86 Colorado (1,4) 133 133 100 37 Yes 39 N/A Connecticut 185 185 185 185 No 81 71 Delaware 185 133 100 100 No 31 N/A District of Columbia 185 133 100 37 No 37 N/A Florida (1) 185 133 100 100 No 28 28 Georgia 185 133 100 100 No 39 35 Hawaii 185 133 100 100 No 57 57 Idaho (4) 160 160 160 160 Yes 29 N/A Illinois 200 133 130 133 No 35 45 Indiana 150 133 100 100 No 27 N/A Iowa (4) 185 133 100 37 Yes 39 52 Kansas 150 133 100 100 No 40 44 Kentucky 185 133 100 46 No 49 28 Louisiana 133 133 100 17 No 18 N/A Maine 185 133 125 125 No 51 42 Maryland (2) 185 185 185 33 No 34 40 Massachusetts (1) 185 133 133 133 No 52 72 Michigan 185 150 150 150 No 45 52 Minnesota (3) 275 275 275 275 No 49 66 Mississippi 185 133 100 32 No 34 N/A Missouri 185 133 100 100 No 27 N/A Montana (4) 133 133 100 48 Yes 41 46 Nebraska 150 133 100 100 No 34 45 Nevada (4) 133 133 100 31 Yes 32 N/A New Hampshire 300 185 185 185 No 51 60 New Jersey (1) 185 133 133 133 No 41 52 New Mexico 185 185 185 185 No 36 N/A New York (1) 185 133 100 51 No 61 76 North Carolina 185 133 100 100 No 50 34 North Dakota (4) 133 133 100 100 Yes 40 47 Ohio 150 150 150 30 No 32 N/A Oklahoma 185 185 185 185 No 28 42 Oregon (4) 133 133 100 100 Yes 43 57 Pennsylvania (1) 185 133 100 37 No 39 43 Rhode Island (3,4) 250 250 250 250 Yes 51 69 South Carolina 185 150 150 150 No 18 N/A South Dakota 133 133 100 100 No 47 N/A Tennessee (3) 400 400 400 400 No 54 23 Texas (4) 185 133 100 17 Yes 17 25 Utah (4) 133 133 100 100 Yes 53 53 Vermont (3) (200) (225) 225 225 225 No 59 81 Virginia 133 133 100 100 No 22 33 Washington (185) (200) 200 200 200 No 50 62 West Virginia 150 133 100 100 No 24 27 Wisconsin 185 185 100 45 No 48 64 Wyoming (4) 133 133 100 52 Yes 55 N/A SOURCE: Center on Budget and Policy Priorities. 1998 and National Governors’ Association. 1996 and 1997. N/A: No medically needy programNote: The 1998 Federal poverty guideline for a family of three was $13,650; for Alaska $17,070 and Hawaii $15,700.(1) The state operates separate child health insurance programs for children not eligible for Medicaid. Such Programs may provide benefits similar to Medicaid or they may provide a limited benefits package and may include premiums and cost-sharing.(2) Children covered under Medicaid expansion programs in Arkansas and Maryland receive reduced benefits package pursuant to federal waivers.(3) The Medicaid programs in AR, MN, RI, TN, and VT may impose some cost-sharing-premiums and/or co-payments for some children pursuant to federal waivers.(4) The states noted count assets, in addition to income, in determining Medicaid eligibility for children; Utah does not consider assets for young children. An assets test in NOT required in Arkansas for its Medicaid expansion program.(5) The United States figure represents the median maximum AFDC payment level.

Appendix Table 2: Expansion Population Eligibility in State Medicaid Programs Operating Under Statewide Section 1115 Demonstration Waivers*State ExpansionPopulation FamilyIncomeRequire-ment ResourceRequire-ment CategoricalRequire-mentWaived Premium/Cost-Sharing EnrollmentCap Alabama Children aged 6-19 < 133% FPL N/A Change in income requirement No premium/cost-sharing No Women for 24 months post-partuma < 133% FPL Pregnancy Arizona Children up to age 14 < 100% FPL N/A Change in income requirement $1-5 copay, depending on service. No copay for prescription drugs, prenatal care, EPSDT care, nursing facility services, and primary care visits not scheduled by the patient. No Pregnant women and infants < 140% FPL N/A Change in income requirement Arkansas Children up to age 19 < 200% FPL No resource test Change in income requirement $5 copay for prescriptions, $10 copay for outpatient services, percentage copay for hospital per diem No Delaware Low-income children and adults < 100% FPL N/A Changes income requirement for children, waives requirement of pregnancy, disability, or dependent children No premium/cost-sharing No Hawaii Low-income children and adults < 300% FPL < $2,000 for single person, < $3,000 for couple Changes income requirement for children, waives requirement of pregnancy, disability, or dependent children All persons (except pregnant women) making over 100% FPL pay 100% of medical, dental, and catastrophic care premiums. Sliding payment scale for children under 200% FPL. No Kentucky No eligibility expansion Maryland No eligibility expansion Massachusetts Low-income employed < 200% FPL No resource test Dependent child, pregnancy, disability Cost-sharing on a sliding scale based on income No Low-income unemployed < 133% FPL No resource test Dependent child, pregnancy, disability Unemployed persons receiving state or federal unemployment benefits < 400% FPL No resource test Dependent child, pregnancy, disability State ExpansionPopulation FamilyIncomeRequire-ment ResourceRequire-ment CategoricalRequire-mentWaived Premium/Cost-Sharing EnrollmentCap Minnesota Pregnant women and children up to age 19 < 275% FPL No resource test Changes income requirement Premiums range from 1.5 to 8.8% gross income, $4/month premium for families with children < 150% FPL, non-pregnant adults pay 10% of inpatient hospital costs with $1,000 maximum No Planned extension to low-income adults N/A N/A Dependent child, pregnancy, disability New Jersey Low-income individuals < 200% FPL < $7,500 for individual, < $15,000 per family Dependent child, pregnancy, disability Individuals with income below 200% FPL receive fully subsidized care; individuals with income below 300% FPL receive partially subsidized care. No Low-income individuals < 300% FPL < $7,500 resources for individual, < $15,000 per family New York Home Relief population N/A Dependent child, pregnancy, disability No premium/cost-sharing No Women for 24 months post-partuma< 185% FPL Pregnancy Ohio No eligibility expansion Oklahoma No eligibility expansion Oregon Low-income children and adults < 100% FPL < $5,000 Dependent child, pregnancy, disability Cost-sharing on sliding scale for adult, non-pregnant new eligibles. No Rhode Island Pregnant women and children under age 8 < 250% FPL N/A Change in income requirement Individuals with family incomes between 185-250% FPL subject to cost-sharing requirements. No Women for 24 months post-partuma < 250% FPL Pregnancy Tennessee Uninsurable individuals N/A No resource test Dependent child, pregnancy Individuals with family incomes > 100% FPL subject to cost-sharing requirements on sliding scale based on income. Enrollment capped at 1,775,000b Persons ineligible for employer- or government-sponsored health plans No resource test Dependent child, pregnancy, disability Vermont Low-income children and adults < 150% FPL N/A Dependent child, pregnancy, disability No premium/cost-sharing *Based on data collected by the George Washington University Center for Health Policy Research. N/A indicates that this information was not clear based on the information reviewed.a. Only family planning services are covered under this extension.b. Tennessee does not cap enrollment of traditional eligibles meeting the state’s 1993 Medicaid eligibility criteria and uninsurable persons. The enrollment of uninsured persons is limited by the difference between 1,775,000 and the sum of traditional eligibles and uninsurable persons.

1 Thomas Selden, Jessica Banthin, and Joel Cohen, “Medicaid’s Problem Children: Eligible but not Enrolled,” Health Affairs. May/June 1998: 192-200.

2 Medicaid eligibility policy vis-a-vis the disabled and the elderly will be the focus of subsequent analyses.

3 See Lake Snell Perry & Associates, Barriers to Medi-Cal Enrollment and Ideas for Improving Enrollment: Findings from Eight Focus Groups with Parents of Potentially Eligible Children. Kaiser Family Foundation, September 1998.

4 See Kaiser Commission on Medicaid and the Uninsured, “Medicaid Eligibility and Enrollment Projects,” September 1998; Donna Cohen Ross, Child Health Outreach Handbook , Center on Budget and Policy Priorities, July, 1998; Sarah Shuptrine, Vicki Grant, and Genny McKenzie, Southern Regional Initiative to Improve Access to Benefits for Low-income Families with Children, Southern Institute on Children and Families, February 1998.

5 Congressional Budget Office, Behind the Numbers: An Explanation of CBO’s January 1997 Medicaid Baseline, April 1997, p. 7.

6 For detailed state-by-state data on the number and type of beneficiaries covered, see David Liska, Brian Bruen, Alina Salganicoff, Peter Long, and Bethany Kessler, Medicaid Expenditures and Beneficiaries: National and State Profiles and Trends, 1990-1995, Third Edition, Kaiser Commission on the Future of Medicaid, November 1997.

7 Statement of Bruce C. Vladeck, Administrator, Health Care Financing Administration, “1998 Budget for Medicaid and Medicare Part B” presented to the House Commerce Committee, Subcommittee on Health and Environment, February 12, 1997.

8Choices Under the New State Child Health Insurance Program: What Factors Shape Cost and Coverage? Kaiser Commission on Medicaid and the Uninsured, January 1998.

9MCH Update: State Medicaid Coverage of Pregnant Women and Children, National Governors’ Association, September 1997, www.nga.org.

10 See David Super, Sharon Parrott, Susan Steinmetz, Cindy Mann, The New Welfare Law, Center on Budget and Policy Priorities, August 14, 1996, http://www.cbpp.org.

11 For a discussion of eligibility rules relating to two-parent families, see Jocelyn Guyer and Cindy Mann, Taking the Next Step: States Can Now Take Advantage of Federal Medicaid Matching Funds to Expand Health Care Coverage to Low-Income Working Parents, Center on Budget and Policy Priorities, July 1998, www.cbpp.org.

12 63 Fed. Reg. 42270 (August 7, 1998.)

13 Jeff Harris and Jane Horvath, The Administrative Impact of the Medicaid Eligibility Resource Test, Kaiser Commission on the Future of Medicaid, April 1993.

14 Marilyn Moon, The Urban Institute, Asset Limits and Medicaid, Kaiser Commission on the Future of Medicaid, April 1993.

15 See Leighton Ku and Bethany Kessler, The Number and Cost of Immigrants on Medicaid: National and State Estimates, Urban Institute, December 1997. For a discussion of the impact of the welfare law changes on elderly legal immigrants, see Robert B. Friedland and Veena Pankaj, Welfare Reform and Elderly Legal Immigrants, Henry J. Kaiser Family Foundation, July, 1997. For a review of the options remaining to states with respect to coverage of this population through either federally-funded or state-funded programs, see Kelly Carmody, State Options to Assist Legal Immigrants Ineligible for Federal Benefits, Center on Budget and Policy Priorities, February 1998, http://www.cbpp.org.

16 Sara Rosenbaum, Medicaid and Migrant Farmworker Families: Analysis of Barriers and Recommendations for Change, National Association of Community Health Centers, 1991.

17 Guyer and Mann. July 1998.

18www.hcfa.gov/init/chip-map.cfm

19 Guyer and Mann. July 1998.

20 For a summary of the expansion populations covered by some states under section 1115 waivers, see Sara Rosenbaum and Julie Darnell, Statewide Medicaid Managed Care Demonstrations under Section 1115 of the Social Security Act: A Review of the Waiver Applications, Letters of Approval, and Special Terms and Conditions, Kaiser Commission on the Future of Medicaid, May 1997.

21 Under section 1931 of the Social Security Act, States have the option of liberalizing their financial eligibility standards for adults in one-parent and certain two-parent families by adopting “less restrictive” income or resource methodologies. They do not, however, have the option to liberalize the non-financial eligibility rules. In order to receive federal Medicaid matching funds for the coverage of childless non-disabled adults who do not meet these family composition requirements, states must obtain a waiver from the Secretary of HHS under section 1115.

22 Schoen, C., B. Lyons, D. Rowland et al, “Insurance Matters for Low-Income Adults: Results from a Five-State Survey” Health Affairs, Sept/Oct 1997.

23 Selden, Banthin, and Cohen, May/June 1998.

24 See Alina Salganicoff and Patricia Seliger Keenan, Child Health Facts: National and State Profiles of Coverage, Kaiser Commission on Medicaid and Uninsured, January 1998. Return to top

Policy Brief Part 1 Part 2 Part 3 Part 4 Part 5Library Index

The Decline in Medicaid Spending Growth in 1996: Why Did It Happen?

Published: Aug 30, 1998

This paper provides an overview of Medicaid spending growth in 1996. It updates earlier analyses conducted by the Kaiser Commission on Medicaid and the Uninsured.

Medicaid Eligibility for Families and Children

Published: Aug 30, 1998

This paper provides an overview of Medicaid eligibility policy and examines two groups of Americans in particular – low-income children and nondisabled adults under 65 – and summarizes the statutory and regulatory pathways to Medicaid eligibility available to them as individuals. The paper concludes with a discussion of policy options available to states under current law for increasing Medicaid eligibility for these two groups.

How Well Does the Employment-Based Health Insurance System Work for Low-Income Families? – Issue Paper

Published: Aug 30, 1998

How Well Does the Employment-Based Health Insurance System Work for Low-Income Families?

September 1998

Most Americans receive health insurance coverage through the workplace. Unfortunately, however, many workers are left out, especially low-wage workers and their families. Being a low paid worker does not mean just that wages are low. It also means a lower likelihood of receiving health insurance protection on the job. Low-wage workers have never been as likely as the better paid to get coverage from their employers. And, as employers try to limit what they spend on coverage, the gap is growing worse. Although recent employer actions have reduced coverage for workers at all wage levels, low-wage workers have been the hardest hit.

Medicaid has made an enormous difference to health insurance protection for low-income families. But Medicaid eligibility is limited to the poorest of the poor, especially mothers and children. Although Medicaid has been expanded in recent years to reach near-poor pregnant women and children, many low-income working families have not been eligible for coverage. Employer protection is therefore critical for workers with low and modest incomes.

The purpose of this Issue Paper is to describe the nature of employer coverage; its decline, especially among low-wage workers and low-income families; and the factors that are undermining its reach. In summary, this paper documents the following:

Low wage workers are least likely to have employer coverage.

  • Whether they work in large or small firms, low-wage workers are far less likely than the better paid to have employer coverage. Although 90% of the highest wage workers had employment-based health insurance in 1996, only 42% of the lowest wage workers were covered.
  • The primary reason low-wage workers lack coverage is that their employers do not offer them health insurance benefits. Despite substantial costs, most low-wage workers (76% in 1996) participate in employer plans to which they have access.

As coverage has declined, the gap between high wage and low wage workers has grown.

  • Between 1987 and 1996, the proportion of workers with employer coverage fell by 3 percentage points, with the decline in coverage concentrated on the lowest wage workers. Coverage declined by 12 percentage points among the lowest wage workers, while coverage among the top wage earners increased by 3 percentage points. As a result, the gap in coverage between high-wage and low-wage workers has grown.

The decline in coverage for low-wage workers is a function of the decline in employer offerings and participation.

  • The proportion of low-wage workers with access to employer coverage declined 5 percentage points between 1987 and 1996 and the participation rate dropped by 13 percentage points. By contrast, access for high-wage workers improved.
  • The fall in participation for the lowest wage workers coincided with the deterioration in wages for these workers. From 1989 to 1996, the real hourly wage of the typical (median) worker fell 5.2%. Among low-wage men (20th percentile), wages declined even more- by 6.4%. Increases in employees’ contributions to premiums have therefore had a disproportionate effect on low wage workers.

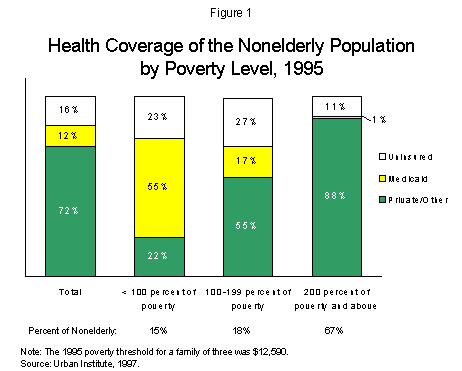
Who’s Covered and Who’s Left Out? The large majority of Americans have some kind of private or public health insurance, but more than 41 million nonelderly Americans are uninsured. Since almost all Americans over age 65 are covered by Medicare, lack of insurance is primarily a problem for working age adults and for children. In 1995, about 72% of the nonelderly had private health insurance (mostly employer coverage and some private, nongroup coverage) and 12% were covered by Medicaid. Approximately 16% of the nonelderly were uninsured [Figure 1].1

Whether individuals have any insurance coverage and what kind of insurance they have are closely related to family income. Over half of the uninsured are in families with incomes below 200% of poverty. In 1995, 88% of individuals in families with incomes above 200% of poverty had private (primarily employer-sponsored) health insurance and only 11% were uninsured. Not surprisingly, health insurance coverage for poor families looks very different. Only a small proportion of poor families (with incomes below 100% of the federal poverty level) have employer coverage. A large proportion are covered by Medicaid, but a substantial proportion remain uninsured. In 1995, 55% of individuals in poor families were covered by Medicaid and only 22% had private insurance. Despite Medicaid’s substantial contribution, however, 23% of the poor lacked health insurance [See Figure 1].

2107-fig1.gif

Near-poor families (those with incomes between 100-199% of poverty) are somewhat worse off than poor families with respect to health insurance coverage. Affordable private health insurance is only available to individuals in near-poor families if it is employer-sponsored. Only 55% of individuals in near-poor families had private (primarily employer-sponsored) insurance in 1995, compared to 88% of individuals in families with incomes above 200% of poverty. For certain groups, such as pregnant women and children, Medicaid has played a strong role, but Medicaid’s income and categorical restrictions result in limited coverage of the near-poor–only 17% of individuals in near-poor families had Medicaid coverage. As a result, 27% were uninsured [See Figure 1].

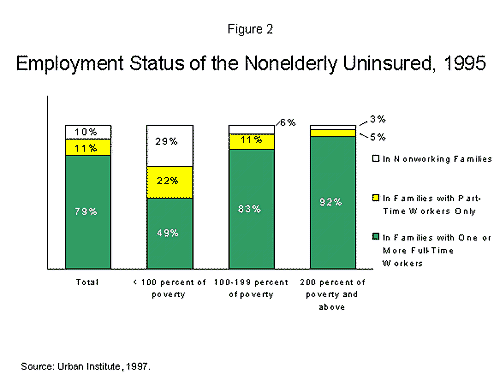
Lack of insurance does not mean that the poor and near-poor are not working. Rather, the vast majority of the uninsured are workers or are in working families. In 1995, most uninsured adults and children–79 percent–lived in families where there was at least one full-time worker. Another 11% lived in families where there was at least one part-time worker. Only 10% of the uninsured lived in families where there were no employed adults [Figure 2]. The same is true even of the poor and near-poor uninsured. Among the near-poor, the proportion of uninsured who are in full-time workers’ families (83 percent) is nearly as high as among higher income workers (92 percent). The differences in their insurance coverage are therefore not explained by substantially different levels of employment.

2107-fig2.gif

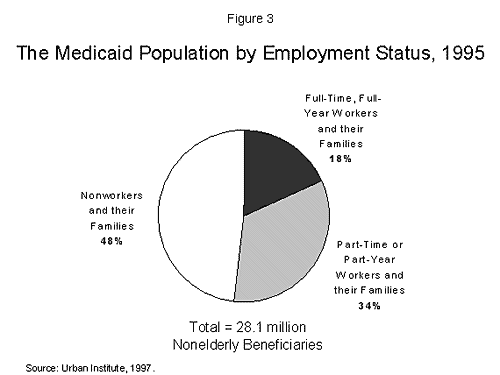
Although Medicaid’s coverage of the near-poor is limited by its eligibility criteria, many working families do qualify for Medicaid. About half of Medicaid’s nonelderly beneficiaries (low-income, working age adults and children) are in working families. In 1995, 18% of Medicaid’s nonelderly beneficiaries were in families where the family head worked full-time and full-year, while 34% were in families where at least one adult worked part-time or part-year [Figure 3].

2107-fig3.gif

Why Don’t Low-Income Families Have Employer Coverage?

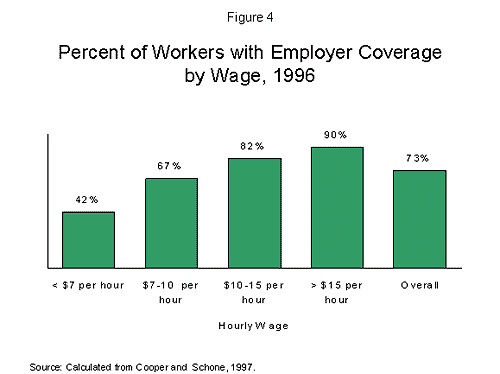
Since most of the uninsured and half of low-income adults and children with Medicaid coverage are in working families, an important question is why so many low-income working families lack employer coverage. There are a number of factors associated with jobs without health care coverage, but a key factor is low wages. Figure 4 presents data on employer coverage rates for workers differentiated by wage.2 These data show there is a strong positive relationship between wages and health insurance coverage. In 1996, 90% of workers who earned more than $15 per hour had employer coverage, while only 42% of workers who earned less than $7 per hour had employment-related health insurance.

2107-fig4.gif

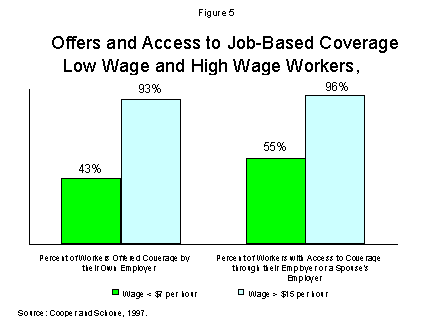
The primary problem for low-wage workers is that their employers not only pay them low wages, but they also offer them lower nonwage compensation-including health insurance and pensions.3 In 1996, only 43% of workers who earned less than $7 per hour were offered health benefits by their employer, compared to 93% of workers who earned more than $15 per hour [Figure 5].

Uninsured low wage workers, like all uninsured workers, are in large as well as small firms, and are in firms that offer coverage to none of their workers as well as firms that offer coverage to some. Although data make it difficult to distinguish precisely between these categories, an estimate from available data suggests that uninsured workers are about equally split between firms that do not offer coverage and firms that offer coverage to some workers.4

Unfortunately, many low-wage employees offered limited benefits do not have alternative access to employment-based coverage through a spouse or other family member. Even when other sources of insurance are taken into account, the gap between low and high-wage workers is still quite large. In 1996, 55% of low-wage workers had access (through their own employer or a family member’s employer) to employer coverage, compared to 96% of high-wage workers [See Figure 5].

2107-fig5.gif

Return to top

How Well Does the Employment-Based Health Insurance System Work for Low-Income Families?Policy Brief Part 1 Part 2 Part 3