The Effects of the Medicaid Expansion on State Budgets: An Early Look in Select States

Authors: Stan Dorn and Norton Francis, Urban Institute, Laura Snyder, and Robin Rudowitz
Published: Mar 11, 2015

Executive Summary

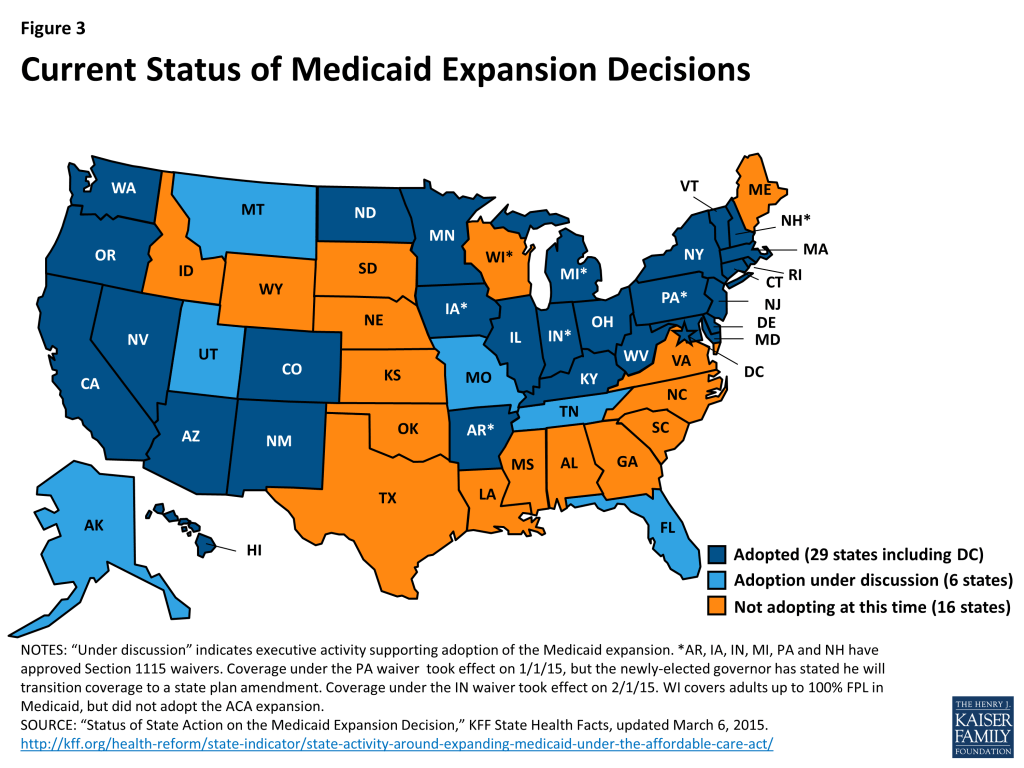
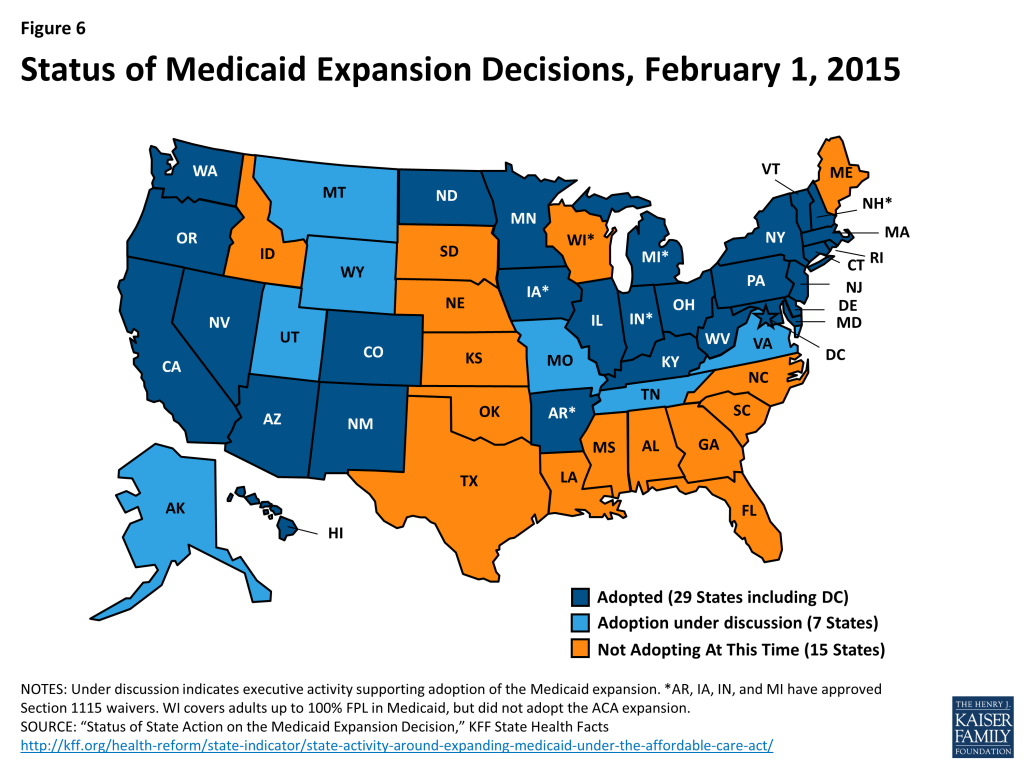
As enacted, the Affordable Care Act (ACA) broadened Medicaid’s role, making it the foundation of coverage for nearly all low-income Americans with incomes up to 138 percent of the federal poverty level (FPL) ($16,242 per year for an individual in 2015). However, the Supreme Court ruling on the ACA effectively made the decision to implement the Medicaid expansion an option for states. For those that expand, the federal government will pay 100 percent of Medicaid costs of those newly eligible for Medicaid from 2014 to 2016. The federal share gradually phases down to 90 percent in 2020, where it remains well above traditional federal medical assistance percentage (FMAP) rates. As of March 2015, 29 states (including the District of Columbia) adopted the Medicaid expansion, though debate continues in other states. In deciding whether to implement the Medicaid expansion, the effect on state budgets has been a key issue for policy makers. However, isolating the full effects of the Medicaid expansion across all parts of the state budget has proven challenging. State-specific estimates of the Medicaid expansion were created with varying degrees of completeness; those that were complete found net fiscal gains, with state savings and revenues exceeding increased state costs.1 

This brief looks beyond the estimates and examines the early budget effects of expansion in three states: Connecticut, New Mexico, and Washington State. The study was conducted during the Fall of 2014; budgets had been enacted for state fiscal year 2015, the first full state fiscal year with the Medicaid expansion in effect. Budget officials were also in the process of closing the books on SFY 2014, the latter half of which included the first 6 months of the Medicaid expansion in each of these states. These findings are based on interviews conducted with budget officials and staff in each of the three states; the interviews focused on their state’s experiences in this early period, when the costs of those newly eligible are fully financed with federal dollars.  Specifically, budget officials were asked about assumptions and early experiences with state savings and costs from the expansion across state budgets (within and outside of Medicaid) as well as the expansion’s impact on state revenue. (See the Methodology section for more details on how the study was conducted.) Findings from a separate report commissioned by Kentucky are also included. Key findings include:

  • Overall Finding. Early evidence from interviews with budget officials in these case study states shows state savings and revenue gains with limited costs resulting from expansion, even as some potential fiscal gains have not yet been tracked.
  • Medicaid Enrollment and State Costs. Enrollment of those newly eligible exceeded expectations; however, these individuals are fully financed with federal dollars through December 31, 2016, presenting no costs to states during this period. While enrollment among those previously eligible but not enrolled (which is financed at the state’s regular matching rate) increased in each of the study states, the majority of this enrollment growth was driven by other changes in the ACA rather than just the Medicaid expansion.
  • Savings within Medicaid Budgets. Savings were reported within Medicaid programs in all study states as beneficiaries who otherwise would have qualified for pre-ACA Medicaid categories at the state’s regular match instead enrolled in the new expansion group and were eligible for the higher ACA enhanced match rate (and therefore reduced state costs.)
  • Savings outside of Medicaid Budgets. All study states experienced savings in other areas of the state budget beyond Medicaid, such as state-funded behavioral health services and corrections. Some savings were captured for state general funds and others were reinvested, often to compensate for earlier cutbacks.
  • Revenue Effects. The impact on state revenue, as monitored by budget officials, was primarily reflected in increased provider and premium taxes. Only one study state (New Mexico) accounted for the increased economic activity resulting from expansion in general revenue forecasts. A separate study found the Medicaid expansion in Kentucky led to increases in jobs and tax revenues for the state and localities.
  • Long-Term Estimates of Full Effects. Disentangling the revenue and budgetary impact of the Medicaid expansion from other ACA effects as well as other factors shaping health care costs, state economies and state budgets is a tremendous challenge that is generally not part of state budget processes. The one study state that produced net estimates, Washington, projected that state savings from expansion would exceed costs, resulting in net fiscal gains. During the current fiscal year (2015), net gains of expansion are estimated to equal 1.7 percent of total General Fund spending.2  Net savings through 2021 due to the expansion were also found in a separate report examining the impact of the Medicaid expansion in the Kentucky. Both states projected net state savings in future years when the federal share of spending on newly eligible adults will fall to 90 percent.

Summary Table

The Effects of the Medicaid Expansion on State Budgets: An Early Look in Select States
ConnecticutNew MexicoWashington
Enrollment
Newly Eligible EnrollmentHigher than projected; no state costs.Higher than projected; no state costs.Higher than projected; no state costs.
Previously Eligible but not EnrolledHigher than projected; mostly children.Higher than expected; mostly adults but also some children.3 Lower than expected; mostly children.
Savings within Medicaid
Limited Medicaid programs for low-income adultsSavings from conversion of early expansion state plan group.Substantial source of one-time savings from conversion of SCI waiver.Substantial source of one-time savings from conversion of Bridge to Reform waiver.
Medically Needy Spend-DownEnrollment decline noted; not included in budget.N/AModerate savings noted.
Breast and Cervical Cancer TreatmentNo change in enrollment.Not noted or tracked (limited program to begin with.)Limited savings noted from enrollment declines.
Family PlanningLimited savings noted from declining enrollment.Not noted or tracked (limited program to begin with.)Limited savings noted from declining enrollment.
Pregnancy Related EnrollmentNot noted or tracked.Not noted or tracked.Not included in budget, but enrollment decline noted (due mostly to the expansion.) Planning to take limited savings.
Savings outside of Medicaid
Mental Health and Substance AbuseSubstantial savings included in budget.Moderate savings noted, most funds reprogrammed within agency.Moderate savings included in budget.
Uncompensated CareSignificant savings included in budget.N/A – mostly county responsibility.N/A – programs had mostly been eliminated by the state in earlier years.
State Funded Indigent Care**N/AN/AN/A
High Risk PoolsN/AModerate savings included in budget; savings are slower than expected.N/A
Inpatient Care for PrisonersNot explicitly accounted for in budget. Many of those eligible under the expansion enrolled in the state’s early expansion.Not included in budget; anticipated to be small savings for counties and state.Limited savings included in budget.
Public Health ServicesLimited savings included in budget.Exploring potential savings.Limited savings included in budget.
Other Health Care Programs for Vulnerable PopulationsLimited savings included in budget.
Revenues
Taxes or Fees on ProvidersNo additional revenue included in budget.Additional revenue included in budget.Additional revenue included in budget.
General Revenue due to increased economic activityDid not include in economic and revenue estimates at this time.Included in economic and revenue estimates.Did not include in economic and revenue estimates at this time.
** Connecticut and Washington State had state-funded indigent care programs before the ACA; both states transitioned these programs to Medicaid financing before the Medicaid expansion went into effect. See Appendix A for more details.

Issue Brief

Introduction

As enacted, the Affordable Care Act (ACA) broadened Medicaid’s role, making it the foundation of coverage for nearly all low-income Americans with incomes up to 138 percent of the federal poverty level (FPL) ($16,242 per year for an individual in 2015). However, the Supreme Court ruling on the ACA effectively made the decision to implement the Medicaid expansion an option for states. For states that expand Medicaid, the federal government will pay 100 percent of Medicaid costs of those newly eligible for Medicaid for up to three calendar years from 2014 to 2016. The federal share gradually phases down to 90 percent in 2020, where it remains well above traditional federal medical assistance percentage (FMAP) rates in every state. As of March 2015, 29 states (including the District of Columbia) have adopted the Medicaid expansion though debate continues in other states. A key issue for policy makers at the state level has been the state budget effects of the Medicaid expansion on states’ budgets.

This brief presents findings from a study of the early budget effects of the Medicaid expansion in three states: Connecticut, New Mexico, and Washington State. These interviews took place in the Fall of 2014, as executive-branch officials had begun preparing executive budget proposals for the 2015 legislative sessions. (See the Methodology section for more details on how the study was conducted.) Also included are findings from a separate study commissioned by Kentucky officials that examined the impact of that state’s decision to expand. The findings provide a limited and early insight into the effect of the Medicaid expansion on state budgets, both within and outside of the Medicaid programs. Key findings are summarized below, first looking at effects within the Medicaid budget, then turning to the effects on other parts of the state budget as well as revenues. A summary of the findings is also presented in the Summary Table. This study focused primarily on budget factors that may apply elsewhere, but one should be careful in generalizing, as each state’s budget situation is unique.

Medicaid Enrollment and State Costs

While enrollment among those previously eligible but not enrolled (which is financed at the state’s regular match rate) increased in each of the study states, the majority of this enrollment growth was driven by other changes in the ACA rather than just the Medicaid expansion. All states anticipated increased enrollment resulting from the Medicaid expansion, both for newly eligible adults and among those who were previously eligible but not enrolled. In each state, newly eligible enrollment exceeded expectations. Under the ACA, these costs are fully funded with federal dollars through December 31, 2016, so this did not increase state costs in SFYs 2014 or 2015. The extent to which states saw increased enrollment among those previously eligible but not enrolled varied across the study states. In Connecticut and New Mexico, the enrollment increase was above projections, but it was below projections in Washington State. A separate study commissioned by the Kentucky officials also found enrollment of those previously eligible but not enrolled was well above projections.4  However, the enrollment growth among those previously eligible but not enrolled in each of these states was primarily driven by other ACA changes, such as the streamlining and simplifying of Medicaid enrollment processes that occurred in all states regardless of expansion decisions as well as broader outreach efforts. Washington State officials, for example, estimated that nearly three-quarters of such enrollment growth resulted from features of the ACA that would have been present with or without expanded eligibility.

While study states saw some increased Medicaid administrative costs, these costs were relatively small. Medicaid administrative costs in general represent only five percent of total Medicaid spending nationally.5  Additionally, most of these administrative costs would have been incurred with or without the Medicaid expansion due to other aspects of the ACA. Officials expect these effects to be ameliorated by the ACA’s shift to a more data-driven and less labor-intensive approach to eligibility determination. The transition to this new approach is supported by 90 percent federal funding for necessary investments in information technology, along with 75 percent federal funding for operating expenses.6 

Savings within Medicaid budgets

All study states reported savings within their Medicaid programs as some beneficiaries for whom states would have received standard FMAP instead qualified as low-income adults eligible for the ACA’s enhanced match rate.7  Conversion of limited Medicaid programs for low-income adults in each of the study states provided a source of immediate, significant savings within Medicaid programs. For two of these states, Connecticut and Washington, these limited Medicaid programs for low-income adults had started as state-funded indigent care programs that were converted to Medicaid financed programs (at the state’s regular matching rate) ahead of the ACA expansion. (More details on these programs are provided in Appendix A.)

In addition, some of the study states observed enrollment declines in optional Medicaid eligibility categories without reducing eligibility. For example, some study states saw declines in the enrollment of lower cost programs such as family planning (Connecticut and Washington) and breast and cervical cancer treatment programs (Washington). These two states also saw declining enrollment in higher-cost eligibility categories, such as medically needy spend-down programs for adults; Washington State also saw declining enrollment in an optional eligibility pathway that provides coverage for those awaiting an SSI disability determination. Adults who would have enrolled under these optional eligibility pathways were instead enrolling under the new Medicaid expansion group, qualifying for a higher matching rate.8  (See Appendix B for more on these pathways.) Similar declines in enrollment among optional groups were also seen in Kentucky; according to this separate report, the Commonwealth saw savings of over $38 million in SFYs 2014 and 2015 from beneficiaries qualifying under the newly eligible group instead of other optional pathways such as breast and cervical cancer treatment program and spend-down groups among others.9 

Officials in Washington state also observed unexpected declines among pregnant women that had not been included in enacted budgets. Officials in Washington noted that much of the decline was due to more women qualifying under the Medicaid expansion group. Medicaid programs have long been required to cover pregnant women at levels at or above the Medicaid expansion. This requirement continues under the ACA; their coverage is reimbursed at the state’s regular match rate. However, women enrolled in the new adult expansion group who become pregnant are not required to move to the pregnancy-related eligibility group outside of their regular renewal period. Budget officials also noted that the availability or coverage in the Marketplace as well as improving economic conditions could also have caused some of this decline.

Savings Outside of Medicaid Budgets

All study states experienced savings in other areas of the state budget beyond Medicaid.10  Expanded Medicaid coverage helped to reduce some of the need for state-funded programs to serve this population, such as behavioral health and corrections. Savings either benefited the state general fund or were reinvested within the program area, often restoring cuts made during the economic downturn.

All three study states experienced savings in behavioral health programs. Behavioral health programs across the country saw substantial state funding cuts during the economic downturn; many remain underfunded.11  States that have implemented the Medicaid expansion may use the federal dollars from the Medicaid expansion either to substitute for state funds spent on mental health services, help restore funding cuts implemented during the economic downturn, or reduce general fund spending (e.g. “book” savings.) Connecticut and Washington State “booked” these savings for their general funds, while New Mexico reprogrammed the majority of savings within the behavioral health agency’s budget.

While the study states noted savings and efficiencies in their behavioral health programs due to the expansion, there were some challenges and delays in transitioning behavioral health care providers to billing for their clients’ claims (rather than relying on grant funding) and enrolling beneficiaries of behavioral health programs (a generally hard-to-reach population) into Medicaid. These challenges necessitated adjustments to original budget assumptions, but state officials were confident both that expansion was already yielding savings and that the magnitude of savings would likely grow as these transitions progressed.12  General Fund savings were also found for Kentucky as Medicaid beneficiaries – those newly eligible as well as those previously enrolled – received mental health treatment and substance use disorder services through community mental health centers reimbursed with Medicaid funds instead of general fund dollars.13  Coinciding with the Medicaid expansion, the Commonwealth of Kentucky had expanded the types of behavioral health providers that were eligible for Medicaid reimbursement, both for the traditional Medicaid program as well as for the Medicaid expansion, increasing access to such services.14 

Two of the study states also experienced budget savings or offsets for corrections. Many inmates historically could not qualify for Medicaid since they did not fit into one of the traditional eligibility categories. Even for inmates who did meet the income and categorical eligibility requirements to qualify for Medicaid, federal law prohibits Medicaid payment for services provided in jails or prisons under a policy known as the “inmate exclusion.”15  However, Medicaid reimbursement is available for care provided to eligible individuals who are admitted to an inpatient facility off jail or prison grounds, such as a hospital, for at least 24 hours. Prior to the ACA, few states had pursued Medicaid reimbursement for these services given the limited share of the incarcerated population that could qualify for Medicaid.16  However, the Medicaid expansion offers greater potential savings to states from reimbursement for inpatient services provided to incarcerated individuals, since a larger share of the incarcerated population may qualify for Medicaid under the Medicaid expansion and the federal government is providing states an enhanced federal matching rate for newly eligible adults.17 

Washington State included limited state budget savings in its enacted corrections budget for SFYs 2014 and 2015. Connecticut officials noted that while they hadn’t quantified savings from the Medicaid expansion, the state’s Department of Correction had been able to weather notable budget reductions in their inmate medical account since the state implemented the early expansion in 2010. New Mexico’s Medicaid program was working to realize savings in this area, but officials also noted that many corrections responsibilities are vested locally.18  General Fund savings from the Medicaid expansion in the state’s corrections department were also noted in a separate report commissioned by Kentucky.19 

Some study states also reported savings in other areas, including uncompensated care payments and high risk pools. In addition to federal funding for uncompensated care costs through Medicare and Medicaid Disproportionate Share Hospital (DSH) programs, states and localities generally fund roughly 40 percent of uncompensated care costs.20  When the previously uninsured gain coverage that pays for their care, previously uncompensated costs decline. Among our three study states, only Connecticut had a state-level uncompensated care program in place before the ACA; Washington state did not have an uncompensated care pool and counties bear much of the responsibility for financing hospital uncompensated care in New Mexico. When it converted its pre-ACA state indigent care program into an early Medicaid expansion, Connecticut was able to significantly reduce their uncompensated care payments to hospitals as well as make some reductions in uncompensated care for community health and mental health centers. Reductions in state and local expenditures for uncompensated care were also noted through SFY 2016 in a separate report examining the expansion’s impacts on Kentucky; this same report also noted general fund savings in later years from the scheduled reductions in DSH funds.21  Early evidence from that state’s expansion also saw declines in uncompensated care charges as well as increased revenues for providers.22 

Case study states noted additional areas of moderate or limited budget savings outside of Medicaid. For example, New Mexico, which was the only study state that operated a state-funded high-risk pool, saw moderate savings as enrollees transitioned to other coverage options.  Like the movement of behavioral health program beneficiaries into Medicaid, this transition moved more slowly than expected, resulting in fewer short-term savings than originally projected. Connecticut and Washington also reported savings from state-funded public health programs; similar savings were also found in Kentucky as services provided through local health departments to Medicaid enrollees were now reimbursed by Medicaid.23   Washington reported savings from a state-funded program that provided long-term services for adults with developmental disabilities.

Revenue Effects

The impact on state revenue, as monitored by budget officials, was primarily reflected in increased provider and premium taxes and fees. Washington and New Mexico projected increased revenue from provider taxes and fees as a result of expansion in their budgets. Both states have premium taxes on insurers; revenues collected from these taxes and fees increased as more Medicaid members joined managed care plans and more Medicaid patients saw providers. Connecticut experienced no increase in revenues as a result of expansion. The state’s Medicaid enrollment has grown substantially as a result of the expansion and hospital revenues increased as care shifted from uncompensated to Medicaid-reimbursed. While Connecticut has Medicaid provider taxes and fees, they have not been rebased since 2009 and therefore have not increased due to Medicaid expansion. Further, as a state with very high rates of health insurance coverage prior to the expansion, insurance company premium taxes have not appreciably increased following expansion. As a final complicating factor, a state program that allows for the purchase of tax credits to reduce tax liability has been utilized by some providers subject to the Medicaid provider tax, and this has resulted in a reduction in revenue from this source.

Expansion is expected to increase overall economic activity,24  and thus state general revenue, due to the significant influx of federal Medicaid dollars used to purchase health care within such states. However, only one study state (New Mexico) specifically noted this effect in its overall economic and revenue projections for the first years of implementation. The other states’ economic forecasts did not include such detail in their underlying assumptions at this point. It will be difficult to isolate the expansion’s effects on work force and economic growth until more detailed data become available. However, a separate analysis conducted by the Urban Studies Institute at the University of Louisville estimated that the Medicaid expansion in Kentucky led to an increase of 12,000 jobs in SFY 2014 alone and over 40,000 additional jobs through 2021. The analysis estimates that this increase in jobs will result in additional tax revenue for the state an localities through SFY 2021.25 

Conclusion

Disentangling the fiscal impact of expanded Medicaid eligibility from other ACA effects as well as other factors shaping health care costs can be a tremendous challenge. Policy and budget decisions are not made in a vacuum; isolating the budgetary effects of one policy decision from other policy decisions as well as from larger demographic and economic trends is inherently difficult. In this particular case, other changes resulting from the ACA, such as requirements that all states implement new policies to streamline and simplify Medicaid enrollment, the individual coverage requirement, and new coverage options available through the Marketplace make isolating the effects of the Medicaid expansion particularly difficult.

State budget offices are not set up to estimate the net budget impact of a single policy, such as the Medicaid expansion. Such offices, unlike the Congressional Budget Office, do not typically maintain alternative budget scenarios that estimate costs and revenues in the absence of a particular policy (such as the Medicaid expansion.) They rarely have good reason to spend resources analyzing the effects of past decisions, like expansion. Moreover, the fiscal effects of the Medicaid expansion are hard to analyze comprehensively because they are experienced across budget categories; cost implications fall within and outside Medicaid, and both general and special revenue sources can be affected. Among the three states  examined, only Washington was in a position to assess the overall budgetary impact of expansion; at the time of our interviews, the state was in the final months of maintaining an alternative budget scenario that estimated state costs in the absence of Medicaid expansion. Based on that scenario, state savings from higher federal matching rates for newly eligible enrollees and from reduced spending on some (but not all) pre-ACA, state-funded programs could be analyzed. Without taking into account any revenue gains resulting from expansion, those savings exceeded increased state costs attributable to expansion in both SFY 2014 and 2015 (Appendix C); in fact, the state noted net Medicaid budget savings for each budget period throughout the 2013-2021, including the period during which the FMAP for low-income adults reaches its final 90 percent level. During SFY 2015, the net savings from expansion was projected to equal 1.7 percent of the state’s entire General Fund for SFY 2013.26   Kentucky commissioned Deloitte to examine the fiscal and economic impact of the Medicaid expansion decision on Kentucky; this independent analysis, which examined the impact of the expansion across the state’s budget and at the broader economic effects among other factors, estimates Kentucky will see a net positive fiscal impact of $919.1 million over the SFY 2014 through 2021 period compared to what the state would have spent in the absence of the Medicaid expansion.27 

Early evidence from these case study states shows that expansion yields state savings and state revenues while causing limited increases in state costs. Both newly eligible consumers and those who qualified under pre-ACA categories can be expected to enroll in large numbers, although much of the latter enrollment will occur with or without expansion. States can experience notable savings both within Medicaid and outside Medicaid budgets, though savings in parts of the budget outside of Medicaid may be slower to materialize than anticipated, and policymakers may choose to reinvest savings to increase the provision of non-Medicaid services rather than reduce General Fund commitments. Two of the study states projected increased revenue from provider taxes and fees; states are expected to also realize revenue gains from increased economic activity as evidenced by the findings of the expansion’s impact on Kentucky. In sum, our analysis of early experiences in three states suggests that expansion creates both state budget savings and some limited initial costs for states in these early years of the expansion, when the cost of the newly eligible is fully financed with federal dollars.

This brief provides insight into the early experiences in only three states along with findings from a separate study commissioned by Kentucky. Each state and its budget are unique. The findings of this brief are likely to illustrate important general trends, but ultimately the effect of Medicaid expansion on state budgets must be assessed in terms of the particular circumstances of each state. In states that have already chosen to expand eligibility, the implications of that decision on state budgets and revenues will continue to be monitored as implementation continues and more data become available.

This brief was prepared by Stan Dorn and Norton Francis of the Urban Institute and Robin Rudowitz and Laura Snyder from the Kaiser Family Foundation.

The authors also wish to thank the state budget officials and staff in Connecticut, New Mexico and Washington State who participated in this study. Especially in this time of limited resources and challenging workloads, we truly appreciate the time and effort provided by these public servants to participate in structured interviews and respond to our follow-up questions. Without their generous assistance, this brief would not have been possible.


Methods

This study analyzes the state budgetary effects that have been identified thus far in three geographically diverse states that began implementing the full expansion on January 1, 2014: Connecticut, New Mexico, and Washington State. Researchers from the Kaiser Commission on Medicaid and the Uninsured and the Urban Institute interviewed state budget staff and officials and reviewed state budget documents during August through November, 2014, before the start of the 2015 open enrollment period. These interviews were based on semi-structured protocols, and key topic areas were shared in advance with state officials.

The interviews took place as executive-branch officials had begun preparing executive budget proposals for forthcoming legislative sessions. Of the three states included in this study, two (Connecticut and Washington state) operate on a biennial budget cycle while New Mexico operates on an annual budget cycle. All three states were in the process of developing new budgets for the next budget window, which would cover SFY 2016 as well as SFY 2017 in Connecticut and Washington. All three study states adopted the Medicaid expansion as of January 1, 2014, halfway through their SFY 2014 budgets. Because of the timing of this study, states were asked about the budget effects for SFY 2014 and SFY 2015. While SFY 2014 had ended, states were still finalizing actual figures for SFY 2014. Therefore, state officials were basing responses off of what was included in SFY 2014 and SFY 2015 budgets as enacted; for SFY 2014, officials commented where they could on what had been observed (e.g. if savings originally included in budgets were in line with original assumptions.)

Washington State was able to provide cost and savings estimates for a number areas affected by the state’s decision to implement the Medicaid expansion due to the fact the state has maintained an alternative budget scenario that estimated state costs in the absence of Medicaid expansion, a process the state is expected to stop in the near future. Budget officials in Connecticut and New Mexico reported cost and savings estimates where possible, but all states reported more broadly about the scope of changes that had been considered to date. Each of these states reviewed the findings; their feedback has been incorporated.

Additional findings of the expansion’s impact on Kentucky published in a separate report commissioned by that state have also been included.

This study focused primarily on budget factors that may apply elsewhere, but one should be careful in generalizing, as each state’s budget situation is unique.

Appendices: Appendix A: Coverage Initiatives Prior To The Aca

Prior to the ACA, coverage for adults was limited. Parent eligibility in many states was below the poverty level. Adults without dependent children were ineligible for Medicaid regardless of their income; states could only cover adults without dependent children through waivers. As of January 2013, nine states provided coverage for low-income adults comparable to full Medicaid benefits; an additional 16 states provided such adults with limited benefit coverage under Medicaid.28  Provided below is a summary of coverage initiatives the case study states had in place prior to the Medicaid expansion; individuals in each of these programs were transitioned to the new coverage group and eligible for full federal financing under the Medicaid expansion.

Connecticut: Prior to the ACA, Connecticut provided medical assistance under the State Administered General Assistance (SAGA) program, which is state-funded.29  Under provisions in the ACA, states were given the option to implement the Medicaid expansion ahead of January 1, 2014 at the state’s regular matching rate. Connecticut was the first state to take up this option, implementing a state plan amendment to cover non-elderly, non-disabled adults up to 56 percent FPL without an asset test (there was a $1000 asset test under the SAGA program.) The state experienced significantly higher enrollment than expected. Even though the federal government was paying half of the cost, the state’s 50 percent share of expenditures for the new, low-income adult program exceeded the cost for medical assistance under the original SAGA program as enrollment grew substantially above projections. In January 2014, the state implemented the full Medicaid expansion, increasing income eligibility up to 138 percent FPL; the federal share for these expenditures increased to 100 percent.30 

New Mexico: New Mexico implemented its 1115 waiver to cover uninsured adults up to 200 percent FPL in 2002 under the State Coverage Initiative. The coverage provided was more limited than Medicaid, cost-sharing and premiums were above Medicaid-allowable levels, and enrollment into the program was closed in 2008 due to budget constraints. The waiver program, originally approved as a HIFA waiver, was first financed with CHIP funding and then converted to Medicaid funding. In January 2014, the state ended the SCI program, transitioning two-thirds of those served by the program to the new Medicaid expansion group, under which the federal match increased from approximately 75 percent to 100 percent. The other one-third of SCI enrollees had incomes above 138 percent FPL and qualified for subsidies to purchase coverage in the Marketplace.

Washington: Washington had for decades provided coverage for low-income uninsured adults through its Basic Health Program, which was funded with state-only dollars. During the economic downturn, the state faced notable budget shortfalls. After the ACA was passed, Washington was able to obtain federal matching funds under a Section 1115 waiver program to act as a bridge to the Medicaid expansion. This conversion to a Medicaid waiver allowed the state to collect federal dollars at the state’s regular matching rate for the program (as well as the Disability Lifeline program and the Alcohol and Drug Abuse Treatment and Support Act or ADATSA program, both of which were also previously state-funded.) In January 2014, the state transitioned these adults to the Medicaid expansion group, where the federal match increased from 50 to 100 percent.

Appendices: Appendix B: Optional Medicaid Eligibility Pathways

Prior to the ACA, some states had adopted Medicaid eligibility pathways that provided limited coverage (meaning that the coverage provided limited benefits or the coverage offered full Medicaid benefits but limited eligibility to those that either had a specific condition or those that met spend-down requirements.) The availability of subsidized Marketplace coverage and expanded Medicaid coverage (in 28 states) provides new options for states to reconsider some of these coverage options, such as:

  • Family Planning. Family planning waivers and state plan amendments allow for states to provide limited Medicaid coverage to US citizens otherwise ineligible for Medicaid (largely adults.) Coverage is limited to family planning services only and is reimbursed at 90 percent federal match. Washington State had an existing family planning waivers; Connecticut and New Mexico had previously adopted the family planning state plan option. None of the case study states had elected to eliminate this coverage, though across the country, eight states reported plans to end family-planning only coverage.31 
  • Breast and Cervical Cancer Treatment (BCCT). In 2000, Congress gave states the option to extend Medicaid coverage to low-income uninsured or underinsured women under age 65 that had been screened and diagnosed with breast and cervical cancer through state screening programs funded by the CDC. All states had adopted this option; coverage for these individuals is reimbursed at the state’s CHIP matching rate. None of the case study states had elected to eliminate this coverage, though across the country, three states reported plans to end BCCT coverage.32 
  • Medically Needy Spend-Down. Another optional Medicaid eligibility pathway that some states considered eliminating in light of new coverage options was medically-needy spend-down programs for adults. Under this coverage group, people can qualify for Medicaid by incurring medical bills that “spend down” their income to lower levels. None of the case study states had elected to eliminate this coverage, though across the country, five states reported plans to reduce or end medically needy spend-down coverage for adults.33 

Appendices: Appendix C: Washington State Budget Impacts Of The Medicaid Expansion

The figures included below were provided by Washington State budget officials and reflect estimates used when the state enacted its FY 2013-2015 state budget. These figures were derived from an alternative budget scenario that estimates the state costs in the absence of the Medicaid expansion maintained by state officials. States often do not maintain alternative budget scenarios of what would have happened had the state not implemented a specific policy over time; Washington state officials noted that they do not plan to continue this process going forward.

Washington State Budget Effects of Medicaid Expansion, SFYs 2014 and 2015
Budget AreasSFY 2014SFY 2015
Increased Enrollment among those previously eligible but not enrolled*$22.8 million$59.9 million
State Administrative Costs*$4.0 million$3.5 million
State Administrative Savings*-$0.3 million-$1.6 million
Savings within Medicaid from pre-ACA eligibility transitions:
1115 Waiver Transition-$34.0 million-$69.1 million
Medically Needy Spend-Down Adults-$11.5 million-$35.0 million
Breast and Cervical Cancer Program-$0.7 million-$3.6 million
Family Planning-$0.5 million-$1.0 million
Presumptive SSI***-$38.1 million-$109.8 million
Savings outside of Medicaid:
Mental Health and Substance Abuse-$13.4 million-$51.2 million
Inpatient Care for Prisoners-$0.7 million-$1.4 million
Public Health Services-$2.6 million-$5.8 million
Other health care programs for vulnerable populations**-$4.0 million-$9.7 million
Increased Revenues:
Premium tax revenue *$33.9 million
Fiscal Benefit (Net Savings and New Revenues):$79.0 million$258.7 million
Total State General Fund Spending in SFY 2013$15.5 billion$15.5 billion
Fiscal Benefit from Medicaid Expansion as a Share of Total State General Fund Spending in SFY 20130.5%1.7%
NOTES: *The cost and savings figures included here reflect the total impact of the ACA and are not isolated to the Medicaid expansion.**This included savings for programs related to long term care, developmental disability and labor and industries programs outside of Medicaid. ***Washington State also noted savings from the transition of adults who were previously eligible for their presumptive SSI category. This is an optional Medicaid eligibility category that provides Medicaid coverage while adults await a disability determination for SSI coverage. It is unclear how many states offer Medicaid coverage for such individuals. While expenses for those that qualified under this pre-ACA eligibility pathway were not reimbursed at the 100 percent federal match rate, the state did receive a higher matching rate for these individuals (equivalent to the early adopter matching rates.)SOURCE: Based on estimates from the state’s Forecast Model as well as from the 2013-2015 budget as originally enacted by the legislature in Washington State and discussions with Washington state budget officials. Figures may differ from more recent updates to budget analyses. The calculations of savings compared to SFY General Fund Spending are those of the authors based on savings figures provided by state officials compared to the state general fund spending across all budget categories for SFY 2013 as reported by the National Association of State Budget Officers in their State Expenditure Report: Examining Fiscal 2012-2014.

Appendices: Appendix D: Estimates From Separate Report Commissioned By Kentucky

In February 2015, Kentucky released a report it had commissioned Deloitte to conduct and analysis of the impact of the first-year impact of the Medicaid expansion on Kentucky and to estimate the potential future impact. Using data from a number of sources, including the  data from the Centers for Medicare  & Medicaid Services (CMS), the Kentucky Cabinet for Health and Family Services (the state Medicaid agency), Aon Consulting (the state’s Medicaid actuary), and the Urban Studies Institute at the University of Louisville, the study provided point-in-time analysis of the impact across multiple areas – including the impact on Medicaid enrollment, the state’s uninsured rate, the state’s economy, it’s budget, the overall health care system and providers, and access to care for state residents. In terms of the effect on the state’s budget and economy, the study estimated that the Medicaid expansion will have a significant positive cumulative impact of $30.1 billion on Kentucky’s economy through SFY 2021; the net difference between expanding and not expanding Medicaid is estimated to be a positive $919.1 million from SFY 2014 through SFY 2021. The data below reflect the estimates for SFY 2014 and SFY 2015 and puts the fiscal effect in context of total state general fund spending.

Kentucky State Budget Effects of Medicaid Expansion, SFYs 2014 and 2015
Budget AreasSFY 2014SFY 2015
Increased Enrollment among those previously eligible but not enrolled*$15.7 million$41.4 million
Additional benefits provided to those not in the expansion group**$4.2 million$9.6 million
State Administrative Costs*
Savings within Medicaid from pre-ACA eligibility transitions:
Medically Needy Spend-Down Adults-$2.4 million-$14.0 million
Breast and Cervical Cancer Program-$0.4 million-$1.3 million
Kentucky Transitional Medical Assistance Program (K-TAP)-$1.9 million-$9.0 million
Nursing Facility (Adult Medicaid)***-$1.7 million-$7.9 million
Savings outside of Medicaid:
Department of Behavioral Health, Developmental and Intellectual Disabilities-$9.0 million-$21.0 million
Department of Corrections-$5.4 million-$11.0 million
Department of Public Health-$4.0 million-$6.0 million
Uncompensated Care Contributions (QCCT Contributions)-$13.8 million
Private Insurance for Foster Care Children****-$1.0 million-$1.1 million
Increased Revenues:
State Income Taxes$19.3 million$56.3 million
State Sales Taxes$18.1 million$52.9 million
Fiscal Benefit (Net Savings and New Revenues):$43.3 million$143.3 million
Total State General Fund Spending in SFY 2013$9.4 billion$9.4 billion
Fiscal Benefit from Medicaid Expansion as a Share of Total State General Fund Spending in SFY 20130.5%1.5%
NOTES: *The cost and savings figures included here reflect the total impact of the ACA and are not isolated to the Medicaid expansion. **Kentucky elected to expand access to these substance use services to all of their Medicaid population, not just the newly eligible. The study commissioned by Kentucky noted that there would be increased general fund requirements for providing these additional substance abuse benefits to those previously eligible as well as those already enrolled in Medicaid. ***The study also noted savings from the transition of adults with disabilities from their Nursing Facility Medicaid group; according to the study, these are disabled adults that meet an administrative disability with assets below $2000. ****Kentucky previously provided health care coverage with state-only dollars to former foster care children up through age 25; this is a group now covered under Medicaid. In addition to the effects listed in the above table, the study also notes increased tax revenue for local occupational and payroll taxes.SOURCE: Report on Medicaid Expansion in 2014. (Deloitte commissioned by Kentucky, February 2015.) http://governor.ky.gov/healthierky/Documents/medicaid/Kentucky_Medicaid_Expansion_One-Year_Study_FINAL.pdf. The calculations of savings compared to SFY General Fund Spending are those of the authors based on savings figures provided by state officials compared to the state general fund spending across all budget categories for SFY 2013 as reported by the National Association of State Budget Officers in their State Expenditure Report: Examining Fiscal 2012-2014.

Endnotes

  1. Researchers found fiscal estimates of the Medicaid expansion in 16 states that were deemed “comprehensive” because they estimated increased state costs resulting from higher enrollment, state budget savings both inside and outside Medicaid programs, and state revenue effects.   Stan Dorn, Megan McGrath, John Holahan. What Is the Result of States Not Expanding Medicaid? Urban Institute, August 2014. http://www.urban.org/UploadedPDF/413192-What-is-the-Result-of-States-Not-Expanding-Medicaid.pdf. ↩︎
  2. The calculations are those of the authors based on (1) savings figures provided by state officials (2) compared to state general fund spending across all budget categories for SFY 2013 as reported by the National Association of State Budget Officers in its State Expenditure Report: Examining Fiscal 2012-2014. ↩︎
  3. New Mexico noted that the state costs for enrollment among those previously eligible but not enrolled were significant. However, as noted earlier, the enrollment growth among those previously eligible but not enrolled was primarily driven by other ACA changes, such as the streamlining and simplifying of Medicaid enrollment processes that occurred in all states, regardless of expansion decisions, as well as broader outreach efforts. ↩︎
  4. Report on Medicaid Expansion in 2014. (Deloitte commissioned by the Commonwealth of Kentucky, February 2015.) http://governor.ky.gov/healthierky/Documents/medicaid/Kentucky_Medicaid_Expansion_One-Year_Study_FINAL.pdf. ↩︎
  5. Urban Institute estimates based on data from CMS (Form 64) (as of 9/16/13). ↩︎
  6. The 90 percent FMAP for initial eligibility-related IT investments was initially set to expire at the end of 2015, but in October 2014, CMS announced plans to extend the higher federal match permanently. ↩︎
  7. In addition to the areas of savings within Medicaid budgets mentioned in this section, states were asked about savings-related declines in applications for disability-based cash assistance and well as savings from health care services provided to adults with disabilities under 138 percent FPL during the months while they are waiting for their disability determinations. No states in this study tracked such savings. ↩︎
  8. Washington State also noted savings from the transition of adults who were previously eligible for their presumptive SSI category. This is an optional Medicaid eligibility category that provides Medicaid coverage while adults await a disability determination for SSI coverage. It is unclear how many states offer Medicaid coverage for such individuals, although once a disability determination is obtained that qualifies an applicant for Medicaid, all states are legally required to retroactively pay all Medicaid-covered claims that were incurred up to 90 days before the date of application. While expenses for those who qualified under this pre-ACA eligibility pathway in Washington state were not reimbursed at the 100 percent federal match rate, the state did receive a higher matching rate for these individuals (equivalent to the early adopter matching rates.)  As a general matter, CMS has ruled that, in a state that implements the Medicaid expansion, adults who qualify based on income generate federal matching rates at the level paid for newly eligible adults for claims incurred until the point of disability determination, after which normal FMAP applies. CMS. “Medicaid Program; Increased Federal Medical Assistance Percentage Changes Under the Affordable Care Act of 2010,” Federal Register, April 2, 2013, Vol. 78, No. 63, 19918-19947. ↩︎
  9. Additionally, the report commissioned by the Commonwealth of Kentucky reported savings from beneficiaries qualifying for the newly eligible group instead of the Kentucky Temporary Assistance Program (K-TAP)and for a program referred to in that state as “nursing facility,” which provided coverage to disabled adults in select circumstances. Report on Medicaid Expansion in 2014. (Deloitte commissioned by the Commonwealth of Kentucky, February 2015.) http://governor.ky.gov/healthierky/Documents/medicaid/Kentucky_Medicaid_Expansion_One-Year_Study_FINAL.pdf. ↩︎
  10. In addition to the areas of savings outside of Medicaid budgets listed in the text, states were asked about savings from reduced health insurance costs for public employees and retirees. While no state included in this study tracked such savings, some state-level projections estimated that, along with other employers, states would see premium increases decline slightly when reductions in hospital uncompensated care, caused by lower levels of uninsurance resulting from Medicaid expansion, reduce hospital cost-shifting to private insurers. The Oregon Health Authority, Estimated Financial Effects of Expanding Oregon’s Medicaid Program Under the Affordable Care Act (2014–2020), February 2013, http://www.manatt.com/uploadedFiles/Content/5_Insights/White_Papers/OR_EffectofACAMedicaidExpansion_Feb2013_Final.pdf. ↩︎
  11. State Mental Health Legislation 2014 – Trends, Themes & E­ffective Practices. National Alliance on Mental Illness, December 2014. http://www.nami.org/Template.cfm?Section=Policy_Reports&Template=/ContentManagement/ContentDisplay.cfm&ContentID=172851 ↩︎
  12. Additionally, officials in Connecticut believed that the majority of the chronically mentally ill were picked up under the state’s early expansion in April 2010, which included adults with income up to 56% FPL; the increase to 138% FPL in January 2014 therefore did not have a dramatic impact. ↩︎
  13. Report on Medicaid Expansion in 2014. (Deloitte commissioned by the Commonwealth of Kentucky, February 2015.) http://governor.ky.gov/healthierky/Documents/medicaid/Kentucky_Medicaid_Expansion_One-Year_Study_FINAL.pdf. ↩︎
  14. Vernon Smith, et al. Medicaid in an Era of Health & Delivery System Reform: Results from a 50-State Medicaid Budget Survey for State Fiscal Years 2014 and 2015. (Kaiser Family Foundation, October 2014.) https://modern.kff.org/medicaid/report/medicaid-in-an-era-of-health-delivery-system-reform-results-from-a-50-state-medicaid-budget-survey-for-state-fiscal-years-2014-and-2015/. Kentucky elected to expand access to these substance use services to all of their Medicaid population, not just the newly eligible. The study commissioned by the Commonwealth of Kentucky noted that there would be increased general fund requirements for providing these additional substance abuse benefits to those previously eligible as well as those already enrolled in Medicaid. ↩︎
  15. Federal Medicaid law (Subparagraph (A) in the matter after section 1905(a)(29) of the Social Security Act) prohibits the payment of federal Medicaid matching funds for the cost of any services provided to an “inmate of a public institution,” except when the individual is a “patient in a medical institution.” This policy applies to both adults in jails or prisons as well as to youths involuntarily detained in a state or local juvenile facility. This policy does not prohibit individuals from being enrolled in Medicaid while incarcerated; however, even if they are enrolled, Medicaid will not cover the cost of their care, except for care received as an inpatient in a hospital or other medical institution. Because individuals may remain enrolled, states can suspend, rather than terminate, Medicaid coverage for inmates to accommodate the inmate exclusion. However, suspension and termination policies vary across states. ↩︎
  16. Managing Prison Health Care Spending, (Washington DC: Pew Charitable Trusts and John D. and Catherine T. MacArthur Foundation, October 2013), http://www.pewtrusts.org/~/media/legacy/uploadedfiles/pcs_assets/2014/PCTCorrectionsHealthcareBrief050814pdf.pdf . ↩︎
  17. Managing Prison Health Care Spending, (Washington DC: Pew Charitable Trusts and John D. and Catherine T. MacArthur Foundation, October 2013), http://www.pewtrusts.org/~/media/legacy/uploadedfiles/pcs_assets/2014/PCTCorrectionsHealthcareBrief050814pdf.pdf . ↩︎
  18. Some state officials also noted that tracking state savings in this area can require costly reprogramming of Medicaid eligibility systems. ↩︎
  19. Report on Medicaid Expansion in 2014. (Deloitte commissioned by the Commonwealth of Kentucky, February 2015.) http://governor.ky.gov/healthierky/Documents/medicaid/Kentucky_Medicaid_Expansion_One-Year_Study_FINAL.pdf. ↩︎
  20. Teresa A. Coughlin, John Holahan, Kyle Caswell, and Megan McGrath. Uncompensated Care for the Uninsured in 2013: A Detailed Examination. (Washington, DC: Urban Institute, May 2014.) https://modern.kff.org/uninsured/report/uncompensated-care-for-the-uninsured-in-2013-a-detailed-examination/. ↩︎
  21. Report on Medicaid Expansion in 2014. (Deloitte commissioned by the Commonwealth of Kentucky, February 2015.) http://governor.ky.gov/healthierky/Documents/medicaid/Kentucky_Medicaid_Expansion_One-Year_Study_FINAL.pdf. ↩︎
  22. Ibid. ↩︎
  23. Ibid. ↩︎
  24. Council of Economic Advisers. Missed Opportunities: The Consequences of State Decisions Not to Expand Medicaid. July 2014, http://www.whitehouse.gov/sites/default/files/docs/missed_opportunities_medicaid.pdf. ↩︎
  25. Report on Medicaid Expansion in 2014. (Deloitte commissioned by the Commonwealth of Kentucky, February 2015.) http://governor.ky.gov/healthierky/Documents/medicaid/Kentucky_Medicaid_Expansion_One-Year_Study_FINAL.pdf. ↩︎
  26. The calculations are those of the authors based on (1) savings figures provided by state officials as (2) compared to state general fund spending across all budget categories for SFY 2013 as reported by the National Association of State Budget Officers in its State Expenditure Report: Examining Fiscal 2012-2014. ↩︎
  27. Report on Medicaid Expansion in 2014. (Deloitte commissioned by the Commonwealth of Kentucky, February 2015.) http://governor.ky.gov/healthierky/Documents/medicaid/Kentucky_Medicaid_Expansion_One-Year_Study_FINAL.pdf. ↩︎
  28. Martha Heberlein, Tricia Brooks, Joan Alker, Samantha Artiga and Jessica Stephens. Getting into Gear for 2014: Findings from a 50-State Survey of Eligibility, Enrollment, Renewal, and Cost-Sharing Policies in Medicaid and CHIP, 2012-2013. (Kaiser Commission on Medicaid and the Uninsured, January 2013.) https://modern.kff.org/medicaid/report/getting-into-gear-for-2014-findings-from-a-50-state-survey-of-eligibility-enrollment-renewal-and-cost-sharing-policies-in-medicaid-and-chip-2012-2013/. ↩︎
  29. Connecticut’s SAGA program included both cash and medical assistance; the cash assistance component remains. ↩︎
  30. After projecting a $300 million surplus for FY 2015 twice, the state’s Comptroller projected a $31 million deficit due in part to a shortfall in the Medicaid program resulting from federal reimbursement issues and hospital settlement payments that were above projections. http://www.osc.ct.gov/public/news/releases/20150102.html. The state has been working with CMS to finalize the methodology for obtaining the enhanced match. ↩︎
  31. New Mexico had originally reported plans to eliminate its family planning program, but did not ultimately do so. Virginia also reduced eligibility for this group to 100 percent FPL in 2014 but plans to restore coverage to 200 percent FPL in 2015. Vern Smith, Kathleen Gifford, Eileen Ellis, Robin Rudowitz and Laura Snyder. Medicaid in an Era of Health and Delivery System Reform: Results from a 50-State Medicaid Budget Survey for State Fiscal Years 2014 and 2015. (Washington, DC: Kaiser Commission on Medicaid and the Uninsured,) October 2014. https://modern.kff.org/medicaid/report/medicaid-in-an-era-of-health-delivery-system-reform-results-from-a-50-state-medicaid-budget-survey-for-state-fiscal-years-2014-and-2015/. ↩︎
  32. Vern Smith, Kathleen Gifford, Eileen Ellis, Robin Rudowitz and Laura Snyder. Medicaid in an Era of Health and Delivery System Reform: Results from a 50-State Medicaid Budget Survey for State Fiscal Years 2014 and 2015. (Washington, DC: Kaiser Commission on Medicaid and the Uninsured,) October 2014. https://modern.kff.org/medicaid/report/medicaid-in-an-era-of-health-delivery-system-reform-results-from-a-50-state-medicaid-budget-survey-for-state-fiscal-years-2014-and-2015/. ↩︎
  33. Ibid. ↩︎
News Release

Health-Care Deductibles Climbing Out of Reach 

Published: Mar 11, 2015

In his latest column for The Wall Street Journal’s Think Tank, Drew Altman explores the trend of higher deductibles in health plans and discusses a new analysis showing that many people with insurance don’t have sufficient financial resources to pay a mid- or high-range deductible.

All previous columns by Drew Altman are available online.

Consumer Assets and Patient Cost Sharing

Published: Mar 11, 2015

Higher cost sharing in private insurance has been credited with helping to slow the growth of health care costs in recent years. Plans with higher deductibles and other point of service costs provide health plan enrollees with incentives to make more cost conscious health care choices. For families with limited resources, however, high cost sharing can be a potential barrier to care and may lead these families to significant financial difficulties. Many current policies expose individual enrollees to thousands of dollars in cost sharing expenses and family expenses can easily top ten thousand dollars when someone becomes seriously ill.

While concerns about cost sharing are not new, the recent coverage expansions under the ACA put a new focus on what it means for coverage to be affordable. The goal of the law was to cover more of the uninsured, many of whom have limited means. The law requires most people to have health insurance, if they can afford to pay the premium, or to pay a penalty. The issue for some families, however, is that the policies with affordable premiums may have cost sharing requirements that would be difficult for them to meet when they access services. Many of the policies in the state and federal marketplaces have significant cost sharing, as do many policies provided to people at work [here]. The ACA provides cost-sharing assistance to some, primarily to those with incomes below 200 percent of poverty purchasing through a state or the federal marketplace (see sidebar). Others potentially face much higher out-of-pocket expenses.

We use information from the 2013 Survey of Consumer Finances to look at how household resources match up against potential cost-sharing requirements. We assume that households pay premiums out of current income, but that they may need to use savings or other assets if they become seriously ill in order to meet the deductible or the out-of-pocket limit under their health insurance policies. We show that many households, in particular those with lower incomes or where someone lacks insurance, have low levels of resources that would make it difficult for them to meet health insurance cost sharing demands.

Survey of Consumer Finances

The Survey of Consumer Finances (SCF) is a triennial, nationally representative household survey conducted by the Federal Reserve Board. The 2013 SCF provides a snapshot of household finances, including detailed information on households’ debts, assets, income and other characteristics, including the types of health insurance present in the household.1 

The SCF collects information for households, which in some cases will be different than the group of people considered to be a family in other surveys. Most of the information from the SCF, including the financial information, is designed to describe the “primary economic unit” (PEU), which is the economically dominant single person or couple (living together as spouses or partners) in a household and all of the other people living in the household who are financially dependent on that individual or couple. For this analysis, we limit the households to be more representative of those who are likely to rely on private health insurance by excluding (1) households where a dominant economic individual or his or her spouse/partner if either are over age 64 and (2) households with incomes under poverty.

The Affordable Care Act, Accessibility and Coverage Options

The ACA extended access to coverage to all citizens and legal residents and requires most people to either have health coverage or pay a penalty. People who are offered coverage at work are generally expected to get their coverage there, and the ACA has complementary policies that require employers with more than 50 workers to offer coverage meeting minimum standards in terms of cost and value to their full time workers or to pay a financial penalty. All citizens and legal residents not eligible for Medicare also may purchase coverage in a state or the federal marketplace, and those with incomes below 400% of poverty who are not offered coverage at work meeting minimum requirements and who are not eligible for Medicaid or CHIP also may qualify for tax credits to reduce their premiums.The ACA addresses cost sharing in private policies in several ways:

  • Most policies are required to have an out-of-pocket limit that limits the amount of cost sharing enrollees must pay in a year for covered services received from network providers. The maximum limits for 2015 are $6,600 for single coverage and $13,200 for family coverage. For policies offered in the non-group and small group markets, the limits apply to all cost sharing for the essential health benefits. In the larger group market, federal guidance provides employers with flexible to exclude otherwise covered services from the limit, permitting unlimited cost sharing [for more information].
  • Most private policies are prohibited from requiring cost sharing for specified preventive services [listed here].Federal regulations define “minimum value” for coverage offered by employers. Large employers must offer coverage that meets the minimum value standard or they may face financial penalties if one of their full-time employees receives subsidized coverage in a state or the federal marketplace. In addition, workers and their family members who are coverage by an employer that meets the minimum value requirement (as well as a separate requirement related to affordability of premium contributions) are not eligible for premium tax credits or cost sharing assistance.Minimum value is defined in relation to the cost of benefits for a standard population covered by typical self-funded group health plans. Basically, the cost sharing under an employer plan must pay for at least 60% of the anticipated costs for covering a standard population; taking into account the plan’s cost sharing. The federal government has provided a minimum value calculator to allow employers to test their plans, but alternative methods are also available. Generally, the minimum value requirement does not provide a meaningful check on cost sharing in employer plans. The large majority of plans have values that would exceed the 60% requirements [for more information], and the calculation does not reduce cost sharing much if at all beyond the maximum permitted out-of-pocket limits. This means that in many cases a plan with a deductible of $6,000 with the maximum out-of-pocket limit would meet the minimum value requirement.
  • For those who are not eligible for job-based coverage or Medicaid, the ACA allows people to enroll in non-group plans. New market rules establish four tiers of cost sharing and limit out-of-pocket expenses for patient cost sharing to the same limits as described above. In addition, people with incomes below 250% of poverty who purchase coverage through the marketplace are eligible to enroll in silver plans with reduced cost sharing. Those with the lowest incomes are eligible for greater reductions; the impact of the reductions on cost-sharing requirements is shown [here]

Results are shown for all these households as well as for households where someone had private insurance and for households where someone was uninsured. Although we are looking at cost sharing for people with insurance, we included households with people who were uninsured in 2013 because they are prime targets for coverage expansion under the ACA, either through expanded coverage at work or through new coverage options. For each groups results are further broken out by household size (one person or households of more than one person) and by poverty categories.

Using the information from the survey on household assets and debts, we developed two measures of resources that households may have to meet health insurance cost sharing. The measures used here could be considered conservative because they assume that a household can bring a large share of its saved resources to bear to pay one-year’s cost sharing in a health insurance policy.2 

  • The first category is liquid financial assets, which are those most easily converted to cash. The category includes checking and saving accounts, money market accounts, certificates of deposit, savings bonds, non-retirement mutual funds, stocks and bonds, but excludes the value of dedicated retirement accounts (such as 401k accounts) and the cash value of life insurance.
  • The second category is net financial assets, which is a broader measure of the household’s total resources. This category includes total all financial assets, including assets dedicated to retirement, reduced by the household’s unsecured debts. For this measure, the value of assets is reduced by credit-card debt and other unsecured loans, but debts secured by real property (such as mortgage debt) and loans for vehicles and education are not counted against assets. This category measures how much money a household has to pay medical expenses after meeting debt obligations.

We look at the median amount (one-half of households have more and one-half have less) for each measure to paint a basic picture of the financial resources available to households. Median asset levels, rather than averages, are used because assets, like income, are unevenly distributed and the high asset levels of wealthier households skew the distribution. We also calculate the percentages of households with the resources to meet specified deductibles and out-of-pocket cost sharing limits. We assume that a household meets medical cost sharing when they spend all of their net-financial assets or liquid financial assets; this assumption would leave households with no additional assets for savings or other emergencies and does not account for the complex financial picture many households face.

Health Insurance Cost Sharing

Private health insurance policies have several forms of cost sharing, including general deductibles that must be met before most services are covered, and specified dollar amounts (copayments) or percentage contributions (coinsurance) that plan enrollees must pay when they receive covered services. Most plans are required to have limits on annual enrollee cost sharing; the maximum allowed limits for 2015 are $6,600 for single coverage and $13,200 for family coverage.

Cost sharing requirements vary widely from policy to policy. Looking at plans offered by employers, about 80% of workers with employer plans have a general annual deductible and, among those, average deductibles for single coverage are almost $1,800 in smaller firms (3 to 199 workers) and about $970 in large firms3 . Among all workers enrolled in a plan with a deductible in 2014, the average is $1,217.  There is considerable variation in deductibles that covered workers face. Around these averages, 25% of workers enrolled in a plan with a deductible at smaller firms have a single deductible of $894 or less while 25% have a single deductible of $2,500 or more. In larger firms, 25% of workers who are enrolled in a plan with a deductible have a single deductible of $500 or less while 25% have a single deductible of $1,265 or more. For all covered workers, 25% are in a plan with a deductible of 500 or less and 75% are in a plan with a deductible of $1,500 or more. Out-of-pocket limits for workers in single coverage in plans offered by employers average about $3,500 in small firms and about $3,000 in larger firms; 25% of workers in smaller firms have an out-of-pocket limit of $5,000 or more for single coverage; the comparable amount for larger firms is $4,000. Deductibles and out-of-pocket limits in family plans are usually about twice the single amounts, but some plans may have a different structure, such as a per enrollee limit which make them harder to characterize. A more complete picture of deductibles, out-of-pocket limits are other cost sharing in employer plans is available [here].

Cost sharing also varies significantly in nongroup plans both across and within metal tiers. For example, average single deductibles for plans with a combined deductible for medical and prescription drugs offered in the federal marketplace range from $69 for platinum plans to $5,328 in bronze plans4 . As with employer plans, there is significant variation around the averages, for example 13% of silver plans on the federal marketplaces have a combined deductible of less than $1,500 dollars and seven percent have a deductible of $4,000 or more. Out-of-pocket limits also have a large range: $1,975 for platinum plans and $6,359 for bronze plans5 . For more information on cost sharing in the federal exchanges see [here]. Many lower income purchasers in the federal and state marketplaces also are eligible for subsidies that reduce the cost sharing in their policies [here].

For this analysis, we compare household resources against two deductible levels: $1,200 single/$2,400 family (referred to as the lower deductible amounts) and $2,500 single/$5,000 family (referred to as the higher deductible amounts); and against two out-of-pocket limits: $3,000 single/$6,000 family (referred to as the lower out-of-pocket limits) and $6,000 single/$12,000 family (referred to as the higher out-of-pocket limits). We chose these levels to represent the mid to high range of cost sharing. While there are plans with less cost sharing and plans with more cost sharing, these levels should provide a reasonably good measure of the ability of families to meet of the typical cost sharing requirements available in the market. Households with one member are measure against the single amounts and households with more than one member are measured against the family amounts.

Median Financial Resources

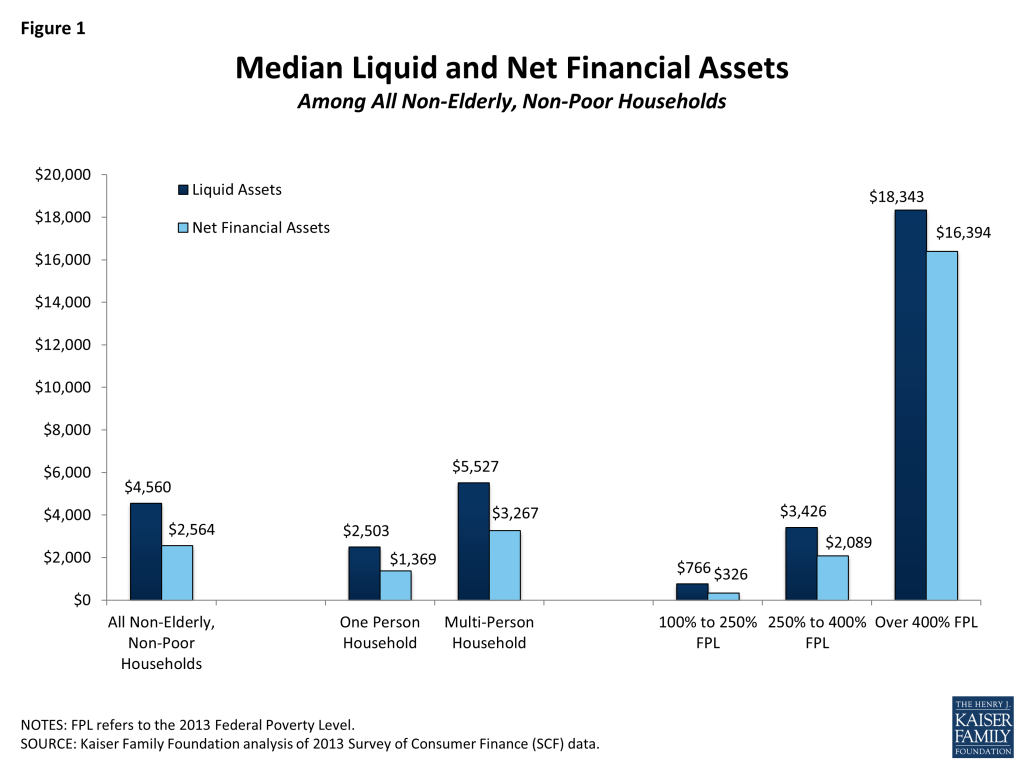
Among non-elderly, non-poor households, the median amount of liquid financial assets is $4,560 and the median amount of net financial assets is $2,564. Liquid financial and net financial assets are lower among single households than among households of two or more members, and are much lower in households with incomes below 400% of poverty than above (Figure 1). Households with incomes between 100% and 250% of poverty have quite low levels: the median for liquid financial assets is just over $700 and median for net financial assets is just over $300. The poverty categories are defined based upon the poverty level established by the Department of Health and Human Service for 2013. In 2015, a family of four earning $24,250 would be 100% of poverty and households at $60,625 and $97,000 would be 250% and 400% of poverty, respectively. For a single individual, the poverty level in 2015 is $11,770, individuals earning $29,425 and $47,080 would be at 250% and 400% of poverty respectively.6 

Figure 1: Median Liquid and Net Financial Assets Among All Non-Elderly, Non-Poor Households

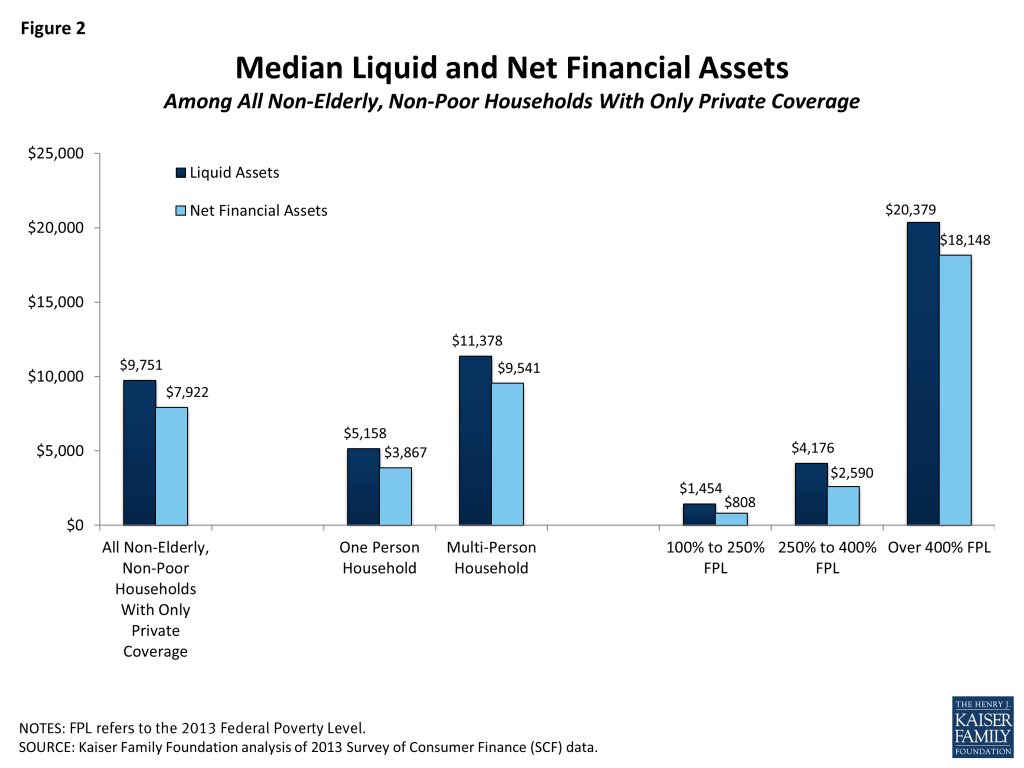
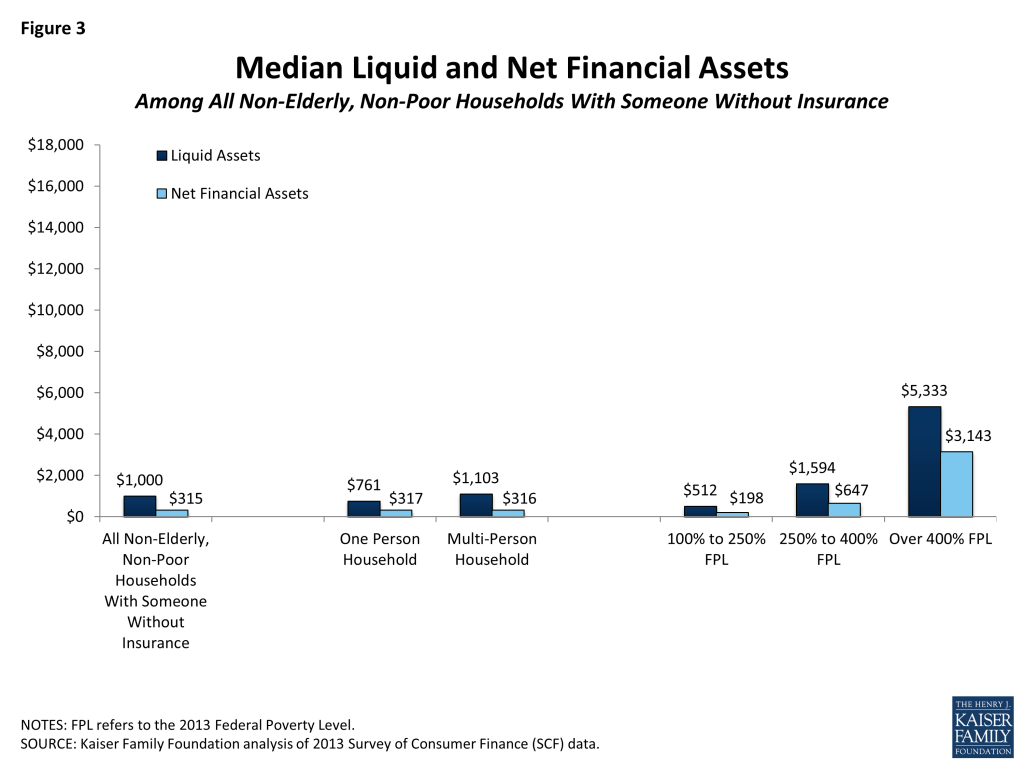
Asset levels vary when everyone in the household is covered by private insurance and when someone in the household is without insurance. In households where the only form of coverage was private health insurance, median liquid financial assets are $9,751 and median financial assets are $7,922 (Figure 2). The distribution is similar to that of all households: median asset levels are higher among households with one member than among those with one-member and households with incomes under 400% of poverty have much lower assets than those with higher incomes. In contrast, households where at least one member was uninsured have lower asset levels: the median level of liquid financial assets is $1,000 and the median level of net financial assets is $315. Households with lower incomes have particularly low asset levels (Figure 3).

Figure 2: Median Liquid and Net Financial Assets Among All Non-Elderly, Non-Poor Households With Only Private Coverage
Figure 3: Median Liquid and Net Financial Assets Among All Non-Elderly, Non-Poor Households With Someone Without Insurance

The figures above show that many households may have difficulty meeting health insurance cost-sharing requirements with existing resources. Median assets levels for households with incomes below 400% of poverty, and particularly those between 100 and 250% of poverty, are low when compared to the higher deductible amounts and out-of-pocket limits in health insurance policies. Families where someone lacked health insurance, a primary target for coverage expansion under the ACA, have relatively low assets across the board.

Assets to Meet Cost-Sharing Requirements

In this section we look at the percent of households that have sufficient assets to meet the specified deductible amounts and out-of-pocket limits. The discussion here focuses on liquid financial assets because for most households they are the higher measure. Similar figures using the net financial asset measure are shown in the appendix. In general, many households, and particularly those with lower incomes or with someone who was uninsured, do not have sufficient liquid financial assets to cover the deductibles amounts. Looking at the out-of-pocket limits, most households do not have sufficient liquid financial assets to meet either the lower or the higher limit. The percentage of households who have both low incomes and enough assets to meet either of the out-of-pocket limits is very low.

Deductibles

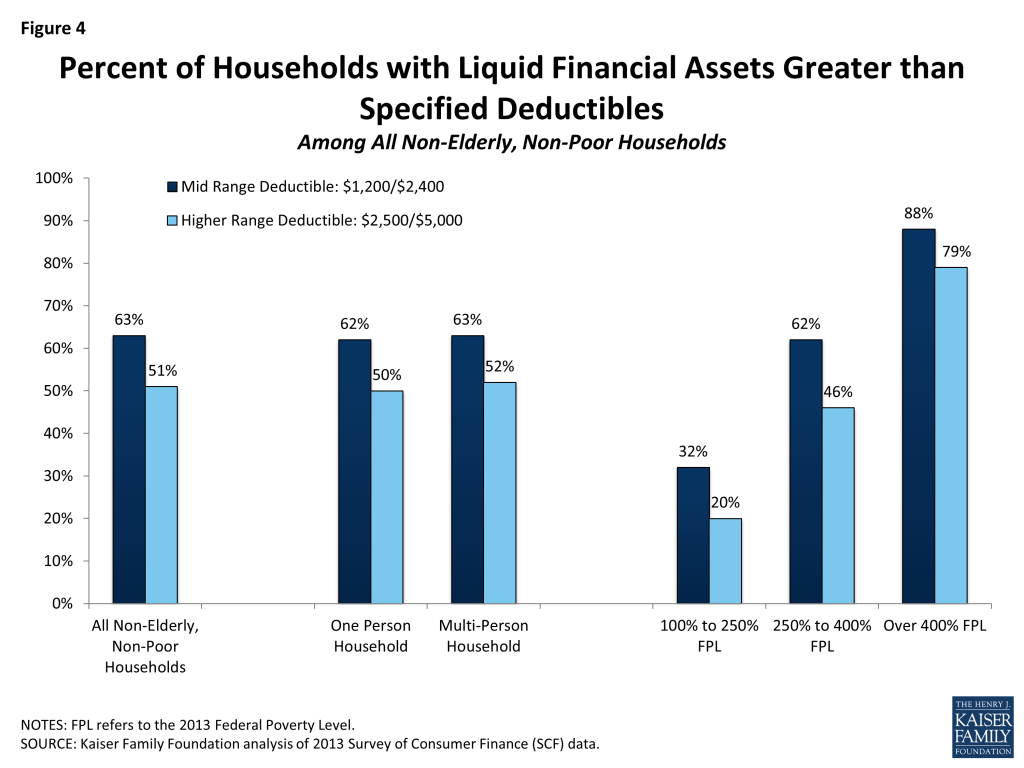
Overall, three in five (63%) households have enough liquid financial assets to meet the lower deductible amounts while one-half (51%) can meet the higher deductible amounts (Figure 4). These percentages are similar for single-member and multi-member households, but vary significantly by family income. Only 32% of households with incomes between 100% and 250% of poverty can meet the lower deductible amounts, while one-in-five can meet the higher deductible amounts. In contrast, 88% of households with incomes over 400% of poverty can meet the lower deductible amounts and three-in-four (79%) can meet the higher amounts.

Figure 4: Percent of Households with Liquid Financial Assets Greater than Specified Deductibles Among All Non-Elderly, Non-Poor Households

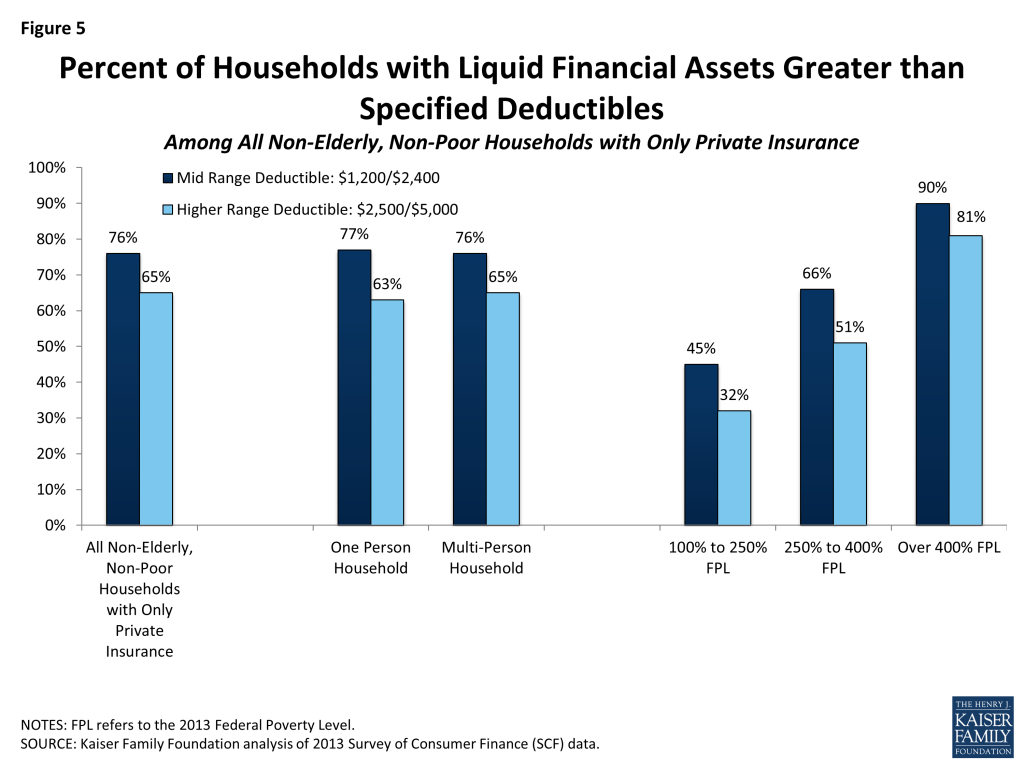
Deductibles are easier to meet for households with only private coverage, where 76% have sufficient liquid financial assets to meet the lower deductible amounts and 65% can meet the higher amounts (Figure 5). Again there is significant variation across income. Among households with only private coverage and incomes between 100% and 250% of poverty, two in five (45%) have enough liquid financial assets to meet the lower deductible amounts and 32% can meet the higher amounts; in contrast, for households with incomes above 400% of poverty, 90% have enough liquid financial assets to meet the lower deductible amounts and 81% can meet the higher amounts.

Figure 5: Percent of Households with Liquid Financial Assets Greater than Specified Deductibles Among All Non-Elderly, Non-Poor Households with Only Private Insurance

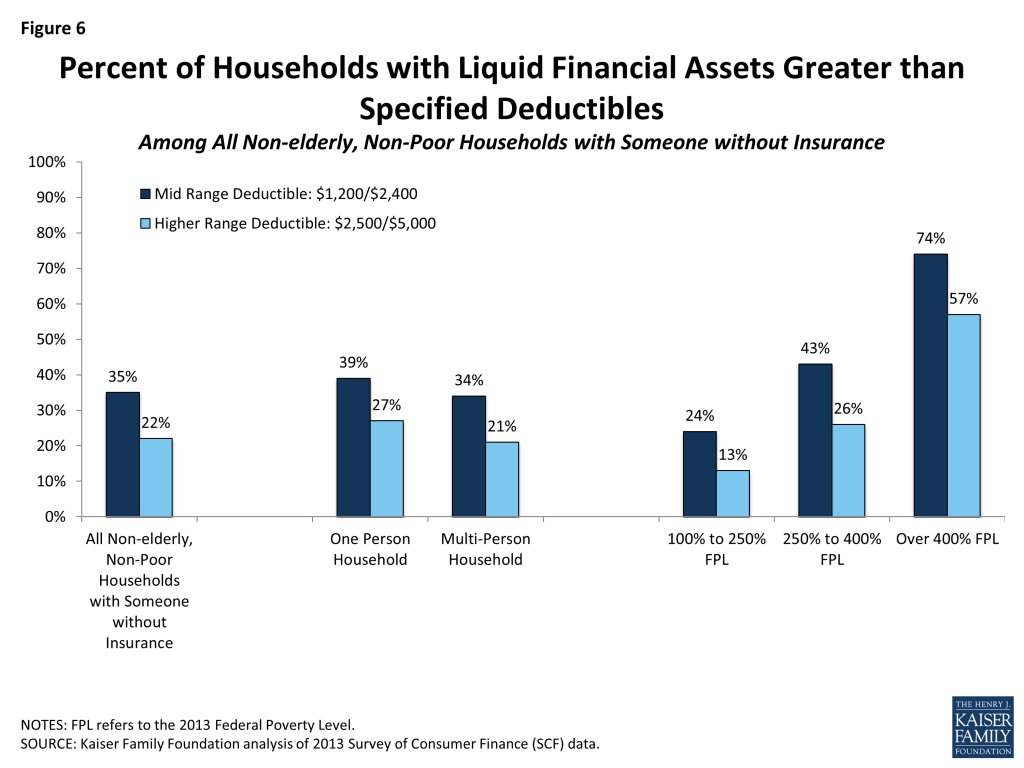
Households with at least one person who was uninsured have a particularly hard time meeting the deductible amounts. Only about one-in-three (35%) of these households have enough liquid financial assets to meet the lower deductible amounts and only 22% can meet the higher amounts. Among households with incomes between 100% and 250% of poverty, about a quarter (24%) have enough liquid financial assets to meet the lower deductible amounts and only 13% can meet the higher amounts. Among households with incomes over 400% of poverty, 74% have enough liquid financial assets to meet the lower deductible amounts while just about one-half (57%) can meet the higher deductible amounts.

Figure 6: Percent of Households with Liquid Financial Assets Greater than Specified Deductibles Among All Non-elderly, Non-Poor Households with Someone without Insurance

Out-of-Pocket Limits

Out-of-pocket limits are higher than deductibles and meeting them is more difficult for many families. Forty-eight percent of households have enough liquid financial assets to meet the lower out-of-pocket limits and 37% can meet the higher limits (Figure 7). The percentages are quite low for households with incomes between 100% and 250% of poverty, with 18% having enough liquid financial assets to meet the lower out-of-pocket limits and 11% being able to meet the higher limits. Among households with incomes over 400% of poverty, 75% have enough liquid financial assets to meet the lower out-of-pocket limits while just 62% can meet the higher limits.

Figure 7: Percent of Households with Liquid Financial Assets Greater than Specified Out-Of-Pocket Limits Among All Non-Elderly, Non-Poor Households

Things are somewhat better for households with only private health insurance, where 61% of households have enough liquid financial assets to meet the lower out-of-pocket limit and 49% can meet the higher limit (Figure 8). Still, only 29% of these households with incomes between 100% and 250% of poverty can meet the lower out-of-pocket limit and only 18% can meet the higher amount. The percentages for those over 400% of poverty are similar to those for households overall.

Figure 8: Percent of Households with Liquid Financial Assets Greater than Specified Out-Of-Pocket Limits Among All Non-Elderly, Non-Poor Households with only Private Insurance

A large share of households in which someone was uninsured lacks enough resources to meet the out-of-pocket limits (Figure 9). Only 20% of these households have enough liquid financial assets to meet the lower out-of-pocket limit and only 12% can meet the higher limit. Even among households with incomes above 400% of poverty, only 50% have liquid financial assets that meet the lower out-of-pocket limit and 35% can meet the higher limit.

Figure 9: Percent of Households with Liquid Financial Assets Greater than Specified Out-Of-Pocket Limits Among All Non-Elderly, Non-Poor Households with Someone without Insurance

Additional Financial Support

Faced with medical bills, people may turn to friends and relatives to help them meet expenses. The SCF asks respondents whether in an emergency they could obtain $3,000 of financial assistance from friends or relatives7 . Among non-elderly, non-poor households, 69% respond affirmatively to this question. Households with higher incomes are more likely to say that they can obtain $3,000 from family or friends in an emergency: 82% for households with incomes over 400% of poverty compared with 51% for households with incomes between 100% and 250% of poverty. Similarly, just over one-half (55%) of households that have liquid financial assets below the lower out-of-pocket limits ($3,000 single/$6,000 family) say that they could do so.

Figure 10: Percent of Households that Could Obtain $3,000 from Relatives or Friends in an Emergency Among All Non-Elderly, Non-Poor Households

Discussion

Many non-elderly, non-poor households lack the resources to meet the deductibles and out-of-pocket limits that they may encounter in the private insurance market. Many households have insufficient liquid financial assets to meet the specified cost sharing measures, and the situation for net financial assets is no better (See Attachment 1). Not surprisingly, the difficulties are greater in households with lower incomes and with someone who lacked health insurance. These groups are targets for expanded coverage under the ACA and, as they transition into coverage, it will be important to assess whether the policies they can get protect them financially if they become seriously ill.

While the ACA provides for reduced cost sharing for some people with incomes below 250% of poverty that purchase coverage in a state or the federal marketplace, there is no assistance with cost sharing for those with higher incomes or for those obtaining coverage through a job. As is evident from the Figures and the appendix, substantial shares of households with incomes between 250% and 400% of poverty would be unable to meet even the lower out-of-pocket limits with their current resources, and meaningful shares of households with incomes over 400% of poverty would have problems as well. For these people, serious illness may require that they borrow funds or become indebted to their health care providers. Roughly half of those with liquid financial assets below the cost sharing measures say they could obtain $3,000 in an emergency from friends or relatives.

The higher cost sharing in private insurance has been credited with helping to slow the rate of health care cost growth. Asking enrollees to pay a portion of costs at the point of service may encourage them to make consumer health care more wisely and to weigh the costs and benefits of alternative treatment options and providers. At the same time, cost sharing that seriously stresses family budgets may act as an impediment to seeking needed care, frustrating a primary reason people seek to be insured in the first place. For these families, having coverage would certainly reduce the ultimate financial consequences of serious illness, which is important both for the family and for providers delivering care, but this is a bargain that may look better in hindsight, after an illness has occurred, than it does when the family is trying to decide whether or not to pay for such a plan in the first place. Particularly as we extend private coverage to more families with lower incomes and limited resources, we need to be cognizant of their financial capacity to use the coverage that they are being asked to buy.

Methods:

The 2013 Survey of Consumer Finances (SCF) is a triennial, nationally representative household survey conducted by the Federal Reserve Board. The survey has a dual frame, with respondents selected both from a national area probability design and a sample of households with high income tax returns.8  The 2013 SCF is the most current survey available and is based on 6,015 households.9  For this analysis, we excluded households in which (1) a financially dominant individual or his or her spouse was over age 64 or (household income was less than 100% of poverty). These limitations reduce the number of households to 4,080.

The SCF defines a family as a “primary economic unit (PEU),” or all of the individuals living in a household who are financially interdependent with the dominant individual or couple.10  Income and assets are measured for the PEU in the household. The definitions of the different types of assets and debts are available [here] and [here]. The analysis uses median rather than mean measures of assets to account for the skewed distribution of household financial characteristics. Weights were applied to ensure medians were representative of the population.

The SCF provides information about the types of insurance present in each household, and also about whether each member had coverage or not. Unlike financial characteristics, insurance questions are asked of all members of a household, including members that are not part of the PEU, which could be a relative who is financially independent or a financially independent nonrelative living in the household. This creates some potential ambiguity when we look at households in which someone has private coverage because it is possible that the only people with private coverage are not part of the PEU. To check if this was biasing results, we also looked at households where everyone had private coverage and no other type of coverage and found that the quartiles for liquid and net financial assets were similar. Because we have information about whether or not each person in the household has some coverage or not, we were better able to target the members of the PEU in identifying households where someone was uninsured. We selected only households where the financially dominant individual, his or her spouse or partner, or his or her financially dependent children (regardless of the child’s age) were uninsured. Households with only private insurance are covered those in which all the members are covered by employer coverage, private non-group coverage, Tri-care and/or a union sponsored plan.


Percent of Households with Net Financial Assets Greater than Specified Deductibles and Out of Pocket Maximums
Threshold:Mid Range Deductible:High Range Deductible:Mid RangeOut-of-Pocket Maximum:High RangeOut-of-Pocket Maximum:
Single/Family Coverage($1,200-Single and $2,400-Family)($2,500-Single and $5,000-Family)($3,000-Single and $6,000-Family)($6,000-Single and $12,000-Family)
Among All Non-elderly, Non-Poor Households
All Households53%45%43%35%
Size of Household
One Person Households51%43%41%34%
Multi-Person Households53%45%43%35%
Poverty Level
100% to 250% FPL26%18%17%10%
250% to 400% FPL51%39%37%28%
Over 400% FPL76%70%67%59%
Among All Non-Elderly, Non-Poor Households with Only Private Insurance
All Households65%57%54%46%
Size of Household
One Person Households64%55%52%44%
Multi-Person Households66%57%55%47%
Poverty Level
100% to 250% FPL38%28%27%18%
250% to 400% FPL54%42%39%32%
Over 400% FPL78%72%69%61%
Among All Non-Elderly, Non-Poor Households with Someone without Insurance
All Households27%19%17%11%
Size of Household
One Person Households30%24%21%16%
Multi-Person Households27%17%16%9%
Poverty Level
100% to 250% FPL18%12%11%5%
250% to 400% FPL34%22%21%14%
Over 400% FPL59%45%40%30%
NOTES: FPL (federal poverty level). Households with only private insurance are covered by employer coverage, non-group coverage, Tri-care and/or a union sponsored plan. Figures reported are percent of households meeting family thresholds for households with more than one member and single-coverage threshold for individual households.SOURCE: Kaiser Family Foundation analysis of 2013 Survey of Consumer Finance (SCF) data.

Endnotes

  1. The survey asks whether anyone in the household has health insurance and if so, what types of insurance people have. The survey also ascertains whether everyone in the household is covered by the same type of health insurance, whether everyone is uninsured, and who in the household is uninsured. ↩︎
  2. Jacobs, Paul, and Gary Claxton. “Comparing the Assets of Uninsured Households to Cost Sharing Under High-Deductible Health Plans.” Health Affairs 27.3 (2008): W214-221. Web. 14 Jan. 2013. http://content.healthaffairs.org/content/27/3/w214.full.pdf html. ↩︎
  3. Kaiser Family Foundation. “Employer Health Benefits Survey”. Sept 2015. https://modern.kff.org/report-section/ehbs-2014-section-seven-employee-cost-sharing/ ↩︎
  4. Averages and distributions are not weighted by enrollment. For more information see: Claxton, Gary; Cox, Cynthia and Rae, Matthew. “The Cost of Care with Marketplace coverage”. Kaiser Family Foundation. February 11, 2015. https://modern.kff.org/health-reform/issue-brief/the-cost-of-care-with-marketplace-coverage/ ↩︎
  5. Averages and distributions are not weighted by enrollment. For more information see: Claxton, Gary; Cox, Cynthia and Rae, Matthew. “The Cost of Care with Marketplace coverage”. Kaiser Family Foundation. February 11, 2015. https://modern.kff.org/health-reform/issue-brief/the-cost-of-care-with-marketplace-coverage/ ↩︎
  6. U.S. Department of Health & Human Services. “2015 Poverty Guidelines.” http://aspe.hhs.gov/poverty/15poverty.cfm ↩︎
  7. The exact question wording is: “In an emergency could you (or your {husband/wife/partner}) get financial assistance of $3,000 or more from any friends or relatives who do not live with you?”. “Codebook for the 2013 Survey of Consumer Finances.” Federal Reserve. http://www.federalreserve.gov/econresdata/scf/scfindex.htm ↩︎
  8. Kennickell, Arthur B. “Wealth Measurement in the Survey of Consumer Finances: Methodology and Directions for Future Research”.  May 2000. Web. 23 Jan. 2013. http://www.federalreserve.gov/econresdata/scf/files/measurement.pdf ↩︎
  9. Kennickell, Arthur. “Codebook for the 2013 Survey of Consumer Finances.” Division of Research and Statistics Board of Governors of the Federal Reserve System. Web. 23 Jan. 2013. http://www.federalreserve.gov/econresdata/scf/files/codebk2013.txt ↩︎
  10. Brian K. Bucks, Arthur B. Kennickell, Traci L. Mach and Kevin B. Moore. “Changes in U.S. Family Finances from 2004 to 2007: Evidence from the Survey of Consumer Finances.” Federal Reserve Bulletin, vol. 95 (February 2009), pp. A53. ↩︎
News Release

How Would a Long-Term “Doc Fix” Affect Seniors’ Medicare Costs?

Published: Mar 10, 2015

In this new Policy Insight, the Kaiser Family Foundation’s Cristina Boccuti and Tricia Neuman examine how Congress’ effort to permanently stave off scheduled cuts in Medicare’s physician payments could affect what Medicare beneficiaries pay for their care — both in premiums and in other potential changes — to offset the cost of the Sustainable Growth Rate (SGR) “doc fix.”

Previous columns in the Policy Insights series are also available.

Medicaid Moving Forward

Author: Julia Paradise
Published: Mar 9, 2015

Issue Brief

Medicaid is the nation’s main public health insurance program for people with low income and the single largest source of public health coverage in the U.S. covering nearly 70 million Americans. 1  States design and administer their own Medicaid programs within federal requirements, and states and the federal government finance the program jointly. Medicaid plays many roles in our health care system (Figure 1). Medicaid coverage facilitates access to care for beneficiaries, covering a wide range of benefits and tightly limiting out-of-pocket costs for care. As a major payer, Medicaid is a core source of financing for safety-net hospitals and health centers that serve low-income communities, including many of the uninsured. It is also the main source of coverage and financing for both nursing home and community-based long-term care. Altogether, Medicaid finances 16% of total personal health spending in the U.S.

Figure 1: Medicaid’s Role in Our Health Care System

The Affordable Care Act (ACA), enacted on March 23, 2010, expanded the Medicaid program significantly as part of a broader plan to cover millions of uninsured Americans.2  Specifically, the ACA expanded Medicaid eligibility to nearly all non-elderly adults with income at or below 138% of the federal poverty level (FPL) – about $16,245 for an individual in 2015. This expansion established a new coverage pathway for millions of uninsured adults who were previously excluded from Medicaid, beginning January 1, 2014. The law also provided for 100% federal funding of the expansion through 2016, declining gradually to 90% in 2020 and future years. However, the Supreme Court ruling on the ACA in June 2012 effectively made the Medicaid expansion optional for states.

Beyond expanding Medicaid, the ACA introduced other reforms that improve the program in all states, regardless of their Medicaid expansion decision. The law required states to simplify and modernize their enrollment processes, and to create a coordinated eligibility and enrollment system for Medicaid, the Children’s Health Insurance Program (CHIP), and the Marketplace, to facilitate enrollment and promote continuity of coverage. The ACA also established an array of new authorities and funding opportunities for delivery system and payment reform initiatives in Medicare, Medicaid, and CHIP, designed to advance better and more cost-effective models of care, particularly for those with high needs and costs, whose care is poorly coordinated, leading to both serious gaps and costly redundancy. Finally, the law provided new options and incentives to help states rebalance their Medicaid long-term care programs in favor of community-based services and supports rather than institutional care. Collectively, these provisions have accelerated Medicaid innovation already underway in many states. Because Medicaid covers many of the highest-need populations in the U.S., states have unique financial and policy leverage to reform the systems of care that serve them.

Between action in many states to strengthen the Medicaid program and far-reaching ACA provisions in key Medicaid domains, Medicaid is in a period of historic transformation. While data and analysis on the impact of the changes underway will take time to emerge, this issue brief provides a current profile of Medicaid and highlights developments in the program unfolding at the federal and state level. National and state-level data on key dimensions of the Medicaid program are included in a set of tables following the brief.

Who does Medicaid cover?

Before the ACA, federal law provided federal funding for Medicaid only for specified categories of low-income individuals: children, pregnant women, parents of dependent children, individuals with disabilities, and people age 65 and older. States were required to cover individuals in these groups up to federal minimum income thresholds, but also had the option to expand coverage to people at higher income levels. Importantly, prior to the ACA low-income adults were largely excluded from Medicaid. In FY 2011, the most current year for which national data are available, about three-quarters of all Medicaid beneficiaries were children and non-elderly, non-disabled adults (primarily, working parents), and the elderly and younger people with disabilities accounted for the remaining one-quarter (Figure 2).

Figure 2: Medicaid Enrollees and Expenditures, FY 2011

Over the last 25 years, many states have taken action to expand coverage for children. To illustrate, while federal law required states to provide Medicaid for children up to at least 100% FPL (133% FPL for children under age 6), as of January 2015, 27 states (including DC) had expanded eligibility to at least 255% FPL under Medicaid or CHIP, and in 19 of these states, the eligibility cut-off was over 300% FPL. Together, Medicaid and CHIP now cover more than 1 in every 3 children, and the role of the programs is even larger among low-income children and children of color. In December 2014, 29.1 million children were enrolled in Medicaid and CHIP—the vast majority in Medicaid.3 

The history of Medicaid coverage of adults is sharply different. In 2013, before the ACA Medicaid expansion took effect, the median state Medicaid income eligibility cut-off for working parents was 61% FPL and, in most states, non-elderly adults without dependent children (“childless adults”) were categorically ineligible for Medicaid.4  States’ income eligibility thresholds have typically been higher for the elderly and people with disabilities. States generally must provide Medicaid automatically to seniors and people with disabilities who receive Supplemental Security Income (SSI) benefits, for which the federal benefit rate is 74% FPL.5  States also have the option to cover elderly individuals and people with disabilities who have more income or high medical expenses relative to their income.6  The ACA did not alter the Medicaid eligibility rules for these two groups, but some adults with disabilities with too much income to qualify through the Medicaid disability pathway may now qualify for Medicaid through the adult expansion group (in states that have adopted the expansion) .

In FY 2010, 14% of all Medicaid beneficiaries – 9.6 million – were “dual eligible” seniors and younger persons with disabilities who are covered by Medicare as well. One of every five Medicare beneficiaries is a dual eligible. Dual eligible beneficiaries are very poor and many have high health and long-term care needs. Medicaid assists them with their Medicare premiums and cost-sharing, and covers full Medicaid benefits for a large majority of them – most importantly, long-term services and supports, which Medicare does not cover.

Key ACA reforms. The ACA fundamentally reformed Medicaid by establishing eligibility for nonelderly adults, and also by putting in place a uniform, national minimum income eligibility threshold of 138% FPL for nearly all individuals under age 65. The effect of these changes was to establish Medicaid as the coverage pathway for low-income people in the ACA’s broader system for covering the uninsured. As noted earlier, although the Medicaid expansion was intended to be national, the Supreme Court ruling essentially made it optional for states. To date, 29 states (including DC) have adopted the expansion and six states are discussing it; 16 states are not adopting the expansion at this time (Figure 3). Between the three-month period leading up to the first ACA open enrollment period in October 2013, and December 2014, Medicaid and CHIP enrollment increased by more than 10.7 million individuals in the 49 states reporting data for both periods.7 

Figure 3: Current Status of Medicaid Expansion Decisions

States’ Medicaid expansion decisions have major implications for low-income adults. Whereas the expansion states provide Medicaid for adults up to 138% FPL, as of January 2015, the median Medicaid income limit for parents in the non-expansion states is just 46% FPL (about $9,200 for a family of three in 2015), and in all but one of the non-expansion states, childless adults remain ineligible for Medicaid (Figure 4).8  Because the ACA provided Medicaid eligibility for low-income adults, it did not provide financial assistance to purchase Marketplace coverage for those below 100% FPL. As a result, in the states not adopting the Medicaid expansion, almost 4 million uninsured poor adults fall into a “coverage gap.”9 

Figure 4: Median Medicaid/CHIP Income Eligibility Thresholds, March 2015

The ACA protected the gains in children’s coverage that have been achieved over time in Medicaid and CHIP. The national Medicaid minimum income eligibility threshold of 138% FPL applies to all children up to age 19, and the law requires states to maintain at least the eligibility limits they had in place when the ACA was enacted, through September 30, 2019. Also, as of 2014, states must provide Medicaid coverage for children aging out of foster care, up to age 26. Finally, the ACA extends CHIP funding through 2015, and provides for a 23 percentage-point increase in the federal matching rates under CHIP during the period FY 2016-2019 if the Congress extends CHIP funding beyond 2015.10 

What services does Medicaid cover?

Medicaid covers a wide range of services to meet the diverse needs of the populations it serves. Medicaid benefits include both acute care services and a broad array of long-term services and supports that Medicare and most private insurance plans do not cover or tightly limit. States have flexibility to charge limited premiums and cost-sharing in Medicaid, subject to federal parameters. Premiums are generally prohibited for beneficiaries with income below 150% FPL. Cost-sharing for people with income below 100% FPL is limited to “nominal” amounts specified in federal regulations, with higher levels allowed for beneficiaries at higher income levels. However, certain groups are exempt from cost-sharing, including mandatory eligible children, pregnant women, most children and adults with disabilities, people residing in institutions, and people receiving hospice care. In addition, certain services are exempt from cost-sharing: emergency services, preventive services for children, pregnancy-related services, and family planning services. Total Medicaid premiums and cost-sharing for a family cannot exceed 5% of the family’s income on a quarterly or monthly basis.11 

States are required by federal law to cover specified “mandatory” services in Medicaid, and they can also elect to cover many services designated as “optional” (Figure 5); these benefits apply to adults eligible for Medicaid under pre-ACA eligibility rules. Many states choose to cover prescription drugs (all states), dental care, durable medical equipment, and personal care services. The Medicaid benefit package for children, known as EPSDT (Early and Periodic Screening, Diagnosis, and Treatment), is uniquely comprehensive, addressing children’s developmental as well as health care needs, and includes many services that are critical for children with special health care needs. Under EPSDT, children up to age 21 are entitled to all medically necessary Medicaid services, including optional services, even if the state does not cover them for adults.

Figure 5: Medicaid Benefits: Mandatory and Selected Optional Services

In addition to nursing facility and home health benefits, which are mandatory long-term care services, states also cover many optional home and community-based services (HCBS).12  HCBS include targeted case management, personal care services, family and caregiver training and support; rehabilitative services, housing coordination to help individuals locate and obtain community housing; and a diversity of other services. Medicaid is the main payer for post-acute institutional and community-based long-term care in the U.S., financing 40% of total spending in this area.13 

Until relatively recently, federal law generally required states to provide the same benefits to all Medicaid beneficiaries statewide. Legislation enacted in 2006 gave states limited flexibility to provide “benchmark” benefits to some Medicaid beneficiaries based on one of three commercial insurance plans specified in the law or a benefit package determined appropriate by the HHS Secretary. However, few states actually used the benchmark authority. States also have authority to use Medicaid dollars to pay premiums for job-based health insurance for Medicaid beneficiaries who are offered it, an approach known as “premium assistance.” States must generally provide wrap-around services and cost-sharing protection to fill in any gaps between the private coverage and Medicaid.

Key ACA reforms. Under the ACA, most adults in the new Medicaid expansion group receive “Alternative Benefit Plans” (ABPs), which is the new term for the Medicaid benchmark options just mentioned. Medicaid ABPs must include the same ten essential health benefit (EHB) categories that Marketplace plans under the ACA must include. In addition, ABPs must provide parity between physical and mental health/substance use disorder benefits, offer the full range of EHB preventive services, and cover family planning services and supplies, FQHC and RHC services, and non-emergency medical transportation. Compared to traditional Medicaid benefits for adults, ABPs based on commercial insurance products may provide broader coverage of some services (e.g., behavioral health care, preventive care) and narrower coverage of other services (e.g., prescription drugs, long-term services).14  All but a few states have aligned their ABP with their traditional Medicaid benefit package for adults. Certain populations must have access to all Medicaid state plan benefits, even if they are eligible for Medicaid through the new adult expansion group. They include individuals who are medically frail or have special medical needs, including people with disabling mental health disorders and complex medical conditions, dual eligible beneficiaries, and specified other beneficiary groups.

Revised regulations on Medicaid premiums and cost-sharing limit copayments for those with income at or below 100% FPL to $4 for outpatient services, $8 for non-preferred drugs and non-emergency use of the emergency department, and $75 per inpatient admission; as before, states can charge higher cost-sharing for beneficiaries with income above 100% FPL.15  The prohibition against premiums for those at or below 150% FPL, the exemptions mentioned earlier, and the 5% aggregate cap on premiums and cost-sharing remain in place.

How do Medicaid beneficiaries get care?

Most Medicaid beneficiaries obtain their care from private office-based physicians and other health professionals. Safety-net health centers and hospitals also play a major role in serving the Medicaid population. Thirty-nine states now contract with comprehensive managed care organizations (MCOs) to serve at least some Medicaid beneficiaries, and nationally, over half of all Medicaid beneficiaries – primarily children and parents – get their care through these plans (Figure 6). States pay the MCOs a monthly premium for each enrolled Medicaid beneficiary. States are relying increasingly on MCOs, expanding managed care to include higher-need Medicaid populations, such as people with disabilities and dual eligible beneficiaries, as well as Medicaid expansion adults. States are also adopting managed long-term services and supports. Many Medicaid beneficiaries who are not in risk-based MCOs are enrolled in Primary Care Case Management (PCCM) programs, in which states pay for care on a fee-for-service basis but also pay contracted primary care providers an additional small monthly fee to coordinate care for their Medicaid patients. Both risk-based managed care and PCCM programs can be understood, in part, as means of establishing networks of participating providers and garnering greater access to care for Medicaid beneficiaries.

Figure 6: States Contracting with Comprehensive Medicaid Managed Care Organizations (MCOs)

On the long-term care front, states have been working over the last several decades to rebalance their programs by devoting more of their long-term care spending to HCBS rather than institutional care. While the majority of Medicaid long-term care spending still goes toward institutional care, the share spent on HCBS continues to grow. In FY 2013, HCBS accounted for 46% of total Medicaid long-term care spending, up from 32% in FY 2002.16 

Key ACA reforms. The ACA includes many investments, funding opportunities, demonstration programs, and new authorities designed to drive health care delivery and payment system reforms in Medicaid and other public insurance programs. These provisions have accelerated ongoing innovation in Medicaid programs, including implementation of models like patient-centered medical homes and accountable care organizations (ACOs) that involve a more central role for preventive and primary care, increased care coordination for beneficiaries with complex needs, and financial incentives linked to performance. States are combining and integrating these approaches in different ways with their underlying delivery and payment systems in Medicaid. The ACA also provides states with expanded options and enhanced federal financing to improve access to and delivery of Medicaid long-term services and supports, and to provide incentives to states to shift more long-term care spending to HCBS. Nearly every state has adopted at least one of six key Medicaid LTSS options contained in the ACA, with many states pursuing multiple options.17 

How is access to care in Medicaid?

Medicaid beneficiaries fare much better than the uninsured on key measures of access to care, utilization, unmet need, and financial protection. The vast majority of Medicaid beneficiaries have a usual source of care, compared to sizable shares of the uninsured who do not, and they are significantly more likely to see a doctor (Figure 7). Medicaid also lowers financial barriers to care and limits out-of-pocket costs, and Medicaid beneficiaries are much less likely than the uninsured to report unmet health care needs.18  19  20 

Figure 7: Access to Care by Health Insurance Status, 2013

Comparisons between Medicaid and private insurance are also informative. Research based on national surveys shows that both children and adults in Medicaid have access to and use primary and preventive care at rates comparable to their counterparts with employer-sponsored insurance (ESI). When demographic, health status, and socioeconomic differences between the two insured populations are controlled, the shares with a usual source of care are similar, as are the shares with any office or doctor visit, and the shares with any specialist visit.21  Likewise, controlling for these differences, the percentages of children with unmet needs for medical care, dental care, or prescription drugs due to cost are comparable between the two insured groups (and low); among adults, rates of unmet needs due to cost are lower for those with Medicaid, although unmet needs due to non-financial barriers, like transportation, are higher for Medicaid adults.

Although analyses of survey data show quite robust access to care in Medicaid,22  other research highlights important challenges and gaps. Physician participation is more limited in Medicaid than in Medicare or private insurance.23  Physicians’ lower participation in Medicaid is often attributed to low payment rates in Medicaid, although evidence on the impact of fees on participation is mixed.24  Low participation of psychiatrists in Medicaid and shortages of substance abuse treatment professionals25  are a particular concern because of the high prevalence of behavioral health conditions among Medicaid beneficiaries; for beneficiaries with physical and behavioral health comorbidities, lack of access to behavioral health care can adversely affect management of their physical chronic conditions as well. Dentist participation in Medicaid is also low, but children with Medicaid are on par with privately insured children in terms of dental care (overall, use of dental care for children falls well below recommended levels). Adult access to dental care in Medicaid is a more significant problem. Coverage of adult dental services is optional in Medicaid and many states only cover care for pain relief or emergency dental care for injuries, trauma, or extractions; many also impose tight dollar caps on adult dental benefits.26 

According to a 2012 report by the Government Accountability Office, 38 states reported that they experienced challenges securing sufficient provider participation in Medicaid, with the leading reasons being overall provider shortages and low Medicaid payment rates.27  “Secret shopper” studies indicate more limited availability of new patient appointments for Medicaid beneficiaries compared to privately insured people.28  As managed care expands, provider payment rates are increasingly a matter of MCO policy rather than states’ Medicaid fee schedules and MCOs are responsible for establishing provider networks that are adequate to meet the needs of their enrollees. State and federal enforcement of network adequacy standards is essential to ensure that Medicaid managed care enrollees have robust access to care. Two recent reports by the HHS Office of Inspector General highlight significant shortcomings in oversight, including limited state enforcement actions against MCO violation of access standards and widespread inaccuracies in Medicaid provider directories.29  Finally, Medicaid beneficiaries face other barriers to access, including limited access to after-hours care and lack of transportation.

Key ACA reforms. The ACA made a number of major investments to expand access to care in Medicaid as enrollment in the program grows. For 2013 and 2014, the law raised Medicaid fees for most primary care physician services to Medicare fee levels, providing full federal financing for the increase. As a result, Medicaid fees for the affected services rose by an average of 73% overall. Study findings showing that the increase in primary care reimbursement rates resulted in higher availability of new-patient appointments for Medicaid enrollees provides evidence that provider payment rates can be an effective lever for expanding access.30  In the Kaiser Family Foundation’s recent 50-state survey of Medicaid directors, 15 states indicated that they planned to extend the primary care physician fee increase in 2015, at least partially.31 

The ACA also funded a vast expansion of community health centers and the National Health Service Corps, which supplies many of the physicians and other health professionals who staff them and provide care in underserved areas. As a result of these investments, along with the Medicaid expansion, which gives new revenues to health centers for many previously uninsured patients, health centers have been able to open many new sites, provide more comprehensive primary care services, including dental care and behavioral health services, and serve an increasing number of patients, now totaling over 21 million.

How much does Medicaid cost and how is it financed?

In FY 2013, Medicaid spending on services totaled almost $440 billion. About two-thirds of all spending was attributable to acute care and more than one-quarter was associated with long-term care (Figure 8). Supplemental payments to hospitals that serve a disproportionate share of Medicaid and uninsured patients, known as “DSH,” accounted for 3.7% of spending, and Medicaid spending for Medicare premiums and cost-sharing on behalf of dual eligible beneficiaries totaled 3.4%. As mentioned earlier, almost two-thirds of all Medicaid spending for services is attributable to the elderly and persons with disabilities, who make up just one-quarter of all Medicaid enrollees. Dual eligible beneficiaries alone account for almost 40% of all spending, driven largely by spending for long-term care. The 5% of Medicaid beneficiaries with the highest costs drive more than half of all Medicaid spending (Figure 9). Their high costs are attributable to their extensive needs for acute care, long-term care, or often both.

Figure 8: Medicaid Expenditures by Service, with DSH Payments and Payments to Medicare, FY 2013
Figure 9: Top 5% of Enrollees Accounted for More than Half of Medicaid Spending, FY 2011

Medicaid spending is driven by multiple factors, including the number and mix of enrollees, medical cost inflation, utilization, and state policy choices about benefits, provider payment rates, and other program factors. During economic downturns, enrollment in Medicaid grows, increasing state Medicaid costs at the same time that state tax revenues are declining. States under recessionary pressures have frequently sought to constrain Medicaid spending through actions such as cutting provider payment rates or reducing benefits.

Increasingly, states are undertaking more fundamental transformation of their Medicaid payment and delivery systems both to control costs and to improve care, particularly for high-cost populations. Over the period 2007-2013, average annual growth in total Medicaid spending for acute care was 7.4%, but on a per-enrollee basis, spending growth was 3.1% – on par with both growth in national health expenditures per capita and medical cost inflation, and less than growth in private health insurance premiums per enrollee (Figure 10).32 

Figure 10: Growth in Per-Enrollee Medicaid Spending vs. Other Health Spending Benchmarks, 2007-2013

States and the federal government share the cost of Medicaid. The federal government matches state Medicaid spending at least dollar for dollar for beneficiaries eligible for Medicaid under pre-ACA law. The federal match rate, known as the Federal Medical Assistance Percentage, or FMAP, varies based on relative state per capita income according to a formula specified in federal statute. The FMAP for FY 2015, which began October 1, 2014, ranges from the federal minimum of 50%, to 73.6% in Mississippi, the poorest state today.33  In 2012, the most recent year for which data are available, the federal share of total national Medicaid spending was about 57%.34 

Key ACA reforms. The expansion of Medicaid in the states that have implemented it, and greater participation in Medicaid nationwide due to increased outreach and simplified eligibility and enrollment processes, is leading, as intended, to growing enrollment in Medicaid and, in turn, to higher total Medicaid spending. The federal government finances the vast majority of the new costs associated with the Medicaid expansion to adults – the federal match for newly eligible adults is 100% through 2016, and phases down gradually to 90%. In addition, the ACA provides enhanced federal financing for investments that all states can make, including, for example, the establishment of health home programs for Medicaid beneficiaries with chronic conditions, options to expand HCBS, and improvements in Medicaid data systems.

All states, including those not expanding Medicaid, are seeing increased Medicaid costs because of increased participation in Medicaid among people who are eligible under pre-ACA rules. States receive their regular federal match for these beneficiaries. As would be expected, total Medicaid spending growth in FY 2014 and FY 2015 was much higher in the Medicaid expansion states than the non-expansion states, but state Medicaid spending grew more slowly in the expansion states, reflecting these states’ access to the enhanced federal matching funds.35  States expanding Medicaid will pay a small share of the cost for the expansion adults beginning in 2017, reaching a maximum of 10% in 2020. However, many of these states expect offsets or net savings due to reduced state spending for uncompensated care and for state-funded mental health and other programs; broader economic effects of the Medicaid expansion, such as job growth and increased income and state tax revenues; and other impacts. States that are not expanding Medicaid are forgoing substantial federal funding for expanded coverage of their low-income residents.

Looking Ahead

Already an integral source of coverage and access for low-income Americans, including many individuals with complex health and long-term care needs, Medicaid’s role is growing further as the expansion to low-income adults and other key Medicaid reforms take hold. It will be important to track and assess how the program evolves under the ACA, and as Medicaid innovation at the state, health plan, and provider level advances and spreads. The unprecedented transformation and experimentation now underway in Medicaid provide an opportunity to identify successful enrollment and renewal practices, strategies to ensure access to care, effective models of person-centered and coordinated care, and payment systems that align financial incentives with goals for quality and cost. Progress in all these areas can further strengthen the Medicaid program and benefit the millions of people it serves.

Tables

Table 1: Medicaid Enrollment by Group, FY 2011
StateTotalAgedDisabledAdultChildren
NumberNumber%Number%Number%Number%
United States68,039,6006,411,4009%10,055,80015%18,639,20027%32,931,90048%
Alabama1,062,400118,00011%221,60021%182,20017%540,60051%
Alaska138,6009,5007%18,00013%31,40023%79,80058%
Arizona1,264,40090,0007%144,50011%461,70037%568,20045%
Arkansas717,80070,60010%151,40021%114,10016%381,80053%
California11,666,7001,038,3009%1,063,6009%4,905,80042%4,659,10040%
Colorado745,10051,5007%94,90013%161,10022%437,60059%
Connecticut786,100108,30014%82,00010%277,40035%318,30040%
Delaware242,60015,1006%26,80011%103,80043%96,80040%
DC233,60018,8008%38,40016%92,40040%84,00036%
Florida3,703,400470,20013%573,70015%762,00021%1,897,50051%
Georgia1,929,800182,0009%315,60016%300,50016%1,131,70059%
Hawaii284,10025,8009%28,50010%109,80039%120,00042%
Idaho271,90019,2007%43,70016%39,10014%169,60062%
Illinois2,927,600225,2008%333,00011%797,20027%1,572,10054%
Indiana1,231,70093,0008%188,50015%252,20020%698,10057%
Iowa598,40044,3007%85,00014%183,70031%285,40048%
Kansas394,40037,70010%77,40020%54,90014%224,30057%
Kentucky947,10098,30010%242,40026%144,60015%461,80049%
Louisiana1,285,400117,1009%237,30018%252,20020%678,80053%
Maine375,90067,30018%75,80020%106,80028%126,00034%
Maryland975,40077,0008%148,80015%271,40028%478,20049%
Massachusetts1,508,900154,90010%345,20023%618,60041%389,40026%
Michigan2,347,500147,8006%380,00016%629,70027%1,189,90051%
Minnesota1,104,10099,3009%140,00013%400,80036%464,00042%
Mississippi781,70090,00012%170,80022%113,70015%407,20052%
Missouri1,148,80096,3008%215,80019%234,70020%602,00052%
Montana128,80011,0009%21,60017%20,50016%75,70059%
Nebraska276,30024,7009%40,40015%47,50017%163,80059%
Nevada388,20030,8008%49,70013%75,90020%231,80060%
New Hampshire171,50016,30010%31,90019%22,70013%100,60059%
New Jersey1,055,900151,40014%176,30017%141,70013%586,50056%
New Mexico576,10042,8007%67,90012%115,80020%349,60061%
New York5,818,300644,40011%713,60012%2,309,90040%2,150,40037%
North Carolina1,953,800187,30010%334,20017%403,20021%1,029,20053%
North Dakota85,6009,50011%12,20014%18,10021%45,90054%
Ohio2,247,300179,7008%383,00017%554,50025%1,130,00050%
Oklahoma856,80066,3008%122,50014%178,50021%489,50057%
Oregon729,50062,9009%103,70014%210,20029%352,70048%
Pennsylvania2,531,200251,80010%640,80025%528,70021%1,109,90044%
Rhode Island212,10026,60013%43,00020%47,10022%95,40045%
South Carolina964,80085,6009%163,10017%218,40023%497,70052%
South Dakota137,00013,0009%19,60014%23,00017%81,40059%
Tennessee1,543,600146,2009%275,20018%317,20021%805,00052%
Texas4,844,300447,3009%636,00013%636,30013%3,124,70065%
Utah349,60015,2004%41,60012%88,00025%204,80059%
Vermont200,00022,30011%25,70013%83,20042%68,80034%
Virginia1,072,100112,90011%186,40017%178,50017%594,40055%
Washington1,397,000100,3007%213,60015%289,70021%793,40057%
West Virginia438,50043,40010%123,40028%63,90015%207,90047%
Wisconsin1,298,700148,20011%175,90014%451,80035%522,60040%
Wyoming89,1006,0007%11,70013%13,30015%58,10065%
SOURCE: Kaiser Commission on Medicaid and the Uninsured and Urban Institute estimates based on data from FY 2011 MSIS. Because 2011 data were unavailable, 2010 MSIS data were used for Florida, Kansas, Maine, Maryland, Montana, New Mexico, New Jersey, Oklahoma, Texas, and Utah. For more detailed data notes, see: https://www.kff.org/medicaid/state-indicator/distribution-of-medicaid-enrollees-by-enrollment-group/
Table 2: Medicaid and CHIP Income Eligibility Limits for Children as a Percent of Federal Poverty Level (FPL),  January 2015
StateUpper Income Eligibility LimitMedicaid Ages 0-1Medicaid Ages 1-5Medicaid Ages 6-18Separate CHIPAges 0-18
Medicaid FundingCHIP FundingMedicaid FundingCHIP FundingMedicaid FundingCHIPFunding
Alabama317%146%146%105%146%317%
Alaska208%182%208%182%208%182%208%
Arizona200% (closed)152%146%109%138%200% (closed)
Arkansas216%147%216%147%216%112%216%
California266%213%266%147%266%138%266%
Colorado265%147%147%113%147%265%
Connecticut323%201%201%201%323%
Delaware217%199%217%147%105%138%217%
DC324%211%324%151%324%117%324%
Florida215%197%211%145%117%138%215%
Georgia252%210%154%118%138%252%
Hawaii313%196%313%144%313%138%313%
Idaho190%147%147%138%155%190%
Illinois318%147%113%147%113%147%318%
Indiana255%213%146%163%111%163%255%
Iowa380%245%380%172%127%172%307%
Kansas247%171% 154% 118%138%247%
Kentucky218%200%147%164%147%164%218%
Louisiana255%147%217%147%217%147%217%255%
Maine213%196%162%162%213%
Maryland322%199%322%138%322%138%322%
Massachusetts305%190%205%138%155%119%155%305%
Michigan217%200%148%165%115%165%217%
Minnesota288%280%288%280%280%
Mississippi214%199%148%112%138%214%
Missouri305%201%153%153%155%305%
Montana266%148%148%148%266%
Nebraska218%167%218%150%218%138%218%
Nevada205%165%165%127%138%205%
New Hampshire323%201%323%201%323%201%323%
New Jersey355%199%147%112%147%355%
New Mexico305%245%305%245%305%195%245%
New York405%223%154%115%154%405%
North Carolina216%199%215%146%215%112%138%216%
North Dakota175%152%152%116%138%175%
Ohio211%161%211%161%211%161%211%
Oklahoma210%174%210%156%210%120%210%
Oregon305%190%138%105%138%305%
Pennsylvania319%220%162%124%138%319%
Rhode Island266%195%266%147%266%114%266%
South Carolina213%199%213%148%213%138%213%
South Dakota209%152%187%145%187%116%187%209%
Tennessee255%200%147%138%255%
Texas206%203%149%114%138%206%
Utah205%144%144%110%138%205%
Vermont317%242%317%242%317%242%317%
Virginia205%148% 148%114%148%205%
Washington317%215%215%215%317%
West Virginia305%163%146%113%138%305%
Wisconsin306%306%191%138%156%306%
Wyoming205%159%159%124%138%205%
NOTES: Eligibility levels are based on the 2014 federal poverty level (FPL) for a family of three, and reflect MAGI-converted income standards and an income disregard equal to five percentage points of the FPL.SOURCE: Based on a national survey conducted by the Kaiser Commission on Medicaid and the Uninsured with the Georgetown University Center for Children and Families, 2015, available at https://www.kff.org/medicaid/report/modern-era-medicaid-findings-from-a-50-state-survey-of-eligibility-enrollment-renewal-and-cost-sharing-policies-in-medicaid-and-chip-as-of-january-2015/
Table 3: Medicaid Income Eligibility Limits for Pregnant Women and Other Adults as a Percent of Federal Poverty Level (FPL), January 2015
StatePregnant WomenParents with Dependent ChildrenChildless Adults
Alabama146%18%0%
Alaska205%146%0%
Arizona161%138%138%
Arkansas214%138%138%
California213%138%138%
Colorado200%138%138%
Connecticut263%201%138%
Delaware217%138%138%
DC211%221%215%
Florida196%34%0%
Georgia225%38%0%
Hawaii196%138%138%
Idaho138%27%0%
Illinois213%138%138%
Indiana213%24%0%
Iowa380%138%138%
Kansas171%38%0%
Kentucky200%138%138%
Louisiana138%24%0%
Maine214%105%0%
Maryland264%138%138%
Massachusetts205%138%138%
Michigan200%138%138%
Minnesota283%138%138%
Mississippi199%28%0%
Missouri201%23%0%
Montana162%51%0%
Nebraska199%55%0%
Nevada165%138%138%
New Hampshire201%138%138%
New Jersey199%138%138%
New Mexico255%138%138%
New York223%138%138%
North Carolina201%45%0%
North Dakota152%138%138%
Ohio205%138%138%
Oklahoma138%46%0%
Oregon190%138%138%
Pennsylvania220%138%138%
Rhode Island195%138%138%
South Carolina199%67%0%
South Dakota138%53%0%
Tennessee200%103%0%
Texas203%19%0%
Utah144%46%0%
Vermont213%138%138%
Virginia148%45%0%
Washington198%138%138%
West Virginia163%138%138%
Wisconsin306%100%100%
Wyoming159%58%0%
NOTES: Eligibility levels are based on the 2014 federal poverty level (FPL) for a family of three for parents of dependent children, and for an individual for childless adults. Income eligibility limits reflect MAGI-converted income standards and an income disregard equal to five percentage points of the FPL.SOURCE: Based on a national survey conducted by the Kaiser Commission on Medicaid and the Uninsured with the Georgetown University Center for Children and Families, 2015, available at https://www.kff.org/medicaid/report/modern-era-medicaid-findings-from-a-50-state-survey-of-eligibility-enrollment-renewal-and-cost-sharing-policies-in-medicaid-and-chip-as-of-january-2015/. Data updated to reflect state Medicaid expansion decisions as of February, 2015.
Table 4: Medicaid Spending by Group (in $ millions), FY 2011
StateTotalAgedDisabledAdultChildren
$$%$%$%$%
United States$397,635$85,35521%$168,81742%$61,05915%$82,40121%
Alabama$4,367$98723%$1,77041%$44110%$1,17027%
Alaska$1,313$22017%$51339%$20315%$37729%
Arizona$8,878$1,13613%$3,17036%$2,83032%$1,74120%
Arkansas$3,779$91824%$1,75046%$1875%$92424%
California$52,129$12,19923%$21,38541%$7,77015%$10,77521%
Colorado$4,231$87321%$1,80343%$57013%$98423%
Connecticut$5,868$1,58727%$2,01534%$1,26021%$1,00617%
Delaware$1,443$20414%$45532%$50335%$28220%
DC$2,073$38318%$1,03550%$41720%$23811%
Florida$17,257$4,13624%$7,31642%$2,33814%$3,46720%
Georgia$7,703$1,38418%$2,76936%$1,25416%$2,29630%
Hawaii$1,545$42527%$45930%$41327%$24716%
Idaho$1,550$19813%$80852%$20013%$34322%
Illinois$13,108$2,23617%$5,22740%$2,30818%$3,33825%
Indiana$6,473$1,39422%$2,87644%$90414%$1,30020%
Iowa$3,286$70221%$1,60649%$37611%$60118%
Kansas$2,621$57322%$1,27148%$2289%$54921%
Kentucky$5,623$94417%$2,61146%$72313%$1,34524%
Louisiana$6,259$1,00916%$3,09649%$73312%$1,42023%
Maine$2,234$58226%$1,08549%$24311%$32515%
Maryland$7,400$1,33118%$3,35945%$1,25817%$1,45220%
Massachusetts$13,153$3,27425%$5,79844%$2,53819%$1,54012%
Michigan$11,895$2,27719%$5,40945%$1,93516%$2,27419%
Minnesota$8,287$1,69420%$3,58143%$1,42617%$1,58619%
Mississippi$4,170$93122%$1,78543%$46411%$98924%
Missouri$7,454$1,41619%$3,54047%$7059%$1,79324%
Montana$949$25627%$36338%$10010%$23124%
Nebraska$1,592$36523%$70344%$19012%$33421%
Nevada$1,447$22115%$59641%$18112%$45031%
New Hampshire$1,244$29924%$53643%$837%$32626%
New Jersey$9,222$2,73030%$4,05744%$7388%$1,69818%
New Mexico$3,286N/AN/A$1,03531%$62919%$1,54947%
New York$51,788$13,93227%$21,56542%$10,61620%$5,67511%
North Carolina$10,211$1,71517%$4,61645%$1,44614%$2,43524%
North Dakota$714$22632%$30543%$669%$11616%
Ohio$15,406$3,56923%$7,11046%$2,34215%$2,38515%
Oklahoma$4,231$66116%$1,73641%$56313%$1,27130%
Oregon$4,310$98323%$1,54336%$1,06425%$72017%
Pennsylvania$19,773$4,39722%$9,95050%$1,88410%$3,54218%
Rhode Island$1,961$36819%$88645%$27014%$43722%
South Carolina$4,636$88519%$1,96842%$78317%$1,00022%
South Dakota$751$14219%$30941%$9713%$20427%
Tennessee$7,957$1,25716%$3,21440%$1,50119%$1,98625%
Texas$27,011$4,49217%$10,20438%$2,2228%$10,09337%
Utah$1,795$17810%$85147%$27215%$49327%
Vermont$1,258$14311%$38831%$37029%$35728%
Virginia$6,673$1,29219%$2,99045%$78712%$1,60424%
Washington$6,975$1,21717%$3,02243%$1,07115%$1,66524%
West Virginia$2,769$61422%$1,36149%$27410%$52119%
Wisconsin$7,031$2,20431%$2,76039%$1,23418%$83312%
Wyoming$544$12523%$25447%$519%$11321%
SOURCE: Kaiser Commission on Medicaid and the Uninsured and Urban Institute estimates based on data from FY 2011 MSIS and CMS-64 reports. For more detailed data notes, see: https://www.kff.org/medicaid/state-indicator/medicaid-spending-by-enrollment-group/
Table 5: Medicaid Spending Per Enrollee by Group, FY 2011
StateTotalAgedDisabledAdultChildren
United States$5,790$13,249$16,643$3,247$2,463
Alabama$4,111$8,358$7,989$2,420$2,163
Alaska$9,474$23,321$28,554$6,467$4,720
Arizona$7,022$12,628$21,940$6,131$3,064
Arkansas$5,264$12,994$11,564$1,638$2,420
California$4,468$11,749$20,106$1,584$2,313
Colorado$5,679$16,943$19,008$3,539$2,250
Connecticut$7,465$14,652$24,567$4,541$3,161
Delaware$5,949$13,439$16,968$4,843$2,909
DC$8,875$20,430$26,958$4,506$2,837
Florida$4,434$8,532$12,130$2,880$1,716
Georgia$3,992$7,604$8,775$4,174$2,028
Hawaii$5,438$16,432$16,128$3,765$2,062
Idaho$5,700$10,324$18,510$5,098$2,025
Illinois$4,477$9,926$15,696$2,895$2,123
Indiana$5,256$14,991$15,255$3,585$1,862
Iowa$5,491$15,865$18,893$2,048$2,106
Kansas$5,996$13,643$14,829$3,745$2,212
Kentucky$5,937$9,607$10,769$5,000$2,913
Louisiana$4,869$8,616$13,049$2,907$2,092
Maine$5,968$8,932$14,386$2,189$2,526
Maryland$7,046$16,591$20,962$4,231$2,778
Massachusetts$8,717$21,129$16,798$4,103$3,956
Michigan$5,067$15,403$14,234$3,073$1,911
Minnesota$7,506$17,053$25,573$3,557$3,419
Mississippi$5,335$10,347$10,450$4,084$2,430
Missouri$6,488$14,706$16,401$3,005$2,978
Montana$7,140$22,543$16,226$4,707$2,958
Nebraska$5,763$14,794$17,413$3,996$2,041
Nevada$3,728$7,169$11,991$2,379$1,942
New Hampshire$7,254$18,341$16,771$3,662$3,243
New Jersey$8,309$17,646$22,124$4,687$2,621
New Mexico$5,803N/A$15,234$5,565$4,551
New York$8,901$21,620$30,221$4,596$2,639
North Carolina$5,226$9,157$13,810$3,587$2,366
North Dakota$8,338$23,810$25,136$3,651$2,536
Ohio$6,855$19,858$18,565$4,223$2,110
Oklahoma$4,782$10,085$13,820$2,973$2,462
Oregon$5,908$15,626$14,878$5,064$2,041
Pennsylvania$7,811$17,462$15,526$3,564$3,191
Rhode Island$9,247$13,820$20,601$5,741$4,585
South Carolina$4,805$10,346$12,068$3,583$2,009
South Dakota$5,485$10,916$15,759$4,213$2,502
Tennessee$5,155$8,595$11,679$4,731$2,467
Texas$5,278$9,751$15,259$3,263$3,016
Utah$4,890$11,624$19,597$2,889$2,261
Vermont$6,291$6,405$15,081$4,449$5,193
Virginia$6,224$11,447$16,042$4,411$2,698
Washington$4,993$12,140$14,147$3,696$2,099
West Virginia$6,315$14,155$11,031$4,283$2,506
Wisconsin$5,414$14,866$15,693$2,731$1,594
Wyoming$6,110$20,726$21,700$3,877$1,954
SOURCE: Kaiser Commission on Medicaid and the Uninsured and Urban Institute estimates based on data from FY 2011 MSIS and CMS-64 reports. For more detailed data notes, see: https://www.kff.org/medicaid/state-indicator/medicaid-spending-per-enrollee/
Table 6: Medicaid Spending by Type of Service (in $ millions), FY 2013
StateTotalAcute CareLong-Term CareDSH Payments
$$%$%$%
United States$438,233$298,84068%$123,01628%$16,3774%
Alabama$5,039$3,13562%$1,43228%$4719%
Alaska$1,356$81560%$52038%$222%
Arizona$8,438$8,21997%$451%$1732%
Arkansas$4,207$2,70364%$1,44334%$611%
California$61,904$45,01873%$14,76624%$2,1203%
Colorado$5,092$3,33265%$1,56631%$1944%
Connecticut$6,726$3,46952%$2,98344%$2734%
Delaware$1,563$1,41891%$1339%$111%
DC$2,288$1,44963%$78234%$562%
Florida$18,561$13,49973%$4,72725%$3352%
Georgia$8,960$6,20369%$2,32726%$4305%
Hawaii$1,630$1,48991%$1177%$252%
Idaho$1,672$1,09265%$55633%$241%
Illinois$15,658$10,64068%$4,57129%$4473%
Indiana$7,968$4,70359%$2,92737%$3384%
Iowa$3,709$1,98453%$1,67045%$551%
Kansas$2,578$1,86372%$63925%$773%
Kentucky$5,822$3,97068%$1,63628%$2164%
Louisiana$7,147$4,19959%$2,18131%$76711%
Maine$2,887$2,01370%$83729%$371%
Maryland$7,781$5,37369%$2,27429%$1342%
Massachusetts$13,166$9,34071%$3,82729%$00%
Michigan$12,386$9,23975%$2,76022%$3883%
Minnesota$8,919$5,68164%$3,19136%$461%
Mississippi$4,736$3,09965%$1,41930%$2185%
Missouri$8,951$5,96267%$2,28626%$7038%
Montana$1,007$61461%$37637%$182%
Nebraska$1,834$1,01555%$77342%$452%
Nevada$1,823$1,32573%$41723%$814%
New Hampshire$1,203$57648%$58549%$413%
New Jersey$10,606$5,64853%$3,65935%$1,29812%
New Mexico$3,295$2,91488%$35611%$251%
New York$54,420$32,35859%$18,64034%$3,4236%
North Carolina$11,915$8,99976%$2,29919%$6175%
North Dakota$784$29838%$48562%$10%
Ohio$16,803$10,05660%$6,09836%$6494%
Oklahoma$4,796$3,49773%$1,25726%$421%
Oregon$5,111$3,54169%$1,49329%$771%
Pennsylvania$21,092$12,48959%$7,75537%$8474%
Rhode Island$1,920$1,44375%$34818%$1307%
South Carolina$4,907$3,25866%$1,19124%$4579%
South Dakota$766$46561%$30039%$10%
Tennessee$8,716$7,65288%$98411%$801%
Texas$28,339$22,51879%$5,59420%$2271%
Utah$2,130$1,63177%$47022%$291%
Vermont$1,474$1,31289%$1248%$373%
Virginia$7,291$4,59263%$2,51334%$1863%
Washington$8,171$5,49767%$2,30828%$3674%
West Virginia$3,024$1,68056%$1,26942%$752%
Wisconsin$7,106$5,26474%$1,84126%$10%
Wyoming$554$28852%$26548%$00%
NOTES: Expenditures do not include administrative costs, accounting adjustments, or the U.S. Territories. Total Medicaid spending including these factors was $456.0 billion in FY 2013. “DSH” refers to disproportionate share hospital payments. For more detailed data notes, see https://www.kff.org/medicaid/state-indicator/distribution-of-medicaid-spending-by-service/SOURCE: Urban Institute estimates based on data from CMS-64 reports.
Table 7: Federal Medical Assistance Percentages (FMAP), FY 2011-2015
StateFY 2011FY 2012FY2013FY2014FY2015Federal Funds Sent to State per Dollar of State Medicaid Spending, FY 2015
Alabama68.50%68.60%68.50%68.12%68.99%$2.22
Alaska50.00%50.00%50.00%50.00%50.00%$1.00
Arizona65.90%67.30%65.70%67.23%68.46%$2.17
Arkansas71.40%70.70%70.20%70.10%70.88%$2.43
California50.00%50.00%50.00%50.00%50.00%$1.00
Colorado50.00%50.00%50.00%50.00%51.01%$1.04
Connecticut50.00%50.00%50.00%50.00%50.00%$1.00
Delaware53.20%54.20%55.70%55.31%53.63%$1.16
DC70.00%70.00%70.00%70.00%70.00%$2.33
Florida55.50%56.00%58.10%58.79%59.72%$1.48
Georgia65.30%66.20%65.60%65.93%66.94%$2.02
Hawaii51.80%50.50%51.90%51.85%52.23%$1.09
Idaho68.90%70.20%71.00%71.64%71.75%$2.54
Illinois50.20%50.00%50.00%50.00%50.76%$1.03
Indiana66.50%67.00%67.20%66.92%66.52%$1.99
Iowa62.60%60.70%59.60%57.93%55.54%$1.25
Kansas59.10%56.90%56.50%56.91%56.63%$1.31
Kentucky71.50%71.20%70.60%69.83%69.94%$2.33
Louisiana63.60%61.10%61.20%60.98%62.05%$1.64
Maine63.80%63.30%62.60%61.55%61.88%$1.62
Maryland50.00%50.00%50.00%50.00%50.00%$1.00
Massachusetts50.00%50.00%50.00%50.00%50.00%$1.00
Michigan65.80%66.10%66.40%66.32%65.54%$1.90
Minnesota50.00%50.00%50.00%50.00%50.00%$1.00
Mississippi74.70%74.20%73.40%73.05%73.58%$2.79
Missouri63.30%63.50%61.40%62.03%63.45%$1.74
Montana66.80%66.10%66.00%66.33%65.90%$1.93
Nebraska58.40%56.60%55.80%54.74%53.27%$1.14
Nevada51.60%56.20%59.70%63.10%64.36%$1.81
New Hampshire50.00%50.00%50.00%50.00%50.00%$1.00
New Jersey50.00%50.00%50.00%50.00%50.00%$1.00
New Mexico69.80%69.40%69.10%69.20%69.65%$2.29
New York50.00%50.00%50.00%50.00%50.00%$1.00
North Carolina64.70%65.30%65.50%65.78%65.88%$1.93
North Dakota60.40%55.40%52.30%50.00%50.00%$1.00
Ohio63.70%64.20%63.60%63.02%62.64%$1.68
Oklahoma64.90%63.90%64.00%64.02%62.30%$1.65
Oregon62.90%62.90%62.40%63.14%64.06%$1.78
Pennsylvania55.60%55.10%54.30%53.52%51.82%$1.08
Rhode Island53.00%52.10%51.30%50.11%50.00%$1.00
South Carolina70.00%70.20%70.40%70.57%70.64%$2.41
South Dakota61.30%59.10%56.20%53.54%51.64%$1.07
Tennessee65.90%66.40%66.10%65.29%64.99%$1.86
Texas60.60%58.20%59.30%58.69%58.05%$1.38
Utah71.10%71.00%69.60%70.34%70.56%$2.40
Vermont58.70%57.60%56.00%55.11%54.01%$1.17
Virginia50.00%50.00%50.00%50.00%50.00%$1.00
Washington50.00%50.00%50.00%50.00%50.03%$1.00
West Virginia73.20%72.60%72.00%71.09%71.35%$2.49
Wisconsin60.20%60.50%59.70%59.06%58.27%$1.40
Wyoming50.00%50.00%50.00%50.00%50.00%$1.00
NOTES: FMAPs displayed here apply to spending associated with beneficiaries who qualify for Medicaid under pre-ACA eligibility criteria. The FMAP for spending associated with newly eligible adults is 100% through FY 2016, declining gradually to 90% by 2020. For more detailed data notes, see: https://www.kff.org/medicaid/state-indicator/federal-matching-rate-and-multiplier/SOURCE: Kaiser Commission on Medicaid and the Uninsured calculations based on FY 2011‐2015 FMAPs published in the Federal Register as follows: FY 2011 FMAP – Vol. 76, No. 107, pp. 32204‐32207; FY 2012 FMAP – Vol. 75, No. 217, pp. 69082‐69084; FY 2013 FMAP – Vol. 76, No. 230, pp. 74061‐74063; FY 2014 FMAP – Vol. 77, No. 23, pp 71420-71423; FY 2015 FMAP – Vol. 79, No. 13, pp.3385-3388.
Table 8: Selected Measures of Health Need among Adults
StateUninsured Adults<100% FPL1% Adults with% of PopulationLiving in Primary CareHPSAs5
Number%Disabilities2Diabetes3Poor Mental Health4
United States25,694,90037%10.1%6.2%33.7%19.2%
Alabama415,30047%14.9%11.1%34.8%37.0%
Alaska39,800N/A10.4%6.3%32.7%17.5%
Arizona733,90043%9.8%8.1%35.2%42.2%
Arkansas275,60042%15.3%9.2%35.9%12.3%
California3,221,30037%7.8%8.9%36.8%16.1%
Colorado322,40036%8.4%6.0%35.3%17.7%
Connecticut239,00028%8.2%6.4%34.9%11.0%
Delaware64,70013%10.4%7.7%32.9%22.6%
DC81,60013%9.7%8.0%37.3%38.7%
Florida1,690,80046%9.9%8.7%34.2%24.1%
Georgia848,60045%10.5%9.8%31.6%20.8%
Hawaii93,90020%8.2%7.8%27.5%3.5%
Idaho123,40038%11.0%7.7%36.7%29.9%
Illinois985,80034%8.5%8.2%38.5%27.0%
Indiana431,80028%10.8%9.1%36.2%25.8%
Iowa189,40037%9.6%6.9%29.6%21.4%
Kansas196,90035%10.8%8.0%30.0%23.3%
Kentucky480,70039%15.3%10.1%37.0%18.6%
Louisiana455,50036%13.5%10.3%34.7%43.3%
Maine94,70021%13.6%7.4%34.2%6.6%
Maryland331,30027%8.2%8.9%33.0%17.9%
Massachusetts494,900N/A8.9%7.2%35.8%7.3%
Michigan886,90033%11.6%9.2%35.9%17.3%
Minnesota400,40023%8.2%6.2%30.1%7.3%
Mississippi376,80033%15.3%11.3%32.7%57.7%
Missouri482,80040%12.6%8.0%32.3%27.5%
Montana82,100N/A10.3%6.2%32.1%26.0%
Nebraska107,80036%8.2%7.1%30.4%1.6%
Nevada269,50059%10.3%8.1%33.4%18.7%
New Hampshire67,70037%9.6%7.0%32.9%3.7%
New Jersey542,00035%7.7%8.3%31.3%0.3%
New Mexico248,00041%13.1%8.1%33.0%42.3%
New York1,654,30022%8.4%8.4%35.1%17.2%
North Carolina957,60052%11.3%9.3%30.4%12.7%
North Dakota40,500N/A8.3%6.9%31.1%26.5%
Ohio975,20032%11.9%9.4%32.2%10.2%
Oklahoma314,90034%13.6%10.1%34.3%25.5%
Oregon370,80031%11.7%7.2%40.2%23.5%
Pennsylvania914,10031%11%8.7%35.5%5.0%
Rhode Island76,30022%10.4%6.8%35.3%14.4%
South Carolina431,50044%12.1%9.9%33.9%27.3%
South Dakota45,200N/A10.0%6.4%26.8%21.9%
Tennessee659,70034%13.4%10.2%28.5%18.0%
Texas2,273,10056%10.0%9.8%28.2%19.4%
Utah121,500N/A8.5%7.1%38.5%19.0%
Vermont31,800N/A11.0%5.8%34.8%0.0%
Virginia482,20041%8.4%8.1%30.1%14.6%
Washington493,00038%10.1%7.4%37.3%19.0%
West Virginia195,60030%16.8%10.7%32.0%17.0%
Wisconsin341,80031%9.2%7.1%35.7%14.4%
Wyoming40,60037%9.8%6.6%30.7%25.6%
SOURCES: 1-Kaiser Family Foundation estimates based on the Census Bureau’s March 2014 Current Population Survey (CPS: Annual Social and Economic Supplements). 2-Erickson, W., Lee, C., & von Schrader, S. (2014). 2012 Disability Status Report: United States. Ithaca, NY: Cornell University Employment and Disability Institute(EDI). 3-Centers for Disease Control and Prevention: National Diabetes Surveillance System. Available online at: http://www.cdc.gov/diabetes/data/. 4-Kaiser Family Foundation analysis of Behavioral Risk Factor Surveillance System Survey Data (BRFSS), 2014. 5- KCMU calculations based on HRSA Primary Care Health Professional Shortage Area statistics for 2014 and Urban Institute tabulations of 2012 and 2013 ASEC Supplement to the CPS.

Endnotes

  1. FY 2011 Distribution of Medicaid Enrollees by Enrollment Group, FY 2011, https://modern.kff.org/medicaid/state-indicator/distribution-of-medicaid-enrollees-by-enrollment-group/, Kaiser Family Foundation. ↩︎
  2. The health reform law also provided for new health insurance Marketplaces and premium subsidies for individuals with income between 100% and 400% FPL. ↩︎
  3. Medicaid and CHIP: December 2014 Monthly Applications, Eligibility Determinations and Enrollment Report, CMS, February 23, 2015, http://www.medicaid.gov/medicaid-chip-program-information/program-information/downloads/december-2014-enrollment-report.pdf ↩︎
  4. Getting into Gear for 2014: Findings From a 50-State Survey of Eligibility, Enrollment, Renewal and Cost-Sharing Policies in Medicaid and CHIP, 2012-2013 (Kaiser Family Foundation, January 2013), https://modern.kff.org/medicaid/report/getting-into-gear-for-2014-findings-from-a-50-state-survey-of-eligibility-enrollment-renewal-and-cost-sharing-policies-in-medicaid-and-chip-2012-2013/ ↩︎
  5. States that elect the “209(b)” option are permitted to use financial eligibility standards that are more restrictive than federal SSI rules. However, these states must allow SSI beneficiaries to establish Medicaid eligibility through a “spend-down” by deducting their out-of-pocket medical expenses from their income. See https://modern.kff.org/health-reform/issue-brief/the-affordable-care-acts-impact-on-medicaid-eligibility-enrollment-and-benefits-for-people-with-disabilities/ for a more detailed discussion. ↩︎
  6. March 2014 Report to the Congress on Medicaid and CHIP (Medicaid and CHIP Payment and Access Commission (MACPAC), March 2014). See Table 11. ↩︎
  7. CMS op.cit. ↩︎
  8. Wisconsin provides full Medicaid coverage to adults without dependent children up to 100% FPL although it has not adopted the Medicaid expansion at this time. ↩︎
  9. https://modern.kff.org/health-reform/state-indicator/number-of-poor-uninsured-nonelderly-adults-in-the-aca-coverage-gap/ See also Rachel Garfield et al., The Coverage Gap: Uninsured Poor Adults in States that Do Not Expand Medicaid – An Update (Kaiser Family Foundation, November 2014), https://modern.kff.org/health-reform/issue-brief/the-coverage-gap-uninsured-poor-adults-in-states-that-do-not-expand-medicaid-an-update/ ↩︎
  10. Robin Rudowitz, Samantha Artiga, and Rachel Arguello, Children’s Health Coverage: Medicaid, CHIP and the ACA (Kaiser Family Foundation, March 2014), https://modern.kff.org/health-reform/issue-brief/childrens-health-coverage-medicaid-chip-and-the-aca/ ↩︎
  11. Medicaid: A Primer (Kaiser Family Foundation, March 2013), https://modern.kff.org/medicaid/issue-brief/medicaid-a-primer/ ↩︎
  12. Medicaid Home and Community-Based Services Programs: 2010 Data Update (Kaiser Family Foundation, March 2014), https://modern.kff.org/medicaid/report/medicaid-home-and-community-based-service-programs/ ↩︎
  13. KCMU estimates based on 2012 CMS National Health Expenditure Accounts data, available at: http://www.cms.gov/Research-Statistics-Data-and-Systems/Statistics-Trends-and-Reports/NationalHealthExpendData/NationalHealthAccountsHistorical.html ↩︎
  14. MaryBeth Musumeci, Julia Paradise, Erica Reaves, and Henry Claypool, Benefits and Cost-Sharing for Working People with Disabilities in Medicaid and the Marketplace (Kaiser Family Foundation, October 2014), https://modern.kff.org/report-section/benefits-and-cost-sharing-for-working-people-with-disabilities-in-medicaid-and-the-marketplace-key-themes-8644/ ↩︎
  15. Federal Register, Volume 78, Number 135, July 15, 2013, http://www.gpo.gov/fdsys/pkg/FR-2013-07-15/html/2013-16271.htm ↩︎
  16. KCMU and Urban Institute analysis of Centers for Medicare & Medicaid Services (CMS)-64 data. ↩︎
  17. Molly O’Malley Watts, MaryBeth Musumeci, and Erica Reaves, How is the Affordable Care Act Leading to Changes in Medicaid Long-Term Services and Supports (LTSS) Today? State Adoption of Six LTSS Options (Kaiser Family Foundation, April 2013), https://modern.kff.org/medicaid/issue-brief/how-is-the-affordable-care-act-leading-to-changes-in-medicaid-long-term-services-and-supports-ltss-today-state-adoption-of-six-ltss-options/ ↩︎
  18. Genevieve Kenney and Christine Coyer, National Findings on Access to Health Care and Service Use for Children Enrolled in Medicaid, MACPAC Contractor Report No. 1, March 2012. ↩︎
  19. Sharon Long, Karen Stockley, Elaine Grimm, and Christine Coyer, National Findings on Access to Health Care and Service Use for Non-elderly Adults Enrolled in Medicaid, MACPAC Contractor Report No. 2, June 2012, http://www.urban.org/publications/1001623.html ↩︎
  20. Teresa Coughlin, Sharon Long, Lisa Clemans-Cope, and Dean Resnick, What Difference Does Medicaid Make? (Kaiser Family Foundation, May 2013), https://modern.kff.org/medicaid/issue-brief/what-difference-does-medicaid-make-assessing-cost-effectiveness-access-and-financial-protection-under-medicaid-for-low-income-adults/ ↩︎
  21. Coughlin et al., Kenney and Coyer, and Long et al. op. cit. ↩︎
  22. Genevieve Kenney, Brendan Saloner, Nathaniel Anderson, Daniel Polsky, and Karin Rhodes, Access to Care for Low-Income Medicaid and Privately Insured Adults in 2012 in the National Health Interview Survey: A Context for Findings from a New Audit Study, Urban Institute, April 2014, http://www.urban.org/publications/413089.html ↩︎
  23. Sandra Decker, “Two-Thirds of Primary Care Physicians Accepted New Medicaid Patients In 2011–12: A Baseline to Measure Future Acceptance Rates,” Health Affairs 32(7), July 2013, http://content.healthaffairs.org/content/32/7/1183.abstract; Andrew Bindman, Andrew Chu, and Kevin Grumbach. Physician Participation in Medi-Cal, 2008, California Healthcare Foundation, July 2010, http://www.chcf.org/~/media/MEDIA%20LIBRARY%20Files/PDF/P/PDF%20PhysicianParticipationMediCal2008.pdf; Peter Cunningham and Jessica May, Medicaid Patients Increasingly Concentrated Among Physicians, Tracking Report No. 16, August 2006, http://www.hschange.com/CONTENT/866/ ↩︎
  24. Stephen Zuckerman, Aimee Williams, and Karen Stockley, “Trends In Medicaid Physician Fees, 2003–2008,” Health Affairs 28(3), May/June 2009, http://content.healthaffairs.org/content/28/3/w510.full#ref-26 ↩︎
  25. Report to Congress on the Nation’s Substance Abuse and Mental Health Workforce Issue, Substance Abuse and Mental Health Services Administration, U.S. Department of Health and Human Services, January 24, 2013, http://store.samhsa.gov/shin/content/PEP13-RTC-BHWORK/PEP13-RTC-BHWORK.pdf ↩︎
  26. Medicaid Benefits: Dental Services (Kaiser Family Foundation), https://modern.kff.org/medicaid/state-indicator/dental-services/ ↩︎
  27. Medicaid: States Made Multiple Program Changes, and Beneficiaries Generally Reported Access Comparable to Private Insurance, General Accountability Office, November 2012, http://www.gao.gov/products/GAO-13-55 ↩︎
  28. Karin Rhodes, Genevieve Kenney, Ari Friedman, Brendan Saloner, Charlotte Lawson, David Chearo, Douglas Wissoker, and Daniel Polsky,“Primary Care Access for New Patients on the Eve of Health Reform,” JAMA Internal Medicine, June 2014, https://archinte.jamanetwork.com/article.aspx?articleid=1857092; Joanna Bisgaier and Karin Rhodes, “Auditing Access to Specialty Care for Children with Public Insurance,” New England Journal of Medicine, June 16, 2011, http://www.nejm.org/doi/full/10.1056/NEJMsa1013285 ↩︎
  29. State Standards for Access to Care in Medicaid Managed Care, Office of Inspector General, U.S. Department of Health and Human Services, September 2014, http://oig.hhs.gov/oei/reports/oei-02-11-00320.pdf; Access to Care: Provider Availability in Medicaid Managed Care, Office of Inspector General, U.S. Department of Health and Human Services, December 2014, http://oig.hhs.gov/oei/reports/oei-02-13-00670.pdf ↩︎
  30. Daniel Polsky, Michael Richards, Simon Basseyn, Douglas Wissoker, Genevieve Kenney, Stephen Zuckerman, and Karin Rhodes, “Appointment Availability after Increases in Medicaid Payments for Primary Care,” New England Journal of Medicine, February 5, 2015, http://www.nejm.org/doi/full/10.1056/NEJMsa1413299 ↩︎
  31. Vernon Smith, Kathleen Gifford, Eileen Ellis, Robin Rudowitz and Laura Snyder, Medicaid in an Era of Health & Delivery System Reform: Results from a 50-State Medicaid Budget Survey for State Fiscal Years 2014 and 2015 (Kaiser Family Foundation, October 2014), https://modern.kff.org/medicaid/report/medicaid-in-an-era-of-health-delivery-system-reform-results-from-a-50-state-medicaid-budget-survey-for-state-fiscal-years-2014-and-2015/ ↩︎
  32. Rachel Garfield and Katherine Young, Enrollment-Driven Expenditure Growth: Medicaid Spending During the Economic Downturn, FY 2007-2011 (Kaiser Family Foundation, April 2013), https://modern.kff.org/medicaid/report/enrollment-driven-expenditure-growth-medicaid-spending-during/ ↩︎
  33. Federal Medical Assistance Percentage (FMAP) for Medicaid and Multiplier, https://modern.kff.org/medicaid/state-indicator/federal-matching-rate-and-multiplier/ (FY 2015). ↩︎
  34. Federal and State Share of Medicaid Spending, https://modern.kff.org/medicaid/state-indicator/federalstate-share-of-spending/ ↩︎
  35. Robin Rudowitz, Laura Snyder, Vernon Smith, Kathleen Gifford, and Eileen Ellis, Implementing the ACA: Medicaid Spending & Enrollment Growth for FY 2014 and FY 2015 (Kaiser Family Foundation, October 2014), https://modern.kff.org/medicaid/issue-brief/implementing-the-aca-medicaid-spending-enrollment-growth-for-fy-2014-and-fy-2015/   ↩︎
News Release

The Diseases We Spend Our Health Dollars On

Published: Mar 3, 2015

In his latest column for The Wall Street Journal’s Think Tank, Drew Altman explains how a recent Bureau of Economic Analysis report makes the nation’s health care spending more tangible by breaking it down by disease.

All previous columns by Drew Altman are available online.

The Coverage Provisions in the Affordable Care Act: An Update

Published: Mar 2, 2015

Introduction

The enactment of the Affordable Care Act (ACA) on March 23, 2010 ushered in sweeping changes to the U.S. health care system. While the law touched almost every aspect of our health care system, from how coverage is obtained to how the health care services are provided, the parts of the law that have garnered the most attention, and generated the most controversy, are those relating to the availability and affordability of health insurance coverage. The coverage provisions in the law were aimed at improving access to insurance, especially for those with pre-existing medical conditions, enhancing the quality of coverage by imposing minimum benefit standards, and increasing the affordability of coverage through expanded public programs and new subsidies for private coverage. This brief examines these coverage provisions, providing an update on how they have been implemented and assessing their impact. It also discusses key issues looking ahead.

Framework of the ACA

Like previous attempts at health care reform, the ACA was structured to address the gaps and limitations of our public-private health insurance system. It builds on employer-based coverage, restructures the individual insurance market, and broadens access to and affordability of coverage by expanding Medicaid for the low-income population and extending tax subsidies for the purchase of private insurance to those with moderate incomes (Figure 1).

As enacted, the ACA created a framework for enhancing access to health coverage. It imposed new regulations on health plans in the individual and small group markets, including guarantee issue and rate restrictions, to ensure everyone could purchase coverage regardless of their health status. In addition, the law created state-based health insurance Marketplaces through which individuals would be able to purchase private insurance coverage with premium and cost-sharing assistance on a sliding scale for those individuals and families with income between 100% and 400% of the federal poverty level (FPL, $11,770-$47,080 for an individual in 2015). These Marketplaces were to be established by the states; however, the law provided for the federal government to establish a Marketplace in any state that chose not to run its own. For the low-income population, Medicaid coverage was extended to all adults with income at or below 138% FPL. The law also imposed new requirements on individuals to purchase insurance, with some exceptions, and large employers to offer insurance to their employees.

Figure 1: Key Coverage Elements in the ACA

The ACA relies heavily on states to implement the coverage provisions in the law. While some provisions went into effect without state action, many others were influenced by state decisions. For example, states were given responsibility for defining the set of benefits that would be offered by all plans in the individual and small group markets. They were permitted to impose tighter restrictions on insurance companies in some areas, such as premium rating. They were also provided the option of establishing a state-run Marketplace, and with the Supreme Court ruling in June 2012, states were given the choice whether or not to adopt the Medicaid expansion.  These decisions have had important implications not only on the cost of coverage available in the states, but also on the number of people who have newly gained coverage as a result of the ACA. Consequently, as it did prior to implementation of the ACA, health insurance coverage continues to look different across the states.

Issue Brief: Health Insurance Market Reforms

Consumer Protections

On September 23, 2010, a number of ACA provisions took effect, including the elimination of lifetime limits on coverage, restrictions on annual limits on coverage, prohibition on rescinding coverage except in cases of fraud, and the elimination of pre-existing condition exclusions for children. These early market reforms were intended to provide immediate relief to consumers, especially those with high health care needs, who faced limits on coverage or the potential loss of coverage. Other ACA provisions that took effect six months after enactment included protections allowing consumers the right to choose their own doctors, the right to appeal health plan decisions, and the right to access out-of-network emergency care.1 

All individual and group health plans must provide coverage to any applicant, regardless of health status, gender, or any other factors.2   Prior to the ACA, insurers in the individual market were allowed to deny people coverage based on their perceived health risk. As a result, those without access to employer-sponsored insurance who had acute or chronic health conditions, such as cancer or diabetes, were often unable to purchase coverage. Even women, especially those of childbearing age, could be denied coverage because of their expected higher use of health care services. The ACA required guaranteed issue and renewability of coverage and prohibited insurers from imposing pre-existing condition exclusions on coverage. These provisions went into effect on January 1, 2014. Prior to the implementation of the guaranteed issue requirement, the ACA created the temporary Pre-Existing Condition Insurance Plan for those who had been denied coverage and who had been uninsured for at least six months. While this program provide stopgap coverage for some, the coverage was unaffordable for many.

On January 1, 2014, new premium rating rules went into effect for plans in the individual and small group markets.3  These rules prohibit insurers from adjusting premiums based on a person’s health status. Insurers may only adjust premiums based on the following factors:

  • Individual versus family enrollment: insurers may vary rates based on the number of family members enrolled in the plan.
  • Geography: insurers may charge different rates in different areas across the state.
  • Age: insurers may charge older adults more than younger adults; however, the variation in premiums is limited to 3 to 1, meaning insurers can’t charge older adults more than three times what they charge younger adults.
  • Tobacco use: insurers may charge tobacco users up to 1.5 times what they charge those who do not use tobacco products.

To ease the transition to the new market reforms, the ACA exempted certain plans from some of the new health insurance requirements. These plans, referred to as grandfathered plans, are plans that were in place as of March 23, 2010 (the day the ACA was enacted) and have undergone minimal changes over time. To maintain grandfathered status, plans must not eliminate benefits to diagnose or treat a condition; increase cost sharing beyond certain specified limits; or reduce the employer share of the premium by more than five percentage points.4  Grandfathered plans are exempt from some of the new insurance market rules, including those relating to essential health benefits, the provision of preventive services with no cost-sharing, and review of premium increases of 10% or more.5  They must, however, extend coverage to dependents up to age 26 and eliminate lifetime and annual limits on coverage. In addition, grandfathered group plans can no longer impose pre-existing condition exclusions on children or adults.  According the Kaiser/HRET 2014 Employer Health Benefits Survey, 26% of covered workers were enrolled in grandfathered plans in 2014, down from 36% in 2013.6 

All group and individual health plans must provide a uniform summary of benefits and coverage (SBC) to applicants and enrollees. The ACA requires insurers and health plans to provide consumers with standardized and easy-to-read information about the plan using a common form that is intended to make it easier for consumers to compare plans. The SBC must describe the main features of the plan, including covered benefits along with any limitations or exclusions, cost sharing requirements, and whether it meets minimum essential coverage and value standards. The SBC must also include examples of how the policy or plan would cover care for certain health conditions or scenarios, showing hypothetical costs for consumers and how much the plan would pay. Currently, the form shows coverage examples for a normal delivery and managing type 2 diabetes. Finally, the SBC includes uniform definitions of common insurance-related terms. A recently released proposed rule would make some changes to the SBC effective for plan years and open enrollment periods beginning after September 1, 2015.7 

Coverage of Preventive Services

Private health insurance plans generally must provide coverage for a range of preventive health services without requiring any patient cost-sharing (co-payments, deductibles, or co-insurance).  These rules apply to all private plans, including individual, small group, large group, and self-insured plans, though grandfathered plans are exempt from this requirement.8   The list of required preventive services may be divided into three broad categories:

  • Evidence-based services rated A or B by the U.S. Preventive Services Task Force (USPSTF).
  • Routine Immunizations recommended by the Advisory Committee on Immunization Practices, which include coverage for both adult and child immunizations such as influenza, meningitis, hepatitis A and B, human papillomavirus (HPV), measles, mumps, rubella, and varicella (chicken pox).
  • Preventive services for children and youth recommended by the Health Resources and Services Administration’s Bright Futures Project, including immunizations, behavioral and development assessments, and screening for autism, vision and hearing impairment, tuberculosis, and certain genetic diseases.

Private health insurance plans generally must provide coverage for an additional set of preventive health services for women without cost-sharing requirements. These services include well-woman visits, all FDA-approved contraceptives, broader screening and counseling for sexually-transmitted infections, breastfeeding support and supplies, and domestic violence screening. Certain religious employers (houses of worship) are specifically exempt from the contraceptive coverage requirement and are not required to include coverage for contraceptives in their health plans. An accommodation was established for certain non-profit religious organizations that object to providing these services (such as religiously-affiliated hospitals or universities).  Organizations that qualify for the accommodation do not have to arrange or pay for contraceptive coverage, but must instead send a form to HHS or their insurance company stating their objection to covering contraceptives. The insurance company then provides the coverage without cost-sharing.9  In June 2014, the Supreme Court held in the Burwell vs. Hobby Lobby decision that some closely-held for-profit corporations may also exclude contraceptive coverage from their health plans if their owners have sincerely held religious objections to this requirement.10   In response to the Court’s decision, the Obama Administration issued a proposed rule to expand the “accommodation” in place for non-profit organizations with religious objections to birth control services to closely-held for-profit companies.11 

Approximately 76 million people (including almost 19 million children) have received no-cost coverage for preventive health services since the ACA preventive services coverage rules took effect.12  This coverage went into effect on September 23, 2010 for new individual and employer-based coverage (grandfathered plans are exempt). Despite the length of time the benefit has been in place, awareness of the coverage remains low.13 

The ACA improves access to preventive services in Medicare and Medicaid. The ACA eliminates cost-sharing for certain Medicare covered preventive services (those recommended A or B by the USPSTF), waives the Medicare deductible for colorectal cancer screenings, and provides coverage for personalized prevention plan services, which include an annual health risk assessment. In Medicaid, the ACA provides states that offer coverage for recommended preventive services with no cost sharing a one percentage point increase in the Federal Medical Assistance Percentage (FMAP) for those services. As of January 30, 2014, ten states (California, Colorado, Hawaii, Kentucky, Nevada, New Jersey, New Hampshire, New York, Ohio, and Wisconsin) had submitted State Plan Amendments (SPA) to cover all required preventive services, and eight SPAs had been approved.14 

Extension of Dependent Coverage to Young Adults

The ACA extends dependent coverage to young adults up to age 26 beginning in September 2010.  This provision allows young adults to remain on their parents’ health plans until they turn 26. Young adults can qualify for this coverage even if they are no longer living with a parent, are not a dependent on a parent’s tax return, or are no longer a student. While it is difficult to assess the effect of this dependent coverage provision independent of other factors, analysis of data from the National Health Interview Survey indicates that 3.1 million young adults had gained coverage by December 2011.15 

Controlling Premium Growth

Medical Loss Ratio (MLR) Requirements

The MLR provisions in the ACA limit the amount of premium dollars insurers can spend on administration, marketing, and profits.  They require most health insurers in the small group and individual market to spend at least 80% of premiums on health care claims and quality improvement. Health insurers in the large group market face a higher standard and must spend at least 85% of premiums on health care claims and quality improvement. Insurers were required to begin reporting MLRs in August 2011. Insurers not meeting the thresholds must issue rebates to consumers annually, beginning in August 2012. In the case of employer-sponsored plans, in which the cost of the premium is shared between employers and employees, insurers must provide a rebate to employees that is proportionate to their share of the premium.16 

Insurers issued rebates totaling $519 million across all markets in August 2012 and $332 million in 2013. The drop in rebates in 2013 suggests that insurers were coming closer to meeting the MLR thresholds. Analysis of insurer data indicates this is the case. While most plans sold in the large and small group markets were already in compliance with the MLR requirements before the law went into effect, in the individual market, fewer than half of plans were in compliance. Since implementation of the law, the MRLs in this market have increased (Figure 2). The full impact of the MLR goes beyond just the rebates and includes the savings consumers experience from lower premiums than what would have been charged had the MLR provisions not been in place.  While it is difficult to assess the full impact of the MLR provisions, an analysis by the Kaiser Family Foundation suggested that MLR savings to consumers totaled $1.2 billion in 2011 and $2.1 billion in 2012, with most of the savings resulting from lower premiums.17 

Figure 2: Weighted Average Traditional MLRs, by Market Segment

Premium Rate Review

The ACA creates new standards for the review of premium rate increases proposed by insurers in the individual and small group markets to ensure the increases are based on accurate and verifiable data and are reasonable. While many states had rate review programs in place prior to the ACA, these programs were variable and set different standards for review.  The ACA established minimum standards for an effective rate review program, permits federal regulators to review rates in states that do not have effective programs, and requires states or the federal government to review premium rate increases of 10% or more beginning September 2011.  As of April 2014, 46 states and DC were deemed to have effective rate review programs in place.  The five states without an effective program are Alabama, Missouri, Oklahoma, Texas, and Wyoming.18 

An analysis of rate filings before and after the rate review requirements went into effect suggests these programs have had an impact on premiums.  The premiums that went into effect in 2011 were, on average, 20% lower than the rates requested by insurers, though there were differences across states and markets.19   In addition, early evidence indicated that insurers were submitting fewer rate increases above the 10% threshold, and rate requests above the 10% threshold were more likely to be denied, reduced, or withdrawn following implementation of the new requirements in September 2011.

Risk Adjustment, Reinsurance, and Risk Corridors

The ACA includes three provisions designed to promote premium stability during the early years of ACA implementation. Changes in the insurance market—guarantee issue, rate restrictions and new subsidies available in the Marketplaces—make it easier for people with high health needs to purchase coverage.  This possibility for adverse selection—when a disproportionate number of people with high health needs enroll in a plan—creates uncertainty for insurers. To encourage insurers to participate in the new Marketplaces and to compete on the basis of quality and value, rather than avoiding high risk enrollees, the ACA includes three premium stability programs: risk adjustment, reinsurance, and risk corridors, collectively known as the “three Rs”.  Risk adjustment is a permanent program that transfers funds from insurers with lower risk enrollees to plans with higher risk enrollees. The temporary reinsurance program uses payments from all health insurance issuers and self-insured plans to partially offset the expenses for high-cost enrollees. The risk corridors program protects insurers against large losses by limiting insurers’ gains and losses beyond an allowable range.20  While the risk adjustment and reinsurance programs are required to be budget neutral, the risk corridor program is not. As a result, the risk corridor program has generated some controversy, with some critics characterizing the program as a bailout to insurers.

Health Plan Benefit Design

The ACA makes significant changes to health plan benefit design, setting uniform standards for covered benefits and cost sharing in the individual and small group markets.  The ACA requires all non-grandfathered plans in the individual and small group markets, including those sold both inside and outside the Marketplaces, to cover ten categories of essential health benefits.21   These categories include:

  • Ambulatory patient services
  • Emergency services
  • Hospitalization
  • Maternity and newborn care
  • Mental health and substance use disorders, including behavioral health treatment
  • Prescription drugs
  • Rehabilitative and habilitative services and devices
  • Laboratory services
  • Preventive and wellness services and chronic disease management
  • Pediatric services, including vision and dental care

Rather than establish a uniform benefit package to be offered by all plans, regulatory guidance required states to select an EHB benchmark plan that would define the essential health benefits that must be offered by plans in the state. Any benefits covered by this benchmark plan would be considered an essential health benefit. In addition, any limits on amount, duration, and scope of benefits would be included in the definition of the EHB.22  States had to select the benchmark plan by December 26, 2012 from among the following ten plans operating in the state: the three largest small group plans, the three largest state employee health plans, the three largest federal employee health plan options, or the largest HMO offered in the state’s commercial market.  If a state did not recommend a benchmark plan, the default benchmark was the largest small group plan in the state. The majority of states (45) selected or defaulted to a small group plan, while four chose the largest commercial HMO, and two selected a state employee plan.23 

If a state’s EHB benchmark plan did not include services in all of the required benefit categories, states were required to identify supplemental coverage to complete their EHB benchmark packages.  Except for habilitative services, the benchmark plan could be supplemented by adding benefits for any missing categories from another benchmark plan. For habilitative services, states had the option to define the services to be included in that category or, if they chose not to make that determination, insurers were required to provide parity with rehabilitative services or define which habilitative services to cover and report to HHS.

Special rules govern coverage for abortion services.  Abortion services are explicitly excluded from the list of essential health benefits that all health insurance plans are required to offer.  No health plan is required to cover abortion services.  States may allow private insurers to offer a plan in their state Marketplace that includes coverage of abortions beyond what is allowed under federal law (to save the life of the woman and in cases of rape and incest); however, premium payments must be segregated into two separate accounts – one for the value of the abortion benefit and one for the value of all other services. States may also prohibit coverage for any abortions by all plans, and at least one plan within a state Marketplace must offer coverage that excludes abortions outside those permitted under federal law.24 

Plans sold in the Marketplaces and in the individual and small group markets must also fit into one of four metal tiers defined by their actuarial value (AV), which is the share of health costs covered, on average, by the plan.  The four metal tiers and their AV are:

  • Bronze: 60% AV
  • Silver: 70% AV
  • Gold: 80% AV
  • Platinum: 90% AV

Insurers have flexibility to alter the cost-sharing features within metal tiers, for example setting deductibles at different levels or applying copayments instead of coinsurance, as long as the overall AV of the plan meets the required percentage.25 

The ACA establishes a limit on the amount of cost-sharing consumers can be expected to pay for services covered by the plan.  Once this overall limit is met, the plan must cover 100% of remaining health care costs for the year.  The maximum out-of-pocket limit for 2014 was set at $6,350 per individual and $12,700 per family.  These limits increased to $6,600 per individual and $13,200 per family in 2015. The out-of-pocket limits are lower for those with incomes below 250% FPL who are eligible for cost-sharing reductions. They drop to $2,250 per individual and $4,500 per family for those with incomes 100-200% FPL and to $5,200 per individual and $10,400 per family for those with incomes 200-250% FPL.

While the goal of the benefit changes enacted by the ACA was to improve the adequacy of coverage offered to consumers, particularly in the individual market, many people have faced disruptions because their plans were canceled, either because the plans did not comply with the new ACA requirements or because insurers chose not to continue offering the plans.  Estimates from the Urban Institute indicate that about 2.6 million people had their plans canceled because the plans did not meet the ACA requirements and another 840,000 had plans canceled for other reasons.26   Many consumers whose plans were canceled were able to find comparable coverage through the Marketplaces or in the individual market outside the Marketplaces, though some had to pay more for the coverage.  According to the findings from the Kaiser Survey of Non-Group Health Insurance Enrollees, of respondents who switched from non-compliant to compliant plans, similar shares reported paying higher or lower premiums for the new coverage (39% vs. 46%).  However, plan switchers were less likely to report being satisfied with the plan costs and less likely to perceive their coverage as a good value, perhaps because about half of plan switchers reported having their previous plan canceled.27 

Issue Brief: Individual And Employer Requirements

Requirements for Individuals to Have Coverage

Individuals are required to have health coverage, with some exceptions. Beginning in 2014, the ACA requires individuals to have minimum essential coverage or pay a penalty.28  This requirement was included in the ACA to guard against the potential that young, healthy people would choose to forego insurance, referred to adverse selection. The penalty phases in over time. In 2014, the penalty was the greater of $95 (up to $285 for a family) or 1% of income. The penalty increases to the greater of $325 (up to $975 for a family) or 2% of income in 2015 and $695 (up to $2,085 for a family) or 2.5% of income in 2016.29  There are exemptions to the requirement, including for coverage that is not affordable (costs more than 8% of household income), for religious objections, for members of Indian tribes, for those with income below the tax filing threshold, and for short gaps in coverage of less than three consecutive months. Individuals can also claim hardship exemptions, including those with incomes below 138% FPL who live in states that did not adopt the Medicaid expansion.

Individuals will be required to report health coverage on their 2014 taxes. The individual mandate is enforced through the tax filing process. For the first time, tax filers must document that they had insurance coverage during the year when they file their 2014 taxes. If they did not and they do not qualify for one of the exemptions, they will be assessed a penalty in the form of an additional tax for the months in which they did not have health coverage. Those who were uninsured during 2014 can request certain exemptions when they file their taxes (e.g., for unaffordable coverage, short gaps in coverage, or member of an Indian tribe), while other exemptions must be obtained through the health insurance Marketplace (e.g., for hardship exemptions, religious objections). On February 20, 2015, HHS announced there would be a one-time special enrollment period allowing people who first learned of the penalty for not having insurance when they filed their taxes to enroll in coverage through the Marketplaces. This special enrollment period for the federal Marketplace will run from March 15, 2015 through April 30, 2015. Many states running their own Marketplaces have announced or are considering similar special enrollment periods.

The IRS estimates that roughly 30 million taxpayers who lacked coverage for some or all of the year will qualify for an exemption in 2014, while 3 to 6 million will owe a penalty for not having insurance. The IRS also estimates that 75% of 2014 taxpayers will have had minimum essential coverage for the entire year and so will be able to check a single box on their tax form indicating they complied with the individual shared responsibility requirement. Separately, the Congressional Budget Office (CBO) estimates that about four million people will pay a penalty for not having insurance in 2016, and approximately $4 billion in penalty payments will be collected that year.30 

Employer Requirements

Beginning in 2015, large employers are required to provide coverage to full-time employees or face a penalty. In 2015, employers with 100 or more full-time equivalent employees will be assessed a fee up to $2,000 per full-time employee (in excess of 30 employees) if they do not offer coverage to at least 95% of full-time workers and their dependents (defined as children up to age 26; does not include spouses) and if they have at least one employee who receives a premium tax credit through a Marketplace. Final regulations issued by the IRS provide transition relief to these large employers in 2015: employers are only subject to the penalty if they do not offer affordable coverage to 70% of full-time workers; and the penalty payments is calculated as up to $2,000 per full-time employee minus up to 80 employees.31  These requirements go into effect for employers with 50-99 full-time equivalent employees in 2016. To avoid penalties, employers must offer insurance that pays for at least 60% of covered health care expenses, and the employee share of the premium must not exceed 9.5% of family income. This requirement does not apply to employers with fewer than 50 workers.

For purposes of employer mandate, full-time work is defined as 30 or more hours per week. Opponents of the law are critical of this definition of full-time worker, claiming it unduly burdens certain industries, such as retail and hospitality where part-time employment is more common, and provides disincentives to employers to hire full-time workers. Supporters argue changing the definition will lead to more people being shifted from full-time to part-time work. Proposals to change the definition of full-time from 30 hours per week to 40 hours per week will likely be debated in this Congress.

Firms with large shares of low-wage workers are less likely to offer health coverage, and as a result, may have more difficulty meeting the employer requirements. According to data from the Kaiser/HRET Survey of Employer-Sponsored Health Benefits, among firms with 100 or more employees where 35% or more of workers earn $23,000 a year or less, 74% offer health insurance to workers compared to 96% of firms with a low share of low-wage workers (Figure 3).32  In addition, fewer workers in firms with a large share of low-wage workers are eligible for coverage if it is offered (workers may not be eligible for coverage because of waiting periods or because they do not work enough hours per week).

Figure 3: Offer, Eligibility, Take up, and Coverage Rates of Firms with High and Low Shares of Low-wage Workers, 2014

Issue Brief: Expanding Coverage

Health Insurance Marketplaces

The ACA creates new health insurance Marketplaces (also referred to as Exchanges) where individuals and small businesses can purchase insurance. Marketplaces are designed to create a more organized and competitive market for health insurance by offering a choice of health plans, establishing common rules regarding the offering and pricing of insurance, and providing information to help consumers better understand the options available to them. The Marketplaces serve individuals and small businesses (the Marketplace for small businesses is called the Small Business Health Options Program (SHOP)).  Coverage through the Marketplaces is available to nearly all U.S. citizens and legal resdients (undocumented immigrants and those who are incarcerated are not permitted to buy coverage in the Marketplaces), though financial assistance is only available to those meeting income and other requirements. Plans sold through the Marketplaces must meet certain standards and must be certified as Qualified Health Plans (QHPs).

States approaches to the Marketplaces differ.  The ACA envisioned that all states would implement State-based Marketplaces (SBMs); however, political opposition among Republican Governors and state legislatures led many states to opt for a Federally-facilitated Marketplace (FFM). Thirty-four states rely on a Marketplace fully run by the federal government, while seven states adopted a hybrid approach (a State-Partnership Marketplace) in which the states assume some Marketplace responsibilities, including plan management and consumer assistance. In all, 17 states have established SBMs, with 14 of these fully run the states. Three SBMs (Nevada, New Mexico, and Oregon) that struggled to establish functional websites through which consumers could apply for and enroll in coverage have chosen to use the federal healthcare.gov portal for 2015 (Figure 4).

Figure 4: State Health Insurance Marketplace Types, 2015

To assist states in setting up the Marketplace, the ACA provided federal funding to states through Exchange Planning and Establishment grants. This funding was available to states through December 2014. Nearly $5 billion in funding was provided to states through these grants.33 

One of the most significant challenge states and the federal government have faced in establishing the Marketplaces has been building the online portal or website through which individuals and small employers can apply for and enroll in coverage. Last year, healthcare.gov, the federal website, launched with nearly catastrophic problems.  Many state websites also experienced problems and while many of these issues were resolved before the end of the open enrollment period, websites in several states never worked well and have since been scrapped.  During the second open enrollment period, the federal website and most state websites were free of the serious problems encountered last year.

Health insurance Marketplaces were marked by volatility in first two years of operation. Most Marketplaces offered consumers a choice of plans in the first year, and premiums overall were lower than expected. In year two, new insurers entering Marketplaces in many states are enhancing competition and increasing consumer choice in those areas. However, decisions by some insurers to leave certain markets have left many consumers with the need to find new coverage and fewer coverage options.34  Overall, premium growth in 2015 was modest, but it masked large variation across states, from increases as large as 28% in Alaska and 18% in Minnesota to declines of 15% and 25% in Colorado and Mississippi, respectively.35  As insurers adjust their premium pricing strategies, some consumers are facing higher prices to remain in the same plan.

Premium Tax Credits and Cost Sharing Reductions

Premium tax credits and cost-sharing reductions are available through the Marketplaces to make coverage more affordable for qualifying individuals. Premium tax credits are available to U.S. citizens and legally residing immigrants who have income between 100% and 400% FPL and who do not have access to affordable coverage through an employer or public coverage (Medicaid, CHIP, or Medicare).  Married consumers must file taxes jointly in order to qualify. The tax credits work by limiting the amount consumers must pay for coverage to a percentage of their income.  In 2015, the required premium contributions range from 2.01% of income for those with income 100-133% FPL to 9.56% of income for those with incomes 300-400% FPL.36  The tax credit amounts are tied to the second-lowest cost Silver plan (the benchmark plan), though consumers may use these tax credits to purchase less or more expensive plans.

Cost sharing reductions are available to individuals eligible for premium tax credits with incomes between 100 and 250% FPL.  The cost sharing reductions lower deductibles, copayments, and other out-of-pocket costs.  They work by increasing the actuarial value of Silver level plans from 70% to 94% for those with incomes 100-150% FPL, 87% for those with incomes 150-200% FPL, and 73% for those with incomes 200-250% FPL.  To take advantage of the cost sharing reductions, consumers must purchase a Silver plan.

Consumers who are eligible for tax credits may receive advance payment of those tax credits based on their projected income for the coverage year; however, they will need to reconcile receipt of the advance payments when they file their taxes. Consumers who received advance payment of premium tax credits in 2014 are reconciling those payments for the first time this year. Consumers who received payments that were too high based on their annual income for the year will be required to repay some or all of the excess payments. Limits are placed on repayment amounts for those with incomes less than 400% FPL. In addition, an exception is made to the repayment requirements for consumers who received advance payment of the tax credits during the year but whose income later fell below Medicaid eligibility levels, or below the poverty level, by the end of the year. These consumers are not required to repay the payments they received. Consumers who received payments that were too low based on their annual income will receive a refund.

Due to what is referred to as the family glitch, many working low-income families for whom the cost of family coverage through an employer is not affordable are not eligible to access subsidized coverage in the Marketplace.  Under the ACA, premium tax credits in the Marketplaces are not available to those who have an affordable offer of coverage from their employer. An offer is considered affordable if the employee share of the premium for single coverage costs less than 9.5% of the employee’s income. This definition applies even if the employee needs to purchase family coverage that may cost more than 9.5% of income. Estimates suggest that as many as 3.9 million dependents are excluded from accessing premium tax credits that would lower their cost of coverage.37  While these dependents are exempt from any penalties related to not having insurance, without an affordable coverage option, many may forego insurance.

Cost sharing in Marketplace plans is high, but cost sharing subsidies meaningfully reduce the out-of-pocket burden for many low and modest-income consumers. In general, consumers enrolling in plans in the Marketplace face high out-of-pocket costs when they access health services. Overall, across the states using healthcare.gov, deductibles for Silver plans averaged $2,556 and the average out-of-pocket limit was $5,826. These amounts were reduced in plans that applied the cost sharing reductions (CSR plans). Deductibles averaged $2,077 in CSR73 plans, $737 in CSR87 plans, and $229 in CSR94 plans while out-of-pocket costs were capped on average at $4,624 in CSR73 plans, $1,692 in CSR87 plans, and $881 in CSR94 plans.38  Particularly for those eligible for CSR94 and CSR87 plans, these reductions in cost sharing amounts can help to alleviate the financial burden of accessing needed health care services.

A decision in the case, King vs Burwell, currently before the Supreme Court, will determine whether the federal government has the authority to continue providing subsidies to consumers in states that do not have a state-run Marketplace. The plaintiffs in the case argue that a strict interpretation of the language of the ACA prohibits subsidies in states that do not have a Marketplace “established by the state.”39  A ruling for the plaintiffs in this case would invalidate premium tax credits and cost sharing reductions for consumers in the 34 states that rely on the Federal Marketplace or operate a Partnership Marketplace. Subsidies in the three SBM states that rely on the healthcare.gov web portal may also be at risk.  As of February 15, 2015, there were over 7.5 million people in the 34 states whose subsidies could be at risk. A ruling by the Court in this case is expected in June 2015 (Figure 5).

Figure 5: Share of People Who Have Selected a Marketplace Plan and Received Premium Subsidies in States with a Federally-run Marketplace, as of February 15, 2015

Basic Health Program

To date, only Minnesota has adopted the Basic Health Program (BHP) option, which allows states to create an alternative coverage program for adults with income between 133 and 200% FPL who would otherwise be eligible for coverage through the Marketplace. The BHP provides states with the option of offering coverage that is more affordable and/or more comprehensive than what would be available to consumers in the Marketplaces. States have flexibility in designing this coverage, but it must be at least as comprehensive and affordable as subsidized coverage in the Marketplaces. To finance the BHP, the federal government pays states 95% of what BHP enrollees would have received in Marketplace subsidies.40  States can implement BHP beginning in 2015. So far, only states that offered more comprehensive Medicaid coverage prior to the ACA are considering adopting the BHP.

Outreach and Enrollment

Marketplaces are required to establish and finance Navigator programs to conduct outreach and provide enrollment assistance to consumers. According to a survey of assister programs nationwide, a total of 28,000 assisters provided enrollment assistance to over 10 million consumers during the 2014 open enrollment period.41  These assisters have proven instrumental in educating consumers with limited experience purchasing private insurance and who face challenges, such as language barriers and lack of access to the internet, to applying for and enrolling in coverage. While states running their own Marketplaces have been able to use federal grant funds to support robust assister programs during the first two years, support for Navigators in FFM states has been more limited.42  Future funding for assisters is a concern in both state Marketplaces and the FFM.

At the end of the first open enrollment period, over eight million people had selected a Marketplace plan. Despite a slow start to enrollment due to website problems that hindered early enrollment, a surge in sign-ups during the last two weeks of the open enrollment period pushed enrollment above eight million. By October, 6.7 million people were enrolled and paying premiums, a fall-off that was somewhat expected as people’s situations changed and difficulties arose in paying premiums.

As of February 15, 2015, over 11.6 million people had signed up for coverage through the Marketplaces. While the second open enrollment period officially ended on February 15, 2015, extensions were granted in many states for those who were “in line” on the closing date. As a result, the total number of people signing up for coverage in 2015 will increase. Based on the preliminary enrollment data from states using healthcare.gov, about 52% of those enrolling in coverage in 2015 were new to the Marketplace, while 42% renewed their coverage from 2014. Less than half of consumers renewing coverage were automatically reenrolled in their current plan, while 53% of renewing consumers returned to the Marketplace and selected a new plan.43 

Figure 6: Status of Medicaid Expansion Decisions, February 1, 2015

Medicaid Expansion

The ACA sought to fill one of the most notable gaps in Medicaid’s role as a source of coverage for the low-income population— the exclusion of adults without dependent children no matter how poor, unless a state obtained a waiver to provide them coverage (and few states had such waivers). The ACA intended to remove the categorical eligibility requirements for Medicaid coverage stemming from its welfare heritage and convert Medicaid coverage to be based on income— establishing a national minimum income eligibility level effectively at 138% FPL in all states. This standard would apply mostly to adults as all states cover children to substantially higher levels through Medicaid and CHIP with median eligibility at 255% of poverty. The expansion population is 100% federally financed in 2014-2016 with the federal match phasing down to 90% in 2020 and thereafter. Consistent with previous Medicaid policy, undocumented and recent lawfully present immigrants remain excluded from enrolling in coverage.

As enacted, the ACA expanded Medicaid eligibility to adults with income at or below 138% FPL, although this core provision was effectively made a state option by the Supreme Court’s 2012 ruling on the ACA. However, other eligibility changes in the law were unaffected by the Court’s decision, including establishing a new minimum coverage level of 138% FPL for children of all ages in Medicaid, helping to align Medicaid coverage across children. The ACA also changed the method for determining financial eligibility for Medicaid for children, pregnant women, parents, and adults and CHIP to a standard based on modified-adjusted gross income (MAGI).  This new approach, effective January 1, 2014, is intended to prevent gaps in coverage between programs by aligning with the method for determining eligibility for subsidies to purchase Marketplace coverage.

As of February 2015, 29 states and the District of Columbia have implemented the Medicaid expansion to low-income adults (Figure 6). Most states expanded Medicaid consistent with federal rules and options provided under the ACA, but five states (Arkansas, Iowa, Indiana, Michigan, and Pennsylvania) obtained Section 1115 waivers to implement the expansion in ways that extend beyond the flexibility provided by the law (the Governor of Pennsylvania recently announced the state would not proceed with implementing the waiver, but would instead expand Medicaid through the State Plan Amendment process).44  Notably, Arkansas has implemented the expansion with a waiver that allows it to implement a mandatory premium assistance program where the state enrolls the expansion population into QHPs in the Marketplace. Other states have used waivers to impose premiums for individuals with incomes between 100 and 138% FPL or to add healthy behavior incentives to coverage.

Medicaid Coverage Gap

Large gaps in coverage persist for parents and other low-income adults in the 22 states that have not yet expanded Medicaid since Medicaid eligibility levels for parents remain very low and childless adults remain ineligible for full Medicaid benefits in all but one of the non-expansion states. Among the non-expansion states, the median eligibility level is 46% FPL for parents and 0% for other adults, compared to 138% FPL for parents and adults in expansion states.

As a result of these limited eligibility levels, 3.7 million poor uninsured adults fall into a coverage gap because they earn too much to qualify for Medicaid and too little to qualify for subsidies for Marketplace coverage, which begin at 100% FPL.45  Because the ACA was enacted assuming the Medicaid expansion would go forward in all states and everyone below the poverty level would be covered, the law only provided access to subsidies through the Marketplace for individuals above the poverty level up to 400% FPL. Thus, those individuals between 100-138% FPL, who would have been covered by Medicaid if the state expanded, are able to access subsidized coverage in the Marketplace but those below poverty are ineligible for subsidies. Of the 3.7 million adults in the coverage gap, nearly 90% live in the south and over half are Black or Hispanic (Figure 7).

Even in states that do expand Medicaid, undocumented immigrants and many recent lawfully present immigrants will remain ineligible. Because many uninsured non-citizens are in low-income working families, many are in the income range to qualify for the ACA Medicaid expansion.  However, under federal rules, undocumented immigrants may not enroll in Medicaid.  Many lawfully present non-citizens who would otherwise be eligible for Medicaid remain subject to a five-year waiting period before they may enroll, and some groups of lawfully present immigrants remain ineligible regardless of their length of time in the country.

Figure 7: Distribution of Adults in the Coverage Gap, by State and Region

Medicaid Enrollment

Medicaid enrollment has grown under the ACA. Enrollment data show that as of December 2014, Medicaid and CHIP enrollment has grown by over 10.7 million since the period just prior to the beginning of the initial open enrollment period for the Marketplaces in October 2013.46  This change represents an 18.6% increase in enrollment over the period across all states.  Enrollment increases were higher (27%) among states that chose to expand Medicaid eligibility under the ACA, compared to states that had not expanded (7%), suggesting that the Medicaid expansion is contributing to greater enrollment growth. However, some who are eligible remain unenrolled due to limited awareness about the Medicaid program and their eligibility or other enrollment challenges.

Streamlining Application and Enrollment Processes

The ACA also enacted sweeping changes to streamline and modernize application, enrollment, and renewal processes in Medicaid and CHIP and coordinate with the Marketplaces which all states must implement regardless of their Medicaid expansion decisions. Together these processes are intended to achieve the ACA’s vision to provide “no wrong door” access to all health coverage options, minimize the paperwork burden on consumers and state agencies, and enhance the consumer experience.47  States must provide multiple options for individuals to apply for health coverage, including online, by phone, by mail, and in person, using a single streamlined application for Medicaid, CHIP, and Marketplace coverage. In addition, states must seek to rely on electronic data to verify eligibility criteria and renew coverage.

Impact on the Uninsured

New coverage options available through the ACA have resulted in many uninsured gaining coverage. Increased coverage through employers, the Marketplaces, and Medicaid is bringing down the uninsured rate. Data from the National Health Interview Survey shows a drop in the uninsured rate among the non-elderly from 16.6% in 2013 to 14.0% in the second quarter of 2014, with the most significant decline for the low-income and minority uninsured population (Figure 8).48  In addition, a survey by the Kaiser Family Foundation indicates 11 million uninsured adults gained coverage in 2014.49  Other poll data show similar results.

Figure 8: Impact of ACA: Coverage Increasing, Uninsured Rates Decreasing

The uninsured rate is dropping more precipitously in states that have embraced the ACA’s coverage expansions. Data from the National Health Interview Survey indicate that there was a greater decline in the uninsured rate in states that are expanding Medicaid. Among states adopting the Medicaid expansion, the uninsured rate dropped by 4.3 percentage points from 18.4% in 2013 to 14.1% through the second quarter of 2014. In contrast, the uninsured rate dropped by only 2.5 percentage points in states not adopting the Medicaid expansion, from 22.7% in 2013 to 20.2% through the second quarter 2014.50  Other evidence from the Gallup Healthways Well-Being Index reveals the largest reductions in the uninsured have been in Arkansas and Kentucky.51 

Looking Ahead

Looking Ahead

Four years after the law was enacted, the ACA remains controversial. While many support individual provisions included in the law, Americans are divided in their opinions on the law overall. The political future of the law continues to be debated in Congress and in state legislatures across the country, and ongoing legal challenges create uncertainty. Yet, in the face of these many hurtles and setbacks, real progress has been made in implementing key features of the ACA and important steps have been taken to improve access to and affordability of health coverage for millions of people.

As implementation of the ACA moves forward, a number of key challenges persist:

  • The future of the ACA’s coverage expansions remains uncertain. The biggest potential threat to the long-term stability of the Marketplaces is the impending Supreme Court decision in the King v. Burwell A decision in favor of the plaintiffs will not only cut off subsidies in states with a federally-run Marketplace pushing many people back into the ranks of the uninsured, but the viability of the Marketplaces in these states will be threatened as premiums rise. At the same time, debate over the Medicaid expansion will continue in a few states in the coming year given that there is no deadline for expanding Medicaid. More governors may pursue alternative models through waivers; however, opposition to the Medicaid expansion remains strong in state legislatures. Nevertheless, decisions by even a small number of states to expand Medicaid would increase the number of people with access to affordable health coverage. Further complicating the coverage picture, funding for the Children’s Health Insurance Program (CHIP) expires in 2015. While CHIP has maintained broad bipartisan support, the debate over funding and CHIP’s future will be complicated by the availability of coverage through the Marketplaces and questions over how best to integrate CHIP with Medicaid, Marketplace, and employer-sponsored coverage.
  • Although enrollment in the second year was strong, many uninsured remain unaware of the requirements to have coverage and of subsidies available to make coverage more affordable. Public opinion polls find over half of the uninsured do not know that the law provides financial help to low and moderate income Americans and nearly four in ten uninsured expect to remain uninsured.52  With limited funding for marketing and outreach, reaching these potentially eligible consumers will be harder. Navigators and other enrollment assisters will continue to play an important role in supporting enrollment, especially among hard to reach populations; however, as Marketplace funding for these programs shrinks, their role may be jeopardized.
  • Affordability of coverage is a concern. Premium growth for both employer group coverage and in the new Marketplaces has been modest overall. However, it is unclear whether the moderate premium growth seen over the past couple of years will continue. While subsidies in the Marketplaces will protect many consumers from sharp increases in premiums, those who purchase coverage without financial assistance would feel the full impact of the cost growth. In addition to premiums, high deductibles and other cost sharing in plans in the Marketplaces place a significant financial burden on those who need health services. While, overall, the increase in health insurance coverage appears to be reducing cost-related barriers to accessing health care, the high cost sharing in Marketplace plans may limit access to needed care for some and premiums can still be a financial impediment to coverage.
  • Despite progress in lowering the number of uninsured, many people are left out of the ACA’s coverage expansions. State decisions not to expand Medicaid have left over 3.7 million poor adults in the coverage gap. In addition, undocumented immigrants are ineligible for either Medicaid or Marketplace coverage. Without access to affordable insurance, these individual will likely continue to rely on safety net providers for care. While these providers have traditionally cared for the uninsured and other vulnerable, low-income populations, the funding they have relied on to finance this care is declining. In particular, cuts to the Medicare and Medicaid Disproportionate Share Hospital programs will, over time, dramatically reduce the financial support for indigent care. Providers, especially in states that do not expand Medicaid where the uninsured will be increasingly concentrated, will feel the financial squeeze of the continued demand for care and more limited financing to support that care.

The ACA remains a work in progress and a subject of sharp partisan disagreement. The individual market has been reformed, the long-standing barrier to Medicaid coverage for adults without dependent children has been removed in many but not all states, new health insurance Marketplaces are in place, and the ranks of the uninsured have been significantly reduced, while significant legal political and implementation challenges remain.

Endnotes

  1. Health Insurance Reform Requirements for the Group and Individual Health Insurance Markets. 45 CFR Part 147 (2010) ↩︎
  2. 45 CFR §§ 147.104, 147.106, 147.108 ↩︎
  3. Fair health insurance premiums. 45 CFR § 147.102 (2014) ↩︎
  4. Preservation of right to maintain existing coverage. 45 CFR § 147.140 (2010) ↩︎
  5. Levitt L. September 8, 2011. “Grandfathering Explained.” Kaiser Family Foundation. https://modern.kff.org/health-reform/perspective/grandfathering-explained/ ↩︎
  6. Kaiser Family Foundation and Health Research & Educational Trust. 2014. 2014 Kaiser/HRET Employer Health Benefits  Survey.   https://modern.kff.org/health-costs/report/2014-employer-health-benefits-survey/ ↩︎
  7. Jost T. December 23, 2014. “Implementing Health Reform: Proposed Changes to the Uniform Summary of Benefits and Coverage, Uniform Glosssary (Updated).” Health Affairs Blog. http://healthaffairs.org/blog/2014/12/23/implementing-health-reform-proposed-changes-to-summary-of-benefits-and-coverage-uniform-glossary/ ↩︎
  8. Coverage of preventive health services. 45 CFR § 147.130 (2013) ↩︎
  9. Kaiser Family Foundation. September 2014. “How Does Where You Work Affect Your Contraceptive Coverage?”  https://modern.kff.org/womens-health-policy/fact-sheet/how-does-where-you-work-affect-your-contraceptive-coverage/ ↩︎
  10. Burwell v. Hobby Lobby, 573 U.S. __ (2014).  Opinion available at http://www.supremecourt.gov/opinions/13pdf/13-354_olp1.pdf ↩︎
  11. Center for Consumer Information and Insurance Oversight. “Fact Sheet: Women’s Preventive Services Coverage, Non-Profit Religious Organizations, and Closely Held For-Profit Entities.” Available at http://www.cms.gov/CCIIO/Resources/Fact-Sheets-and-FAQs/womens-preven-02012013.html ↩︎
  12. Burke A and Simmons A. June 27, 2014. “Increased Coverage of Preventive Services with Zero Cost Sharing under the Affordable Care Act.” Office of the Assistant Secretary for Planning and Evaluation, Department of Health and Human Services. http://aspe.hhs.gov/health/reports/2014/preventiveservices/ib_preventiveservices.pdf ↩︎
  13. Hamel L; Firth J and Brodie M. March 2014. “Kaiser Health Tracking Poll: March 2014.” Kaiser Family Foundation. https://modern.kff.org/health-reform/poll-finding/kaiser-health-tracking-poll-march-2014/ ↩︎
  14. Department of Health and Human Services, Report to Congress on Preventive Services and Obesity-related Services Available to Medicaid Enrollees, 2014. http://www.medicaid.gov/Medicaid-CHIP-Program-Information/By-Topics/Quality-of-Care/Downloads/RTC-Preventive-Obesity-Related-Services2014.pdf ↩︎
  15. Sommers B. June 2012. “Number of Young Adults Gaining Insurance Due to the Affordable Care Act Now Tops 3 Million.” ASPE, Department of Health and Humans Services.  http://aspe.hhs.gov/aspe/gaininginsurance/rb.cfm ↩︎
  16. Kaiser Family Foundation. February 29, 2012. “Explaining Health Care Reform: Medical Loss Ratio (MLR).”  https://modern.kff.org/health-reform/fact-sheet/explaining-health-care-reform-medical-loss-ratio-mlr/ ↩︎
  17. Cox C, Claxton G and Levitt L. June 6, 2013. “Beyond the Rebates: How Much Are Consumers Saving from the ACA’s Medical Loss Ratio Provisions.” Kaiser Family Foundation.  https://modern.kff.org/health-reform/perspective/beyond-rebates-how-much-are-consumers-saving-from-the-acas-medical-loss-ratio-provision/ ↩︎
  18. The Kaiser Family Foundation State Health Facts. Data source: State Effective Rate Review Programs, The Center for Consumer Information & Insurance Oversight (CCIIO), CMS; April 16, 2014.https://modern.kff.org/health-reform/state-indicator/rate-review-program-effectiveness/ ↩︎
  19. Kaiser Family Foundation. October 1, 2012. “Quantifying the Effects of Health Insurance Rate Review.”  https://modern.kff.org/health-costs/report/quantifying-the-effects-of-health-insurance-rate/ ↩︎
  20. Kaiser Family Foundation. January 2014. “Explaining Health Care Reform: Risk Adjustment, Reinsurance, and Risk Corridors.” https://modern.kff.org/health-reform/issue-brief/explaining-health-care-reform-risk-adjustment-reinsurance-and-risk-corridors/ ↩︎
  21. 78 FR 12866, February 25, 2013. ↩︎
  22. Kaiser Family Foundation. January 2013. “Implementing New Private Health Insurance Market Rules.” https://modern.kff.org/health-reform/issue-brief/implementing-new-private-health-insurance-market-rules-2/ ↩︎
  23. The Kaiser Family Foundation State Health Facts. Data compiled by KFF staff through a review of state documents and the final EHB rule from the Department of Health and Human Services. https://modern.kff.org/health-reform/state-indicator/ehb-benchmark-plans/ ↩︎
  24. Salganicoff A, et. al. September 2014.  “Coverage for Abortion Services and the ACA.” Kaiser Family Foundation.  https://modern.kff.org/womens-health-policy/issue-brief/coverage-for-abortion-services-and-the-aca/ ↩︎
  25. Levitt L, Claxton G and Pollitz K. February 28, 2012. “Private Insurance Benefits and Cost-Sharing under the ACA.” Kaiser Family Foundation. https://modern.kff.org/health-reform/perspective/private-insurance-benefits-and-cost-sharing-under-the-aca ↩︎
  26. Clemens-Cope L and Anderson N.  March 3, 2014. “How Many Non-Group Policies Were Canceled: Estimates from December 2013.” Health Affairs Blog. http://healthaffairs.org/blog/2014/03/03/how-many-nongroup-policies-were-canceled-estimates-from-december-2013/ ↩︎
  27. Hamel L, et al. June 19, 2014. “Survey of Non-Group Health Insurance Enrollees.” Kaiser Family Foundation. https://modern.kff.org/health-reform/report/survey-of-non-group-health-insurance-enrollees/ ↩︎
  28. Individual Shared Responsibility Payment for Not Maintaining Minimum Essential Coverage.   26 CFR §§1.5000A-1 through 1.5000A-5 (2014). ↩︎
  29. For individuals and families who owe a penalty based on percentage of income, the penalty is based on income above the tax filing threshold, which is $10,150 for an individual/$20,300 for joint filers in 2014.  This penalty is also capped at the national average premium for a bronze plan.  In 2014, that amount is $2,448 for an individual, $12,240 for a family of five. ↩︎
  30. Congressional Budget Office. June 5, 2014. “Payments of Penalties for Being Uninsured under the Affordable Care Act: 2014 Update.” http://www.cbo.gov/publication/45397 ↩︎
  31. 79 FR 8543. February 12, 2014. Shared Responsibility for Employers Regarding Health Coverage. https://www.federalregister.gov/articles/2014/02/12/2014-03082/shared-responsibility-for-employers-regarding-health-coverage ↩︎
  32. Kaiser Family Foundation. December 18, 2014. “Web Briefing for Journalists: How the ACA’s Employer Requirements and Related Provisions Affect Businesses and Workers.” https://modern.kff.org/health-reform/event/december-18-web-briefing-for-journalists-how-acas-employer-requirements-and-related-provisions-affect-businesses-and-workers/ ↩︎
  33. The Kaiser Family Foundation State Health Facts. Data source: “Creating a New Competitive Health Insurance Marketplace,” CMS.gov.  https://modern.kff.org/health-reform/state-indicator/total-exchange-grants/ ↩︎
  34. Kaiser Family Foundation State Health Facts. Data Source: Kaiser Family Foundation analysis of health plan information available through healtlhcare.gov and insurance company rate filings to state regulators. https://modern.kff.org/other/state-indicator/number-of-issuers-participating-in-the-individual-health-insurance-marketplace/ ↩︎
  35. Kaiser Family Foundation State Health Facts. Data Source: Kaiser Family Foundation analysis of premium data from healthcare.gov and insurer rate filings to regulators. https://modern.kff.org/other/state-indicator/monthly-silver-premiums-for-a-40-year-old-non-smoker-making-30000year-2014-2015/ ↩︎
  36. Kaiser Family Foundation. October 27, 2014. “Explaining Health Reform: Questions about Health Insurance Subsidies.” https://modern.kff.org/health-reform/issue-brief/explaining-health-care-reform-questions-about-health/ ↩︎
  37. Kaiser Family Foundation. April 24, 2011. “Measuring the Affordability of Employer Health Coverage.”  https://modern.kff.org/health-costs/perspective/measuring-the-affordability-of-employer-health-coverage/ ↩︎
  38. Claxton, G and Panchal, N. February 11, 2015. “Cost-Sharing Subsidies in Federal Marketplace Plans.” Kaiser Family Foundation. https://modern.kff.org/health-costs/issue-brief/cost-sharing-subsidies-in-federal-marketplace-plans/ ↩︎
  39. Musumeci M. February 2015. “Are Premium Subsidies Available in States with a Federally-run Marketplace? A Guide to the Supreme Court Argument in King v. Burwell.” Kaiser Family Foundation.  https://modern.kff.org/health-reform/issue-brief/are-premium-subsidies-available-in-states-with-a-federally-run-marketplace-a-guide-to-the-supreme-court-argument-in-king-v-burwell/ ↩︎
  40. Dorn S and Tolbert J. November 2014. “The ACA’s Basic Health Program Option: Federal Requirements and State Trade-offs.” Kaiser Family Foundation. https://modern.kff.org/health-reform/report/the-acas-basic-health-program-option-federal-requirements-and-state-trade-offs/ ↩︎
  41. Pollitz K, Tolbert J, and Ma, R. July 15, 2014. “Survey of Health Insurance Marketplace Assister Programs.” Kaiser Family Foundation.  https://modern.kff.org/report-section/survey-of-health-insurance-marketplace-assister-programs-section-2/ ↩︎
  42. Kaiser Family Foundation. September 24, 2013. “Helping Hands: A Look at State Consumer Assistance Programs under the Affordable Care Act.” https://modern.kff.org/health-reform/issue-brief/helping-hands-a-look-at-state-consumer-assistance-programs-under-the-affordable-care-act/ ↩︎
  43. HHS.gov/HealthCare Blog. February 25, 2015. “Open Enrollment 2015 Re-Enrollment Snapshot.” Department of Health and Human Services.  http://www.hhs.gov/healthcare/facts/blog/2015/02/open-enrollment-2015-re-enrollment.html ↩︎
  44. Rudowitz R, Artiga S, and Musumeci M. February 2015. “The ACA and Medicaid Expansion Waivers.” Kaiser Family Foundation.  https://modern.kff.org/medicaid/issue-brief/the-aca-and-medicaid-expansion-waivers/ ↩︎
  45. Garfield R, et. al. November 2014. “The Coverage Gap: Uninsured Poor Adults in States that Do Not Expand Medicaid—An Update.” Kaiser Family Foundation.  https://modern.kff.org/health-reform/issue-brief/the-coverage-gap-uninsured-poor-adults-in-states-that-do-not-expand-medicaid-an-update/ ↩︎
  46. Centers for Medicare and Medicaid Services. February 2015. “Medicaid and CHIP: December 2014 Monthly Applications, Eligibility Determinations and Enrollment Report.”  http://www.medicaid.gov/medicaid-chip-program-information/program-information/downloads/december-2014-enrollment-report.pdf ↩︎
  47. Kaiser Family Foundation. December 11, 2012. “Medicaid Eligibility, Enrollment Simplification, and Coordination under the Affordable Care Act: A Summary of CMS’s March 23, 2012 Final Rule.” https://modern.kff.org/medicaid/issue-brief/medicaid-eligibility-enrollment-simplification-and-coordination-under-the-affordable-care-act-a-summary-of-cmss-march-23-2012-final-rule/ ↩︎
  48. Kaiser Commission on Medicaid and the Uninsured analysis of 2001-2014 National Health Interview Surveys. ↩︎
  49. Garfield R and Young K. 2015. “Adults Who Remained Uninsured at the End of 2014.” Kaiser Family Foundation. https://modern.kff.org/health-reform/issue-brief/adults-who-remained-uninsured-at-the-end-of-2014/ ↩︎
  50. Kaiser Commission on Medicaid and the Uninsured analysis of 2013-2014 National Health Interview Surveys. ↩︎
  51. Witters D. August 5, 2014. “Arkansas, Kentucky Report Sharpest Drops in Uninsured Rate.” Gallup. http://www.gallup.com/poll/174290/arkansas-kentucky-report-sharpest-drops-uninsured-rate.aspx#1 ↩︎
  52. DiJulio B, Firth J, and Brodie M. January 28, 2015. “Kaiser Health Tracking Poll: January 2015.” Kaiser Family Foundation. https://modern.kff.org/health-costs/poll-finding/kaiser-health-tracking-poll-january-2015/ ↩︎
News Release

New Kaiser Policy Insight and Issue Brief Examine Policy Implications and Legal Arguments in the U.S. Supreme Court’s King v. Burwell Case

Published: Feb 26, 2015

With the Supreme Court set to hear oral arguments in King v. Burwell on March 4, a new Policy Insight from the Kaiser Family Foundation’s Larry Levitt and Gary Claxton explores the policy implications for consumers and insurance markets if the Court were to side with the plaintiffs in the challenge to the Affordable Care Act’s consumer subsidies. A second issue brief by KFF’s MaryBeth Musumeci, a policy analyst and an attorney, explains the legal arguments underlying the case.

At issue in the case is whether the federal government can provide premium and cost-sharing subsidies to consumers who buy insurance in states that do not establish their own ACA Marketplace and instead rely on a Federally-facilitated or Partnership Marketplace. In 2015, roughly 7.5 million people who have signed up for coverage in the 34 states that use the federal Marketplace qualify for subsidies, or 87 percent of all people who picked a plan in such states.

The new Policy Insight, Insurance Markets in a Post-King World, explains that a Court decision to cut off such subsidies would cause millions to go without coverage, make the vast majority of consumers who were receiving subsidies exempt from the ACA’s individual mandate, and disrupt insurance markets by leaving insurers with a sicker pool of people to cover and limited ability to generate enough premium revenue to cover health costs. In some cases, insurers may choose to exit the individual market in affected states rather than face significant losses, according to the analysis.  Governors, state legislatures and Congress would face pressure to take steps to preserve subsidies, but there are political and logistical challenges to doing so quickly.

The issue brief, Are Premium Subsidies Available in States with a Federally-run Marketplace? A Guide to the Supreme Court Argument in King v. Burwell, walks through legal aspects of the case, from who the plaintiffs are to what each side is seeking from the Court and how this legal challenge differs from other ACA cases already decided by the Court. It also explains the legal test that the justices are likely to apply in the case and the potential actions the Court could take.

For more on health reform and the King v. Burwell case, visit kff.org.


Are Premium Subsidies Available in States with a Federally-run Marketplace? A Guide to the Supreme Court Argument in King v. Burwell

Author: MaryBeth Musumeci
Published: Feb 25, 2015

On March 4, 2015, the Supreme Court will hear oral argument in King v. Burwell, a case challenging the availability of the Affordable Care Act’s (ACA) premium subsidies in states with a Federally-run Marketplace (including states with a Federally-facilitated Marketplace (FFM) and states with a Partnership Marketplace). In addition to expanding eligibility for Medicaid, the ACA increases access to affordable health insurance and reduces the number of uninsured by providing for the establishment of Marketplaces that offer qualified health plans and administer premium subsidies and cost-sharing reductions to make coverage affordable. The King v. Burwell petitioners are challenging the legality of the IRS regulation allowing premium subsidies in states with a Federally-run Marketplace as contrary to the language of the ACA. This issue brief examines the major questions raised by the King case, explains the parties’ legal arguments, and considers the potential effects of a Supreme Court decision.

Background

The ACA’s subsidy provisions are the central mechanism through which the law helps to make coverage affordable to individuals who purchase insurance on a Marketplace. The law provides for advance payment of premium tax credits for people with incomes between 100-400% of the federal poverty level (FPL, $11,770-$47,080 for an individual in 2015) and cost-sharing reductions for people with incomes from 100-250% FPL ($11,770-$29,425 per year for an individual in 2015). In 2015, 87% of people who selected a plan in states with a Federally-run Marketplace received premium subsidies to make their coverage affordable (Figure 1).

Figure 1: Share of People Who Selected a Marketplace Plan and Receive Premium Subsidies in States with a Federally-run Marketplace, as of February 15, 2015

The law gives states the option to establish their own Marketplaces. A few states presently are operating federally-supported State-based Marketplaces. If states do not elect to establish their own Marketplace, the ACA provides for an FFM as a default so that Marketplaces are available in each state. States also have the option to operate a Marketplace in partnership with the federal government by assuming control over health plan management and/or consumer assistance functions. The Marketplace type in each state in 2015 is illustrated in Figure 2.

Figure 2: State Health Insurance Marketplace Types, 2015

In its implementing regulations, the IRS interpreted the ACA to authorize premium subsidies for individuals who purchase coverage on all Marketplaces, including in states with a Federally-run Marketplace. The IRS rule provides that premium subsidies are available to anyone enrolled in a qualified health plan through a Marketplace and then adopts by cross-reference a U.S. Department of Health and Human Services (HHS) definition of “Marketplace” (formerly called “Exchange”) that includes any Marketplace, regardless of whether the Marketplace is State-based or Federally-run.

In addition to the subsidy provisions described above, the ACA contains private insurance market reforms, including the guaranteed issue provision, which prevents health insurers from denying coverage to people for any reason, such as pre-existing conditions, and the community rating provision, which allows health plans to vary premiums based only on age, geographic area, tobacco use, and number of family members, thereby prohibiting plans from charging higher premiums based on factors such as health status or gender. The ACA’s individual mandate requires most people to maintain a certain level of health insurance for themselves and their tax dependents in each month beginning in 2014, or pay a tax. The Congressional authors of the ACA believed that without the individual mandate and the subsidy provisions, the Marketplaces would not work effectively due to the effects of adverse selection when healthy people otherwise would choose to forego insurance.

While the ACA’s individual mandate requires most Americans to have insurance or pay a tax, certain people are exempt from the tax, including those whose annual insurance premiums would exceed eight percent of their household adjusted gross income. The ACA’s premium subsidies lower the cost of insurance for individuals and thereby subject more people to the tax for failing to satisfy the individual mandate if they do not purchase the affordable coverage available to them through the Marketplace.

The ACA also requires larger employers to offer insurance, known as the employer mandate, or pay a tax. The applicability of the employer mandate also is dependent on the premium subsidies because the associated tax is triggered when one of an employer’s full-time workers receives a Marketplace premium subsidy. If there are no subsidies, then an employer never would be subject to the tax for failure to comply with the employer mandate.

Key Questions

1.  Who are the parties challenging the IRS rule?

The King petitioners are four individuals who do not want to purchase insurance in Virginia, an FFM state. They alleged that the cost of the least expensive unsubsidized Marketplace plan available to them would exceed eight percent of their anticipated 2014 income, thereby making them exempt from the ACA’s tax for failing to comply with the individual mandate. Premium subsidies reduce the cost of Marketplace coverage, making coverage affordable to the petitioners within the meaning of the ACA and requiring them to either comply with the individual mandate or pay the associated tax.

Similar cases challenging the IRS rule (described below) involve individuals who do not wish to purchase insurance as well as employers who do not want to pay the tax if their employees qualify for premium subsidies in states with Federally-run Marketplaces, including some private companies and the states of Indiana and Oklahoma. To illustrate the effect of the ACA’s premium subsidies, the DC Circuit Court of Appeals provided an example of one individual’s circumstances in the case before it: a West Virginia resident expected to earn $20,000 in 2014. Without premium subsidies, Marketplace coverage would exceed eight percent of his annual income ($1,600). With subsidies, he must purchase coverage at a cost of less than $21 per year or pay the tax for failure to satisfy the individual mandate.

2.  What do the King petitioners want from the Supreme Court?

The petitioners want the Court to strike down the IRS regulation making subsidies available to individuals who purchase health plans in a state with a Federally-run Marketplace. They argue that the IRS lacks authority to issue this rule because, they contend, the ACA’s language is clear that these subsidies only are available in State-based Marketplaces. The controversy lies in the wording of an ACA provision that amends § 36B of the Internal Revenue Code: “the premium subsidy amount” is based on the cost of a “qualified health plan. . . enrolled in through [a Marketplace] established by the State under § 1311 of the [ACA].” The petitioners argue that a Federally-run Marketplace is not a Marketplace “established by the State,” and therefore the IRS has exceeded the authority delegated to it by Congress to make rules implementing the ACA. Relevant parts of the statute are excerpted in Table 1.

Table 1: Selected ACA Provisions Relevant to King v. Burwell
CitationStatutory Language
ACA § 1311[42 U.S.C. § 18031(b)(1)]“Each State shall, not later than January 1, 2014, establish [a Marketplace].”
ACA § 1321[42 U.S.C. § 18041(c)(1)]If a state does not establish a Marketplace, HHS “shall establish and operate such [Marketplace] within the State.”
26 U.S.C. § 36B(b)(2)(A) and (c)(2)(A)“[T]he premium subsidy amount” is based on the cost of a “qualified health plan. . . enrolled in through [a Marketplace] established by the State under § 1311.”
NOTE: While the ACA uses the term “Exchange,” the term currently used is “Marketplace.”

3.  What does the federal government want from the Supreme Court?

The respondents in King v. Burwell are federal agencies charged with implementing the ACA: HHS, the Treasury Department, and the Internal Revenue Service. The federal government wants the Court to uphold the IRS’s regulation making subsidies available in states with a Federally-run Marketplace. The federal government argues that the IRS rule is consistent with what it contends is the clear language of the ACA because a Marketplace “established by the State” also means one established by HHS standing in as a surrogate for the State. Section 1321 of the ACA directs the HHS Secretary to establish “such [Marketplace]” if a state does not create its own, and the government contends that “such [Marketplace]” is understood to be “[a Marketplace] established by the State under § 1311” (see Table 1). The government also argues that the provision authorizing premium subsidies needs to be read in the context of the whole ACA, and when looked at in its entirety, it is clear that Congress intended premium subsidies to be available to people in all states, regardless of whether the state has established its own Marketplace. While most of the government’s brief focuses on its argument that the ACA clearly authorizes subsidies in state with a Federally-run Marketplace, the government also argues that if the wording is ambiguous, then the Court should defer to the IRS’s interpretation of the statute

4.  Do the King petitioners have standing to challenge the IRS rule?

To bring a lawsuit, petitioners must have legal “standing,” meaning that they actually will be harmed by the action they are challenging, and the court has the ability to order relief that will remedy the harm. Some recent news reports have questioned whether the King petitioners are in fact eligible for Marketplace subsidies and therefore whether they are legally able to challenge the IRS rule. For example, these reports allege that two of the plaintiffs may be eligible for veterans’ health coverage, which would make them ineligible for Marketplace subsidies, and another plaintiff’s actual 2014 income may have been too low to qualify for Marketplace subsidies, which start at 100% FPL. The lower courts allowed the case to proceed, and the parties’ Supreme Court briefs do not address petitioners’ standing. While the Supreme Court could raise the issue of standing, it has not ordered supplemental briefing on the question to date.

5.  What did the lower courts decide in King v. Burwell and similar cases challenging the IRS rule?

In King v. Burwell, the 4th Circuit Court of Appeals unanimously upheld the IRS’s regulation providing for premium subsidies in states with a Federally-run Marketplace. The 4th Circuit observed that the ACA provision about the availability of Marketplace premium subsidies cannot be read in isolation from the rest of the statute. The 4th Circuit ruled that the ACA’s language on this point is ambiguous and therefore the IRS has the authority to reasonably interpret the ACA. The 4th Circuit also found that the IRS’s interpretation is based on a permissible construction of the statute and furthers the ACA’s broad policy goals of increasing coverage and making coverage more affordable.

On the same day as the 4th Circuit’s King decision, the DC Circuit Court of Appeals in a 2:1 decision held that the language of the ACA is clear that premium subsidies only can be provided for individuals enrolled in State-based Marketplaces. The DC Circuit found that the IRS rule contradicts the unambiguous wording of the ACA, and therefore the IRS overstepped its authority by allowing premium subsidies in states with a Federally-run Marketplace. The DC Circuit observed that when the language of a statute is clear, both the courts and administrative agencies must defer to the statute’s plain meaning. The DC Circuit also concluded that the ACA’s other provisions can continue to work without the availability of premium subsidies in states with a Federally-run Marketplace. The DC Circuit subsequently set aside its decision and announced that the entire court would rehear the case, but the rehearing was put on hold after the Supreme Court agreed to decide King.

A federal district court in Oklahoma struck down the IRS rule; the federal government’s appeal to the 10th Circuit Court of Appeals in that case is on hold pending the Supreme Court’s decision in King. Another case challenging the IRS rule is pending decision in a federal district court in Indiana.

6.  Who else has weighed in on the Supreme Court arguments?

A number of amicus (“friend of the court”) briefs have been filed in support of both sides of the argument at the Supreme Court. These include members of Congress, former federal government officials, health care provider organizations, advocacy organizations, economists, and health policy and legal scholars, among others. Twenty-three states (including DC) filed an amicus brief supporting the IRS rule, and seven states filed amicus briefs challenging the IRS rule.

Among the states supporting the IRS rule, 11 have a State-based Marketplace (California, Connecticut, DC, Hawaii, Kentucky, Maryland, Massachusetts, New York, Rhode Island, Vermont and Washington), six states have an FFM (Maine, Mississippi, North Carolina, North Dakota, Pennsylvania, and Virginia), 4 states have a Partnership Marketplace (Delaware, Illinois, Iowa, and New Hampshire), and 2 states have a Federally-supported State-based Marketplace (New Mexico and Oregon) in 2015. Among the states challenging the IRS rule, six have an FFM (Alabama, Georgia, Indiana, Nebraska, Oklahoma, and South Carolina) and one has a Partnership Marketplace (West Virginia) in 2015 (Figure 2).

Administrative agencies have no inherent authority; because they are created by Congress, they only can act within the scope of authority delegated to them by statute. When determining whether an administrative agency’s action is valid, the Court traditionally uses a two part analysis. First, the Court asks whether the statutory language used by Congress clearly authorizes the rule issued by the agency. If the statute is clear, then Congress’s language must be followed. If the Court determines that the statutory language is ambiguous, the Court then asks whether the agency’s rule is a permissible exercise of its discretion. If the agency’s interpretation of an ambiguous statute is reasonably within its discretion, then the Court defers to the agency’s rule.

Figure 3: Legal Analysis in King v. Burwell

Both the petitioners and the federal government focus the majority of the arguments in their Supreme Court briefs on the first part of the legal analysis. The petitioners contend that the ACA is clear that subsidies are available only in State-based Marketplaces, while the federal government contends that the ACA is clear that subsidies are available in all Marketplaces including states with a Federally-run Marketplace. In the second part of the legal analysis, the petitioners argue that deference to the IRS’s interpretation of the statute is inappropriate, while the federal government argues that the Court should defer to the IRS’s rule. The two step legal analysis is illustrated in Figure 3, and the parties’ arguments on each issue as presented in their Supreme Court briefs are summarized in Table 2.

Table 2: Summary of Arguments About the Legality of the IRS Rule Authorizing Marketplace Premium Subsidies
IssuePosition of PetitionersPosition of Federal Government
Does the ACA clearly authorize subsidies in states with a Federally-run Marketplace?No, the ACA’s language is clear that subsidies are available only in State-based Marketplaces. Yes, the ACA’s language is clear that subsidies are available in all Marketplaces, including states with a Federally-run Marketplace.
What’s the meaning of the ACA provision that refers to a “[Marketplace] established by the State”? A Federally-run Marketplace is established by HHS, so “[Marketplace] established by the State” clearly excludes states with a Federally-run Marketplace. If Congress wanted both to be treated the same, it would have said so expressly.   Instead, Congress distinctly referred to two entities that would create Marketplaces.“[Marketplace] established by the State” is a statutory term of art that includes both State-based and Federally-run Marketplaces. It identifies the Marketplace for a particular state rather than substantively limiting the type of Marketplace. The ACA provides for a Federally-run Marketplace as an alternative way to fulfill the requirement that each state have a Marketplace because Congress could not require states to establish Marketplaces.
What’s the meaning of the ACA provision referring to “such [Marketplace]”? “[S]uch [Marketplace]” means that HHS is to establish the same type of Marketplace as a state would, but subsidies turn not on the type of Marketplace but who established it. HHS is directed to establish a Marketplace “within” a state, not on its behalf.“[S]uch [Marketplace]” means the Marketplace required by the ACA, one that the federal government establishes as a statutory surrogate for a state. Because of the Marketplaces’ central role in administering subsidies, a Marketplace without subsidies would not be a “Marketplace” within the meaning of the ACA.
What about reading the provision authorizing subsidies in the context of the entire statute?Congress could have deemed a Federally-run Marketplace to be “established by the State” for subsidy purposes, but it did not do so expressly. Section 36B, which contains the “[Marketplace] established by the State” language, is the only provision that defines subsidies.The statutory provisions cross-reference each other and must be read together. A Federally-run Marketplace could not function like a State-based Marketplace as Congress intended if subsidies were unavailable. The ACA specifically requires Federally-run Marketplaces to report on subsidies. If a Federally-run Marketplace was not the same as a State-based Marketplace, Federally-run Marketplaces would have no customers because the ACA provides that people eligible to shop on a Marketplace must “reside in the State that established the [Marketplace].”
What about achieving the ACA’s overall purpose?   Limiting subsidies to State-based Marketplaces incentivizes states to establish their own Marketplaces. Congress wanted to accomplish this goal in addition to providing subsidies nationwide.Subsidies are essential to ensuring that the ACA’s nationwide insurance market reform and individual mandate provisions function.   All of these provisions were designed to work together. Congress would not have provided for Federally-run Marketplaces that would fail and would not limit subsidies to State-based Marketplaces without giving states clear notice. Subsidies are provided to individuals, not to states.
Should the Court defer to the IRS rule authorizing subsidies in a Federally-run Marketplace?No, the Court should not defer to the IRS rule.   Congress never would have delegated such an important decision to an agency. Congressional authorization of tax credits must be unambiguous. The language providing for subsidies (§ 36B) is clear, and the IRS has no authority to interpret other sections of the ACA that are within the jurisdiction of HHS (e.g., § 1321).Yes, the Court should defer to the IRS rule. The agency acted within the scope of its authority delegated by Congress.

8.  How is King v. Burwell different from the other ACA cases already decided by the Supreme Court?

The Supreme Court already has decided two cases about the ACA in prior terms. In National Federation of Independent Business v. Sebelius, the Supreme Court upheld the constitutionality of the ACA’s individual mandate but effectively made the Medicaid expansion a state option. In Hobby Lobby v. Burwell, the Supreme Court ruled that closely held for-profit corporations do not have to comply with the ACA’s contraceptive coverage requirement in their employee health plan benefit packages if their owners have religious objections. A series of lawsuits filed by religiously affiliated nonprofit employers challenging the ACA’s contraceptive coverage requirement remain pending in the lower federal courts and may be reviewed by the Supreme Court in a future term.

In King v. Burwell, the Court will determine whether the IRS has the legal authority from Congress to interpret the law as it did in issuing its regulation implementing the ACA’s premium tax subsidies in all Marketplaces. While invalidation of the IRS regulation could have significant policy implications for how the ACA’s Marketplaces work in states with a Federally-run Marketplace (discussed below), King is not a constitutional challenge to the ACA, and the Court’s decision will not strike down other parts of the law. In addition, the King case focuses on the ACA’s Marketplace subsidies and will not affect the ACA’s Medicaid expansion provisions.

9.  What are the implications if the Supreme Court rules for the federal government?

If the Court upholds the IRS rule, subsidies will continue to be administered through all Marketplaces. Despite the lower court decisions to date, the IRS rule authorizing premium subsidies in all Marketplaces remains in effect, and premium subsidies currently remain available for all individuals regardless of whether they enroll in a plan in a State-based Marketplace or in a state with a Federally-run Marketplace.

10.  What are the implications if the Supreme Court rules for the petitioners?

The Court’s decision about the availability of premium subsidies in states with a Federally-run Marketplace could affect the number of people who ultimately have access to affordable coverage under the ACA. As of 2015, 14 states (including DC) have elected to set up their own Marketplaces and three states have a federally-supported State-based Marketplace; the remaining 34 states could be affected by the King decision, including 7 states with a Partnership Marketplace, and 27 states presently relying on an FFM (Figure 2).

If the IRS rule is overturned by the Court, people in the 27 states presently relying on an FFM and the seven states with a Partnership Marketplace would lose access to subsidies. Nearly 7.5 million people who selected a plan to date for 2015 in a state with an FFM or Partnership Marketplace qualified for premium subsidies (Figure 1), and it is estimated that over 12.5 million people are eligible for premium subsidies in states with an FFM or Partnership Marketplace. Without premium assistance, the vast majority of these enrollees would likely drop their coverage because they could not afford the unsubsidized cost, resulting in severe and perhaps fatal disruption to the individual insurance markets in these states.

Overturning the IRS rule also would essentially nullify the requirement that large employers offer coverage to full-time employees in these states. The penalty associated with the employer mandate is triggered when a full-time employee is not offered employer-sponsored coverage and qualifies for a Marketplace premium or cost-sharing subsidy. If Marketplace subsidies are unavailable in states with a Federally-run Marketplace, the penalty against a large employer that does not offer coverage cannot be triggered.

Looking Ahead

The Court will hear oral argument in King v. Burwell on March 4, 2015, and a decision is expected by the end of the current term in June 2015. The case will give the Court an opportunity to closely examine the language that Congress used when enacting the ACA. The fact that there is not universal agreement about whether subsidies are authorized in states with a Federally-run Marketplace could portend a finding that the statutory language is ambiguous. Or, a majority of the Court could conclude that the statute is clear. If the IRS rule is invalidated, millions of people who obtained affordable coverage under the ACA in states with a Federally-run Marketplace will be at risk of becoming uninsured without further action on the part of federal and state policymakers. For this reason, many people around the country will be awaiting the Supreme Court’s determination about the meaning of this provision of the ACA.

Insurance Markets in a Post-King World

Authors: Larry Levitt and Gary Claxton
Published: Feb 25, 2015

The Supreme Court is considering a case – King v. Burwell – that challenges the legality of premium and cost-sharing subsidies for low- and middle-income people buying insurance in states where the federal government rather than the state is operating the marketplace under the Affordable Care Act (ACA).

This perspective addresses how insurance markets might respond if the Court sides with the plaintiffs. More on the legal issues in the case can be found here.

The immediate effect of a Court decision in favor of the plaintiff would be to cut off subsidies in affected states, which could happen within a month of the decision. Currently, in 34 states the federal government is operating the health insurance marketplace, including 7 states where the state is performing some functions. Fourteen states are fully operating state-based marketplaces. And, an additional 3 states – Oregon, New Mexico, and Nevada — are approved as state-based marketplaces but are using healthcare.gov to handle subsidy eligibility and enrollment. These 3 states, which are referred to as Federally-supported State-based Marketplaces, could potentially continue to provide subsidies. In the 34 federal marketplace states, 7.5 million people had signed up for coverage for 2015 as of mid-February and qualified for a subsidy. That figure is expected to ramp up significantly in the next year, assuming the Court does not invalidate the subsidies.

People receiving subsidies make up 87% of those who have signed up for coverage for 2015 in states using the federal marketplace. For the vast majority of them, coverage would be unaffordable without the subsidies. The subsidies average $268 monthly per person and cover 72% of the premium, leaving enrollees to pay for 28% of the premium (or an average of $105 per month). With the subsidies eliminated, those who had been receiving them would face an increase in their out-of-pocket premiums averaging 256%.

To encourage healthy people to buy coverage, the ACA includes not only a “carrot” in the form of subsidies but also a “stick” through the individual mandate. A Court decision to cut off the subsidies would eliminate the carrot and severely weaken the stick. The ACA exempts someone from the individual mandate if the lowest-cost insurance available would cost in excess of 8% of income. With subsidies available, less than 3% of uninsured people eligible for subsidies would be exempt. However, if the subsidies are invalidated, we estimate that 83% of those formerly subsidy-eligible uninsured people would end up being exempt from the individual mandate.

As a result, the elimination of the subsidies would destabilize the individual insurance markets in states not running their own marketplaces. Under the ACA, insurers would still be required to guarantee access to coverage irrespective of health status and prohibited from charging sick people more than healthy people. Even without the subsidies, many people who are sick would likely find a way to maintain their insurance in the face of substantial premium increases. However, people who are healthy would likely drop their insurance.

Insurers in the affected states would immediately find themselves in a situation where premiums revenues were insufficient to cover the health care expenses of the remaining enrollees, who would be far sicker on average than what insurers assumed when they set their premiums for 2015. This would trigger a classic adverse selection “death spiral,” where insurers would seek very large premium increases, which in turn would cause the healthier of the remaining enrollees to drop coverage.

These effects would occur for all ACA-compliant individual insurance products both inside and outside of the marketplaces in affected states because insurers are required to pool all of their individual enrollees when establishing premiums.

It is somewhat unclear how quickly insurers could respond by increasing premiums. Under ACA regulations, premiums for insurance sold inside the marketplaces are locked in for a full calendar year. So, the earliest those premiums could change would be January 1, 2016, though even that would be tricky since insurers will have already submitted proposed 2016 premiums to state insurance departments by the time the Court issues a decision. Depending on state laws, premiums for products sold outside of the marketplaces could potentially be increased more quickly. And even if insurers could adjust rates, establishing stable and sustainable premium levels in this type of environment is extremely difficult, because as rates move higher, more of the relatively healthy enrollees drop their coverage.

Because this may all happen very quickly, it is possible that many or all insurers would choose to exit the individual markets in these states rather than facing significant losses in a quickly shrinking market. Insurers that remain in the market risk being one of the only carriers continuing to guarantee access to coverage to people in poor health (since people who lose coverage from exiting insurers have special enrollment periods to choose new coverage). Leaving the market would not be an easy decision for insurers since many are counting on the marketplaces as an important source of future enrollment growth. And, under federal law, they could not re-enter the individual market for five years. Their decision of whether to stick it out would depend in part on whether they believe that policy solutions that would establish a growing and healthy market were likely in the near future. While some large insurers might be willing to withstand losses for a short period, no insurer will want to cover a significant number of people with high health needs, particularly in a regulated market, out of fear that they may be pressured to sustain the coverage at inadequate premium levels.

Some have suggested that states or Congress could take action to preserve or substitute for the existing premiums subsidies and thereby avoid severe market disruption.

Some governors and state legislatures would likely decline to establish marketplaces because they are opposed to the ACA and do not want to be involved in its implementation. Other states would want to act to keep subsidies flowing and maintain stable insurance markets. For example, seven states are operating marketplaces in partnership with the federal government, already performing some of the necessary functions. In addition, 29 states (including the District of Columbia) have chosen to expand Medicaid under the ACA, suggesting that the political environments in those states may be more amenable to participating in elements of the ACA.

However, even in states that want to act, there are logistical challenges to doing so quickly. Depending on state laws, beginning the process of establishing a marketplace would take either an executive order by the governor or, more likely, state legislative action. A state would then have to create an administrative apparatus to fulfill marketplace functions, including putting in place a governance structure, contracting with plans, running a consumer call center, issuing outreach grants, and setting up a subsidy eligibility and enrollment system (no doubt the most difficult task). It took existing state-based marketplaces several years to put the necessary infrastructure into place, and they were able to access federal start-up grants that are no longer available, so states would have to cover the initial administrative expenses.

Implementation would be eased if states could make use of the federal government’s healthcare.gov technology. While state marketplaces are not permitted under the ACA to contract with the federal government, there are likely a variety of alternative ways in which state marketplaces could use healthcare.gov. For example, three states – Oregon, New Mexico, and Nevada – have federal approval to operate as state-based marketplaces even though subsidy eligibility and enrollment are handled through healthcare.gov. In fact, the ACA requires the Secretary of Health and Human Services to establish a system for determining eligibility for advance premium tax credits, not necessarily the marketplaces themselves.

But, even in the somewhat optimistic scenario that all these pieces fell neatly into place in many states, it would likely take months if not a year or more for state marketplaces to be up and running. Insurers may be reluctant to sustain losses for such a long period and might instead choose to exit the market, gambling that states or the federal government would find a way around the five-year ban for reentry. After all, state marketplaces would need insurers in order to be effective.

Congress could also act to preserve subsidies permanently. That could be accomplished by specifying that subsidies are available in marketplaces operated either by the federal government or states, though it is unlikely that Congressional opponents of the ACA would agree to do so without other changes to the law. And, it is difficult to imagine that negotiations over those changes both within Congress and with the President could happen quickly enough to prevent insurance market disruption.

One approach that has been suggested to address the timing issue is to extend the subsidies in affected states for a defined period, giving Congress time to consider alternative approaches and states time to begin the process of setting up marketplaces if they so choose. Such an extension would have to be put in place quickly to convince enrollees and insurers that a viable system will remain in place. And, given the logistical challenges in the states and the complexity involved in altering the law, subsidies would have to be extended for a significant period of time to permit a seamless transition and avoid disruption. In some ways, there may be a mismatch between the speed at which policy can respond and the speed at which it would need to respond to maintain stability in the insurance market.