KFF designs, conducts and analyzes original public opinion and survey research on Americans’ attitudes, knowledge, and experiences with the health care system to help amplify the public’s voice in major national debates.
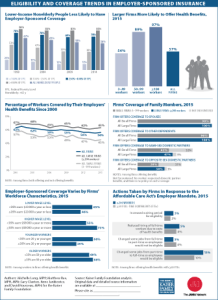
This Visualizing Health Policy infographic looks at eligibility and coverage trends in employer-sponsored health insurance. Between 2000 and 2015, the share of workers covered by health benefits offered by their employers dropped from 63 percent to 56 percent, with some firms not offering coverage and some employees not enrolling when coverage is offered. The biggest decrease occurred among employees working for small firms (3-199 workers). Among people younger than 65, those with lower incomes continued to be less likely to have coverage from an employer-sponsored health plan, as has been the trend since 1999. In 2015, larger firms were more likely than smaller ones to offer health benefits, as were organizations with more higher-wage employees, fewer lower-wage employees, and fewer workers younger than 26. Most large employers offered coverage to spouses and other dependents, while fewer than half of these firms offered coverage to same-sex or opposite-sex domestic partners. Few firms took action in 2015 in response to the Affordable Care Act’s employer mandate, including changing some jobs from part-time to full-time so employees would be eligible for coverage.
Most Americans Say Federal and State Governments Are Not Doing Enough to Combat Prescription Painkiller and Heroin Abuse; Large Majorities Believe Wide Range of Strategies Would be Effective
More Than Four in Ten Know Someone Who Has Been Addicted; One in Five a Family Member; One in Five Americans Say a Family Member Did Not Get Needed Mental Health Care; Cost and Coverage Often Factors
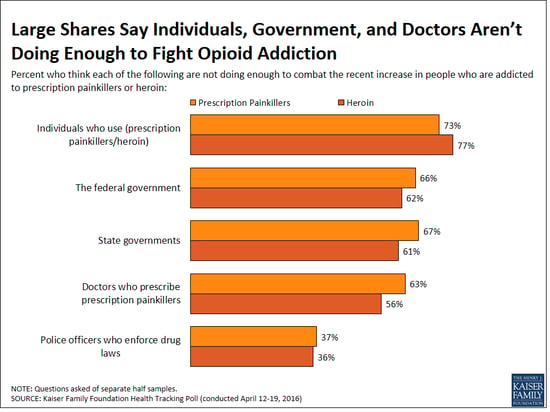
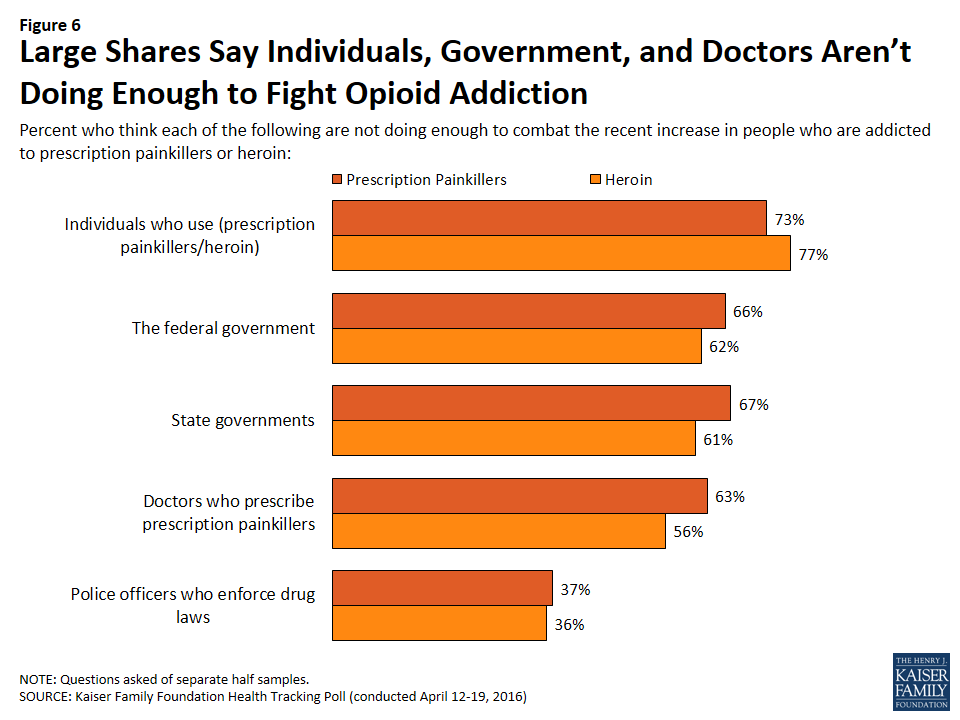
As the White House and Congress continue to debate new funding and other actions to address the nation’s opioid epidemic, the latest Kaiser Health Tracking Poll finds that most Americans believe the federal government is not doing enough to combat the recent increases in the number of people who are addicted to prescription painkillers (66%) or heroin (62%).
State governments fare no better in the public’s view, with similarly large shares saying they aren’t doing enough to combat the twin problems of painkiller abuse (67%) and heroin abuse (61%). Majorities say the same about doctors who prescribe prescription painkillers (63% and 56%, respectively), and individuals who use prescription painkillers or heroin (73% and 77%, respectively). Far fewer say police officers are not doing enough to combat painkiller abuse (37%) and heroin abuse (36%).
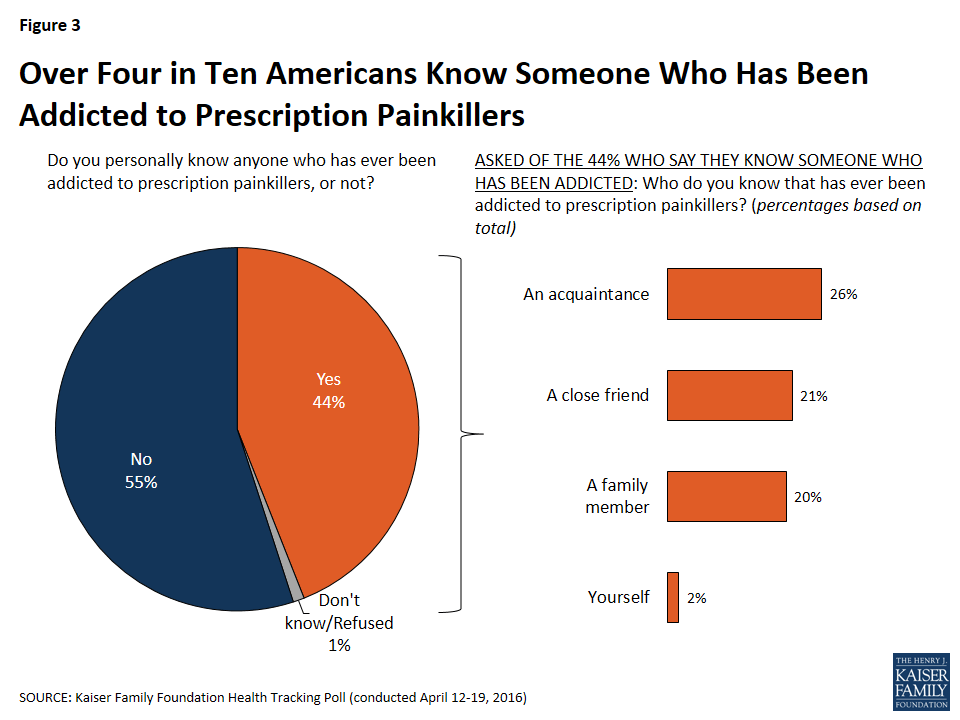
Prescription drug addiction also impacts much of the public on a personal level, with 44 percent saying they personally know someone who has been addicted to prescription painkillers, including 20 percent who say the person was a family member and 2 percent who say they themselves were addicted.
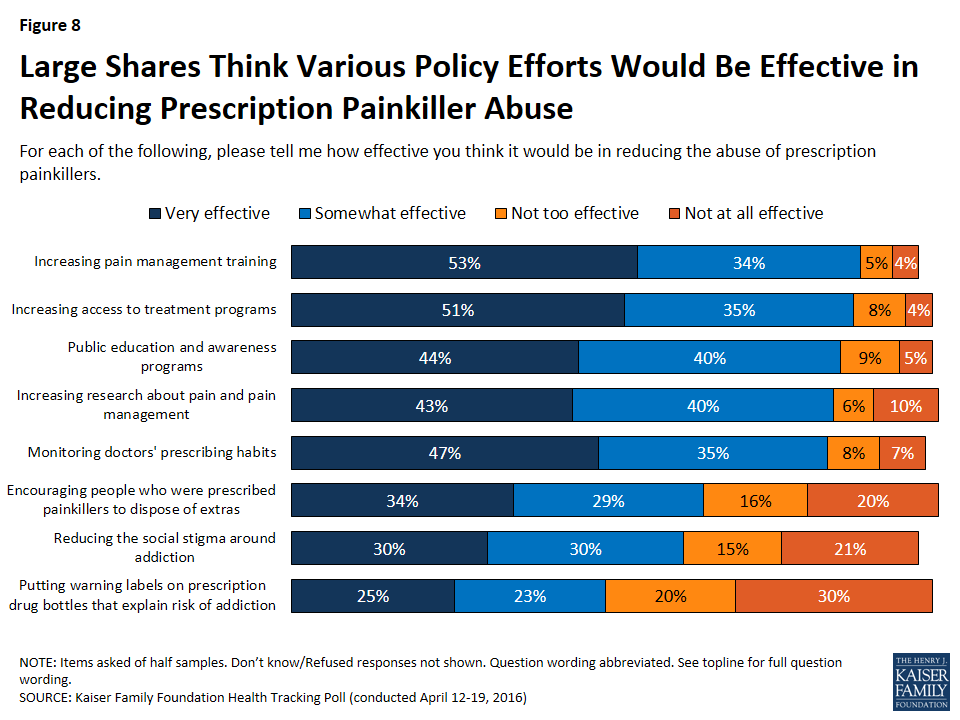
When asked about the potential effectiveness of various policy actions, over eight in ten Americans rate five strategies as “very” or “somewhat” effective: increasing pain management training for medical students and doctors (88%); increasing access to addiction treatment programs (86%); public education and awareness programs (84%); increasing research about pain and pain management (83%); and monitoring doctors’ prescription painkiller prescribing habits (82%).
Smaller shares say three other strategies would be at least somewhat effective: encouraging people who are prescribed painkillers to dispose of any extras once they are no longer needed (63%); reducing the social stigma around addiction (60%), and putting warning labels on prescription bottles that explain the risk of addiction (49%).
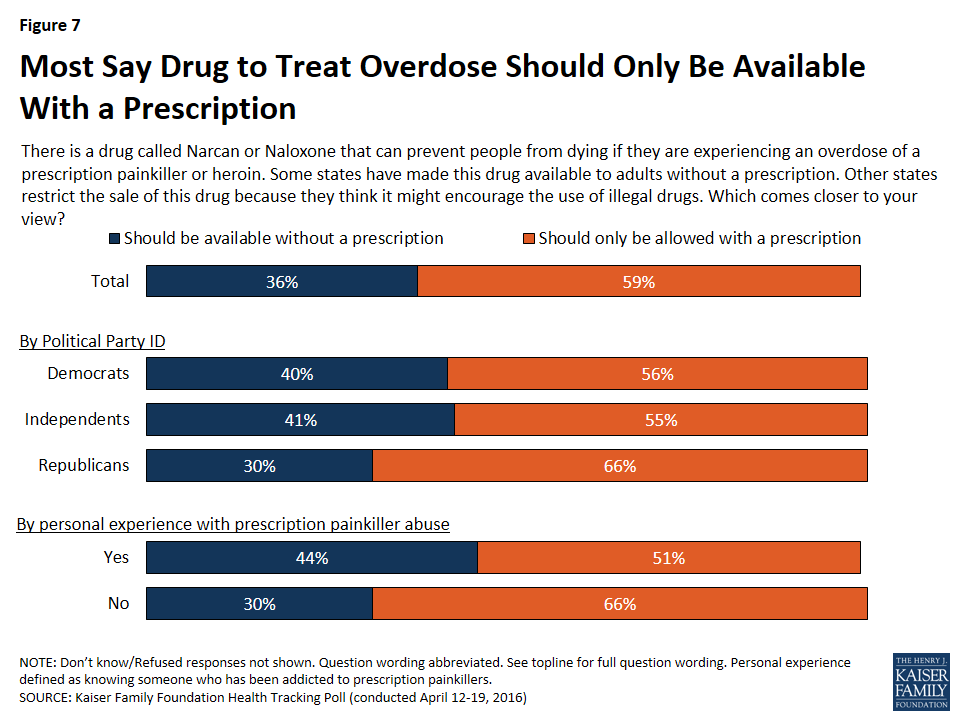
The poll also assesses the public’s views on expanding access to a drug (called Narcan or Naloxone) that can prevent people from dying if they experience an overdose of painkillers or heroin. Most Americans (59%) say the drug should only be available with a doctor’s prescription, while just more than a third (36%) say it should available without one.
The poll also assesses the public’s experiences and views involving access to mental health services.
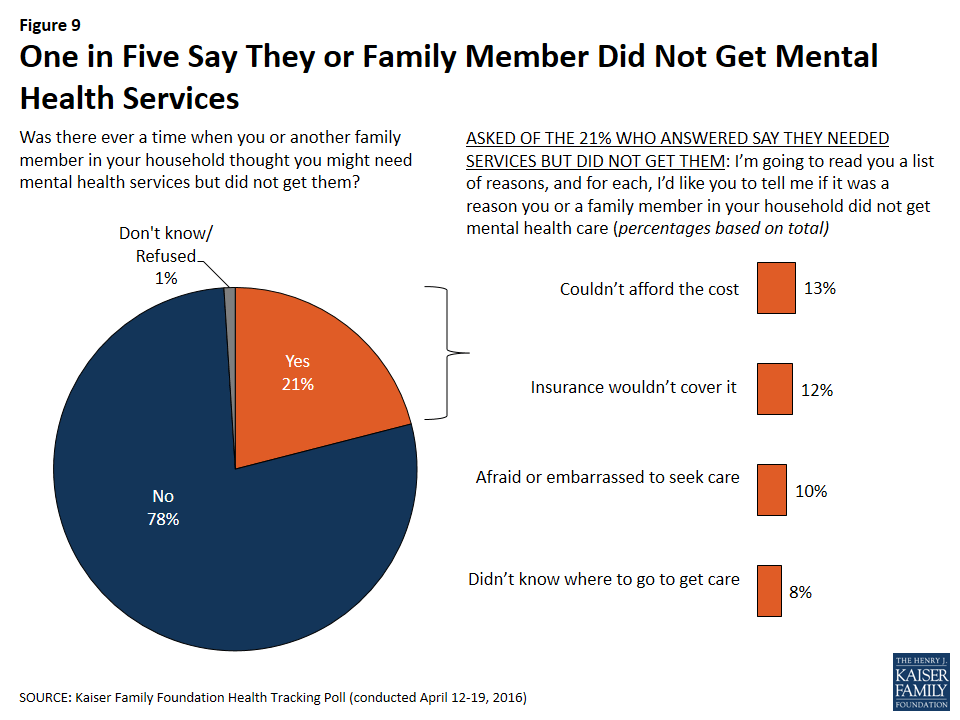
One in five Americans (21%) say that they or someone in their immediate family once needed mental health services but did not get them. Those who did not get treatment cite several factors, including that they couldn’t afford the cost (13% of the public overall); insurance wouldn’t cover it (12%); they were afraid or embarrassed to seek care (10%); and they didn’t know where to go to get care (8%).
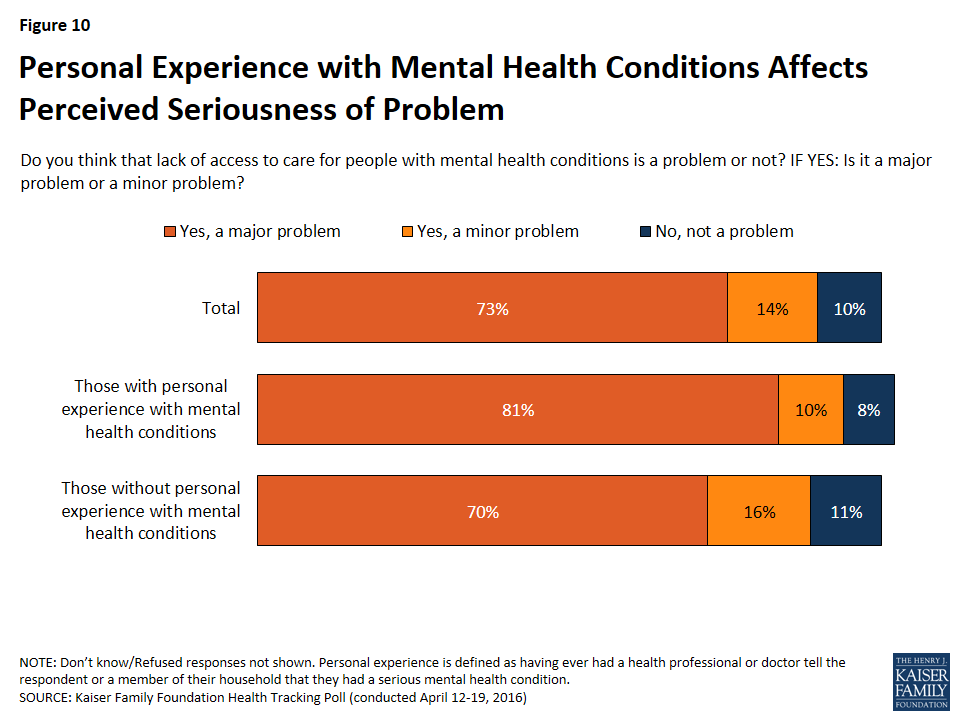
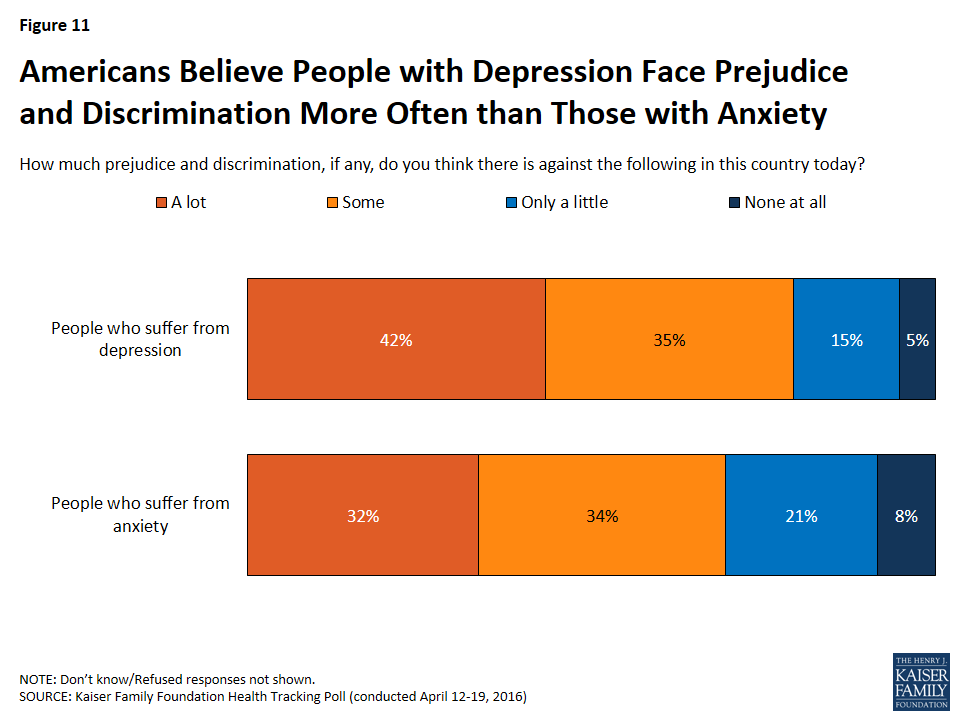
The vast majority of the public (87%) say that the lack of access to care for people with mental health conditions is a problem, including almost three quarters (73%) who say it is a major problem. Substantial shares also think that people suffering from mental health conditions experience “a lot” of prejudice and discrimination, including about four in 10 (42%) who say so about people who suffer from depression and about a third (32%) who say so about people who suffer from anxiety.
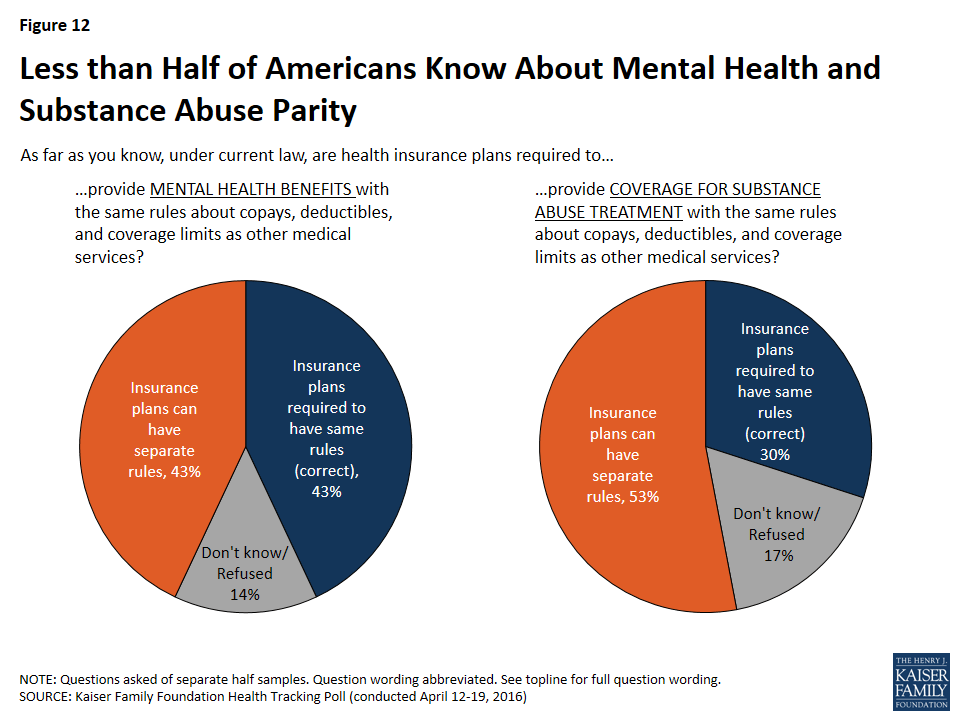
Most people also are not aware of federal requirements that insurance plans apply the same set of rules for mental health benefits and substance abuse treatment as for other medical services in terms of copays, deductibles and coverage limits. About four in 10 (43%) know that health plans must have the same rules for mental health benefits; three in 10 (30%) know this for substance abuse treatment.
Designed and analyzed by public opinion researchers at the Kaiser Family Foundation, the poll was conducted from April 12-19 among a nationally representative random digit dial telephone sample of 1,201 adults. Interviews were conducted in English and Spanish by landline (420) and cell phone (781). The margin of sampling error is plus or minus 3 percentage points for the full sample. For results based on subgroups, the margin of sampling error may be higher.
In his latest column for The Wall Street Journal’s Think Tank, Drew Altman discusses how the debate between Hillary Clinton and Bernie Sanders about how to get to universal coverage has generated more support among Democrats for expanding the Affordable Care Act (and less support for the law as is).
In the wake of the lead crisis affecting drinking water in Flint, Mich., the public now ranks contaminated drinking water among the most serious national health issues, trailing cancer, according to the April Kaiser Health Tracking Poll.
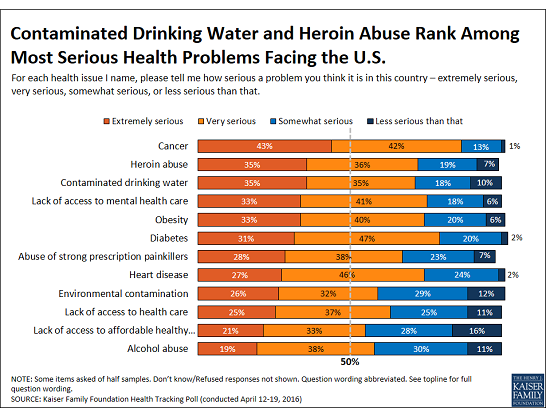
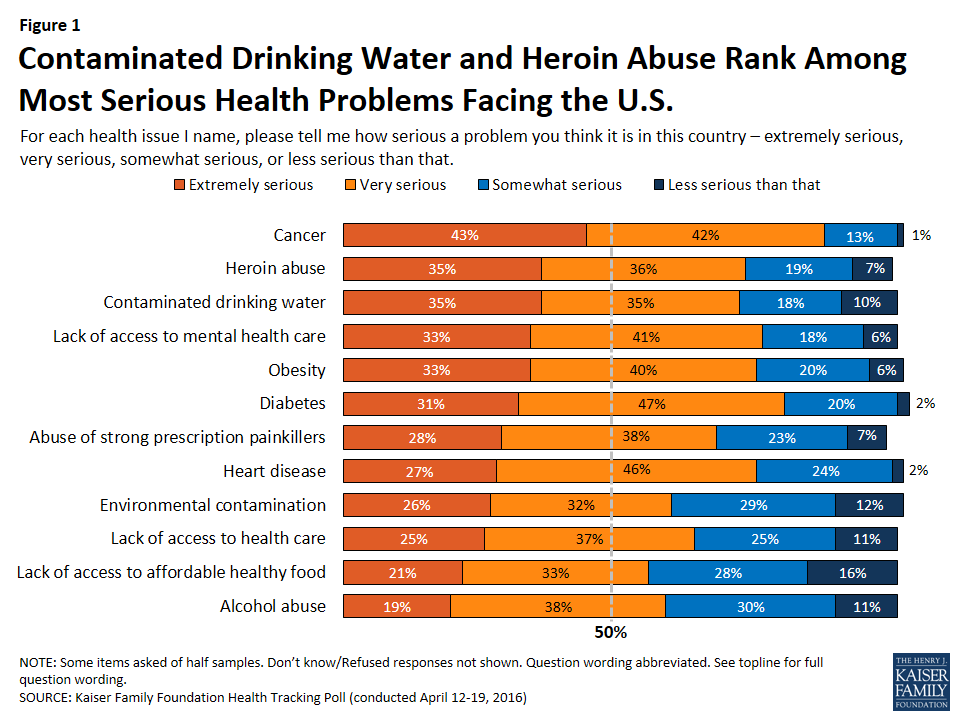
When asked about a series of health issues facing the country, more than a third (35%) identify contaminated drinking water as “extremely serious,” behind cancer (43%) and similar to heroin abuse (35%) and ahead of major diseases such as heart disease ( 27%) and diabetes (31%).
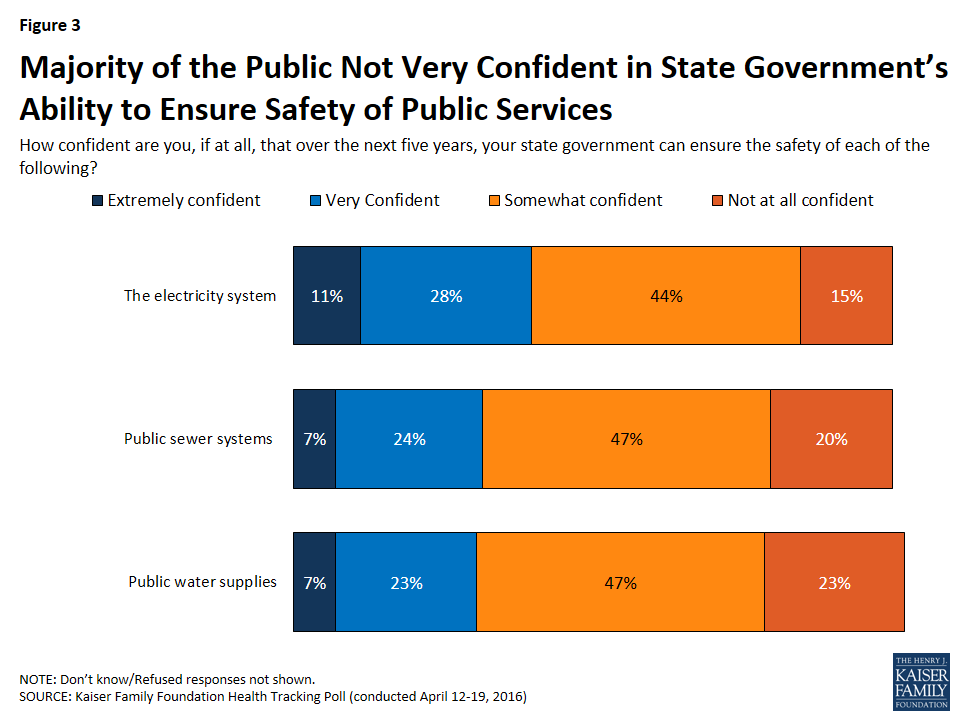
The majority of Americans are not very confident that their state government can ensure the safety of the water supply and other basic services over the next five years. This includes seven in ten (70%) who say they are not very confident in their state government’s ability to ensure the safety of the water; two thirds (67%) say the same about the public sewer system; and six in ten (59%) say so about the electrical system.
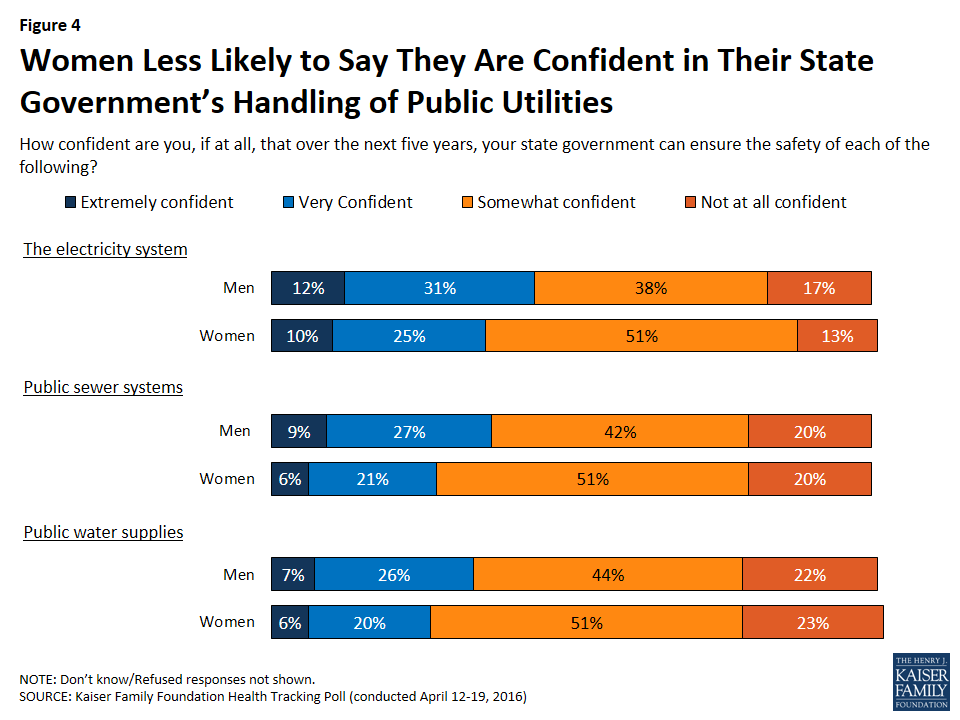
Overall, women are less confident in the government’s ability to ensure the safety of public services than men are. Three-fourths of women (74%) are not very confident in their state’s ability to ensure the safety of their water, compared to two thirds (66%) of men. Similar gender differences exist on the questions about sewage and electrical services.
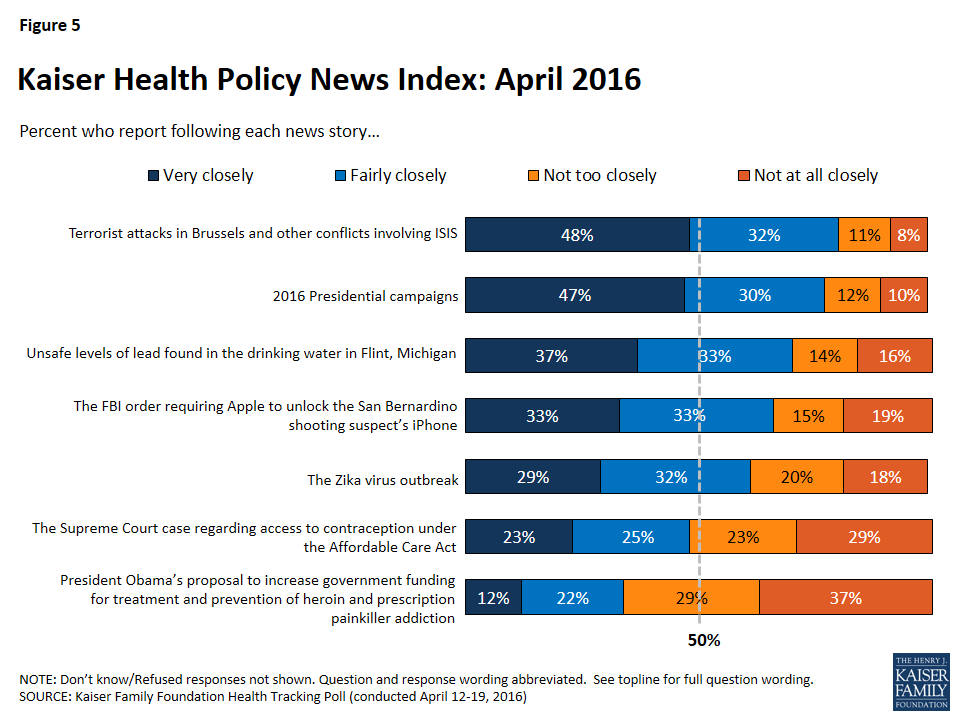
Most Americans (70%) say that this month they have been closely following news about unsafe lead levels in Flint’s water, up from March (63%). More report closely following the terrorist attacks in Brussels and other conflicts involving ISIS (80%) and the 2016 presidential campaign (77%), while slightly fewer say they were closely following news about the Zika outbreak (61%).
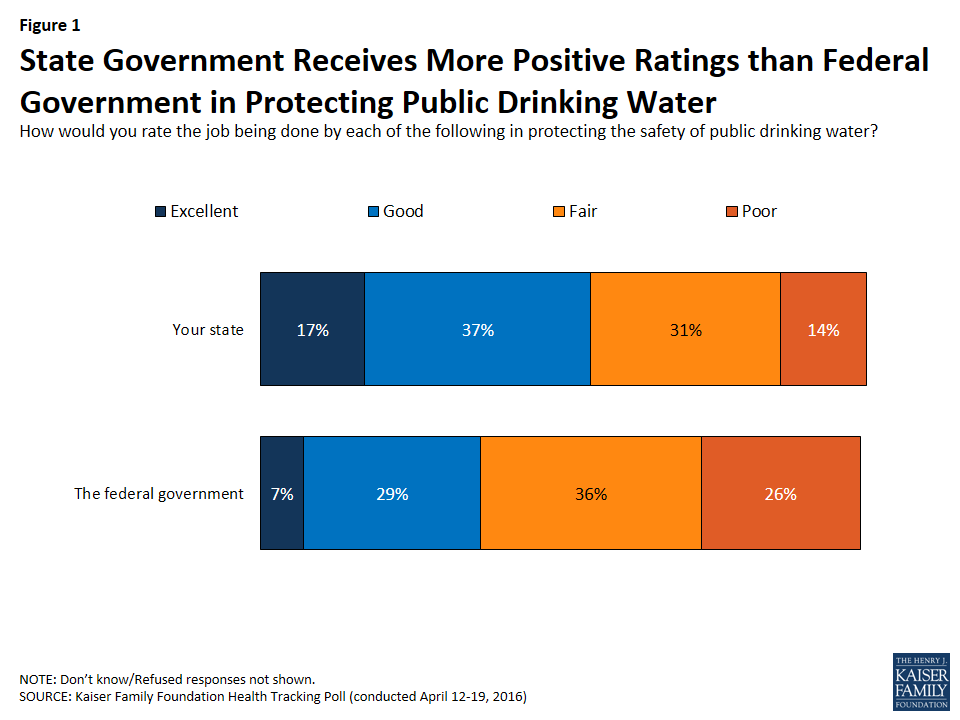
Fielded amid news reports about government officials facing charges related to Flint’s contaminated water supply, the poll finds larger shares of the public rating their state government’s efforts to protect the water supply as either “excellent” (17%) or “good” (37%) than “fair” (31%) or “poor” (14%). The public rates the federal government less favorably, with more saying it’s doing a “fair” (36%) or “poor” (26%) job than saying it’s doing an “excellent” (7%) or “good” (29%) job.
Designed and analyzed by public opinion researchers at the Kaiser Family Foundation, the poll was conducted from April 12-19 among a nationally representative random digit dial telephone sample of 1,201 adults. Interviews were conducted in English and Spanish by landline (420) and cell phone (781). The margin of sampling error is plus or minus 3 percentage points for the full sample. For results based on subgroups, the margin of sampling error may be higher.
Amid Primary Debate about Universal Coverage, Most Democrats Now Want to Expand the Affordable Care Act, Leading to Somewhat Less Favorable Views of the Law Itself
Voters Rank Health Care Fourth As Issue for Presidential Candidates to Discuss
With the Democratic presidential primary featuring a debate about how to get to universal health coverage in the United States, the latest Kaiser Health Tracking Poll finds most Democrats want Congress to expand the Affordable Care Act, contributing to a widening gap between unfavorable and favorable views of the health reform law.
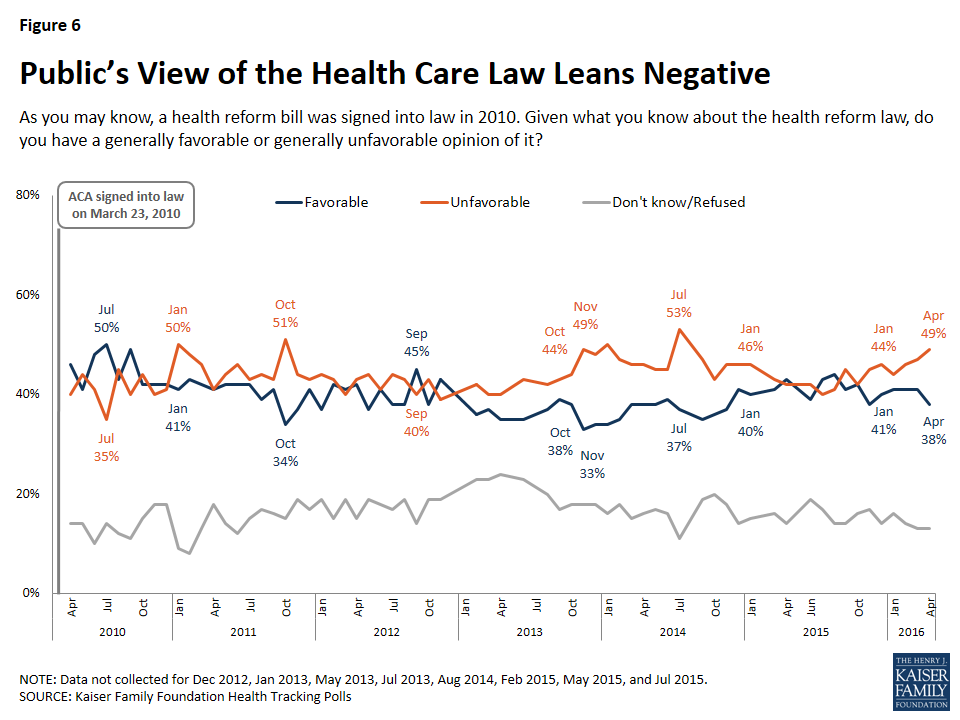
Overall the poll finds that this month 49 percent of the public have an unfavorable of the law while 38 percent have a favorable one. The 11 percentage-point gap compares to a 6-point gap in March, but the movement was among Democrats who are now less likely to hold favorable views (63% this month compared to 69% in March) and more likely to hold unfavorable ones (25% compared to 19%).
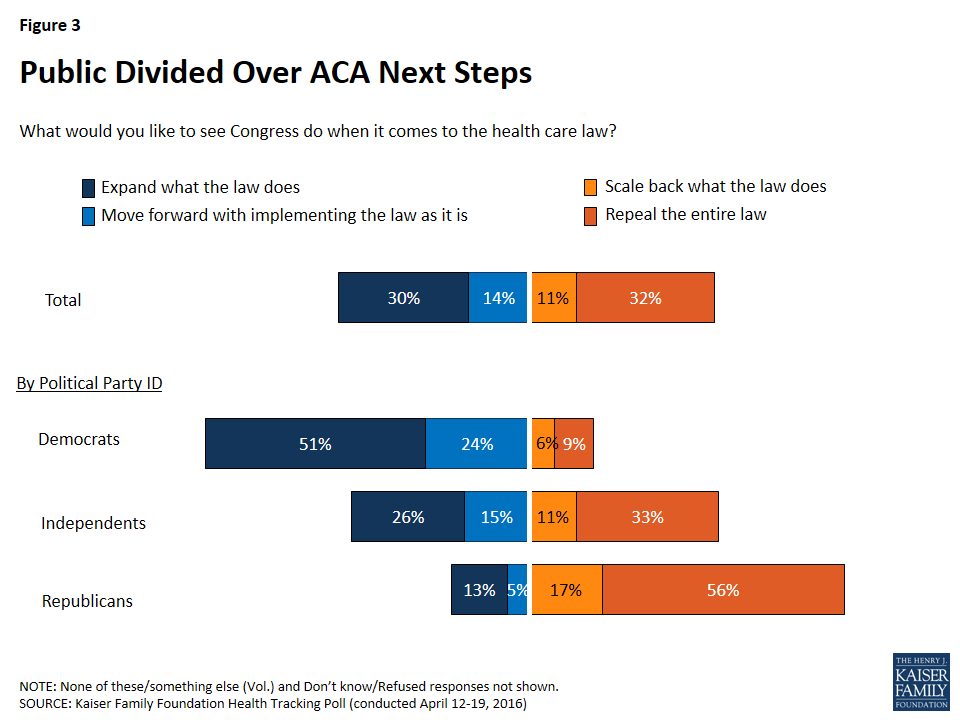
The public overall remains split on what they want Congress to do next with the law. About as many people say they want the entire law repealed (32%) as say they want to expand what the law does (30%), while fewer say they want the law implemented as is (14%) or scaled back (11%).
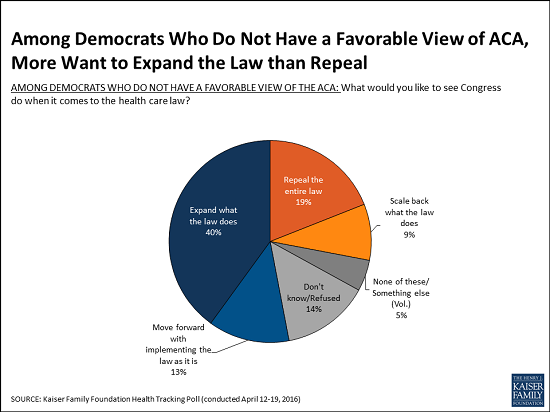
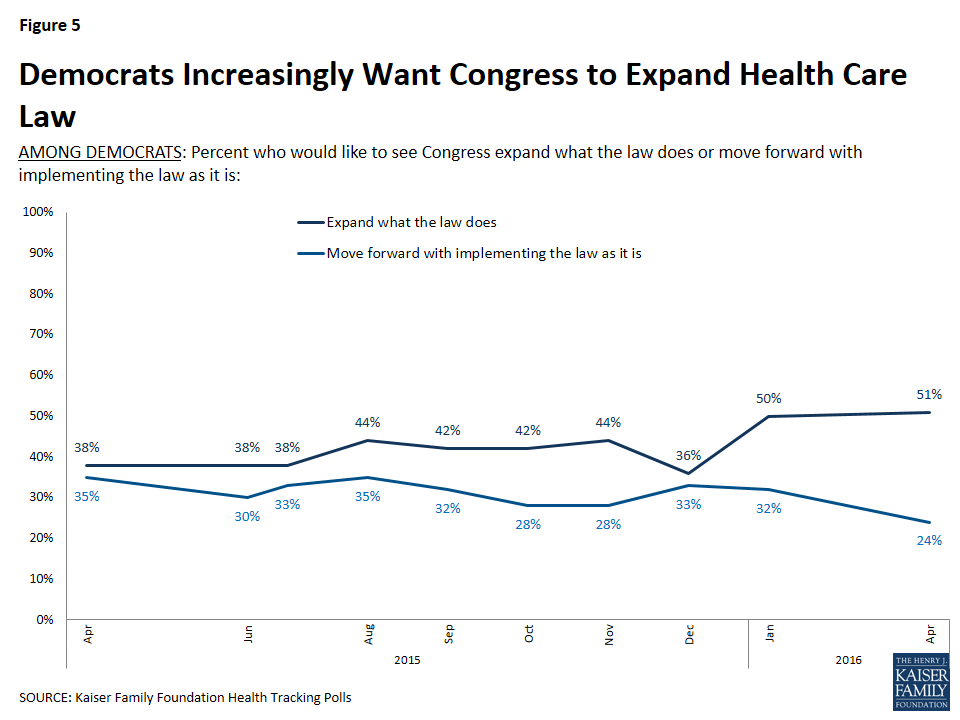
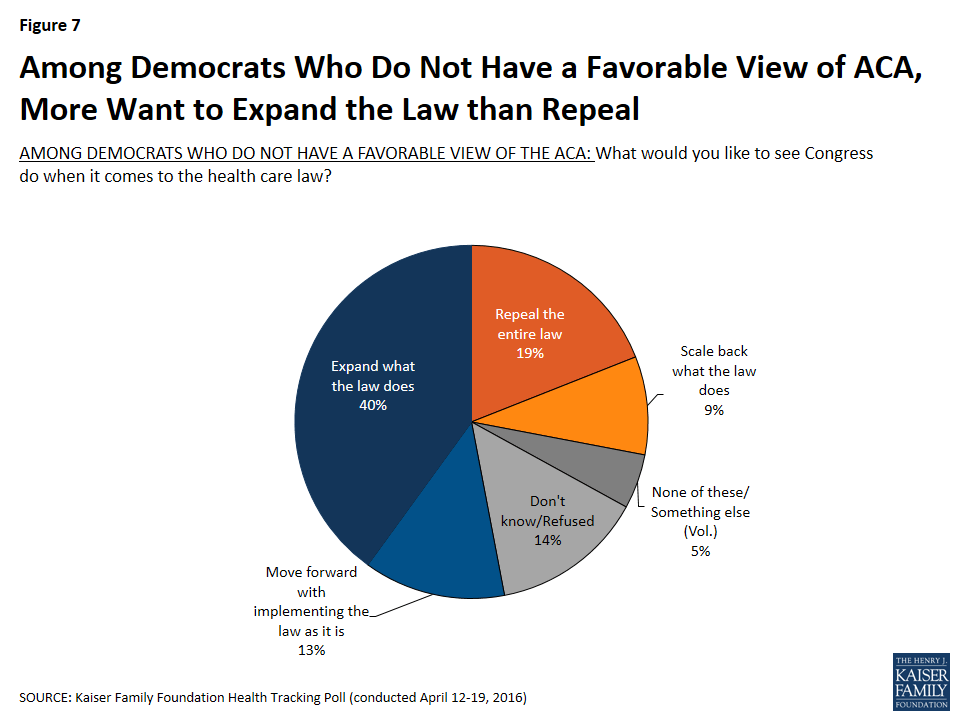
While most Republicans (56%) say they want Congress to repeal the law entirely, most Democrats (51%) say they want to expand what the law does – a share that has increased 13 percentage points over the past year. Even among Democrats who do not hold a favorable view of the ACA, twice as many want Congress to expand the law (40%) than repeal it (19%), suggesting this goal is contributing to the somewhat less favorable views Democrats now hold about the law.
As the 2016 presidential election contest marches on, voters rank health care fourth as the issue they most want the candidates to discuss on the trail. When asked to name the issues they are most interested in hearing the candidates discuss, by far the largest share cite the economy/jobs (30%), followed by national security (21%), immigration (17%), and health care (15%). Further down the list are social issues (10%), education (8%), and foreign policy (8%).
The economy is the most cited issue regardless of party. Democratic voters are more likely to mention health care than independents or Republicans. In addition, Republican and independent voters are more likely than Democrats to mention national security and immigration.
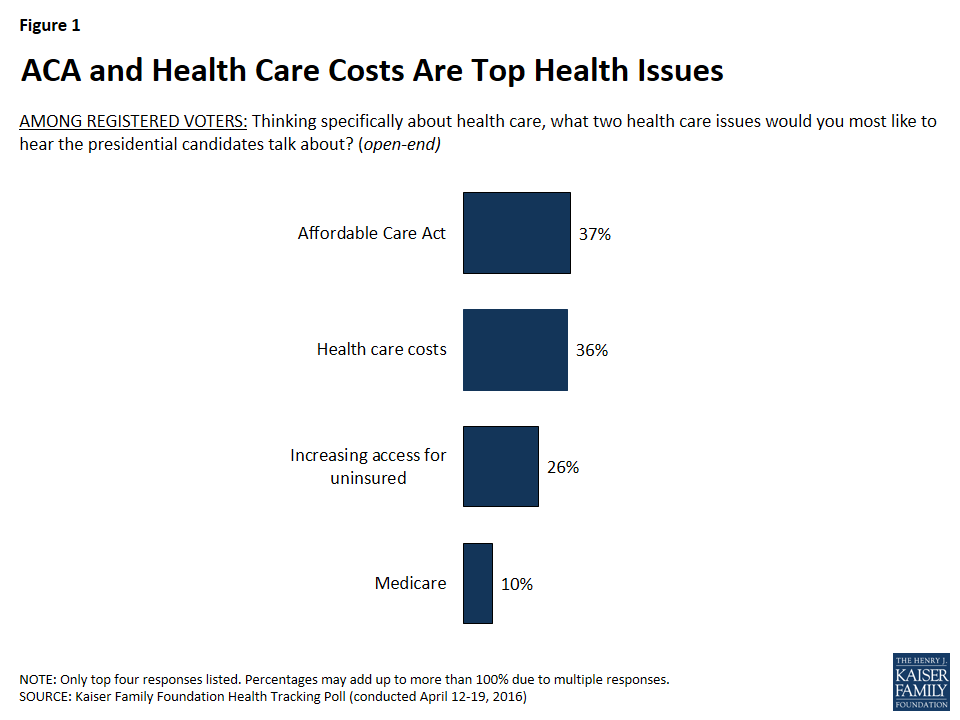
When asked specifically what health care issues voters would most like to hear the presidential candidates discuss, the Affordable Care Act (37%) and health care costs (36%) top the list, followed by expanding coverage for the uninsured (26%) and Medicare (10%).
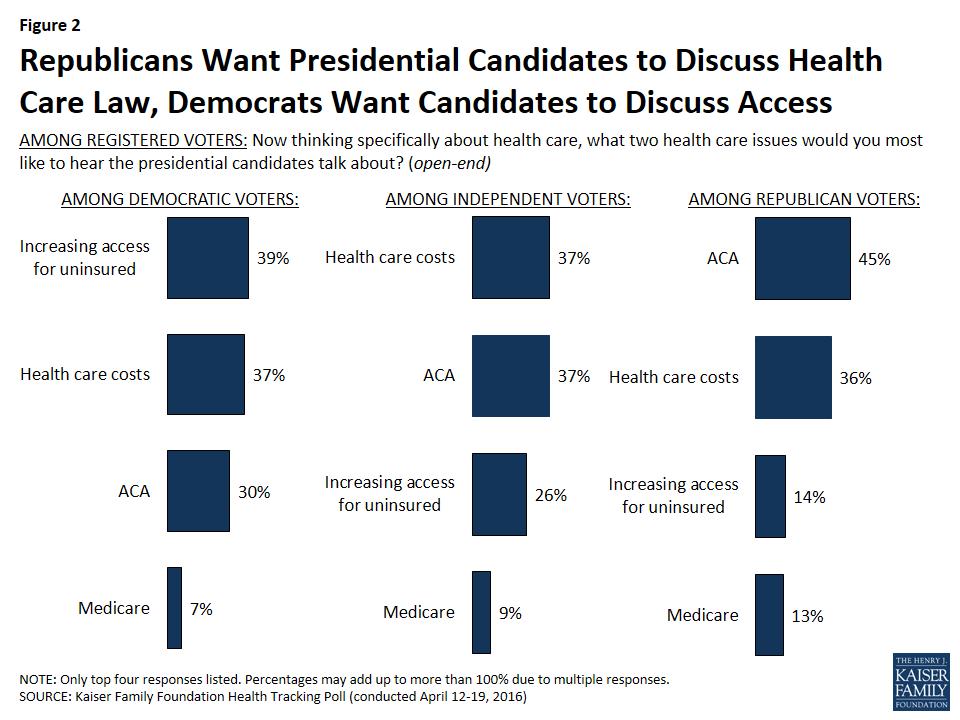
Nearly half of Republican voters (45%) mention the Affordable Care Act, many of whom explicitly mention repealing or opposing it. Slightly more Democratic voters mention expanding coverage for the uninsured and health care costs than the Affordable Care Act, while equal shares of independents mention the Affordable Care Act and health care costs.
Designed and analyzed by public opinion researchers at the Kaiser Family Foundation, the poll was conducted from April 12-19 among a nationally representative random digit dial telephone sample of 1,201 adults. Interviews were conducted in English and Spanish by landline (420) and cell phone (781). The margin of sampling error is plus or minus 3 percentage points for the full sample. For results based on subgroups, the margin of sampling error may be higher.
The April Kaiser Health Tracking Poll examines the role of health care issues in the presidential election.
KEY FINDINGS:
Health care is one of the top four issues mentioned by voters when asked which issues they most want to hear candidates discuss in the campaign, but half as many cite health care as mention the economy and jobs.
When asked specifically what health care issues voters would most like to hear the presidential candidates discuss, the 2010 health care law (ACA) and health care costs top the list.
Overall ratings of the ACA lean negative this month, with 38 percent saying they have a favorable view and 49 percent saying they have an unfavorable view.
The percentage of Democrats who have an unfavorable opinion of the law increased 6 percentage points from last month. Of the Democrats who did not express a favorable opinion, 40 percent want to expand what the law does.
Election Watch: The Role of Health Care Issues in Politics
Economy Tops Issues that Public Wants Presidential Candidates to Talk About, Health Care Ranks Fourth
With news about the 2016 Presidential election topping national news, the April Tracking survey asks which issues- in their own words- American voters most want to hear candidates discuss in the campaign. Health care is one of the top four issues mentioned by voters, but half as many cite health care as mention the economy and jobs. Nearly one-third of registered voters (30 percent), regardless of party, would like candidates to focus on the economy and jobs. This is followed by national security (21 percent) and immigration (17 percent). Health care (15 percent) ranks fourth for voters this election cycle, compared to 2012 when it ranked second behind the economy and jobs. Social issues such as race relations and same-sex marriage (10 percent), education (8 percent), and foreign policy (8 percent) are mentioned by about one in ten Americans.
Larger shares of Democratic voters mention health care (19 percent) than Republican voters (12 percent), while Republican voters are more likely than Democratic voters to mention national security (28 percent and 14 percent, respectively) or immigration (25 percent and 10 percent, respectively).
Table 1: Top Issues American Voters Want Presidential Candidates to Discuss
Thinking about the campaign for the presidential election in November, what two issues would you most like to hear the presidential candidates talk about?(open-end)
All Registered Voters
RepublicanVoters
DemocraticVoters
IndependentVoters
Economy and Jobs
30%
35%
27%
32%
National Security
21
28
14
20
Immigration and Border Control
17
25
10
17
Health Care
15
12
19
14
Social Issues
10
7
16
5
Foreign Policy
8
9
6
9
Education
8
3
13
10
NOTE: Only top seven responses listed. Percentages may add up to more than 100% due to multiple responses.
ACA and Health Care Costs Are Top Health Care Issues
When asked specifically what health care issues voters would most like to hear the presidential candidates discuss, the 2010 health care law (the Affordable Care Act, or ACA) and health care costs top the list with more than one-third of registered voters mentioning each. This is followed by expanding health care coverage for the uninsured (26 percent) and Medicare (10 percent).
Figure 1: ACA and Health Care Costs Are Top Health Issues
Nearly half of Republican voters (45 percent) mention the ACA as the health care issue they want to hear candidates discuss, including 28 percent explicitly mention repealing or opposing it. Slightly more Democratic voters mention expanding coverage for the uninsured (39 percent) and health care costs (37 percent) than the ACA (30 percent), and equal shares of independent voters mention the ACA and health care costs (37 percent each).
Figure 2: Republicans Want Presidential Candidates to Discuss Health Care Law, Democrats Want Candidates to Discuss Access
Americans’ Opinions of the Affordable Care Act
The public remains split on what they want Congress to do with the health care law moving forward with 32 percent supporting repeal of the law and a similar share (30 percent) supporting expanding the law; 14 percent would like to see it implemented as is and 11 percent support scaling back the law.
Figure 3: Public Divided Over ACA Next Steps
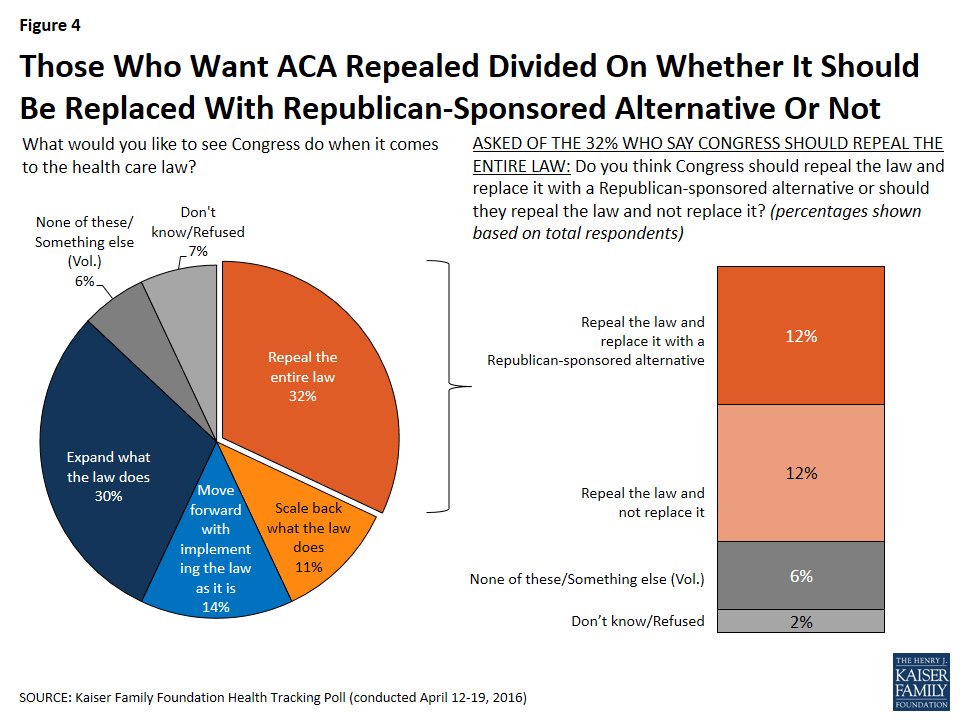
About one-third (32 percent) would like to see Congress repeal the health care law, yet the public is divided on whether Congress should repeal the law and replace it with a Republican-sponsored alternative or repeal and not replace it (12 percent, each).
Figure 4: Those Who Want ACA Repealed Divided On Whether It Should Be Replaced With Republican-Sponsored Alternative Or Not
About half of Democrats (51 percent) want Congress to expand what the law does. This is a significant increase from 36 percent in December 2015, and continues an upward trend first noticed in January 2016. This increase may be due to the rhetoric surrounding universal health care in the Democratic presidential campaign, with both candidates advocating universal coverage as a goal.
Figure 5: Democrats Increasingly Want Congress to Expand Health Care Law
Overall ratings of the ACA lean negative this month, with 38 percent saying they have a favorable view and 49 percent saying they have an unfavorable view.
Figure 6: Public’s View of the Health Care Law Leans Negative
The percentage of Democrats who have an unfavorable opinion of the law increased 6 percentage points to 25 percent, up from 19 percent last month. Of the Democrats who did not express a favorable opinion of the ACA, 40 percent want to expand what the law does, 20 percent do not know what they would like to see Congress do when it comes to the health care or mention something else, 19 percent want to repeal the entire law, 13 percent want to move forward with implementing the law as it is, and 9 percent want to scale back what the law does.
Figure 7: Among Democrats Who Do Not Have a Favorable View of ACA, More Want to Expand the Law than Repeal
Water Safety
The April Kaiser Health Tracking Poll continues Kaiser Family Foundation tracking of perceptions of the safety of drinking water.
KEY FINDINGS:
The majority of individuals living in the Midwest rate the job being done by their state to ensure the safety of the public drinking water as fair or poor.
Women are less confident in government’s ability to ensure the safety of public services, including the public sewer system, the electricity system, and the water supply, than their male counterparts.
The American public negatively rates the job being done by the federal government in protecting the safety of public drinking water and is more positive than negative on the job being done by their individual states.
The terrorist attacks in Brussels and other conflicts involving ISIS and the 2016 presidential campaign are the top two stories capturing the attention of the American public this month.
Americans are increasingly paying attention to news about the unsafe lead levels in Flint, Michigan’s water and the Zika virus outbreak.
Government’s Ability to Safeguard Public Services
With news that several government officials are facing charges in connection with the contamination of Flint, Michigan’s water supply1 , the April Tracking Poll examines Americans’ confidence in the government’s ability to ensure the safety of public services, including public water supplies.
Protecting the Safety of Public Drinking Water
While a majority of the American public positively rate the job being done by the state government in protecting the safety of public drinking water, attitudes are more negative in their evaluations of the job being done by the federal government.
Over half of the public say their state is doing an “excellent” (17 percent) or “good” (37 percent) job in protecting the safety of public drinking water. About three in ten (31 percent) rate the job being done by their state as “fair,” and 14 percent rate it as “poor.”
Only seven percent of Americans rate the job being done by the federal government in protecting the safety of public drinking water as “excellent,” 29 percent rating it “good,” 36 percent rating it “fair,” and one-fourth (26 percent) rating it as “poor.” There are no partisan differences in evaluations of the job currently being done by state governments or the federal government with Republicans and Democrats being equally negative in their evaluation of the federal government and more divided on the job being done by their state.
Figure 1: State Government Receives More Positive Ratings than Federal Government in Protecting Public Drinking Water
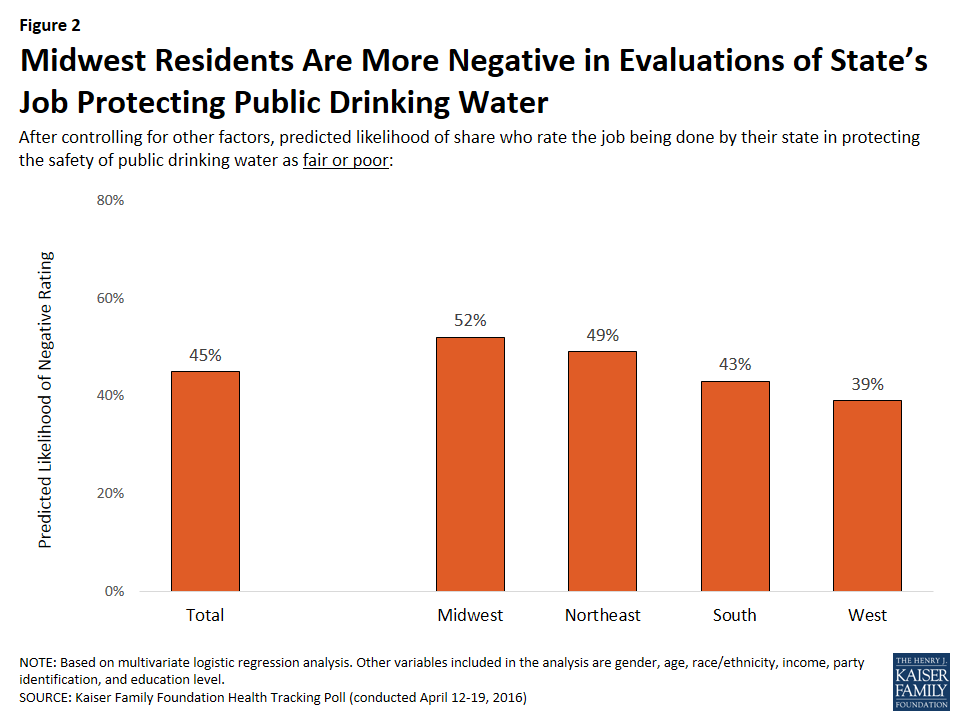
Individuals living in the Midwest, where Flint, Michigan is located, are less positive in their evaluations of their state’s job of protecting the safety of the public drinking water. When controlling for demographic factors (age, income, education level, party identification, gender, and race/ethnicity), results indicate that individuals living in the Midwest are negative in their evaluations with slightly more than half (52 percent) giving their state a rating of “fair” or “poor,” which is similar to those living in the Northeast (49 percent), but slightly more negative than those living in the South (43 percent), and significantly more negative than those living in the West (39 percent).
Figure 2: Midwest Residents Are More Negative in Evaluations of State’s Job Protecting Public Drinking Water
Confidence in State Government’s Ability to Ensure Safety of Public Services in the Future
While the public is more divided on evaluations of their state’s current job protecting public drinking water, the majority of Americans are not very confident that their state government can ensure the safety of their electricity system, the public sewer system, or the public water supply over the next five years.
Seven in ten Americans say they are not very confident in the state government’s ability to ensure the safety of the water while 29 percent say they are very or extremely confident. The results are similar to opinions about the state’s ability to ensure the safety of the public sewer system (67 percent are not very confident while 31 percent are very or extremely confident), and to a lesser degree, the electricity system (59 percent are not very confident while 39 percent are very or extremely confident).
Figure 3: Majority of the Public Not Very Confident in State Government’s Ability to Ensure Safety of Public Services
Overall, women are less confident in government’s ability to ensure the safety of public services than their male counterparts. Three-fourths of women (74 percent) are not very confident in their state’s ability to ensure the safety of their water, compared to 66 percent of men. These gender differences are also apparent when asked about ensuring the safety of the public sewer system (71 percent of women are not very confident, compared to 62 percent of men), and the electricity system (64 percent of women are not very confident, compared to 55 percent of men). These findings are consistent with other indicators suggesting that women care more about health-related issues than men.
Figure 4: Women Less Likely to Say They Are Confident in Their State Government’s Handling of Public Utilities
Kaiser Health Policy News Index: April 2016
The April Kaiser Health Tracking Poll finds that the top two stories capturing the attention of the American public are the terrorist attacks in Brussels and other conflicts involving ISIS and the 2016 presidential campaign, with 80 percent and 77 percent of Americans saying they are closely following these stories, respectively. Americans are increasingly paying attention to news about the unsafe lead levels in Flint, Michigan’s water (70 percent) and the Zika virus outbreak (61 percent), up from 63 percent and 54 percent respectively in March 2016. A majority of Americans (66 percent) also report closely following news about the FBI order requiring Apple to unlock the San Bernardino shooting suspect’s iPhone. Fewer Americans report closely following news about the Supreme Court case regarding access to contraception under the ACA (48 percent) and President Obama’s proposal to increase government funding for treatment and prevention of heroin and prescription painkiller addiction (34 percent).
Figure 5: Kaiser Health Policy News Index: April 2016
Substance Abuse And Mental Health
The April Kaiser Health Tracking Poll examines public opinion on the severity of health problems in the U.S. and takes a closer look at attitudes towards current health problems; including access to substance abuse treatment and mental health services.
KEY FINDINGS:
Cancer tops the public’s list of extremely serious health problems in the U.S., followed by contaminated drinking water, heroin abuse, two topics that have garnered media attention recently.
Although heroin technically falls into the same opioid family as prescription painkillers, Americans perceptions of the seriousness of addiction to these two drugs as well as the discrimination faced by those who use them are different.
Forty-four percent say they personally know someone who has been addicted to prescription painkillers; a majority of Americans say that lack of access to care for people with substance abuse issues is a problem.
A quarter report that a doctor or health professional has told them or another family member living in their household that they have a serious mental health condition; 21 percent report that there has been a time when they or another family member thought they might need mental health services but did not get them.
Many Americans are unaware of the legal requirement that insurance plans must have the same rules for mental health benefits and substance abuse treatment as other medical services.
Serious Health Problems in the U.S.
When given a list of health issues facing the country, cancer tops the list, with 43 percent saying it is an extremely serious problem. In the midst of news stories about the contamination of the water in Flint, Michigan, just over one-third (35 percent) rate contaminated drinking water as an extremely serious problem. Similar shares name heroin abuse (35 percent), lack of access to mental health care (33 percent) and obesity (33 percent) as extremely serious problems. About three in ten say diabetes (31 percent), abuse of strong prescription painkillers, sometimes called opioids (28 percent), and heart disease (27 percent) are extremely serious problems, and about a quarter say the same for environmental contamination (26 percent) and lack of access to health care (25 percent). At the bottom of the public’s list are lack of access to affordable healthy food (21 percent) and alcohol abuse (19 percent).
Figure 1: Contaminated Drinking Water and Heroin Abuse Rank Among Most Serious Health Problems Facing the U.S.
A Closer Look at Substance Abuse
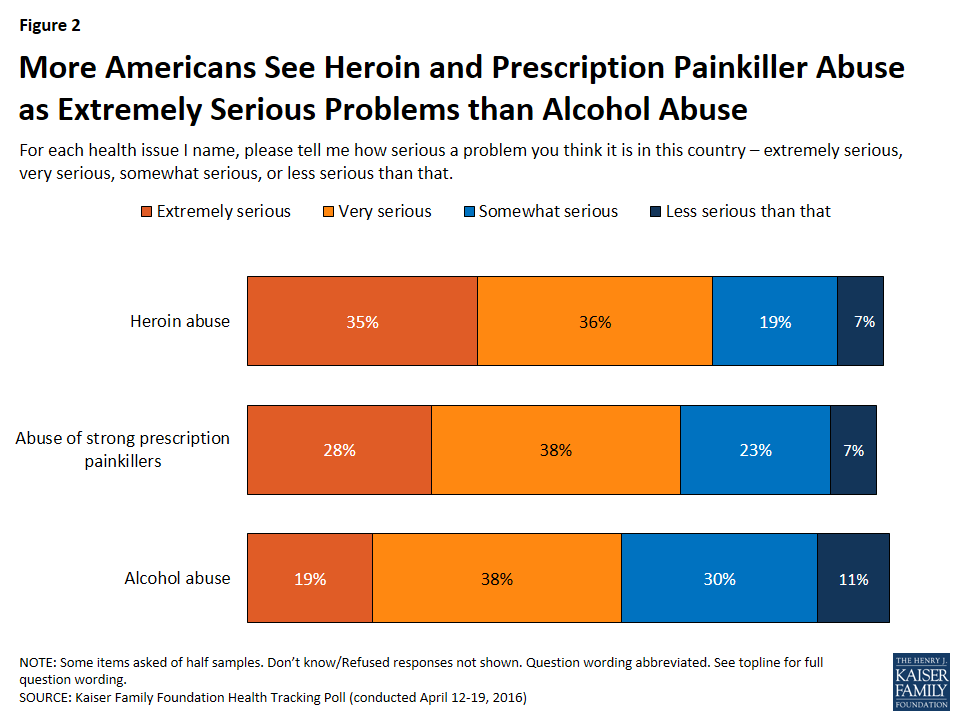
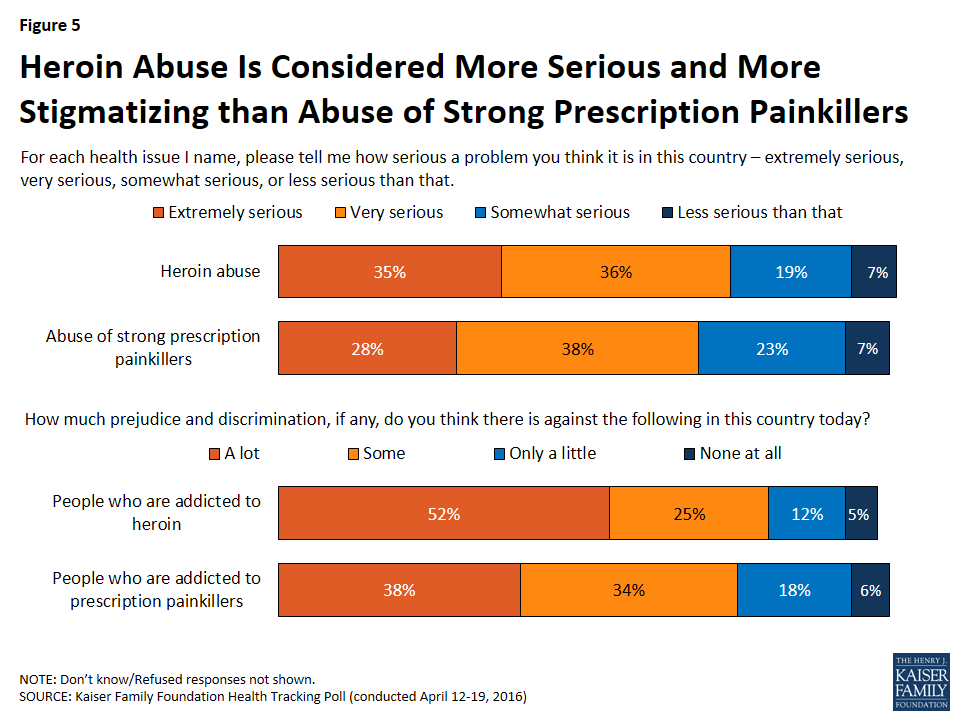
More than one-third of Americans (35 percent) say heroin abuse is an extremely serious problem in the U.S., compared to 28 percent who say the same about abuse of strong prescription painkillers, and less than one in five (19 percent) who say alcohol abuse is an extremely serious problem.
Figure 2: More Americans See Heroin and Prescription Painkiller Abuse as Extremely Serious Problems than Alcohol Abuse
Personal Experience with Prescription Drug Addiction
Prescription drug addiction impacts nearly half of the public on a personal level. Forty-four percent say they personally know someone who has been addicted to prescription painkillers, with about a quarter (26 percent) saying the person they know is an acquaintance, 21 percent saying a close friend, 20 percent saying a family member, and 2 percent saying themselves.
Figure 3: Over Four in Ten Americans Know Someone Who Has Been Addicted to Prescription Painkillers
Access to Care
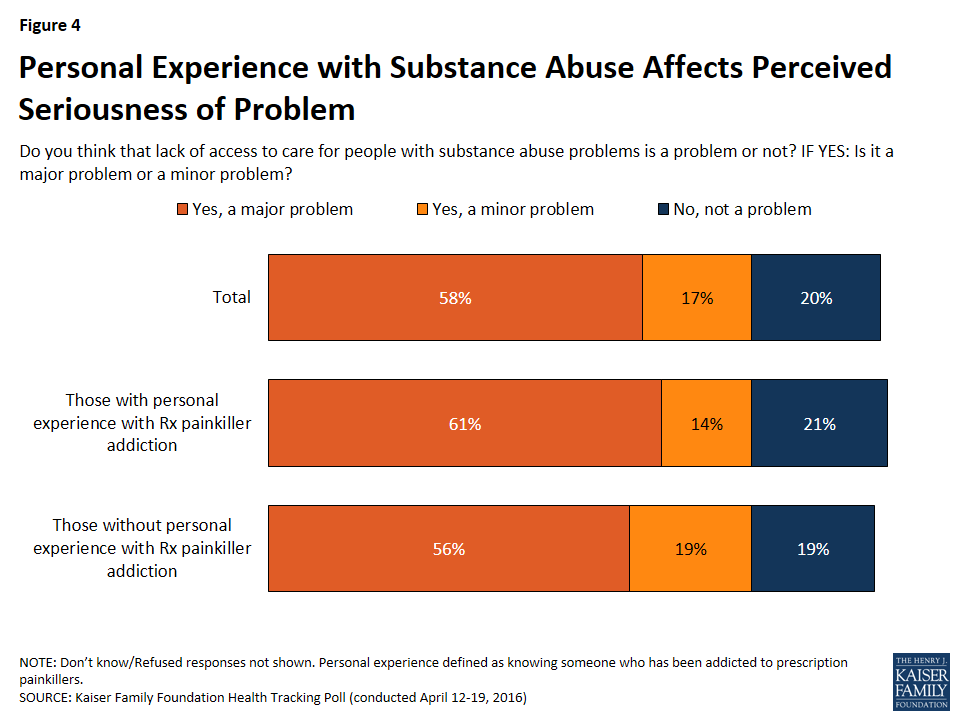
A majority of Americans say that lack of access to care for people with substance abuse issues is a problem (75 percent), including 58 percent who say it is a major problem.
Figure 4: Personal Experience with Substance Abuse Affects Perceived Seriousness of Problem
Perceptions of Heroin Abuse Compared to Prescription Painkiller Abuse
Although heroin technically falls into the same opioid family as prescription painkillers, the overall perception of the seriousness of addiction to these two drugs as well as the discrimination faced by those who use them is different. Just over one-third of the public (35 percent) say heroin abuse is an extremely serious problem, while 28 percent say opioid prescription painkiller abuse is. Additionally, about half of the public (52 percent) believe that people who are addicted to heroin face a lot of prejudice and discrimination in this country today, compared to just 38 percent who say people addicted to prescription painkillers do.
Figure 5: Heroin Abuse Is Considered More Serious and More Stigmatizing than Abuse of Strong Prescription Painkillers
Actions to Fight The Increasing Rate of Prescription Painkiller Abuse
The subject of prescription painkiller abuse has gained attention from journalists and policy makers recently, most notably when President Obama announced $1.1 billion in additional funding along-side an array of new measures to fight the opioid addiction.2 Despite this, a majority of the public says the federal government is not doing enough to combat the recent increase in the number of people who are addicted to prescription painkillers (66 percent) or heroin (62 percent). Large shares say other groups aren’t doing enough to combat the problem, including their state governments (67 percent and 61 percent, respectively), doctors who prescribe prescription painkillers (63 percent and 56 percent), and particularly, individuals who use prescription painkillers or heroin (73 percent and 77 percent). Far fewer say police officers are not doing enough to combat painkiller abuse (37 percent) and heroin abuse (36 percent).
Figure 6: Large Shares Say Individuals, Government, and Doctors Aren’t Doing Enough to Fight Opioid Addiction
The poll also assesses the public’s views on expanding access to a drug called Narcan, or Naloxone, which can prevent people from dying if they are experiencing an overdose of a prescription painkiller or heroin. Currently, some states have made this drug available to adults without a prescription while others restrict the sale of this drug because they think it might encourage the use of illegal drugs. Nearly six in ten Americans (59 percent) think that these drugs should only be allowed with a prescription, while just more than a third (36 percent) think that it should be available without one. The share in favor of access without a prescription is significantly higher among individuals who report a personal experience with prescription painkiller abuse than those without (45 percent vs. 30 percent). Also, Democrats and independents are more likely to favor access without a prescription and Republicans are (40 percent and 41 percent vs. 30 percent).
Figure 7: Most Say Drug to Treat Overdose Should Only Be Available With a Prescription
Policy Efforts to Curb Prescription Painkiller Abuse
The public thinks that a variety of policy efforts would be effective in reducing the abuse of prescription painkillers. Over eight in ten think that increasing pain management training for medical students and doctors (88 percent), increasing access to addiction treatment programs (86 percent), public education and awareness programs (84 percent), increasing research about pain and pain management (83 percent), and monitoring doctors’ prescription painkiller prescribing habits (82 percent) would be at least somewhat effective ways to reduce the number of people abusing prescription painkillers. Smaller shares think that encouraging people who are prescribed painkillers to dispose of any extras once they are no longer medically necessary (63 percent), reducing the social stigma around addiction (60 percent), and putting warning labels on prescription drug bottles that explain the risk of addiction (49 percent) would be at least somewhat effective.
Figure 8: Large Shares Think Various Policy Efforts Would Be Effective in Reducing Prescription Painkiller Abuse
A Closer Look at Mental Health
Personal Impact of Mental Health
A quarter report that a doctor or health professional has told them or another family member living in their household that they have a serious mental health condition, such as depression or anxiety. Furthermore, about two in ten (21 percent) report that there has been a time when they or another family member thought they might need mental health services but did not get them. Individuals say they didn’t get mental health care because they couldn’t afford the cost (13 percent), insurance wouldn’t cover it (12 percent), there were afraid or embarrassed to seek care (10 percent), or they didn’t know where to go to get care (8 percent).
Figure 9: One in Five Say They or Family Member Did Not Get Mental Health Services
Perceptions About Access to Care for Those with Mental Health Conditions
Nearly nine in ten (87 percent) think that lack of access to care for people with mental health conditions is a problem, including 73 percent who say it is a major problem.
Figure 10: Personal Experience with Mental Health Conditions Affects Perceived Seriousness of Problem
Discrimination and Mental Health Conditions
Substantial shares of the public think that people suffering from mental health conditions experience at least some prejudice and discrimination in this country today. About four in ten (42 percent) say those who suffer from depression face a lot of discrimination, and fewer (32 percent) say the same about those who suffer from anxiety.
Figure 11: Americans Believe People with Depression Face Prejudice and Discrimination More Often than Those with Anxiety
Substance Abuse and Mental Health Parity Laws
Policy makers have enacted legal protections aimed at addressing access to care for individuals with substance abuse problems and serious mental health conditions. The Mental Health Parity and Addiction Equity Act, ushered in as one of the many provisions of the Affordable Care Act, legally requires insurance plans to have the same rules for mental health benefits and substance abuse treatment as other medical services.3 However, many Americans remain unaware of these requirements. About four in ten (43 percent) know that health plans must have the same rules for mental health coverage, while an identical share thinks insurance companies can have separate rules and 13 percent don’t know. Fewer (30 percent) are aware that the requirement applies to substance abuse treatment, while over half (53 percent) incorrectly say insurance plans can have separate rules for substance abuse benefits and 15 percent don’t know. Individuals with personal connections to substance abuse and mental health conditions are no more likely than those without personal connections to know about the legal protections around such treatments.
Figure 12: Less than Half of Americans Know About Mental Health and Substance Abuse Parity
Methodology
This Kaiser Health Tracking Poll was designed and analyzed by public opinion researchers at the Kaiser Family Foundation (KFF). The survey was conducted April 12-19, 2016, among a nationally representative random digit dial telephone sample of 1,201 adults ages 18 and older, living in the United States, including Alaska and Hawaii (note: persons without a telephone could not be included in the random selection process). Computer-assisted telephone interviews conducted by landline (420) and cell phone (781, including 457 who had no landline telephone) were carried out in English and Spanish by Princeton Data Source under the direction of Princeton Survey Research Associates International (PSRAI). Both the random digit dial landline and cell phone samples were provided by Survey Sampling International, LLC. For the landline sample, respondents were selected by asking for the youngest adult male or female currently at home based on a random rotation. If no one of that gender was available, interviewers asked to speak with the youngest adult of the opposite gender. For the cell phone sample, interviews were conducted with the adult who answered the phone. KFF paid for all costs associated with the survey.
The combined landline and cell phone sample was weighted to balance the sample demographics to match estimates for the national population using data from the Census Bureau’s 2014 American Community Survey (ACS) on sex, age, education, race, Hispanic origin, and region along with data from the 2010 Census on population density. The sample was also weighted to match current patterns of telephone use using data from the January-June 2015 National Health Interview Survey. The weight takes into account the fact that respondents with both a landline and cell phone have a higher probability of selection in the combined sample and also adjusts for the household size for the landline sample. All statistical tests of significance account for the effect of weighting.
The margin of sampling error including the design effect for the full sample is plus or minus 3 percentage points. Numbers of respondents and margins of sampling error for key subgroups are shown in the table below. For results based on other subgroups, the margin of sampling error may be higher. Sample sizes and margins of sampling error for other subgroups are available by request. Note that sampling error is only one of many potential sources of error in this or any other public opinion poll. Kaiser Family Foundation public opinion and survey research is a charter member of the Transparency Initiative of the American Association for Public Opinion Research.
In this post for The JAMA Forum, the Kaiser Family Foundation’s Larry Levitt discusses UnitedHealth’s exit from Affordable Care Act marketplaces, the possibility of bigger premium increases in 2017, and why these challenges are unlikely to significantly affect long-term sustainability of the market and the law.
As one of the most populous states in the U.S., the health and health care of Pennsylvanians have important implications for the nation at large. Pennsylvania is experiencing changes to its health care delivery and payment systems as the state expands Medicaid, provides new coverage options through the federal health insurance marketplace, and streamlines application and enrollment processes for coverage programs. This fact sheet provides an overview of population health, health coverage, and the health care delivery system in Pennsylvania in the era of health reform.
Demographics
Figure 1: Pennsylvania is located in the northeast region of the U.S.
Pennsylvania is home to more than 12.6 million people, making it the sixth most populous state in the U.S.1 With nearly 45,000 square miles, Pennsylvania is the 32nd largest state.2 Pennsylvania is bordered by six states and is one of nine states located in the country’s Northeast region (Figure 1). In the Northeast, it is the second most populous state after New York. Pennsylvania’s topography is carved out by the Appalachian Mountains, which run through the center and cover most of the state, giving it rolling hills, ridges and plateaus, and valleys.3
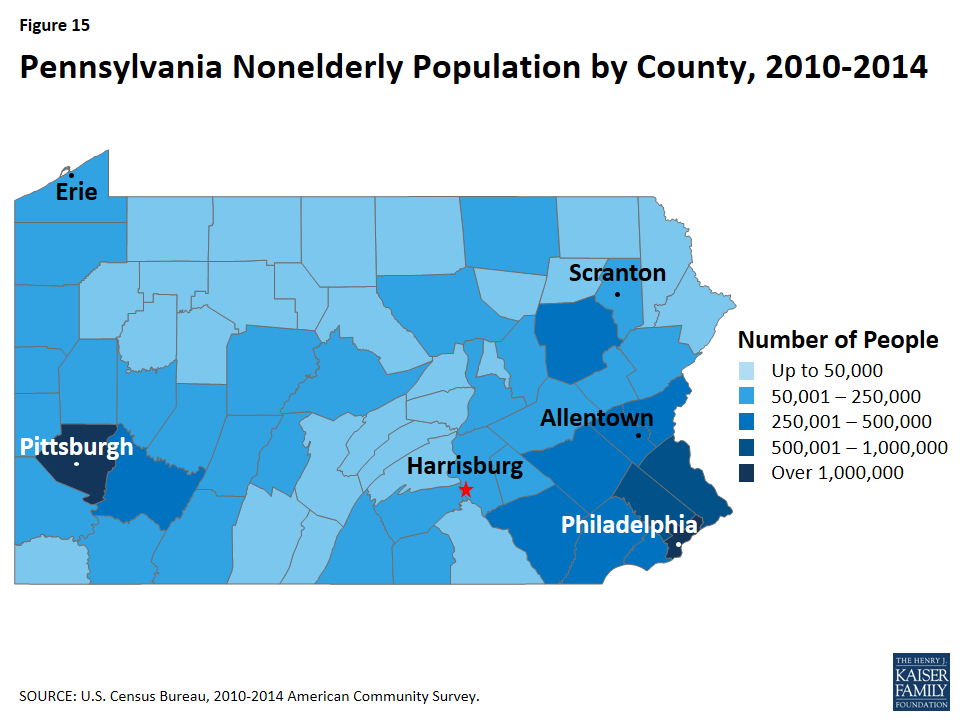
Much of Pennsylvania is rural, but the majority of the population lives in metropolitan areas. Among the state’s 67 counties, seven had total populations that met or exceeded 500,000 (See Figure 15, Appendix). The majority of the state’s population (87%) lives in metropolitan areas, and four counties (Philadelphia, Allegheny, Montgomery, and Bucks) account for one-third of the state’s population.4 Additionally, 52 of the state’s 67 counties are within the Appalachian region,5 accounting for almost half of the population (45%).
Social and demographic population patterns in Pennsylvania, including race/ethnicity, citizenship status and age distribution, are less diverse than other states in the Northeast and the United States overall (Table 1). A larger share of Pennsylvanians identify as White compared to the national average (77% versus 62%), while fewer identify as Hispanic (7% in Pennsylvania versus 18% nationally). Additionally, 17% of the population are 65 or older, compared to 15% nationally. More than nine in ten (94%) are U.S.-born citizens and nearly one-third of nonelderly adults (32%) have at least a college degree. Over eight in ten residents (81%) live in a household with at least one full-time worker.
Table 1: Selected Demographic Characteristics of the Pennsylvanian Population,Compared to the Northeast and United States Overall, 2014
Pennsylvania
Northeast
United States
Race/Ethnicity
White
77%
67%
62%
Black
10%
11%
12%
Hispanic
7%
13%
18%
Other Race/Ethnicity
5%
9%
9%
Age
0-18
23%
23%
25%
19-64
60%
61%
61%
65+
17%
16%
15%
Citizenship Status
U.S.-Born Citizen
94%
84%
87%
Naturalized Citizen
3%
9%
6%
Non-Citizen
3%
8%
7%
Educational Attainment of Nonelderly Adults (19-64)
Less than High School
8%
8%
10%
High School Graduate
34%
28%
29%
Some College/Assoc. Degree
26%
26%
30%
College Graduate or Greater
32%
38%
31%
Employment Characteristics of Nonelderly
Households with at Least 1 Full-time Worker
81%
82%
82%
NOTE: Data may not sum to 100% due to rounding and data restrictions.SOURCE: Kaiser Family Foundation estimates based on the Census Bureau’s March 2015 Current Population Survey (CPS: Annual Social and Economic Supplement).
Figure 2: Poverty Rates by Race/Ethnicity and Age in Pennsylvania, 2014
While the overall share of Pennsylvanians living in poverty is slightly lower than the national average (13% vs. 15%), Pennsylvania has wide disparities in poverty rates by race/ethnicity and age. In Pennsylvania, Blacks and Hispanics are approximately three times as likely as Whites to be poor (Figure 2). As in most other states, children in Pennsylvania are substantially more likely than adults to live in a poor household. As of 2014, almost one in five (19%) Pennsylvania children under age 19 was living in poverty, compared to one in ten nonelderly adults (11%) and 8% of adults age 65 and older.
Population Health
Pennsylvania falls below national averages in rankings of state population health. Pennsylvania ranks 29th among the 50 states in the United Health Care Foundation’s report, America’s Health Rankings 2015.6 In the Commonwealth Fund rankings of state health system performance, Pennsylvania dropped from 14th to 20th between 2009 and 2015.7 Compared to other states, Pennsylvania has heart disease and drug related mortality rates above national averages.8 Conversely, Alzheimer’s disease and alcohol-related death rates in Pennsylvania are below national averages.9 The teen pregnancy rate has been steadily declining to just over half of what it was two decades ago (49 pregnancies per 1,000 women aged 15-19 in 2010 compared to 89 per 1,000 in 1988) which is below the national average of 57 pregnancies per 1,000.10
According to the Centers for Disease Control and Prevention (CDC), Pennsylvania had one of the highest cancer incidence and death rates in the United States in 2012. At 476.1 cases per 100,000 people, Pennsylvania had the seventh highest cancer incidence rate nationally and the fourth highest among states in the Northeast. Ranked seventeenth nationally and second among states in the Northeast, Pennsylvania’s cancer death rate is 174.9 deaths per 100,000 people. At 63.9 cases per 100,000 among all Pennsylvanians, lung and bronchus cancer had the highest incidence rate. However, prostate cancer and breast cancer both had higher incidence rates among each gender. In 2012, the CDC reported 101.7 cases of prostate cancer per 100,000 men and 128.2 cases of breast cancer per 100,000 women.11
Along with states across the nation, Pennsylvania is currently experiencing an unprecedented number of heroin, opioid, and substance use deaths. The Pennsylvania State Coroners Association reported that deaths resulting from drug poisoning continue to increase, with the state seeing an average increase of 20% in most counties between 2013 and 2014. At the time of reporting, the number of drug-related deaths in 2014 was almost 2,500. Almost half (49%) of overdose deaths are caused by opioid medications (25%) and non-legal drugs12 (24%). The typical overdose victim is white, male, aged 41-50, and single.13 Early 2015 data indicate that the number of deaths due to overdose continues to climb.
Disparities in health and health care access exist in Pennsylvania. As in other states across the country, measures of health status in Pennsylvania vary by race/ethnicity, and patterns across these measures in Pennsylvania are similar to national data (Table 2). Around one quarter of Black (27%) and Hispanic (23%) residents report being in fair or poor general health compared to 16% of those who identify themselves as White. Additionally, Blacks (24%) are more likely to smoke than Whites (19%). Disparities in access to care also exist in Pennsylvania. As at the national level, Hispanics in Pennsylvania are more likely to report having no usual source of care (36%) compared to Blacks (18%) and Whites (12%.) Additionally, White (15%) and Hispanic (24%) residents in Pennsylvania are more likely than Blacks (11%) not to have had a doctor visit in the past 2 years.
Table 2: Selected Measures of Health Status and Health Access by Race/Ethnicity in Pennsylvania Compared to the United States, 2014
Share reporting that they:
Pennsylvania
United States
White
Black
Hispanic
White
Black
Hispanic
Have fair or poor general health
16%
27%
23%
16%
22%
26%
Smoke
19%
24%
NSD
18%
20%
14%
Have no usual source of care
12%
18%
36%
18%
23%
41%
Have not had a checkup in the past 2 years
15%
11%
24%
17%
11%
22%
Are overweight or obese
64%
73%
67%
63%
73%
70%
Have frequent mental distress
35%
38%
40%
34%
35%
34%
Have diabetes
11%
15%
11%
10%
15%
11%
NSD means not sufficient data. Data may not sum to 100% due to rounding and data restrictions. Data for Whites and Blacks exclude Hispanics.SOURCE: KCMU analysis of the Centers for Disease Control and Prevention (CDC)’s Behavioral Risk Factor Surveillance System (BRFSS) 2014 Survey Results.
Disparities in health and health access exist across the geographic regions of the state, with Pennsylvanians living in rural communities more likely to have unmet heath needs and have poor access to health care than those in urban communities. A 2012 report from the Pennsylvania Department of Health found that individuals living in rural communities had higher rates for cancer, obesity, heart disease, and diabetes. According to the same report, children and nonelderly adults living in rural communities were also more likely to be uninsured.14
State and local efforts are working to address health disparities in Pennsylvania. Pennsylvania’s Office of Health Equity (OHE) was integrated into the Pennsylvania Department of Health in 2007 and has collaborated with health department staff, other state government agencies, educational institutions, health providers and community based organizations to reduce health disparities and achieve health equity.15 In 2010, the U.S. Department of Health and Human Services Office of Minority Health awarded Pennsylvania a three year grant to increase support of community programs working to eliminate health disparities and increase the number of minority professionals and physicians providing care to underserved and underrepresented populations throughout Pennsylvania.16 Educational institutions in the state are also working to study and improve health equity across Pennsylvania. For example, the Center for Health Equity at the University of Pittsburgh is working to understand and reduce health disparities in underserved populations, particularly those in Western Pennsylvania, through research and education, and by providing capacity building services to community organizations in the region.17
State Economy
Pennsylvania’s economy continues to recover after the recession. As of December 2015, Pennsylvania had a lower unemployment rate (4.8%) than the national average (5%).18 In 2014, Pennsylvania’s total state Gross Domestic Product (GDP) was $658 billion, making it the 6th largest economy in the country. Pennsylvania also experienced a 3.4% increase in its GDP between 2013 and 2014, less than the national average of 4.1% growth. The health care and social assistance sectors are major contributors to the state economy, accounting for over one-tenth of the total increase in GDP between 2013 and 2014. Government is another major contributor to the state’s economy accounting for 11% of the Pennsylvania’s GDP in 2014.19
Figure 3: Budget Expenditures by Funding Source for Pennsylvania, SFY 2014
Health Coverage Programs in Pennsylvania’s Budget
Medicaid spending accounted for one-third of total state budget spending in SFY 2014 (Figure 3). Medicaid is the second largest category of state general fund spending behind elementary and secondary education and is the single largest source of federal funds flowing into the state.20 Medicaid costs are shared by the state and the federal government, with the federal government paying more than half (54%) of the cost of Pennsylvania Medicaid. For every dollar that Pennsylvania spends on Medicaid, the federal government sent $1.15 in matching funds to the state in fiscal year 2014.21
While a majority of Medicaid enrollees in Pennsylvania are children and nonelderly adults, the elderly and people with disabilities account for most of the program’s expenditures. As of fiscal year 2011, children made up 44% of Medicaid enrollees in Pennsylvania but accounted for about one-fifth (18%) of total Medicaid expenditures (Figure 4). Elderly people and people with disabilities accounted for just over one-third (35%) of enrollees but 72% of total program costs. Average spending per beneficiary in Pennsylvania was $7,811, the fifth highest in the Northeast and much higher than the national average of $5,790 (Figure 5).
Figure 4: Medicaid Enrollment and Expenditures, FY 2011
Health Coverage in Pennsylvania
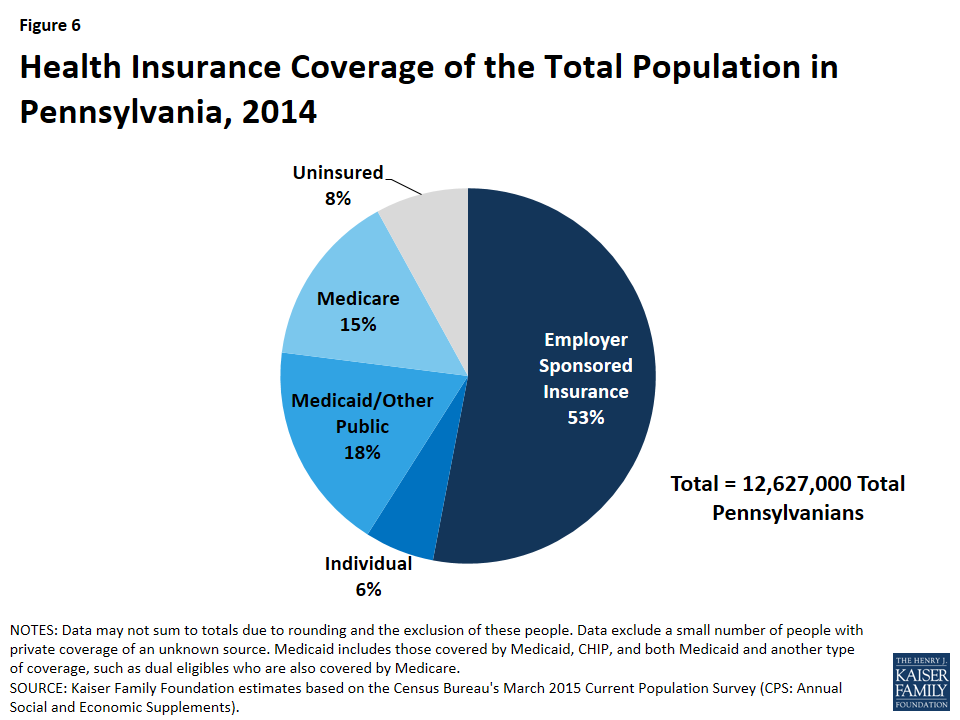
In 2014, 92% of all Pennsylvanians had health insurance (Figure 6). Almost six in ten (59%) Pennsylvanians were covered under private health insurance, with 53% of Pennsylvanians covered by employer sponsored insurance and the remaining 6% covered by individual22 coverage. Almost one fifth (18%) were covered by Medicaid or other public coverage, and less than one in ten (8%) of all Pennsylvanians were left uninsured.
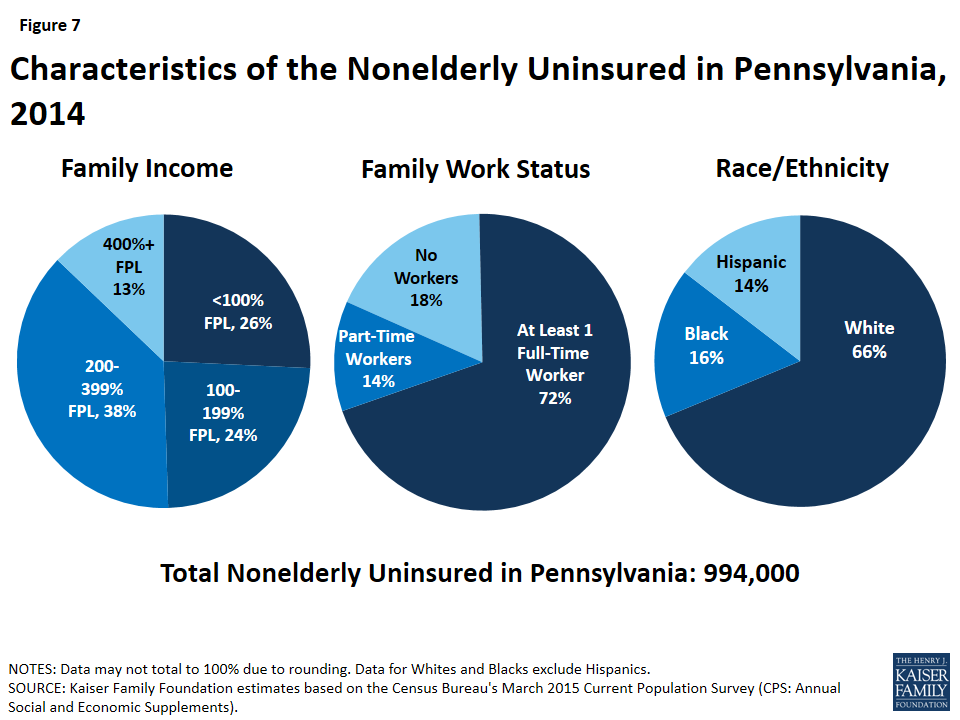
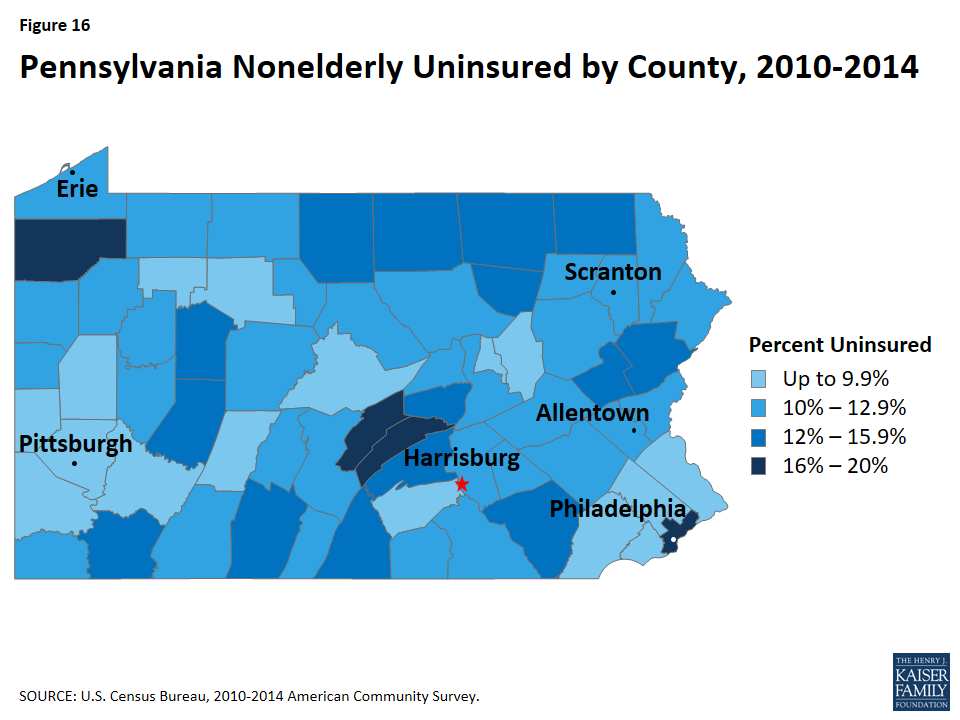
Individuals who remained uninsured in 2014 were primarily low-income, in working families, and White non-Hispanic. Because most elderly Pennsylvanians are covered by Medicare, most uninsured are nonelderly (under age 65). The majority of nonelderly uninsured Pennsylvanians in 2014 had at least one full-time worker in their household (72%) and had income below 400% of the FPL (88%). Two-thirds (66%) of nonelderly uninsured Pennsylvanians identified as White, 16% identified as Black, 14% identified as Hispanic (Figure 7). Additionally, Figure 16 (Appendix) demonstrates that the uninsured rate varies across counties in Pennsylvania.
Figure 5: Average State Medicaid Spending per Beneficiary Among States in the Northeast Region, FY 2011
15% of Pennsylvanians, almost two million beneficiaries, were enrolled in Medicare in 2014.23 Medicare consists of four parts: Part A, Part B, Part C, and Part D. Together considered traditional Medicare, Part A covers inpatient hospital and skilled nursing facility stays, some home health visits, and hospice care, and Part B covers physician visits, outpatient services, preventive services, and some home health. In 2014, 904,000, or 39%, of Pennsylvania’s Medicare beneficiaries are enrolled in a private plan through Part C, also known as Medicare Advantage.24,25 Medicare Part D covers outpatient prescription drugs through private plans that contract with Medicare, including both stand-alone prescription drug plans (PDPs) and Medicare Advantage drug plans (MA-PD plans). Today, over one million Pennsylvanians are currently enrolled in a PDP.
Children in Pennsylvania with family incomes above Medicaid eligibility levels26 are covered through the state’s separate CHIP program. In 1992, House Bill 20, the Children’s Health Insurance Act, created Pennsylvania’s Children’s Health Insurance Program (CHIP).27 This program was used as the model for the federal government’s State Children’s Health Insurance Program (SCHIP) program created in 1997. In Pennsylvania, families with incomes above 208% FPL are required to pay premium and co-payment amounts as determined by the state for children enrolled in CHIP.28 As required by the ACA, the state increased Medicaid eligibility limits in 2014 for all children, regardless of age, causing some children enrolled in CHIP coverage to be moved to Medicaid coverage. These children are called “stair-step kids” and are still funded at CHIP levels.29
Figure 6: Health Insurance Coverage of the Total Population in Pennsylvania, 2014
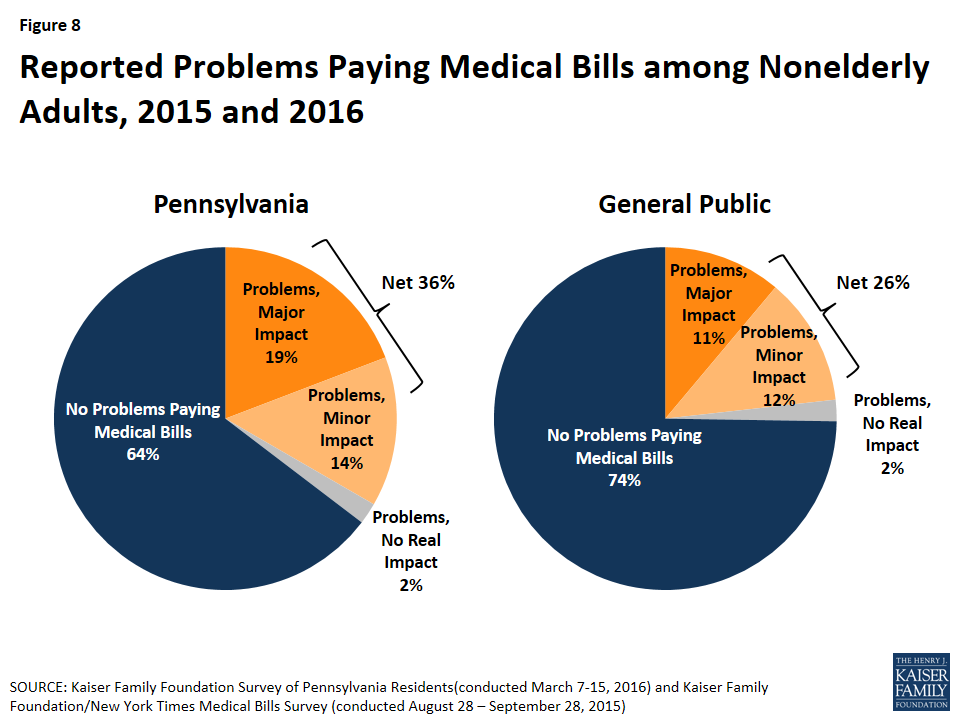
Pennsylvanians were more likely to report difficulty affording health care and problems with medical bills compared to the US overall. Over half (52%) of Pennsylvanians surveyed reported that it was very or somewhat difficult for their family to afford health care, versus 42% in the U.S. overall. Among Pennsylvanians with insurance, 21% reported that deductibles and 18% reported that premiums posed the greatest financial burden. These shares were higher than for the US overall, where 17% said deductibles and 14% said premiums were the biggest financial burden. Relatedly, Pennsylvanians were more likely to report skipping or delaying health care, including skipping dental care or check-ups, not filling a prescription, or relying on home remedies/over the counter drugs instead of visiting the doctor, due to cost than the general public (57% vs. 50%). Pennsylvanians were also more likely to report problems paying medical bills compared to the general public (36% vs. 26%) (Figure 8).30
Implementation of the Affordable Care Act in Pennsylvania
Figure 7: Characteristics of the Nonelderly Uninsured in Pennsylvania, 2014
A main goal of the ACA was to decrease the number of uninsured people, including many of the 1.2 million Pennsylvanians who were uninsured prior to ACA implementation. The ACA accomplished this through market insurance reforms and by establishing new coverage pathways, including providing premium subsidies to most individuals with incomes up to 400% FPL to purchase coverage on the Health Insurance Marketplace and an expansion of Medicaid to cover nearly all nonelderly adults up to 138% FPL ($16,394 per year for an individual or $27,820 for a family of three in 2016). The Supreme Court decision on the ACA’s constitutionality effectively made the adult Medicaid expansion a state option.31
Pennsylvania implemented the ACA in two parts: the health insurance Marketplace in January 2014 and the Medicaid expansion in January 2015. Former-Governor Tom Corbett elected to have the state implement the Medicaid expansion on January 1, 2015 through a Section 1115 waiver. After taking office in January 2015, current Governor Tom Wolf continued the implementation under a traditional Medicaid expansion rather than the previously negotiated waiver.
Figure 8: Reported Problems Paying Medical Bills among Nonelderly Adults, 2015 and 2016
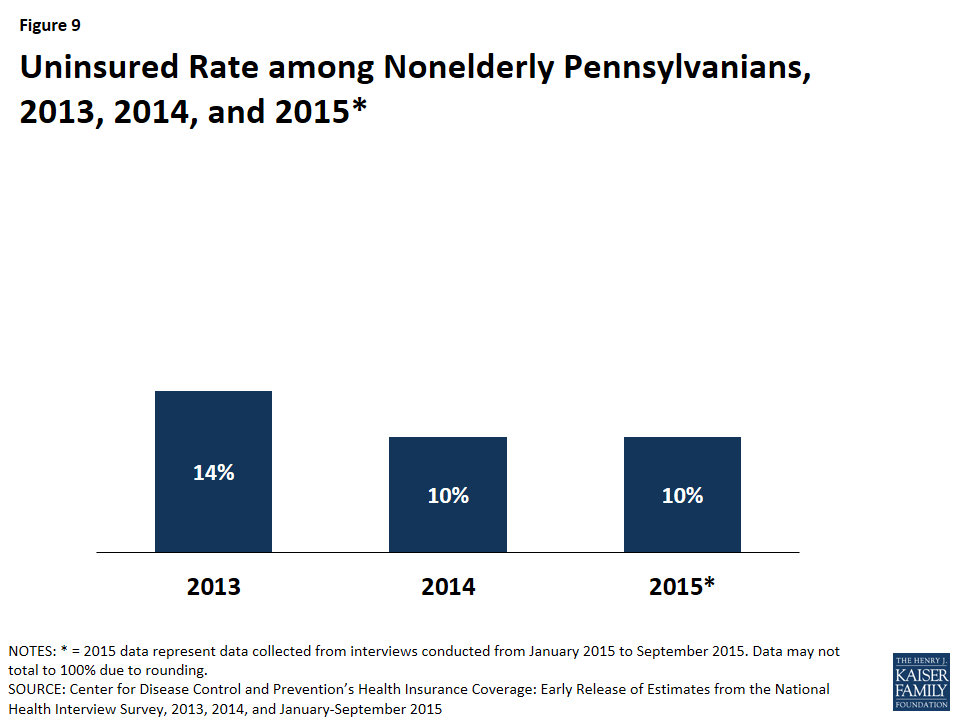
Following implementation of the ACA, the uninsured rate in Pennsylvania decreased from 14% in 2013 to 10% in 2015 (Figure 9). Most of this decrease occurred between 2013 and 2014, coinciding with the availability of Marketplace coverage. Within the nonelderly population, nonelderly adults (adults aged 18-64) saw a large decrease in their uninsured rate, reflecting that changes in coverage under the ACA were implemented to increase coverage for this population. Between 2013 and 2015, the uninsured rate for nonelderly adults decreased 5 percentage points from 16% to 11%.
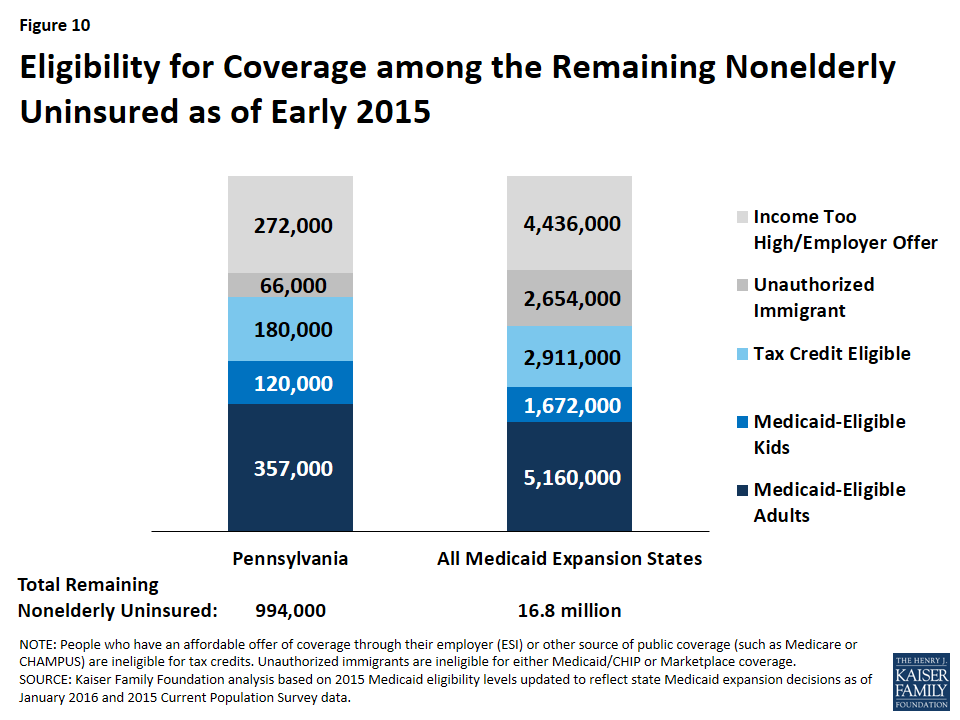
Compared to Medicaid expansion states as a whole, a higher share of uninsured Pennsylvanians remain eligible for coverage as of early 2015, reflecting that Pennsylvania implemented the Medicaid expansion a year after most other states. Sixty-six percent of the uninsured in Pennsylvania were eligible for some financial assistance to obtain health coverage, compared to 58% in all Medicaid expansion states (Figure 10). In Pennsylvania, almost one in five (18%) were eligible for premium tax credits to help them purchase private coverage in the Marketplace, and nearly half (48%) were eligible for Medicaid and CHIP.32 The majority of individuals eligible for Medicaid are adults, reflecting the increased eligibility levels afforded by the Medicaid expansion.
Figure 9: Uninsured Rate among Nonelderly Pennsylvanians, 2013, 2014, and 2015*
As part of the ACA, all states are required to implement new, simplified eligibility and enrollment processes, and Pennsylvania has made progress in implementing some of these changes. As of January 2016, individuals in Pennsylvania can apply for both Medicaid and Health Insurance Marketplace coverage through multiple pathways, including in-person, over the phone, by mail, and online.33 There is room for improvement in processing applications in that the state reports that less than 25% of application determinations are being completed in real-time and less than 25% of renewals are completed using ex-parte strategies. 34 Focus group participants in March 2016 who had applied for Medicaid coverage through the state’s online portal, COMPASS, reported the process was quick and the system was easy to navigate.35
Health Insurance Marketplace
Pennsylvanians are able to shop for health plans through HealthCare.gov, the federal Health Insurance Marketplace. Pennsylvania is one of 34 states in which the federal government has established and is running the Health Insurance Marketplace.36 Premiums for Marketplace coverage vary across Pennsylvania, but all remain below the national average (Figure 11). Focus group participants with Marketplace coverage in Pennsylvania were positive about their ACA coverage and grateful for health insurance. However, they had difficulty weighing plan options, including the impact of tiered insurance networks, with many reporting having to switch plans every year. Marketplace participants also reported that they struggled with out-of-pocket costs and the financial impacts of medical bills. 37
Figure 10: Eligibility for Coverage among the Remaining Nonelderly Uninsured as of Early 2015
On February 1, 2016, at the end of the Marketplace’s third open enrollment period, 439,000 Pennsylvanians had selected a Marketplace plan, three quarters (75%) of whom were eligible for premium subsidies to purchase coverage.38 One third (33%) of Marketplace enrollees in Pennsylvania were under age 35.39 Over one third (37%) of Pennsylvanians enrolled in Marketplace coverage were new customers, down from 41% during the Marketplace’s second open enrollment period.40 Among all states, Pennsylvania had the 14th largest share of the potential Marketplace population enrolled in a Marketplace plan as of February 2016 (49% vs. 46% in the US) and was tied with Vermont with the fifth largest share in the Northeast, above Connecticut, Rhode Island, and New York (Figure 12).
Support for outreach and enrollment in Pennsylvania is being provided by the federal government and private organizations. In 2015, six organizations received $3.1 million in navigator grant funds from the federal government to provide enrollment assistance to consumers in the state (Table 3). Two of these six organizations, Pennsylvania Mental Health Consumers’ Association (PMHCA) and Pennsylvania Association of Community Health Centers (PACHC), operate statewide and have been awarded grants for all three open enrollment periods.41 Since 2013, federal funding for consumer assistance in Pennsylvania has increased by over $400,000 and the number of organizations increased from four to six.
Table 3: Navigator Grant Recipients, their Funding Levels, and Percent of Total Grants Distributed, 2013-2015
Organization
2013 Funding
2014 Funding
2015 Funding
Total Funding Level
$2,709,185
$2,407,734
$3,123,494
Consumer Health Coalition
—
$505,000
$727,118
Mental Health America (MHA)
$547,754
—
—
National Healthy Start Association
—
$163,166
—
Penn Asian Senior Services
—
$255,000
$290,061
Pennsylvania Association of Community Health Centers (PACHC)
$739,005
$809,943
$946,649
Pennsylvania Mental Health Consumers’ Association (PMHCA)
Figure 11: Benchmark Silver Premiums for a 40 Year Old Before Subsidies in the U.S. and around Pennsylvania, 2015 and 2016
Pennsylvania is one of 32 states currently adopting the ACA Medicaid expansion.42 While most states implemented the Medicaid expansion on January 1, 2014, former Governor Tom Corbett received approval in August 2014 to implement the Medicaid expansion through a Section 1115 demonstration called Healthy Pennsylvania. Coverage under the waiver became effective January 1, 2015. However, newly-elected Goveror Tom Wolf announced in February 2015 that Pennsylvania would withdraw the Healthy Pennsylvania waiver and related benefit change requests from Centers for Medicare and Medicaid Services (CMS) and instead implement a traditional Medicaid expansion called Health Choices. The transition from Healthy Pennsylvania to Health Choices was completed in the summer of 2015.43
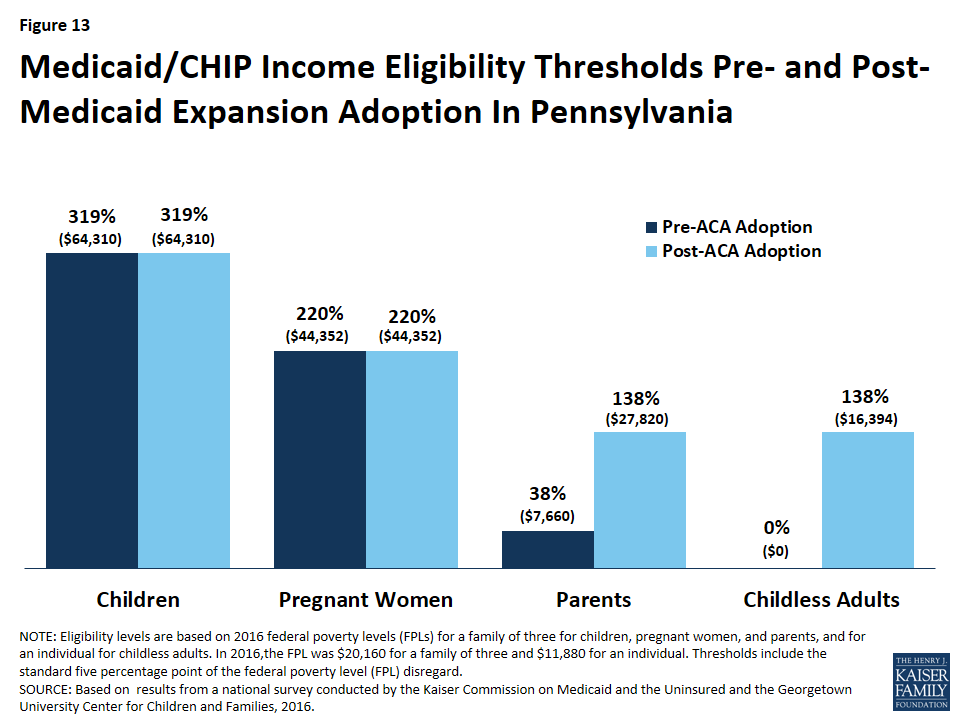
With the adoption of the Medicaid expansion, eligibility levels for parents and childless adults have increased (Figure 13). As a result of the coverage expansion on January 1, 2015, Pennsylvania increased parent eligibility from 38% of the federal poverty level (FPL) in 2014 to 138% FPL in 2015. Similarly, eligibility levels for childless adults increased from 0% to 138% FPL. Eligibility levels for children and pregnant women remain higher at 319% FPL (through a separate CHIP program) and 220% FPL, respectively.
Figure 12: Number of Individuals Selecting a Marketplace Plan, as a Share of the Potential Marketplace Population in Northeastern States, as of February 2016
Between Summer 2013 and January 2016, Medicaid enrollment in Pennsylvania increased by 15%, or over 368,000 individuals.44 The majority of that increase (239,200 individuals) occurred between December 2014 and June 2015 as a result of the Medicaid expansion that took effect January 1, 2015 in Pennsylvania. While children remain a substantial share of total enrollment, the share of children has decreased from 53% of total enrollment in December 2014 to 49% in January 2016.45
Focus group participants in March 2016 reported positive experiences with their Medicaid coverage. Specifically, they reported being able to find doctors and access needed care and noted that costs were minimal with Medicaid, which was important to them because they felt they had no capacity to take on new costs. 46
Delivery System and the Safety Net
Pennsylvania is in the process of reforming its payment and delivery system to promote new care delivery models focused on multi-payer approaches with patient, provider and payer interest. In February 2013, Pennsylvania was awarded a $1.5 million State Innovation Model (SIM) Model Design grant by CMS to develop a State Health Care Innovation Plan that would improve care quality and reduce costs for patients and emphasize population health management and coordination with public health and social supports.47 Implementing and expanding new payment models, such as Accountable Provider Organizations (APO) and Patient-Centered Medical Homes (PCMH), would allow the state to provide “super-utilizers” with the appropriate services through community-based care teams.48 Pennsylvania plans to expand its use of telemedicine to bring outpatient and inpatient care to underserved and rural parts of the state. The state also plans to expand its use of health information technology and data usage to improve provider performance, allow insurers to track accountability and modify payment, and inform consumer’s provider choices. By creating a Healthcare Transformation Support Center that will provide training courses, including medical home training, and disseminate best practices to providers throughout the state, the state plans to strengthen the workforce. It also plans to use the enhanced telemedicine infrastructure to create the Pennsylvania Health Learning Network, which will provide primary care physicians with access to trainings and consulting services with specialists on complex patients. In December 2014, the state was awarded another $3 million SIM Model Design grant to continue refining the plan proposed in Round One.49
Figure 13: Medicaid/CHIP Income Eligibility Thresholds Pre- and Post- Medicaid Expansion Adoption In Pennsylvania
Large provider organizations play important roles in both insuring patients and delivering care to Pennsylvanians. Geisinger Health System in northeast and central Pennsylvania and the University of Pittsburgh Medical Center (UPMC) in western Pennsylvania are both health care systems that expanded into providing insurance, including Medicaid managed care plans, in their respective geographic locations. Geisinger Health System is a physician-led fully integrated health services organization that serves over 3 million residents across 48 counties in Pennsylvania and insures almost 493,000 people through Geisinger Health Plan.50 In 2007, Geisinger expanded into research by opening its Center for Health Research to investigate a wide range of subjects including obesity, chronic rhinosinusitis, overactive bladder, and veterans’ mental health.
Most Medicaid beneficiaries are enrolled in managed care plans for physical health. In Pennsylvania, 70% of the total Medicaid population are enrolled in one of the state’s nine managed care plans.51 Of the nine managed care plans, five are owned by a multi-state parent firm, including three owned by Independence Blue Cross and one owned by Aetna.52 Almost half (49%) of Medicaid MCO beneficiaries in Pennsylvania are enrolled in a plan owned by a multi-state parent firm.53 Additionally, two plans are run by local health care systems, Geisinger Health Plan and UPMC Health Plan, Inc. Together, these two plans insure one quarter (25%) of Pennsylvania Medicaid beneficiaries enrolled in a managed care plan. Behavioral health services in Pennsylvania are administered through county Mental Health and Developmental Services (MH/DS) program offices. These offices serve as a referral source, and most services are delivered by plans and local providers that contract with the county.54
In July 2015, after releasing a request for information (RFI), Pennsylvania received public comments and responses to help the state develop new procurements for the provision of Medicaid managed care for physical health. As a result, the state plans to incorporate ways to improve coordination between physical and behavioral health services, expand value-based purchasing and team-based approaches to care delivery, and promote community-based public health initiatives into the managed care contracts.55
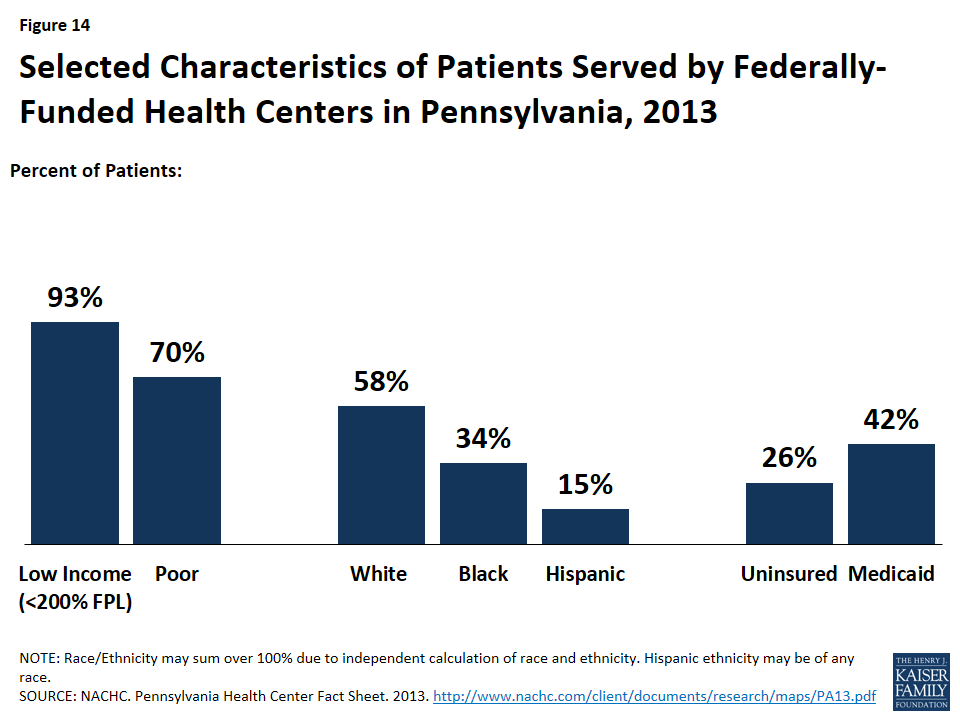
Figure 14: Selected Characteristics of Patients Served by Federally-Funded Health Centers in Pennsylvania, 2013
Pennsylvania’s safety net providers continue to play an important role in delivering health care to the state’s vulnerable populations. Pennsylvania’s community health centers and hospitals provide access to primary, preventive, and acute care services for low-income and underserved residents. Pennsylvania is home to 40 federally qualified health centers (FQHCs), which operate 257 sites throughout the state. In 2013, the state’s FQHCs saw over 680,000 patients and provided nearly 2.3 million patient visits.56 Over a quarter (26%) of their patients were uninsured and 42% had Medicaid coverage (Figure 14). Nearly all (93%) had incomes below 200% FPL, including about three-quarters (70%) who had income below the federal poverty level.
Following national trends, Pennsylvania continues to shift toward community, rather than institutional, long term services and supports (LTSS). In FY 2013, Pennsylvania’s Medicaid program spent $8.3 billion on LTSS, devoting approximately 42%, or $3.5 billion, to home and community-based services (HCBS).57 The share of LTSS dollars that have been devoted to HCBS increased from 30% in FY 2008 to 42% in FY 2013, which mirrors a national shift toward serving more people in home and community-based settings rather than institutions. This is due in large part to beneficiary preferences for HCBS, the fact that HCBS typically are less expensive than comparable institutional care, and states’ community integration obligations under the Supreme Court’s Olmstead decision.58
In December 2014, the State’s Long-Term Care Commission released a summary of Medicaid and state-only funded LTSS programs for older adults and adults with physical disabilities, as well as several recommendations for improving care coordination, service delivery, quality, outcomes, and fiscal sustainability, in its final report.59 In February 2015, through a combination of executive, budget and legislative actions, Governor Wolf announced a joint initiative between the Department of Human Services and the PA Department of Aging that would “provide choices for seniors, efficiencies in home and community-based care delivery, and protections so that seniors receive the high quality of care that they seek in their homes.”60 Other rebalancing initiatives taken up by the state include the Medicaid Money Follows the Person Demonstration and Balancing Incentive Program, which are both time-limited and offer enhanced federal funding.61 As recommended in the Commission’s final report, the State plans to implement Medicaid managed LTSS for seniors in 2016, which has historically been covered under fee-for-service.
There are unmet needs for care in Pennsylvania. As of April 2014, Pennsylvania had 159 primary care Health Professional Shortage Areas (HPSA), and 64% of the primary health care need in Pennsylvania was being met.62 The state had 116 mental health and 160 dental HPSAs, and about 60% of the need for mental health care and 40% of the need for dental services was being met. As of 2014, Pennsylvania ranked 4th in the country for the ratio of medical students to 100,000 population (63.5 in Pennsylvania, compared to 30.3 nationally).63 However, Pennsylvania ranked 36th among states in the percentage of physicians completing graduate medical education in the state who remain in-state to practice (41%). Pennsylvania is one of 17 states with licensure laws that limit the autonomy of nurse practitioners in at least one area of practice.64
Looking Ahead
With 12.7 million inhabitants, health coverage and care decisions Pennsylvania make will continue to have important implications for the national healthcare landscape. Individuals who have gained coverage in the Marketplace and through Medicaid are continuing to interact with their new health plans and seek care. Meanwhile, the health care system in Pennsylvania, like all states, is evolving and changing to meet new demands as providers adapt to the changing health coverage landscape. Additionally, as more individuals gain coverage, it will be interesting to see how Pennsylvania grapples with insurance and care affordability issues Pennsylvanians have reported. As the Medicaid expansion in Pennsylvania continues in its second year of implementation, Pennsylvania will continue to enroll individuals who were previously uninsured but now eligible, and the way Pennsylvanians access care will continue to shift in the coming years.
APPENDIX
Figure 15: Pennsylvania Nonelderly Population by County, 2010-2014Figure 16: Pennsylvania Nonelderly Uninsured by County, 2010-2014
The Kaiser Family Foundation’s State Health Facts. Data Source: Kaiser Family Foundation estimates based on the Census Bureau’s March 2015 Current Population Survey (CPS: Annual Social and Economic Supplement). Accessed February 10, 2016. “Total Number of Residents,” https://modern.kff.org/other/state-indicator/total-residents/. ↩︎
US Census Bureau, 2010-2014 American Community Survey, County Total Population Estimates. ↩︎
Counties in the Appalachia region include both rural and urban counties. For more information see, Appalachian Regional Commission, Pennsylvania Counties in Appalachia, (February 17, 2016), http://www.arc.gov/appalachian_region/Pennsylvania.asp. ↩︎
The Centers for Disease Control and Prevention (CDC), National Center for Health Statistics, Division of Vital Statistics, National Vital Statistics Reports (NVSR) Volume 64, Number 2, Table 19, http://www.cdc.gov/nchs/data/nvsr/nvsr64/nvsr64_02.pdf. ↩︎
The Centers for Disease Control and Prevention (CDC), National Center for Health Statistics, Division of Vital Statistics, National Vital Statistics Reports (NVSR) Volume 64, Number 2, Table 19, http://www.cdc.gov/nchs/data/nvsr/nvsr64/nvsr64_02.pdf. ↩︎
Medicare Advantage beneficiaries can enroll in a private health plan, such as a health maintenance organization (HMO) or preferred provider organization (PPO), and receive all traditional Medicare-covered benefits covered under traditional Medicare and typically Part D benefits. ↩︎
Medicaid eligibility for infants up to age one is 220% FPL; children between one and six years of age is 162% FPL; and children over age six is 138% FPL. ↩︎
Pennsylvania (State). Legislature. House. No. 1992-113 Children’s Health Care Act. (HB 20). Session of 1992 (December 2, 1992). Commonwealth of Pennsylvania Legislative Reference Bureau. Web. 6 April 2015. ↩︎
Medicaid eligibility for infants up to age one increased from 185% FPL in 2013 to 220% FPL in 2014; eligibility for children between one and six years of age increased from 133% FPL in 2013 to 162% FPL in 2014; and eligibility for children over age six increased from 100% FPL in 2013 to 138% FPL in 2014. ↩︎
KCMU analysis based on 2015 Medicaid eligibility levels updated to reflect state Medicaid expansion decisions as of January 2016 and 2015 Current Population Survey data ↩︎
Ibid. Real-Time Eligibility Determinations: determining the eligibility of an individual within 24 hours. Ex parte Renewals: re-determining eligibility at renewal using electronic data matches with reliable sources of data prior to requiring enrollees to complete a renewal form. ↩︎
Focus groups were conducted by Kaiser Family Foundation in March 2016 with low-income Medicaid and Marketplace enrollees to learn about their experiences with their coverage. Medicaid focus group held in Philadelphia; Marketplace groups in Philadelphia and Harrisburg. ↩︎
Focus groups were conducted by Kaiser Family Foundation in March 2016 with low-income Medicaid and Marketplace enrollees to learn about their experiences with their coverage. Medicaid focus group held in Philadelphia; Marketplace groups in Philadelphia and Harrisburg. ↩︎
Health Insurance Marketplaces 2016 Open Enrollment Period: Final Enrollment Report for the period: November 1, 2015 – February 1, 2016, Office of the Assistant Secretary for Planning and Evaluation (ASPE), Department of Health and Human Services (HHS), March 11, 2016, https://aspe.hhs.gov/sites/default/files/pdf/187866/Finalenrollment2016.pdf
Addendum to the Health Insurance Marketplaces 2016 Open Enrollment Period: Final Enrollment Report for the period: November 1, 2015 – February 1, 2016, Office of the Assistant Secretary for Planning and Evaluation (ASPE), Department of Health and Human Services (HHS), March 11, 2016, https://aspe.hhs.gov/sites/default/files/pdf/188026/MarketPlaceAddendumFinal2016.pdf↩︎
According to ASPE’s January 2016 Enrollment Report: “New Consumers” are those individuals who selected a 2016 Marketplace medical plan (with or without the first premium payment having been received directly by the issuer) as of the reporting date, and did not have a Marketplace plan selection as of November 2015. ↩︎
Focus groups were conducted by Kaiser Family Foundation in March 2016 with low-income Medicaid and Marketplace enrollees to learn about their experiences with their coverage. Medicaid focus group held in Philadelphia; Marketplace groups in Philadelphia and Harrisburg. ↩︎
The Olmstead decision found that the unjustified institutionalization of persons with disabilities violates the Americans with Disabilities Act. Olmstead v. L.C. 527 U.S. 581 (1999), http://www.law.cornell.edu/supct/html/98-536.ZS.html. ↩︎
The Affordable Care Act created the Balancing Incentive Program to provide financial incentives to states to implement certain structural reforms to increase access to Home and Community Based Services (HCBS) as an alternative to institutional care. Pennsylvania was one of 21 states approved to participate in the Balancing Incentive Program (State Health Facts, Balancing Incentive Program (Kaiser Family Foundation, Oct. 2015), https://modern.kff.org/medicaid/state-indicator/balancing-incentive-program/). ↩︎
Bureau of Clinician Recruitment and Service, Health Resources and Services Administration (HRSA), U.S. Department of Health & Human Services, HRSA Data Warehouse: Designated Health Professional Shortage Areas Statistics, as of April 28, 2014, https://datawarehouse.hrsa.gov/Tools/HDWReports/Reports.aspx↩︎
In his latest column for The Wall Street Journal’s Think Tank, Drew Altman analyzes the Kaiser Health Policy News Index to determine which health stories in the news have broken through to the public the most in the last year. One conclusion: It wasn’t the Affordable Care Act.
The U.S. has a long history of supporting global efforts to improve nutrition and is the largest donor to nutrition efforts in the world. Most of the government’s effort in this area operates at the nexus of its global health, Feed the Future (FtF), and Food for Peace (FFP) programs. Between FY10 and FY16, the U.S. Congress provided nearly $1.5 billion for nutrition activities, and funding in FY16 was an estimated $229 million; the budget request for FY17 includes $243 million (see Table 1 and Figure 1).1 Other U.S. global health and development programs provide some direct nutrition support, such as PEPFAR and the MCC, though such amounts are only available for select years. Beyond this direct support for nutrition (“nutrition-specific activities”), the U.S. also provides significant resources that address the underlying and systemic causes of malnutrition (“nutrition-sensitive activities”), estimated to have totaled $2.2 billion in 2013.2 This brief provides an overview of U.S. support for nutrition including trends in funding and top country recipients and places the U.S. within the larger context of overall donor support for the sector.
Introduction
The U.S. has a long history of supporting global efforts to improve nutrition and address the underlying causes of malnutrition, and is the largest donor to nutrition efforts in the world. Most of the government’s effort in this area is conducted through its global health, FtF, and FFP programs, operated by the U.S. Agency for International Development (USAID) and focused in 19 countries.3 Nutrition interventions include management of malnutrition, direct supplementation of minerals and nutrients, the promotion of breastfeeding and other activities. Beyond direct support for nutrition, also called “nutrition-specific activities”, which aim to address immediate nutrition needs, the U.S. also provides support for “nutrition-sensitive activities”, areas that have an impact on its overall nutrition goals, including, for instance water, sanitation, and hygiene (WASH) programs, agricultural activities, and girls’ and women’s education. In 2014, USAID released a nutrition strategy to guide efforts between 2014 and 2025.4 The strategy aims to reduce malnutrition globally through a multi-sectoral approach that works across programs and agencies to identify and promote a wider range of nutrition efforts – both those that are nutrition-specific as well as nutrition sensitive.
Overview of Funding Trends
Historically, funding for global nutrition efforts was included within broader maternal and child health (MCH) funding, and was not specifically delineated. However, in FY10 the Obama Administration created a nutrition-specific funding line, elevating attention to these resources. Between FY10 and FY16, the U.S. Congress provided nearly $1.5 billion for nutrition activities and in FY16, funding was an estimated $229 million; still, funding for nutrition accounts for a relatively small share of the total U.S. global health budget (approximately 2%) (see Figure 2). Other U.S. global health and development programs provide some direct nutrition support, such as PEPFAR and the MCC, though such amounts are only available for select years. In addition, funding for nutrition-sensitive activities are not included in nutrition totals. Both nutrition-specific and nutrition-sensitive funding are described below.
Nutrition-Specific Funding
In FY10, the first year in which nutrition funding was delineated, total specified funding was $213 million. Since then, funding for nutrition has fluctuated, including decreases in some years. Estimated nutrition funding in FY16 is $229 million, the highest level to date, and an 8% increase over FY10 levels. The President’s FY17 budget request includes $243 million for nutrition activities, which would represent a $13 million increase (6%) above the FY16 estimated level. All nutrition-specific funding is provided though bilateral channels.
Of the $219 million in funding in FY15 (the most recent year for which detailed funding by account and country are available), the majority ($115 million or 52%) was provided through the Global Health Programs (GHP) account, and $82 million (37%) was provided through the FFP account, with the remaining amount provided through other the Economic Support Fund (ESF) and Development Assistance (DA) accounts (see Table 1). Twenty countries received nutrition funding in FY15 under the GHP account, while thirteen countries received nutrition funding under the FPP program (seven countries received funding under both the GHP account and through FFP). The 19 nutrition priority countries received $134 million in FY15, accounting for more than 60% of total nutrition funding.5 The top recipient of funding in FY15 was Bangladesh ($27.0 million), followed by Afghanistan ($21.2 million), Uganda ($18.0 million), Burundi ($11.5 million), and Democratic Republic of the Congo ($11.3 million) (see Table 2).
In addition to these amounts, data for direct nutrition support provided though other U.S. global health and development programs are only available for select years. For example, PEPFAR requested $13.5 million for HIV-related nutrition activities in FY17 and the MCC’s five-year compact with Indonesia includes $131.5 million for the “Community-Based Health and Nutrition to Reduce Stunting Project.”
Nutrition-Sensitive Funding
Funding for nutrition-sensitive activities, those that address the underlying causes of malnutrition and have an impact on its overall nutrition goals, is provided through multiple programs and initiatives, including FtF, FFP, MCC, McGovern-Dole International Food for Education and Child Nutrition Program, and contributions to the Global Agriculture and Food Security Program (GAFSP). Some of these programs include funding for both nutrition-specific and nutrition-sensitive activities. For instance, while FtF and FFP support nutrition-specific activities, the majority of their funding is directed towards nutrition-sensitive efforts. Other areas and programs highlighted in USAID’s Multi-Sectoral Nutrition Strategy as being nutrition-sensitive include: family planning; WASH; food safety and food processing; early childhood care and development; girls’ and women’s education; and economic strengthening, livelihoods, and social protection. USAID has worked to develop a methodology – in partnership with other donors through the Scale Up Nutrition (SUN) Movement – to provide a more comprehensive assessment of total resources provided for both nutrition-specific and nutrition-sensitive efforts.6 In 2013, it is estimated that U.S. nutrition-sensitive activities totaled approximately $2.2 billion.7
The United States in Context: International Donor Assistance for Nutrition
The U.S. is the single largest donor to nutrition efforts in the world.8,9 In 2014, the most recent year for which data are available, donor governments provided $936.6 million to support bilateral nutrition programs in low- and middle-income countries, a slight decline compared to 2013 ($948.8 million), which was the highest level to date (see Figure 3). The U.S. was the single largest bilateral donor in 2014, providing $225.5 million and accounting for almost a quarter (24%) of total bilateral funding (see Figure 4). Canada ($159.3 million, 17%) was the second largest bilateral donor, followed by the E.U. (US$111.4 million, 12%), the U.K. (US$92.6 million, 10%), and the World Bank (US$83.6 million, 9%).
Figures & Tables
Table 1. U.S. Government Funding for Nutrition-Specific Programs, by Account, in Millions, FY10-FY17 Request
2010
2011
2012
2013
2014
2015
2016
2017Request
Nutrition
$213.3
$196.9
$190.6
$217.2
$203.4
$219.4
$229.4
$242.5
Global Health Programs (GHP)
$70.5
$89.8
$95.0
$95.1
$115.0
$115.0
$125.0
$108.5
Economic Support Fund (ESF)
$26.6
$3.0
$2.0
$2.3
$23.7
$21.2
$21.2
$36.5
Development Assistance (DA)
$3.6
—
—
—
—
$1.0
$1.0
$9.9
Food for Peace (FFP)
$112.6
$104.0
$93.6
$119.8
$64.7
$82.3
$82.3
$87.6
Notes: Represents planned nutrition-specific funding. Additional nutrition-specific funding provided through other global health and development programs (e.g. PEPFAR and MCC) is not included due to limited availability of data. FY10-FY15 are final funding levels. FY13 includes the effects of sequestration. FY16 is a preliminary estimate (FY16 nutrition funding provided through the ESF and DA accounts is determined at the agency level and is not yet known for FY16; for comparison purposes, FY16 funding totals through these accounts are based on prior year levels). FY17 is the President’s budget Request.Source: Kaiser Family Foundation analysis of data from the Office of Management and Budget, Agency Congressional Budget Justifications, Congressional Appropriations Bills, and the U.S. Foreign Assistance Dashboard (www.foreignassistance.gov; accessed April, 2016).
Figure 1: U.S. Global Nutrition Funding, FY 2010-FY 2017 RequestFigure 2: U.S. Global Health Funding, By Sector, FY 2016Figure 3: Nutrition ODA Disbursements, 2010-2014Figure 4: Top Donors for Nutrition ODA, 2014
Table 2. U.S. Government Funding for Nutrition-Specific Programs, by Country & Region, in Millions, FY10-FY15
2010
2011
2012
2013
2014
2015
Country Total
$192.5
$180.1
$173.6
$199.4
$184.2
$202.4
Afghanistan
$1.3
$2.5
$2.0
$7.4
$20.0
$21.2
Angola
$0.0
$0.0
$0.0
$1.6
$0.0
$0.0
Bangladesh*
$21.9
$22.4
$25.0
$29.9
$24.0
$27.0
Bolivia
$0.5
$0.0
$0.0
$0.0
$0.0
$0.0
Brazil
$1.3
$0.0
$0.0
$0.0
$0.0
$0.0
Burkina Faso
$0.9
$5.3
$6.2
$4.6
$2.2
$3.4
Burundi
$5.6
$0.0
$0.0
$9.2
$0.0
$11.5
Cambodia*
$1.0
$1.0
$1.0
$1.0
$1.5
$1.5
Chad
$0.0
$0.9
$1.3
$0.1
$0.0
$0.0
Democratic Republic of Congo
$1.1
$3.8
$4.6
$14.1
$11.0
$11.3
Egypt
$3.0
$0.5
$0.0
$0.0
$3.7
$0.0
Ethiopia*
$12.8
$18.4
$14.1
$8.2
$14.9
$9.5
Ghana*
$2.3
$5.4
$6.5
$6.5
$7.0
$7.0
Guatemala*
$19.9
$19.9
$14.4
$10.6
$7.5
$8.7
Haiti*
$25.2
$18.7
$6.6
$2.0
$10.2
$10.2
Honduras*
$1.6
$0.0
$0.0
$0.0
$0.0
$0.0
India
$2.4
$0.5
$0.0
$0.0
$0.0
$0.0
Kenya*
$1.3
$3.0
$2.0
$3.0
$4.0
$4.0
Laos
$0.0
$0.0
$0.0
$0.0
$0.0
$3.0
Liberia*
$1.5
$3.6
$3.6
$3.9
$4.0
$0.0
Madagascar
$4.2
$3.1
$2.4
$0.9
$1.0
$5.0
Malawi*
$7.2
$9.2
$9.4
$9.5
$8.0
$6.9
Mali*
$2.0
$4.2
$5.0
$5.7
$5.0
$7.0
Mauritania
$0.0
$1.4
$1.4
$0.0
$0.0
$0.0
Mozambique*
$7.8
$15.2
$13.9
$5.0
$6.3
$6.3
Nepal*
$3.7
$6.2
$7.0
$6.7
$8.0
$8.0
Nicaragua
$0.7
$0.0
$0.0
$0.0
$0.0
$0.0
Niger
$2.1
$2.4
$12.0
$4.5
$1.0
$1.1
Nigeria
$2.0
$0.0
$0.0
$0.0
$2.5
$2.5
Pakistan
$2.6
$0.0
$0.0
$7.6
$0.0
$0.0
Peru
$0.6
$0.0
$0.0
$0.0
$0.0
$0.0
Philippines
$0.7
$0.0
$0.0
$0.0
$0.0
$0.0
Rwanda*
$2.0
$2.5
$3.0
$3.0
$3.0
$3.0
Senegal*
$1.8
$4.0
$4.5
$4.5
$4.5
$4.5
Sierra Leone
$3.0
$0.0
$3.1
$9.5
$2.7
$1.0
Somalia
$0.0
$0.0
$0.0
$1.9
$0.0
$0.0
South Sudan
$0.0
$1.0
$0.0
$1.9
$0.0
$0.0
Sudan, Pre-2011 Election
$29.9
$0.0
$0.0
$0.0
$0.0
$0.0
Tajikistan*
$0.0
$0.0
$0.0
$1.0
$1.0
$1.0
Tanzania*
$1.5
$6.7
$7.2
$7.2
$7.8
$7.8
Uganda*
$14.2
$14.2
$13.9
$12.8
$11.5
$18.0
West Bank and Gaza
$0.2
$0.0
$0.0
$0.0
$0.0
$0.0
Yemen
$0.0
$0.0
$0.0
$3.8
$0.0
$0.0
Zambia*
$2.9
$4.3
$3.6
$3.6
$4.0
$4.0
Zimbabwe
$0.0
$0.0
$0.0
$8.1
$8.1
$8.1
Regional Total
$2.6
$0.0
$0.0
$1.0
$1.2
$1.2
Africa Regional Office (USAID)
$1.2
$0.0
$0.0
$0.0
$0.0
$0.0
East Africa Regional Office (USAID)
$0.8
$0.0
$0.0
$0.0
$0.0
$0.0
Sahel Regional Program (USAID)
$0.0
$0.0
$0.0
$1.0
$1.2
$1.2
West Africa Regional Office (USAID)
$0.6
$0.0
$0.0
$0.0
$0.0
$0.0
Total
$195.1
$180.1
$173.6
$200.4
$185.4
$203.6
Notes: Represents planned country and regional nutrition-specific funding provided through the GHP, ESF, DA, and FFP accounts. Additional country and regional nutrition-specific funding provided through other global health and development programs (e.g. PEPFAR and MCC) is not included due to limited availability of data. FY10-FY15 are final funding levels. FY13 includes the effects of sequestration. *Represents a USAID nutrition (and Feed the Future) priority country.Source: Kaiser Family Foundation analysis of data from the U.S. Foreign Assistance Dashboard (www.foreignassistance.gov; accessed April, 2016).
Endnotes
With the exception of FY16 and FY17, all funding totals in this analysis represent the final planned funding level for that fiscal year. FY16 is a preliminary estimate (nutrition funding provided through the ESF and DA accounts is determined at the agency level and is not yet known for FY16; for comparison purposes, FY16 funding totals through these accounts are based on prior year levels) and FY17 represents the President’s budget request. ↩︎
USAID. Office of Policy, Planning and Learning, April 2016. ↩︎
USAID’s 19 nutrition priority countries include: Bangladesh, Cambodia, Ethiopia, Ghana, Guatemala, Haiti, Honduras, Kenya, Liberia, Malawi, Mali, Mozambique, Nepal, Rwanda, Senegal, Tajikistan, Tanzania, Uganda, and Zambia. These countries are also the 19 FtF priority countries. ↩︎
USAID. Multi-Sectoral Nutrition Strategy: 2014-2025. May 2014. ↩︎
Of the $115 million in nutrition funding provided through the Global Health Programs (GHP) in FY15, the 19 priority countries received $90 million or 79% of total funding. ↩︎
Scale Up Nutrition. SUN Movement Annual Progress Report. September 2014. ↩︎
USAID. Office of Policy, Planning and Learning, April 2016. ↩︎
Analysis of data obtained via online query of the OECD Development Assistance Committee (DAC) Database and Creditor Reporting System (CRS); April, 2016. Nutrition ODA represents gross US$ disbursements (current dollars) for the “Basic Nutrition” sub-sector (12240) from the OECD CRS database. Additional nutrition funding provided through other sub-sectors (e.g. Food aid/Food security programs) is not included. ↩︎
International Food Policy Research Institute. Global Nutrition Report 2015: Actions and Accountability to Advance Nutrition and Sustainable Development. 2015. ↩︎