CMS’s Final Rule on Medicaid Managed Care: A Summary of Major Provisions

Authors: Julia Paradise and MaryBeth Musumeci
Published: Jun 9, 2016

Executive Summary

On April 21, 2016, the Centers for Medicare & Medicaid Services (CMS) issued final regulations that revise and significantly strengthen existing Medicaid managed care rules. In keeping with states’ increasingly heavy reliance on managed care programs to deliver services to Medicaid beneficiaries, including many with complex care needs, the regulatory framework and new requirements established by the final rule reflect increased federal expectations regarding fundamental aspects of states’ Medicaid managed care programs. Major goals of CMS’ in revising the regulations were to align Medicaid and CHIP managed care requirements with other major health coverage programs where appropriate; enhance the beneficiary experience of care and strengthen beneficiary protections; strengthen actuarial soundness payment provisions and program integrity; promote quality of care; and support efforts to reform the delivery systems that serve Medicaid and CHIP beneficiaries.

The final rule is sweeping in its breadth. Here are ten selected highlights:

Beneficiary support and information. States must establish an independent beneficiary support system that offers choice counseling and information to all enrollees and additional assistance to enrollees who use long-term services and supports (LTSS). Plans must provide up-to-date provider directories and prescription drug formularies to enrollees. Enrollee information must be accessible to people with disabilities and available in locally prevalent non-English languages. States must maintain a managed care website and states and plans can provide information to enrollees electronically.

Enrollment and disenrollment protections. States that select health plans for beneficiaries and enroll them passively must notify the beneficiaries and provide them a 90-day period to change plans, and, in voluntary managed care programs, to change plans or elect to remain in the fee-for-service (FFS) system. Enrollees who use LTSS can disenroll from their plan if their residence or employment would be disrupted as a result of their LTSS provider leaving the plan’s network.

Network adequacy and access to care. States must establish time and distance standards for 11 specified types of providers and other network adequacy standards for LTSS providers who travel to enrollees. States must have a continuity of care policy for beneficiary transitions from FFS to managed care or from one managed care plan to another.

Short-term IMD stays. For the first time, under the authority for plans to cover services “in lieu of” of those available under the Medicaid state plan, states can receive federal matching funds for capitation payments for adults who receive psychiatric or substance use disorder inpatient or crisis residential services in an IMD for no more than 15 days in a month.

Managed long-term services and supports (MLTSS). For the first time, the rules include provisions specific to MLTSS. States must identify enrollees with LTSS needs, and plans must comprehensively assess these enrollees. Plans also must comply with CMS’s person-centered planning and home and community-based setting regulations. States and plans must create stakeholder advisory groups to oversee MLTSS programs.

Continued services during appeals. The final rule enables managed care enrollees to have services continue during appeals of denials. Also, Medicaid appeal timeframes are revised to better align with Medicare Advantage and Marketplace rules. Additionally, beneficiaries must exhaust the internal health plan appeal before proceeding to a state fair hearing.

Medical loss ratio (MLR) standard. The final rule establishes a minimum medical loss ratio (MLR) standard in Medicaid for the first time. The minimum MLR is 85%, the same standard that applies in Medicare Advantage and private large group plans. The rule requires states to develop capitation rates so as to achieve an MLR of at least 85% in the rate year. There is no federal requirement that plans remit payment if they fail to meet the MLR standard, but states have discretion to require remittances.

Delivery system and payment reform. The rule clarifies state payment tools to promote improved performance by managed care plans, as well as state authority to require plans to implement value-based purchasing models and participate in multi-state or Medicaid specific delivery system reform initiatives.

Quality of care. States must have a written quality strategy, including performance measures, performance improvement projects, a mechanism for identifying enrollees with LTSS or special health care needs, a plan to reduce health disparities, and other elements. States are required to identify over- and under-utilization and the quality and appropriateness of care provided to LTSS users. After implementing their quality strategy, states must issue annual quality ratings for their plans based on a rating system to be developed by CMS.

Program integrity. The final rule strengthens requirements for data, transparency, and accountability at both the state and plan level. States must screen and enroll all managed care network providers who are not already enrolled in the state’s FFS system. The rule conditions federal matching funds for payments to MCOs, PIHPs, and PAHPs on state reporting of validated, complete, and timely enrollee encounter data.

Looking Ahead

As Medicaid managed care programs continue to expand to include additional populations and services, and state interest in delivery system and payment reform increases, the final rule provides a framework of state and managed care plan standards and requirements designed to improve the quality, performance, and accountability of these programs. In the months and years ahead, CMS, states, plans, beneficiaries, providers, and other stakeholders will be focused on implementation of the provisions of the new rule.

Issue Brief

Introduction

On April 21, 2016, the Centers for Medicare & Medicaid Services (CMS) issued a final rule on managed care in Medicaid and the Children’s Health Insurance Program (CHIP).1  The new rule, which largely retains the provisions that CMS proposed on May 26, 2015, represents a major revision and modernization of federal regulations in this area, which were last updated more than a decade ago, in 2002. Since that time, the role of risk-based managed care in Medicaid has grown significantly in both scale and scope. States have expanded their programs to cover populations with more complex needs; broader geographic areas; additional services, including behavioral health and long-term services and supports (LTSS); and, in the states that have expanded Medicaid under the Affordable Care Act (ACA), millions of adults who are newly eligible for the program.

According to the most current national data, as of July 1, 2014, 43.4 million Medicaid beneficiaries, or just over 60%, were enrolled in comprehensive risk-based managed care organizations (MCOs), reflecting a 24% increase in MCO enrollment over the year before.2  Currently, 38 states and the District of Columbia contract with MCOs; in many of these states, at least 75% of all beneficiaries are enrolled in plans.3  While MCOs are the predominant form of Medicaid managed care, millions of other beneficiaries receive at least some Medicaid services, such as behavioral health or dental care, through limited-benefit risk-based plans, known as prepaid inpatient health plans (PIHPs) and prepaid ambulatory health plans (PAHPs). Several million beneficiaries are also enrolled in primary care case management (PCCM) programs that range from basic managed fee-for-service (FFS) models to more enhanced models.

CMS identified a number of principles and goals that guided its development of the new regulations. The agency sought to align key Medicaid and CHIP managed care requirements with other health coverage programs, such as Medicare Advantage and the ACA Marketplaces, where appropriate; enhance the beneficiary experience of care and strengthen beneficiary protections; strengthen actuarial soundness payment provisions and program integrity; promote quality of care; and support efforts to reform the delivery systems that serve Medicaid and CHIP beneficiaries.4 

This issue brief summarizes major provisions of the final rule. It is not an exhaustive review of the regulation, but it serves an informational guide to key federal requirements for state Medicaid managed care programs and the plans with which they contract. The general effective date of the final rule is July 5, 2016, although individual provisions of the rule take effect at different times, mostly over the next three years. Until provisions of the final rule take effect, current regulations remain in force.

Wider application of Medicaid managed care rules

Extension to additional Medicaid managed care entities. The final rule applies many new and existing Medicaid managed care standards to PAHPs as well as PIHPs and MCOs. It also applies certain of the standards to newly defined “PCCM entities,” which, in addition to furnishing basic PCCM services, also perform some of the same administrative and other functions that MCOs perform, such as intensive case management, provider contracting or oversight, enrollee outreach, and/or performance measurement and quality improvement. Under the final rule, states must obtain CMS approval of all contracts with PCCM entities, monitor and evaluate their networks and performance, and include them in their managed care quality strategies, discussed later.

CHIP alignment. The final rule extends most of the requirements and standards that apply to state Medicaid managed care programs and plans to CHIP as well, modified as appropriate for differences between the two programs. The rule aligns CHIP with Medicaid on the 85% medical loss ratio standard, beneficiary information, disenrollment, and marketing requirements, and enrollee rights and protections, discussed below. It also applies the requirements related to provider network adequacy and access to care, continuity of care, quality assessment and performance improvement, external quality review, grievances and appeals, and program integrity to CHIP managed care plans. Some Medicaid standards do not apply to CHIP. In particular, while CHIP managed care contracts, including capitation rates, are subject to CMS prior review, they are not subject to CMS prior approval as Medicaid contracts are.5  Nor does the final rule extend the provisions on managed LTSS to CHIP.

Anti-discrimination provisions.  The final rule expands the specific bases on which discrimination is prohibited in Medicaid managed care contracts. In addition to race, color, and national origin, plans cannot discriminate on the basis of sex, sexual orientation, gender identity or disability against individuals eligible to enroll.6  The final rule also adds Section 1557 of the ACA to the list of federal anti-discrimination laws with which managed care plan contracts must comply.  Section 1557 prohibits discrimination on the basis of race, color, national origin, age, disability, and sex in health programs and activities that receive federal funds.7 

Beneficiary support and information

Beneficiary support system. The final rule requires states to establish an independent beneficiary support system to serve both potential enrollees in an MCO, PIHP, PAHP, PCCM, or PCCM entity and current enrollees who are changing plans.8  The system must provide assistance by phone and internet and in person, and it must offer: 1) personalized choice counseling9  to assist beneficiaries with evaluating their health plan options and facilitate enrollment; 2) assistance to beneficiaries in understanding managed care; and 3) assistance for enrollees who use or wish to use LTSS. Specifically, the LTSS assistance must include: 1) an access point for complaints and concerns; 2) education on enrollees’ rights and responsibilities; 3) assistance in navigating the grievance and appeal process;10  and 4) review and oversight of data to guide the state in identifying and resolving LTSS systemic issues. The overall beneficiary support system also must engage in outreach to beneficiaries. States can draw upon and expand services they already provide to meet the new requirements.  These provisions are effective for plan contracts starting on or after July 1, 2018.

Standards for beneficiary information. The final rule replaces existing regulations regarding the information that must be made available to beneficiaries with a more structured set of standards that apply to states, all MCOs, PIHPs, PAHPs, and PCCM entities, and, to a limited extent, PCCM arrangements. The new standards are designed to improve the content and format of information available to help beneficiaries understand how managed care works and evaluate and compare their managed care options, particularly given the expansion of managed care to people with disabilities and complex needs, and the linguistic and cultural diversity of Medicaid beneficiaries. The new requirements apply to plan contracts beginning on or after July 1, 2017.

Existing requirements are strengthened in numerous ways, as follows:

  • Information for potential enrollees. The final rule expands the information that states must provide to potential managed care enrollees to help them understand the Medicaid managed care program and their options. The new information includes beneficiary disenrollment rights, expanded provider directory information (described below), the prescription drug formulary, and, to the extent available, quality and performance indicators. This information must be provided when the potential enrollee is first eligible or required to enroll in managed care and within a timeframe that enables the potential enrollee to use the information in choosing a plan.
  • Information for current enrollees. Within a reasonable time after an enrollee receives an enrollment notice, the plan must provide the enrollee with a handbook that compiles specified information that is already required under existing regulations and is similar to the summary of coverage and benefits required for private health plans. Plans also must provide enrollees with a provider directory and drug formulary information. Existing federal requirements regarding state and plan information for Medicaid beneficiaries already enrolled in managed care plans continue to apply.
  • Standardization of information. To improve the consistency and usefulness of beneficiary information, states must develop definitions of key managed care terms11  and model handbooks and enrollee notices that all plans must use.
  • Accessibility of information. States and plans must make written beneficiary materials, including, at a minimum, enrollee handbooks, provider directories, grievance and appeal notices, and denial and termination notices, available in locally prevalent non-English languages.12 All written materials must be available in alternative formats upon request without cost to beneficiaries. In addition, states and plans must provide interpretation services in all languages, and auxiliary aids and services for enrollees and potential enrollees with disabilities, upon request and free of charge, and notify enrollees and potential enrollees about how to access these services. Taglines in large print13  and in locally prevalent non-English languages are required on all written materials to explain the availability of interpretation and translation services and provide the toll-free choice counseling number and the plan’s toll-free customer service number. All written materials must use easily understood language and format and be printed in at least 12 point font. Each plan also must have mechanisms to help enrollees and potential enrollees understand the plan’s requirements and benefits.
  • Availability of electronic information. States must operate a Medicaid managed care website that, directly or by linking to individual plan websites, contains enrollee handbooks, provider directories, prescription drug formularies, and network adequacy standards for each managed care plan.14  Required enrollee information may be provided online by the state or plans as long as it is compliant with all language and disability accessibility standards, displayed prominently on the state or plan website, can be printed, and is available in paper form within 5 business days upon request and without charge. Plans also can provide required information by mail, by email with enrollee consent, or by other reasonable methods.

Provider directories. Each MCO, PIHP, PAHP, and when appropriate, PCCM entity, must make a provider directory available electronically and, on request, in paper form. The directory must include each network provider’s name and any group affiliation, address, telephone number, specialty, website URL, and whether the provider will accept new enrollees. The directory must also indicate each provider’s linguistic capabilities, as well as whether the provider has completed cultural competence training, and whether the provider’s offices, exam rooms, and equipment accommodate individuals with physical disabilities. The directory must include this information for physicians, hospitals, pharmacies, behavioral health providers, and LTSS providers covered under the plan contract. Paper directories must be updated at least monthly and electronic directories no later than 30 calendar days after the MCO, PIHP, PAHP, or PCCM entity receives updated provider information.

Drug formulary information. Each MCO, PIHP, PAHP, and, as appropriate, PCCM entity must make information about its drug formulary available electronically or in paper form. The formulary information must include which generic and name brand medications are covered and which tier each medication is on.

Marketing. The final rule amends current marketing restrictions on MCOs, PIHP, PAHPs, PCCMs, and PCCM entities to permit a qualified health plan (QHP) issuer to market to a Medicaid beneficiary even if the issuer is also the entity providing Medicaid managed care services. This change seeks to facilitate smoother coverage transitions and care continuity for individuals who may migrate between Medicaid and QHP eligibility, and to give families whose members are divided between Medicaid and QHP coverage opportunities to choose an issuer that offers products in both markets. These provision are effective on July 5, 2016.

Enrollment and disenrollment protections

The final rule adds new provisions that require states to have an enrollment system for both voluntary and mandatory Medicaid managed care programs. Effective for contracts starting on or after July 5, 2016, the enrollment system must meet certain requirements, as follows:

Enrollment

  • Voluntary managed care programs. Enrollees eligible for voluntary managed care programs must have the opportunity to actively choose between FFS and managed care and, if applicable, their managed care plan. If the state uses a passive enrollment system – that is, selects a managed care plan for each potential enrollee – the enrollment notice to beneficiaries must clearly explain the implications of not making an active choice between FFS and managed care and of declining enrollment in the plan selected for them by the state. The notice also must explain that beneficiaries who are passively enrolled in a managed care plan have a 90-day disenrollment period during which they can accept the plan selected for them by the state, decline it and select a different plan, or decide to remain in FFS.
  • Mandatory managed care programs. In mandatory managed care programs with passive enrollment, the enrollment notice to the beneficiary must explain the enrollee’s right to disenroll from the plan to which he or she is assigned and select an alternative plan within 90 days from the effective date of the beneficiary’s initial plan enrollment. In mandatory programs without passive enrollment, the state must allow beneficiaries a period of time to actively choose a plan; if beneficiaries do not make an active choice in that period, the state can enroll the beneficiary into a plan using its default enrollment process.15 
  • Default plan assignment. Whenever states assign beneficiaries to plans, they must seek to preserve existing provider-beneficiary relationships and relationships with providers that have traditionally served Medicaid beneficiaries, or, if that is not possible, equitably distribute individuals among participating plans. States may consider additional criteria, including the preferences of family members, previous plan assignment, quality assurance and improvement performance, accessibility for people with physical disabilities, and other reasonable factors in assigning enrollees to plans.

Disenrollment

  • Under the final rule, enrollees using LTSS have good cause to disenroll from their managed care plan if they would have to change their residential, institutional, or employment supports provider, if they would experience a disruption in their residence or employment as a result of the provider leaving the managed care plan’s network (effective for contracts starting on or after July 1, 2017).
  • The final rule clarifies that states can accept beneficiaries’ disenrollment requests orally and/or in writing. It also clarifies that disenrollment requests denied by a plan must be referred to the state for review.

Network adequacy and access to care

Time and distance standards. The final rule strengthens current regulations regarding network adequacy. It requires states that contract with MCOs, PIHPs, or PAHPs to develop and enforce network adequacy standards that include, at a minimum, time and distance standards for each of the following provider types, if covered under the contract: primary care (separate adult and pediatric), OB/GYN, behavioral health, specialists (separate adult and pediatric, and including mental health and substance use disorder professionals), hospitals, pharmacies, pediatric dental, and additional provider types when it promotes the objectives of the Medicaid program as determined by CMS.16  Plans must demonstrate that their networks have family planning providers sufficient to ensure timely access to these services, but enrollees retain their right to free choice of family planning provider regardless of the provider’s network participation.

States that contract with plans that cover LTSS must develop time and distance standards for LTSS providers when the enrollee must travel to the provider, and network adequacy standards other than time and distance standards for LTSS providers that travel to the enrollee to deliver services.

The network adequacy standards are effective for the rating period for contracts starting on or after July 1, 2018.

  • Considerations. The final rule adds to the elements that current regulations require states to consider in developing network adequacy standards.17  In particular, states must consider the ability of network providers to communicate with limited English proficient enrollees in their preferred language, and their ability to ensure physical access, reasonable accommodations, culturally competent communications, and accessible equipment for Medicaid enrollees with physical or mental disabilities. States must also consider the availability of triage lines or screening systems and the use of telemedicine, e-visits, and/or other evolving and technological solutions.In developing network adequacy standards for LTSS providers, states also must consider elements that would support an enrollee’s choice of provider, strategies that ensure enrollees’ health and welfare and would support community integration, and other factors that are in the best interest of enrollees who need LTSS.
  • Exceptions. If a state permits an exception to its provider-specific network adequacy standard, the criteria by which the exception will be evaluated and approved must be specified in the MCO, PIHP, or PAHP contract and be based, at a minimum, on the number of providers in the relevant specialty who practice in the plan’s service area. In addition, states must monitor enrollee access to that provider type on an ongoing basis and include their findings in their annual program report to CMS, discussed later in this brief.
  • Special provisions for Indians. State contracts with MCOs, PIHPs, PAHPs, and PCCM entities (if they have provider networks) that enroll Indians must require the plans to demonstrate that they have sufficient Indian health care providers (IHCPs)18  in their network to ensure timely access to covered services for Indian enrollees. Plans must pay IHCPs for covered services provided to Indian enrollees, whether the IHCPs are in their network or not, a negotiated rate or no less than they would pay a non-IHCP network provider. State contracts with non-Indian-controlled plans must require the plans to permit Indian enrollees to choose a network IHCP primary care provider (PCP) as their PCP if the provider has capacity, and to access out-of-network IHCP providers for covered services. Plans must pay out-of-network IHCPs in accordance with federally qualified health center (FQHC) rates, Indian Health Service encounter rates, or the state plan FFS, as applicable. These provisions apply for contracts starting on or after July 1, 2017.

Plan and state assurances of plan capacity and access. Plans must document to the state that they have the capacity to serve the expected enrollee population, annually and when there are significant changes in a plan’s operations that affect its capacity.19  Significant changes are defined by the state and include changes that affect the plan’s covered services or geographic service area, the composition of or payments to its provider network, or enrollment of a new population. States, in turn, must assure CMS that the plans meet the state’s requirements for availability of services and provide an analysis that supports the state’s certification of each plan’s provider network adequacy. Plan contracts also must require plans to meet state standards for timely access to care, participate in state efforts to promote linguistically and culturally competent care, and provide physical access, reasonable accommodations, and accessible equipment for enrollees with disabilities. These provisions are effective for plan contracts starting on or after July 1, 2018.

Utilization management and authorization of services. States must ensure, through their contracts with MCOs, PIHPs, and PAHPs, that services supporting individuals who have ongoing or chronic conditions or require LTSS are authorized in a manner that reflects their ongoing needs for such services. In addition, utilization controls must not interfere with enrollees’ freedom to choose their method of family planning. The final rule also requires that decisions to deny authorization for a service or authorize a more limited scope of services than requested be made by individuals with appropriate expertise in addressing the enrollee’s medical, behavioral health, or LTSS needs. The rule also changes the required timeframe in which plans must make expedited authorization decisions, from 3 working days, as existing regulations provide, to 72 hours after receipt of the request for the service; this change aligns the Medicaid standard with Medicare Advantage and commercial standards. These provisions are effective for plan contracts starting on or after July 1, 2017.

Care coordination. The final rule effectively broadens current care coordination requirements to ensure that MCO, PIHP, and PAHP enrollees have access to ongoing sources of all care appropriate to their needs, including not only primary care but also behavioral health services and LTSS. Federal standards for care coordination also are expanded to encompass coordination between settings, coordination with services provided outside the plan by a different plan or through FFS, and coordination with community and social support providers. Plans must provide enrollees with the contact information for their care coordinator. MCOs, PIHPs, and PAHPs must make their best effort to conduct a health risk assessment within 90 days of enrollment for all new enrollees, including subsequent attempts to contact the enrollee if the initial attempt is unsuccessful. These provisions are effective for plan contracts starting on or after July 1, 2017.

Continued services during transitions. States must have a continuity of care policy to ensure continued access to services during beneficiary transitions from FFS to a managed care plan (including PCCMs and PCCM entities), or from one managed care plan to another, when, without continued services, an enrollee would suffer serious detriment to his or her health or a risk of hospitalization or institutionalization. Among other requirements, the policy must ensure access to services consistent with enrollees’ previous access and permit enrollees to retain their current provider for a period of time (to be specified by the state) if the provider is not in the plan’s network. State contracts with MCOs, PIHPs, and PAHPs must require that the plans implement continuity of care policies that meet these standards. States also must make their continuity of care policy publicly available and instruct enrollees and potential enrollees about how to access continued services during a transition. These provisions are effective for contracts starting on or after July 1, 2018.

Prescription drug coverage. MCOs, PIHPs, and PAHPs whose contracts include covered outpatient prescription drugs are required to meet federal Medicaid FFS standards regarding the availability and prior authorization of these drugs as if the standards applied directly to the health plans. These provisions are effective for plan contracts starting on or after July 1, 2017.

“In lieu of” services and short stays in Institutions for Mental Diseases (IMDs). The final rule codifies longstanding CMS policy regarding when plans may cover services and settings in lieu of those available under the Medicaid state plan. The state must identify any such services in the plan’s contract and determine that these services are medically appropriate and cost-effective. In lieu of services are offered at plan option, and an enrollee cannot be required to use them.

Under the final rule, states can, for the first time, receive federal matching funds for capitation payments made to an MCO or PIHP on behalf of enrollees ages 21-64 who receive psychiatric or substance use disorder (SUD) inpatient or crisis residential services in an IMD for no more than 15 days in a month,20  provided that the psychiatric or SUD treatment provided in an IMD meets the criteria for “in lieu of” services. This provision establishes an exception to the general federal prohibition against any Medicaid payments for adult Medicaid beneficiaries while they are patients in an IMD. The change is intended to improve access to short-term inpatient psychiatric and SUD treatment for Medicaid managed care enrollees, and to improve the coordination and management of care for enrollees who need such treatment. This provision take effect on July 5, 2016.

Managed long-term services and supports (MLTSS)

For the first time, CMS includes regulations specific to the provision of MLTSS, acknowledging the significant expansion of this delivery system model since the Medicaid managed care regulations were last revised. The final rule defines LTSS for purposes of the managed care rules21  and includes references to LTSS throughout, whereas existing regulations refer only to medical services provided by plans. Some new requirements particular to MLTSS are detailed below. Many of the provisions in the final rule seek to codify the MLTSS best practices in programs identified in CMS’s 2013 guidance.22 

Identification and assessment of enrollees with LTSS needs. States must have mechanisms to identify enrollees with LTSS needs, and MCOs, PIHPs, and PAHPs must use appropriate providers or LTSS service coordinators to comprehensively assess such enrollees to identify any ongoing special conditions  that require a course of treatment or regular care monitoring. These provisions are effective for plan contracts starting on or after July 1, 2017.

Person-centered planning process. Health plans must produce a treatment or service plan for enrollees who need LTSS. The plan must be developed by an LTSS service coordinator trained in person-centered planning, with enrollee participation and in consultation with the enrollee’s providers. The final rule also requires that, when an MCO, PIHP, or PAHP authorizes LTSS for an enrollee, it take into account the enrollee’s current needs assessment and person-centered service plan. Plans must be reviewed at least annually, as well as when the enrollee’s circumstances or needs change significantly or at the enrollee’s request. These provisions are effective for health plan contracts starting on or after July 1, 2017.

Services provided in home and community-based settings. Plan contracts that include MLTSS must comply with the same rules on home and community-based services settings that apply to Medicaid LTSS delivered on a FFS basis.23  This provision is effective for plan contracts starting on or after July 5, 2016.

Provider credentialing. The state’s provider credentialing process must address behavioral health and LTSS providers. This provision is effective for plan contracts starting on or after July 5, 2016.

Stakeholder engagement. States must create and maintain a stakeholder group to solicit and address the opinions of beneficiaries, individuals representing beneficiaries, providers, and other stakeholders in the design, implementation, and oversight of a state’s MLTSS program. The composition of the group and frequency of meetings must be sufficient to ensure meaningful engagement. In addition, plans providing MLTSS must have a member advisory committee that includes at least a reasonably representative sample of the populations receiving LTSS covered by the plan or other individuals representing those enrollees. This provision is effective for plan contracts starting on or after July 1, 2017.

Appeals

The final rule includes provisions intended to better align the Medicaid managed care appeals process with the processes required for Marketplace and MA plans. These provisions are effective for health plan contracts starting on or after July 1, 2017.

Timeframes. The final rule changes the timeframes for several components of the appeals process, as summarized below in Table 1. The new appeal timeframes for managed care appeals may differ from the timeframes for appeals of Medicaid eligibility determinations and claims for Medicaid-covered benefits that are provided on a FFS basis; under existing law, states must afford beneficiaries a reasonable time, up to 90 days from the date the notice is mailed, to request these latter types of appeals.

Internal plan appeal process and access to state fair hearing. The final rule allows only one level of internal plan appeals for enrollees. Once an enrollee exhausts this single level of internal appeal, he or she can request a state fair hearing. CMS also revised the existing regulation that allowed states to determine whether enrollees can bypass the internal plan appeal process and proceed directly to a state fair hearing; under the final rule, all enrollees must exhaust the internal plan appeal process first. The final rule adds a provision that deems exhaustion of the internal plan appeal if the plan does not follow the regulations governing notice and timing to resolve appeals; in such cases, the enrollee can request a state fair hearing without first receiving notice from the plan of its decision.

Table 1: Changes to Timeframes for Appeals Process
ProcessExisting RuleNew Rule for Plan Contracts Starting on or after July 1, 2017
Beneficiary request for an internal plan appealState selects a period between 20 and 90 days from notice of adverse benefit determination60 calendar days from date of the notice of adverse benefit determination
Standard timeframe for decision on an internal plan appeal45 days* from plan’s receipt of appeal30 calendar days* from plan’s receipt of appeal (state may set shorter timeframe)
Notice of expedited resolution of an appeal by health plan3 working days from plan receipt of appeal72 hours from plan receipt of appeal
Beneficiary request for a state fair hearingState selects a period between 20 and 90 days from notice of adverse benefit determination; state option about whether beneficiaries can bypass internal plan appeal and go directly to fair hearing120 calendar days from the date of the notice of internal plan appeal resolution; beneficiaries must exhaust internal plan appeal before accessing fair hearing
Health plan implementation of internal plan appeal decision or state fair hearing decision when an adverse benefit determination is overturnedPromptly and as expeditiously as the enrollee’s health condition requires72 hours from plan’s receipt of notice reversing the determination
NOTE: *These timeframes may be extended by up to 14 calendar days at the enrollee’s request or if the plan shows to the state’s satisfaction the need for additional information and how the delay is in the enrollee’s interest.

Optional external medical review. The final rule includes a new option for states to offer and arrange for an external medical review as part of the appeals process. These reviews must be independent of the state and the health plan, at the enrollee’s option, and without cost to the enrollee. External medical reviews cannot be required before, or used as a deterrent to, accessing a state fair hearing and must neither extend the timeframes required to resolve appeals nor disrupt continuation of benefits during appeals.

Continuation of benefits during appeals. The final rule modifies existing regulations to enable beneficiaries to continue to receive services while an appeal of a plan’s decision to terminate, suspend, or reduce previously authorized services, and subsequent state fair hearing, are pending. A beneficiary must request continuation of benefits within 10 calendar days of the plan sending the termination notice or the intended effective date of the termination, whichever is later. Additionally, the beneficiary must file a timely request for an internal plan appeal (within 60 days from the termination notice), and the original authorization period must not have expired.24  For benefits to continue until a state fair hearing decision is issued, the beneficiary must request a fair hearing and continuation of benefits within 10 calendar days of the plan sending the internal appeal resolution notice.  If an enrollee loses an appeal and had received continued services during the appeal, the plan can recoup the cost of the continued services, but only to the extent that the state does so in FFS.

Beneficiary access to documents and records. The final rule clarifies that beneficiaries must have reasonable access to and copies of documents, records, and other information relevant to their claims for benefits, including medical necessity criteria and any processes, strategies, or evidentiary standards used by the plan in setting coverage limits. Access to these materials must be provided without cost to the beneficiary and provided sufficiently in advance of the timeframe for resolution of the appeal.

Information considered during appeals. The final rule clarifies that plans must consider all comments, documents, records, and other information submitted by beneficiaries or their representatives in appeals, regardless of whether the information was considered in the plan’s initial decision.

Recordkeeping. The final rule sets minimum standards for the types of information that states, through their contracts, must require plans to include in their appeals records. The rule also clarifies that states must review these records as part of their ongoing monitoring and oversight procedures.

Rate-setting

The final rule strengthens federal requirements regarding the development of capitation rates for MCOs, PIHPs, and PAHPs to increase transparency, fiscal integrity, and beneficiary access to care, and to promote innovation and improvement in the delivery of services.

Actuarial soundness standards. The final rule significantly strengthens the standards that states must meet in developing actuarially sound capitation rates and that CMS will apply in its review and approval of rates, effective July 5, 2016 except as indicated otherwise. Actuarially sound capitation rates are defined as those projected to provide for all reasonable, appropriate, and attainable costs required under the terms of the contract,25  developed in accordance with standards detailed in the final rule, and approved by CMS as actuarially sound.

To be approved by CMS, rates must meet numerous requirements. Any proposed differences among capitation rates for different covered populations must be based on valid rating standards and not on the federal matching rates associated with those populations. The payment rate under one rate cell must not subsidize the payment rate under any other. Capitation rates must be adequate to ensure that plans can meet their requirements regarding the availability of services, adequate networks and capacity, and coordination and continuity of care provided to enrollees (effective for contracts beginning on or after July 1, 2018). As explained in more detail below, the final rule incorporates a minimum medical loss ratio (MLR) standard in the definition of actuarial soundness (effective for contracts beginning on or after July 1, 2019). An actuary must certify that the capitation rates meet all requirements.

  • Specificity of capitation rates. Capitation rates must be specific to each rate cell under the contract, and states must certify a specific rate, rather than a rate range, for each rate cell (effective for contracts beginning on or after July 1, 2018). States have flexibility to increase or decrease the capitation rate for each rate cell by 1.5 percent without submitting a revised rate certification to CMS for review and approval.
  • State certification of capitation rates. States must certify the final capitation rate for each rate cell that is paid under each MCO, PIHP, and PAHP contract as actuarially sound and document the underlying data, assumptions, and methodologies in enough detail so that CMS or an actuary can understand and evaluate them. States must submit all rate certifications to CMS for review and approval concurrent with the CMS review and approval process for all contracts.
  • Plan certification of data and documentation. MCOs, PIHPs, and PAHPs must submit to states the data on the basis of which states certify the actuarial soundness of capitation rates, determine plan compliance with the MLR requirement, and certify plan compliance with state requirements for availability and accessibility of services, including provider network adequacy. The data and documentation submitted by plans must be certified by the plan’s CEO or CFO or an individual who reports directly to the CEO or CFO and is authorized to sign for him or her; the certification must attest that the submitted data and documentation are accurate, complete, and truthful.

Minimum medical loss ratio (MLR). An MLR is the ratio of a health plan’s incurred claims and expenditures for health care quality improvement activities to the plan’s adjusted premium revenue. The final rule establishes a minimum MLR standard for MCOs, PIHPs, and PAHPs for the first time. The minimum MLR is 85%, the same standard that applies to Medicare Advantage and private large group plans.26  States must develop capitation rates in a manner such that the plan can reasonably achieve an MLR of at least 85% in a rate year, taking into account the plan’s actual MLR in the past rate year. The rule does not require remittances from plans that fail to meet the minimum MLR standard, but states have authority to require such remittances. The minimum 85% MLR standard applies to contracts starting on or after July 1, 2019.

Each MCO, PIHP, and PAHP must calculate and report its MLR to the state annually. The rule defines standards regarding both how plans must calculate their MLR and the information to be included in the MLR report to the state. Plans must attest that the MLR was calculated accurately in accordance with the federal standards. The MLR calculation and reporting requirements apply to contracts starting on or after July 1, 2017.

Delivery system and payment initiatives. The final rule clarifies states’ authority to require MCOs, PIHPs, or PAHPs to: implement value-based purchasing models for provider payment, such as pay-for-performance arrangements, bundled payments, or other models intended to reward value over volume; participate in multi-payer or Medicaid-specific delivery system reform or performance improvement initiatives; adopt a minimum or maximum fee schedule for network providers that provide a particular service; or provide a uniform dollar or percentage increase for network providers that provide a particular service. Any such arrangements must be based on the utilization and delivery of services, be expected to advance the goals of the state managed care quality strategy (described below), not be renewed automatically, and meet other requirements. This provision is effective for contracts starting on or after July 1, 2017.

Pass-throughs of state supplemental provider payments. The final rule phases out “pass-throughs” of state supplemental provider payments in the capitation rates paid to MCOs, PIHPs, or PAHPs, because they are not tied to the provision of services covered under plan contracts and therefore conflict with the actuarial soundness requirement. Pass-through payments to hospitals will phase out over the period 2017-2027 by 10 percentage points per year, and pass-through payments to physicians and nursing facilities will phase out over the period 2017-2022.

Quality of care

The final rule amends and increases existing regulatory requirements regarding quality assurance standards for managed care programs. It also extends application of the quality standards to PAHPs and, in many cases, to PCCM entities whose contracts include financial incentives for improved quality outcomes. (All mentions of PCCM entities in this section refer to these PCCM entities only.)

Managed care state quality strategy. Under the final rule, each state contracting with an MCO, PIHP, PAHP, or PCCM entity must draft and implement a written quality strategy for assessing and improving the quality of all care and services furnished by these entities.27  The managed care quality strategy must include, among other elements: the state-defined standards for network adequacy and availability of services for MCOs, PIHPs, and PAHPs; the state’s goals and objectives for continuous quality improvement, which must be measurable and take into account the health status of all populations served by plans; the quality and performance measures the state will publish at least annually on its website; performance improvement projects (PIP) required by the state or CMS; the state’s transition of care policy; and the arrangements for annual external reviews of quality under each contract, discussed further below. The quality strategy must also describe the state’s mechanism for identifying for plans those enrollees who need LTSS or have special health care needs. It must also describe the state’s plan to reduce health disparities based on age, race, ethnicity, sex, primary language, and disability, and states must collect and share this demographic information with plans for each Medicaid enrollee at the time of enrollment.

States must make their quality strategy publicly available and obtain input before submitting it to CMS for review. States must post the final quality strategy on their website, review and update it at least every three years, and post the review results on their website. States must submit a revised strategy to CMS whenever they make significant changes to it. States must comply with the quality strategy requirements by July 1, 2018.

Medicaid managed care quality rating system (QRS). Under the final rule, CMS, through a public notice and comment process, will identify performance measures and a methodology for a Medicaid managed care QRS that aligns with the summary indicators of the QRS for QHPs (these currently include clinical quality management; member experience; and plan efficiency, affordability, and management). CMS anticipates that it will finalize the QRS by 2018. Within three years after the final CMS notice is published, states contracting with an MCO, PIHP, or PAHP must implement CMS’s QRS. Alternatively, states may request CMS approval to implement a QRS that uses different measures or a different methodology provided that it yields information substantially comparable to CMS’s QRS, and only following a public notice and comment period. Once the QRS is implemented, states must issue an annual quality rating for each plan based on data collected from the plan and display the ratings prominently on their website.

State review of MCO, PIHP, and PAHP accreditation status. Under the final rule, states must confirm the accreditation status of each contracting plan at least annually.28  They must post and update the accreditation information on their website at least annually. These provisions apply to contracts starting on or after July 1, 2017.

Quality assessment and performance improvement (QAPI) programs. The final rule expands the scope of QAPI programs, and applies QAPI requirements to PAHPs and PCCM entities as well as MCOs and PIHPs. Under the final rule, states must require each plan to establish and implement an ongoing comprehensive QAPI program. The QAPI program for MCOs, PIHPs, and PAHPs must include performance improvement projects (PIPs), collection and submission of performance measurement data, mechanisms to identify underutilization and overutilization of services, and mechanisms to assess the quality and appropriateness of care furnished to enrollees with special needs; the QAPI program for PCCM entities must include at least the second and third elements in this list. For MCOs, PIHPs, or PAHPs that provide LTSS, the QAPI must include mechanisms to assess the quality and appropriateness of care furnished to enrollees using these services, including an assessment of transition care and whether the enrollee received the services and supports set forth in his or her treatment plan.

States must identify PIPs and standard performance measures for MCOs, PIHPs, and PAHPs. These must include any national performance measures that CMS may specify in the future.29  In the case of MCOs, PIHPs, and PAHPs that provide LTSS, states must also identify standard performance measures related to quality of life, rebalancing, and community integration activities. Plans must either annually report their performance on these standard measures to the state and/or submit data that enable the state to calculate the plan’s performance. These provisions apply to contracts starting on or after July 1, 2017.

External quality review (EQR). States that contract with MCOs and PIHPs must ensure that a qualified external quality review organization (EQRO) performs an annual external quality review (EQR) for each plan; the final rule extends this requirement to states that contract with PAHPs and PCCM entities as well. The final rule also tightens the requirements related to the independence of the EQRO and any subcontractor from the entities it is reviewing.30  All Medicaid services provided by an MCO, PIHP, or PHP in any setting are subject to EQR. The revised EQR provisions apply to contracts starting on or after July 1, 2018.

The HHS Secretary, in coordination with the National Governors Association, must develop protocols for the required EQRs.31  Mandatory and optional EQR-related activities may be performed by the state, its agent that is not an MCO, PIHP, PAHP, or PCCM entity, or an EQRO. The final rule adds validation of MCO, PIHP, or PAHP network adequacy during the preceding 12 months as a mandatory EQR-related activity, effective no later than one year from CMS’ issuance of the associated EQR protocol. The protocols issued by the Secretary must specify the data to be gathered through the EQR-related activities, steps to be followed in collecting the data, the methods for analyzing and interpreting the data, and any documents and tools necessary to implement the protocols. The information obtained from the EQR-related activities must be used for the annual EQR. As under current rules, states may use information from a Medicare or private accreditation review of a plan for the EQR to avoid duplication, but only if specified criteria set by the final rule are met.

Under the final rule, the annual detailed technical report that results from an EQR must include new required elements. The report must include validated performance measurement data associated with PIPs that were underway and performance measures calculated by the state in the preceding 12 months. Also, the report’s recommendations must include how the state can better target its quality strategy to better to foster quality, timeliness, and access to services.32  States are required to finalize and post the annual EQR report on their website by April 30 of each year.

The federal match rate is 75% for EQR and EQR-related activities performed by EQROs on MCOs. Effective immediately, the federal match rate is 50% for EQR-related activities conducted by a non-EQRO entity and also for EQR and EQR-related activities performed by an EQRO on PIHPs, PAHPs, and PCCM entities.33 

State monitoring

State monitoring system. The final rule strengthens the requirements for state monitoring of managed care programs. Under the rule, each state Medicaid agency must have a monitoring system for all managed care programs, including PCCM entities The monitoring system must address all aspects of the state’s managed care program, including the performance of each managed care entity in virtually every area of operations and management (e.g., appeals and grievance systems, claims management, enrollee materials and customer service, information systems, marketing, medical management, provider network management, availability and accessibility of services). States must use data collected from their monitoring activities, including enrollment and disenrollment trends in each plan, grievance and appeal logs, findings from the state’s EQR process, MLR reports, and many other specified types of data, to improve the performance of their managed care programs. These provisions apply for contracts starting on or after July 1, 2017.

Readiness reviews. New under the final rule, states must assess the readiness of each MCO, PIHP, PAHP, and PCCM entity with which it contracts, prior to implementing a managed care program, and when a specific plan has not previously contracted with the state, and when any plan currently contracting with state will provide covered benefits to new eligibility groups. Readiness reviews must be conducted at least three months before the effective date of any of those events and in time to ensure smooth implementation, and the reviews must be submitted to CMS for the agency’s approval of any associated contract or contract change. That is, all contracts with MCOs, PIHPs, PAHPs, and PCCM entities require prior review and approval by CMS. Readiness reviews of plans prior to initial state implementation of a managed care program or of a contract with a plan new to Medicaid must include both a desk review of documents and an onsite review. Readiness reviews of currently contracting plans that are adding new eligibility groups must include a desk review and states may require an on-site review. Readiness reviews must assess the capacity and ability of each MCO, PIHP, PAHP, and PCCM entity to perform satisfactorily in virtually every aspect of operations/administration, service delivery, financial management, and systems management. These provisions apply for contracts starting on or after July 1, 2017.

Annual program report to CMS. Within 180 days after each contract year, states must submit a report to CMS on each managed care program they administered. The program report must provide information on and an assessment of the operation of the managed care program in the following areas at a minimum: the financial performance of each risk-based plan, including the MLR; grievances, appeals, and state fair hearings for the program; availability and accessibility of covered services; plan performance on quality measures; results of any sanctions or corrective action plans imposed by the state or other intervention with a plan to improve performance; activities and performance of the beneficiary support system, and any additional factors in the delivery of long-term services and supports not otherwise addressed. States must post the annual program report on their Medicaid managed care website. CMS will issue guidance on the content and form of the program report; the initial report will be due after the contract year following the release of that guidance.

Program integrity

The final rule strengthens Medicaid managed care program integrity requirements and standards at both the state and plan level, and applies them to PAHPs as well as MCOs and PIHPs. The provisions apply to contracts starting on or after July 1, 2017.

Plan responsibilities. The final rule applies the current requirements for arrangements or procedures to detect and prevent fraud, waste, and abuse to PAHPs as well as MCOs and PAHPs, and increases the level of plan responsibility and accountability for them. Under the rule, plans must have procedures and a system with dedicated staff for routine internal monitoring and auditing of compliance risks. Plan procedures must also provide for prompt reporting of all overpayments, specifying those due to potential fraud, prompt referral of any potential fraud, waste, or abuse to the state, and other enumerated activities to ensure program integrity.

State responsibilities. Effective for contracts starting on or after July 1, 2018, states must screen, enroll, and periodically (generally, every five years) revalidate all network providers of MCOs, PIHPs, and PAHPs that are not already enrolled with the state to provide services to FFS Medicaid beneficiaries;34  this requirement applies to PCCMs and PCCM entities as well. Plans may execute network provider agreements pending the outcome of the screening process of up to 120 days, but if notified by the state that a network provider cannot be enrolled, they must terminate the agreement and notify affected enrollees.

Other state responsibilities include (but are not limited to): review of plan ownership and control disclosures; monthly federal database checks to identify excluded plans, subcontractors, and other parties, and prompt action if they find an excluded party; independent audits at least every three years of the encounter and other data that plans are required to submit to the state (as described below); and posting specified information on their website, including the data submitted by plans and the results of any audits.

Encounter data. Through their contracts, states must require MCOs, PIHPs, PAHPs, PCCMs, and PCCM entities to submit encounter data that meet specified form and content standards and criteria for accuracy and completeness. Further, effective for contracts starting on or after July 1, 2018, the final rule conditions federal matching funds for payments made to MCOs, PIHPs, and PAHPs on state reporting of validated, complete, and timely enrollee encounter data, and set standards for the data reports.

Fraud detection and prevention. State contracts with an MCO, PIHP, or PAHP must require that plan, or subcontractor that provides services or pays claims, to implement procedures to detect and prevent fraud, waste, and abuse. The procedures must include a compliance program that meets specified standards and that, among other requirements, provides for prompt reporting to the state of all overpayments identified or recovered, specifying those due to potential fraud. State contracts with plans must also specify how the plan will treat recoveries of overpayments. Plans’ compliance procedures must also provide for prompt state notification of changes that may affect an enrollee’s eligibility or a provider’s eligibility to participate (e.g., termination of the provider agreement), and include a method to verify whether services that network providers indicate they delivered were actually received by enrollees.

Looking ahead

The final rule on Medicaid managed care is a milestone in Medicaid’s ongoing modernization as the delivery systems that serve Medicaid beneficiaries continue to evolve. In keeping with states’ increasingly heavy reliance on managed care plans to provide care for millions of Medicaid enrollees, including many with complex care needs and special vulnerabilities, the regulatory framework and state and plan requirements established by the final rule reflect increased federal expectations regarding fundamental aspects of states’ Medicaid managed care programs. At the same time, the rule seeks to strike an appropriate balance between federal minimum requirements and state flexibility to determine specific standards and processes. In the months and years ahead, CMS, states, managed care plans, beneficiaries, providers, and other stakeholders will be focused on implementation of the provisions of the new rule and its impact on the quality of care, beneficiary support and experience of care, and innovation and value in Medicaid managed care programs.

Endnotes

  1. 81 Fed. Reg. 27498-27901 (May 6, 2016), available at https://www.federalregister.gov/articles/2016/05/06/2016-09581/medicaid-and-childrens-health-insurance-program-chip-programs-medicaid-managed-care-chip-delivered. The proposed rule was published at 80 Fed. Reg. 31098-31297 (June 1, 2015), available at https://www.federalregister.gov/articles/2015/06/01/2015-12965/medicaid-and-childrens-health-insurance-program-chip-programs-medicaid-managed-care-chip-delivered. ↩︎
  2. Medicaid Managed Care Enrollment and Program Characteristics, 2014, Centers for Medicare and Medicaid Services (CMS), https://www.medicaid.gov/medicaid-chip-program-information/by-topics/data-and-systems/medicaid-managed-care/downloads/2014-medicaid-managed-care-enrollment-report.pdf ↩︎
  3. Share of Medicaid Population Covered under Different Delivery Systems, State Health Facts, Kaiser Family Foundation, https://modern.kff.org/medicaid/state-indicator/share-of-medicaid-population-covered-under-different-delivery-systems/ ↩︎
  4. 81 Fed. Reg. 27501 (May 6, 2016), available at https://www.federalregister.gov/articles/2016/05/06/2016-09581/medicaid-and-childrens-health-insurance-program-chip-programs-medicaid-managed-care-chip-delivered. ↩︎
  5. CMS lacks statutory authority to apply Medicaid rate-setting standards and certification requirements to CHIP. ↩︎
  6. Under current law, managed care plans already are prohibited from discriminating on the basis of disability under the Americans with Disabilities Act and Section 504 of the Rehabilitation Act. ↩︎
  7. CMS recently finalized Section 1557 regulations.  81 Fed. Reg. 31376-31473 (May 18, 2016), https://www.federalregister.gov/articles/2016/05/18/2016-11458/nondiscrimination-in-health-programs-and-activities?utm_campaign=subscription+mailing+list&utm_medium=email&utm_source=federalregister.gov. ↩︎
  8. Beneficiary support system services are eligible for FFP at the 50% administrative match rate. Entities providing choice counseling are subject to existing HHS independence and conflict-of-interest requirements. ↩︎
  9. Choice counseling includes answering beneficiary questions and identifying factors to consider when choosing among plans and providers. It does not include making recommendations for or against enrollment in a specific plan. ↩︎
  10. Assistance with navigating the appeals process does not include representation of beneficiaries in appeals. ↩︎
  11. The required terms to be defined include appeal, co-payment, durable medical equipment, emergency medical condition, emergency medical transportation, emergency room care, emergency services, excluded services, grievance, habilitation services and devices, health insurance, home health care, hospice services, hospitalization, hospital outpatient care, medically necessary, network, non-participating provider, physician services, plan, preauthorization, participating provider, premium, prescription drug coverage, prescription drugs, primary care physician, primary care provider, provider, rehabilitation services and devices, skilled nursing care, specialist, and urgent care. ↩︎
  12. These are languages spoken by a significant number or percentage of potential enrollees and enrollees who have limited English proficiency throughout the state and in each plan’s service area and identified according to a methodology established by the state. CMS does not set a particular threshold to identify prevalent non-English languages. ↩︎
  13. Large print is at least 18-point font. ↩︎
  14.  CMS notes that all states presently do have websites. ↩︎
  15. CMS had proposed but did not finalize a provision that would have required states to provide a minimum 14 calendar day “choice period” during which beneficiaries could obtain services on a FFS basis while they evaluated their managed care plan options and mad a choice. CMS concluded that the 14-day FFS period would delay access to care coordination and was incompatible with state efforts to effectuate plan enrollment at the point of Medicaid eligibility determination or soon thereafter. ↩︎
  16. CMS indicates that it will engage in public notice and comment if it decides to specify additional provider types. ↩︎
  17. Current regulations require states to consider anticipated Medicaid enrollment and utilization, the characteristics and health needs of different populations, provider participation status, including the number not accepting new Medicaid patients; providers’ and enrollees’ geographic location (considering distance, travel time, and ordinary means of transportation); and specified other factors. ↩︎
  18. Indian health care providers (IHCP) mean programs operated by the Indian Health Service or by an Indian Tribe, Tribal Organization, or Urban Indian Organization. ↩︎
  19. This is in addition to providing the documentation at the time they first enter into a state contract, as required under current regulations. ↩︎
  20. States can, effectively, receive federal matching funds for capitation payments made for enrollees with stays up to 30 days if the stay does not exceed 15 days in a single month. CMS notes that state Medicaid programs can cover short-term residential SUD treatment in IMDs longer than 15 days under a new §1115 demonstration opportunity, provided that such coverage complements broader SUD system reforms and specific program requirements are met. See State Medicaid Director Letter #15-003, July 2, 2015, https://www.medicaid.gov/federal-policy-guidance/downloads/SMD15003.pdf. ↩︎
  21. CMS, Guidance to States using 1115 Demonstrations or 1915(b) Waivers for Managed Long Term Services and Supports Programs (May 2013), available at: http://www.medicaid.gov/Medicaid-CHIP-Program-Information/By-Topics/Delivery-Systems/Downloads/1115-and-1915b-MLTSS-guidance.pdf. See also: Kaiser Commission on Medicaid and the Uninsured, Key Themes in Capitated Medicaid Managed Long-Term Services and Supports Waivers (Nov. 2014), available at https://modern.kff.org/medicaid/issue-brief/key-themes-in-capitated-medicaid-managed-long-term-services-and-supports-waivers/. ↩︎
  22. Centers for Medicare and Medicaid Services, Guidance to States using 1115 Demonstrations or 1915(b) Waivers for Managed Long Term Services and Supports Programs  (May 2013), available at http://www.medicaid.gov/Medicaid-CHIP-Program-Information/By-Topics/Delivery-Systems/Downloads/1115-and-1915b-MLTSS-guidance.pdf; see also Kaiser Commission on Medicaid and the Uninsured, Key Themes in Capitated Medicaid Managed Long-Term Services and Supports Waivers (Nov. 2014), available at https://modern.kff.org/medicaid/issue-brief/key-themes-in-capitated-medicaid-managed-long-term-services-and-supports-waivers/. ↩︎
  23. 42 C.F.R. § 441.301(c)(4). ↩︎
  24. The final rule also provides that services supporting enrollees with ongoing or chronic conditions or who require LTSS must be authorized in a manner that reflects their ongoing need for such services and supports. ↩︎
  25. The current requirement that rates must be appropriate for the populations to be covered and the services to be furnished under the contract continues to apply. ↩︎
  26. States have flexibility to impose a higher minimum MLR standard as long as the rates are adequate for reasonable and appropriate costs. ↩︎
  27. CMS did not finalize its proposed requirement that states have a comprehensive quality strategy for services provided through all delivery systems, including FFS as well as managed care. ↩︎
  28. CMS did not finalize the proposed provision that would have required states to review and approve MCOs, PIHPs, and PAHPs based on performance standards at least as stringent as those used by an accreditation entity recognized by CMS to accredit Medicare Advantage or Marketplace plans. However, states retain their existing authority to require accreditation of plans. ↩︎
  29. CMS would do so after consulting with states and other stakeholders and following a public comment process. ↩︎
  30. An EQRO may not review any plan, or a competitor operating in the state, over which the EQRO exerts control or which exerts control over the EQRO. Nor may an EQRO review any plan for which it has conducted or is conducting an accreditation review within the previous three years. ↩︎
  31. Under current rules, states develop these protocols. ↩︎
  32. The final rule retains current requirements that the report contain the methods of data and analysis, conclusions drawn from the data, and recommendations for improving the quality of services furnished by each plan, and requires comparative information about all MCOs, PIHPs, PAHPs, and PCCM entities consistent with the EQR protocols issued by the Secretary (previously, states defined this information). ↩︎
  33. CMS determined that it lacks statutory authority to provide a 75% federal match for EQR for entities that are not MCOs. ↩︎
  34. CMS clarifies that these providers will not be required to serve as Medicaid FFS providers. ↩︎
News Release

Uncompensated Hospital Care Fell by $6 Billion Nationally in 2014, Primarily in Medicaid Expansion States; However Many Hospitals Worry About Future Changes in Medicaid Supplemental Payments

Published: Jun 9, 2016

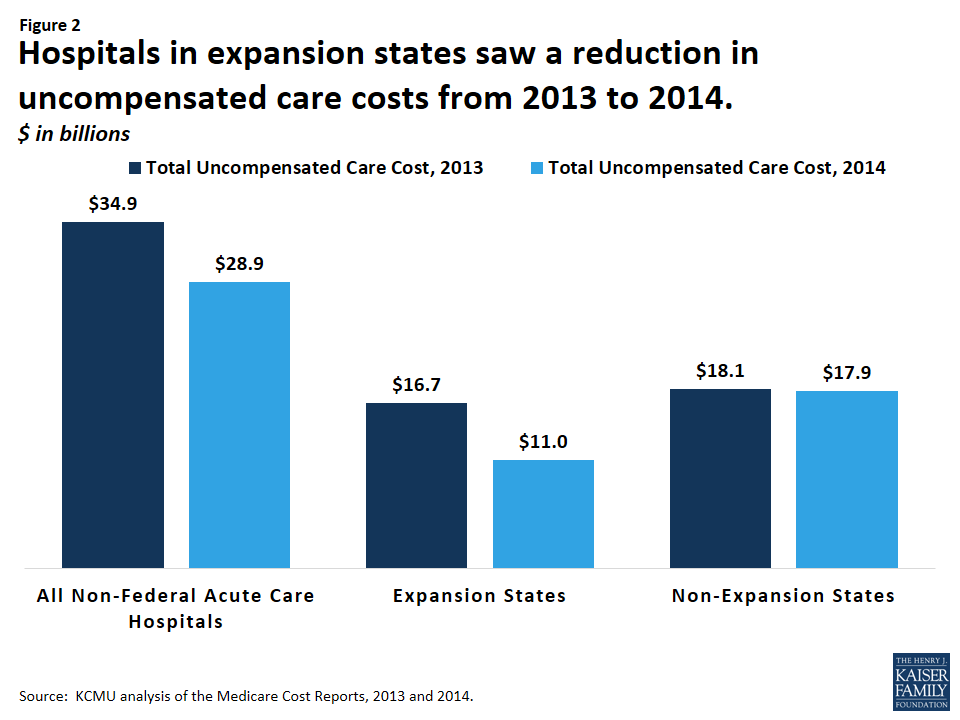
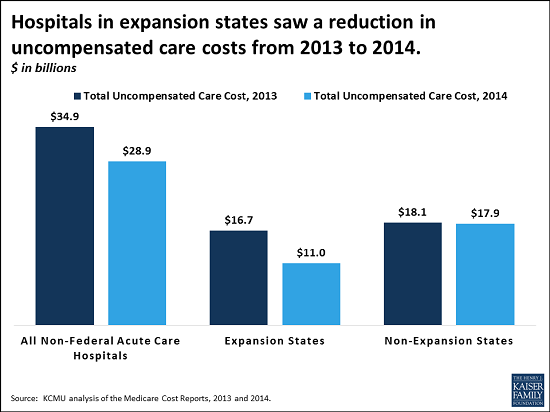
The Affordable Care Act’s coverage expansions have benefited hospitals financially, helping to produce an overall decline nationwide in uncompensated care from $34.9 billion to $28.9 billion in 2014, according to a new analysis by the Kaiser Family Foundation. Nearly all of the decline occurred in Medicaid expansion states, where uncompensated care costs were $10.8 billion in 2014 – down $5.7 billion, or 35 percent, from 2013, the year before ACA coverage expansions took full effect.

medicaidhospitalsalert.png

The analysis of Medicaid hospital payments, based on both financial data and stakeholder interviews, explains Medicaid payment rates and notes that hospitals expect some of the financial gains associated with declining uncompensated care to be offset by a higher volume of Medicaid payments that may be lower than hospital costs.  Current data is not reliable enough to assess the extent to which this has occurred or the variation across states and individual hospitals.

Additionally, many hospitals and hospital associations are concerned that the increase in patient revenue under the ACA will not fully offset the reduction in federal Medicaid disproportionate share hospital (DSH) payments. The ACA calls for DSH allotments, which totaled $11.7 billion in 2014, to decrease by $2 billion in fiscal year 2018 and fall by a total of $43 billion between 2018 and 2025. Safety net hospitals are particularly at risk because of their high dependence on Medicaid DSH funds, high numbers of uninsured patients, few privately-insured or Medicare patients, and generally weaker financial condition.  Hospitals’ ability to use Medicaid supplemental payments in addition to DSH may also be limited in the future.


Understanding Medicaid Hospital Payments and the Impact of Recent Policy Changes

Authors: Peter Cunningham, Robin Rudowitz, Katherine Young, Rachel Garfield, and Julia Foutz
Published: Jun 9, 2016

Executive Summary

Executive Summary

Medicaid payments to hospitals and other providers play an important role in these providers’ finances, which can affect beneficiaries’ access to care. Medicaid hospital payments include base payments set by states or health plans and supplemental payments. Estimates of overall Medicaid payment to hospitals as a share of costs vary but range from 90% to 107%. While base Medicaid payments are typically below cost, the use of supplemental payments can increase payments above costs.  Changes related to expanded coverage under the Affordable Care Act (ACA) as well as other changes related to Medicaid supplemental payments could have important implications for Medicaid payments to hospitals.  This brief provides an overview of Medicaid payments for hospitals and explores the implications of the ACA Medicaid expansion as well as payment policy changes on hospital finances.  Key findings include the following:

  • Overall, hospitals have benefitted financially from the ACA coverage expansions and the increase in Medicaid payments, especially in states that expanded Medicaid coverage. Analysis of the Medicare Cost Report data for 2013 and 2014 shows overall declines in uncompensated care from $34.9 billion to $28.9 billion in 2014 nationwide. Nearly all of this decline occurred in expansion states, where uncompensated care costs were $10.8 billion in 2014, $5.7 billion or 35% less than in 2013.
  • While hospitals expect to benefit financially from the Medicaid expansion, they expect some gains from the reduction in uncompensated care to be offset by volume-generated increases in Medicaid payments that may be lower than cost. The data is not reliable enough to support nationwide analysis of the extent to which this has occurred, and the effect would vary across hospitals.
  • Despite the decrease in uncompensated care, other changes to Medicaid payment policy (such as required reductions to disproportionate share hospital (DSH) payments and policy changes to limit the use of other supplemental payments) are likely to have a more substantial effect on Medicaid hospital payment and overall hospital financial performance in the future. Ultimately the impact of reductions in supplemental payments will depend on decisions by state governments to offset reductions with increases to Medicaid base rates paid to hospitals.

Issue Brief

Introduction

Medicaid payments to hospitals and other providers play an important role in these providers’ finances, which can affect beneficiaries’ access to care. States have a great deal of discretion to set payment Medicaid rates for hospitals and other providers. Like other public payers, Medicaid payments have historically been (on average) below costs, resulting in payment shortfalls.1  However, hospital payment rates are often bolstered by additional supplemental payments in the form of Disproportionate Share Hospital Payments (DSH) and other supplemental payments. After accounting for these payments, many hospitals receive Medicaid payments that may be in excess of cost. Understanding how much Medicaid pays hospitals is difficult because there is no publicly available data source that provides reliable information to measure this nationally across all hospitals. Different data sources use different definitions of what counts as payments and costs, so estimates are sensitive to these data limitations.

Understanding the components of Medicaid payment to hospitals and how much Medicaid pays hospitals is important given the many policy changes taking place. First, the Affordable Care Act (ACA) is leading to changes in hospital payer mix, especially in states adopting the Medicaid expansion where studies have shown a decline in self-pay discharges and a corresponding increase in Medicaid discharges.2 ,3 ,4  Second, the ACA calls for reductions in DSH payments, and other federal policy changes are focused on limiting the use of supplemental payments.  These changes could have important implications for Medicaid payments to hospitals at the same time that Medicaid is a growing share of hospital payer mix, especially among safety net hospitals that serve a disproportionately high number of Medicaid and uninsured patients.

This brief provides an overview of how Medicaid pays hospitals and discusses changes related to the ACA and supplemental payments that will have implications for hospital financing. It draws on existing literature and published reports as well as information collected from semi-structured interviews with hospital associations and federal agencies.5  Interviews focused on respondents’ perspectives of how hospitals were likely fare under the ACA and changes in Medicaid payment policy. In addition, we used data from the 2013 and 2014 Medicare cost reports to try to measure Medicaid payment and uncompensated care in 2013 and 2014.

Background

How Does Medicaid Pay Hospitals?

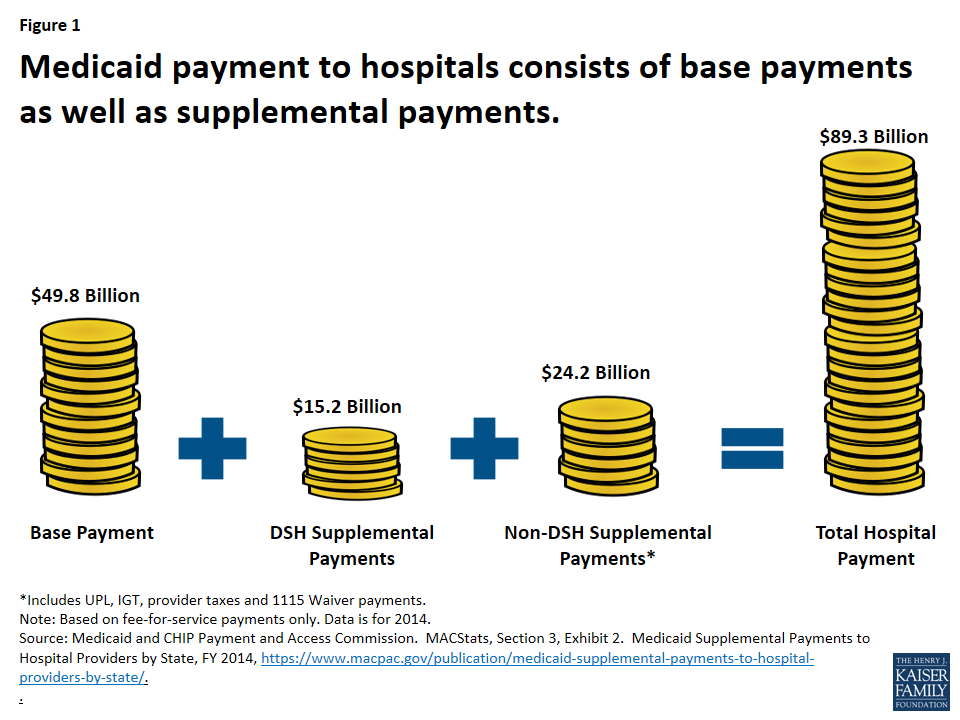
Hospital payment for a particular patient or service is usually different than the charge for that service (i.e., prices set by the hospital) or the cost to the hospital of providing the service (i.e., actual incurred expenses). In Medicaid, payment rates, sometimes called the “base rate,” are set by state Medicaid agencies for specific services used by patients. In addition, Medicaid also may make supplemental payments to hospitals (Figure 1).6 

Figure 1: Medicaid payment to hospitals consists of base payments as well as supplemental payments.

Base Payment. The base payment rates are reimbursed through fee-for-service or managed care arrangements for services provided to Medicaid beneficiaries. States have wide discretion in setting these rates. As discussed below, base rates are often not reflective of charges or costs for services.

Supplemental Payments. Supplemental payments are payments beyond the base rate that may or may not be tied to specific services. States often use Upper Payment Limits (UPL), Intergovernmental Transfers (IGT), provider taxes, or waivers to finance and direct supplemental payments. UPL rules allow states to make up the difference between a reasonable estimate of what Medicare would pay and Medicaid payments (in aggregate within a type and class of provider). IGTs or provider taxes are often used to generate the non-federal share for Medicaid payments that are then redistributed to providers as additional Medicaid payments. In addition, Medicaid Disproportionate Share Hospital (DSH) payments are made to hospitals serving high proportions of Medicaid or low-income patients.

Nationally, all supplemental Medicaid payments combined amounted to 44 percent of Medicaid fee-for-service payments to hospitals in 2014.7  Non-DSH supplemental payments (which includes UPL, IGT, and revenue generated from provider taxes) alone accounted for 15 percent of Medicaid fee-for-service payments. Almost all states make Medicaid DSH payments to hospitals, and most states also use some other form of supplemental payments, although both the amount of supplemental payments and how they are distributed to hospitals varies considerably across states.8  Supplemental payments as a proportion of total Medicaid fee-for-service payments to hospitals varies from a low of about 2 percent in North Dakota, South Dakota, and Maine to more than two-thirds in Vermont and Pennsylvania.9 

How Much Does Medicaid Pay Hospitals?

Since payment rates are either negotiated (with health plans) or set by the federal government for Medicare or state governments for Medicaid fee-for-service, payments that hospitals receive for patient care do not necessarily reflect what hospitals charge for those services or the cost of providing those services;10  rather, hospitals may receive payments above costs or below costs. Payments below costs would result in a “shortfall.”

Due to data challenges and differences in what is counted as a Medicaid cost and payment (see Appendix A), estimates of Medicaid payments to hospitals vary. The American Hospital Association (AHA) estimated that Medicaid payments to hospitals amounted to 90 percent of the costs of patient care in 2013, while Medicare paid 88 percent of costs; by contrast, hospitals received considerable overpayment from private insurers, amounting to 144 percent of costs.11 ,12  The most recent Medicaid and CHIP Payment and Access Commission (MACPAC) report to Congress, based on the 2011 DSH audit reports, shows that DSH hospitals were paid an average of 93 percent of total Medicaid costs, accounting for base Medicaid payments and non-DSH supplemental payments. After DSH payments, hospitals received 107% of costs on average nationally but ranged from 81 percent in the lowest paying state to 130 percent in the highest paying state.13  Our own analysis of the Medicare Cost Reports finds that Medicaid payments covered 93% of costs in 2014.14  However, we find great variation at the state or individual hospital level, indicating that hospitals may have very different experiences of the extent to which Medicaid payment covers Medicaid costs.

How has the Medicaid expansion affected hospital finances?

Expanded health insurance coverage through the ACA (both Medicaid and private insurance) is having a major impact on hospital payer mix for many hospitals.  A number of reports show increases in Medicaid discharges and declines in uninsured or self-pay discharges for hospitals located in states that implemented the Medicaid expansion. In contrast, hospitals located in states that did not expand Medicaid are not seeing these large shifts in payer mix. 15 ,16 ,17 

One report that examined the nation’s largest not-for-profit hospital system (Ascension Health) was able to examine not only changes in discharges but also changes in hospital revenues and costs.  Like other studies, data from Ascension Health hospitals showed that hospitals in states that expanded Medicaid experienced larger increases in Medicaid discharge volumes and patient revenue from 2013 to 2014 compared to hospitals in states that did not expand Medicaid. Ascension hospitals in expansion states also observed a much larger decrease in uninsured/self-pay volumes as well as charity care.18  Overall, Ascension Health hospitals in Medicaid expansion states observed a $35 million decrease in charity care between 2013 and 2014, but they also saw Medicaid shortfall amounts rise by $23 million, resulting in a net decrease of $12 million in the costs of care to the poor.19   Shortfalls grew as a result of both increases in Medicaid volume and payment rate changes in some states. Replicating the Ascension analysis for hospitals nationally is difficult due to limited reliable data.

The cost of uncompensated care has declined among hospitals in Medicaid expansion states, while such costs have remained flat among hospitals in states that did not expand Medicaid. Analysis of the Medicare Cost Report data for 2013 and 2014 shows overall declines in uncompensated care.  In 2013, total uncompensated care costs for hospitals (including charity care costs and bad debt) were $34.9 billion, with hospitals in expansion states incurring about $16.7 billion and hospitals in non-expansion states incurring about $18.1 billion.20  In 2014, uncompensated care fell to $28.9 billion nationwide, a $6 billion or 17% drop, with nearly all of the decrease occurring in expansion states (where uncompensated care costs were $11 billion in 2014, $5.8 billion or 35% less than the year before). In non-expansion states, the change in uncompensated care was nearly flat between 2013 and 2014, dropping just 1% (or $0.2 billion) to $17.9 billion in 2014 (Figure 2).

Figure 2: Hospitals in expansion states saw a reduction in uncompensated care costs from 2013 to 2014. $ in billions

Unfortunately, we are not able to quantify how much of the decrease in hospital uncompensated care costs was offset by increases in Medicaid shortfall amounts, because such data are not reliable in the Medicare Cost Reports (i.e. supplemental Medicaid payments are likely to be under-reported). While the experience of the Ascension Health system suggests that rising Medicaid shortfalls are offsetting the potential financial benefit of lower uncompensated care costs, this outcome is likely to vary substantially across hospitals.

Whether hospitals come out ahead financially under the ACA will depend on numerous factors – many of which are unrelated to Medicaid.  The ACA included a number of restrictions on Medicare payments for hospitals and expanded coverage has also resulted in markets shifts and new competition.  Hospitals also may see shifts in patient acuity, Medicaid payment rate changes or other changes in Medicaid payment policy. In addition, hospitals are constantly implementing strategies to increase revenue (e.g. diversify payer mix) and reduce the costs of providing services. Many safety net hospitals are trying to diversify their payer mix by changing their “safety net image” in the community, competing more aggressively for privately insured patients, retaining the privately insured patients they already have, and expanding services beyond inner city service areas where they are typically located.21   Thus, Medicaid expansion is just one of many factors that will influence hospitals’ financial viability in the future.

Given this variation and difficulties with underlying data, better data are needed to capture how hospital finances are faring under the ACA, and specifically how Medicaid revenues and shortfalls are changing.  Stakeholders interviewed for this project thought that the Medicaid expansion would be a financial benefit to hospitals, but payment levels were a concern; however, these concerns were secondary to broader concerns about upcoming and potential changes to Medicaid supplemental payments.

What payment policy changes could affect Medicaid hospital payments?

Hospitals are facing several policy changes that may affect Medicaid payments. Over time, state budget pressures have resulted in an increasing reliance on supplemental payments (versus base payments) to finance Medicaid hospital services. However, a number of upcoming policy changes, including reductions in DSH payments and limits on other supplemental payments, will restrict the use of supplemental payments. Federal officials believe that reform of Medicaid supplemental payments is needed to make payment more transparent, targeted, and consistent with delivery system reforms that reduce health care costs, and increase quality and access to care. However, these policy changes are causing concern among hospitals that have long been dependent on Medicaid revenue for their financial viability.22 ,23 ,24   In addition, payment changes are occurring against the backdrop of coverage expansions under the ACA, which are affecting payer mix for some hospitals.

Changes in Base Payment Rates

Changes in state reimbursement rates for hospitals have a big effect on Medicaid hospital financing, especially for safety net hospitals that serve a large number of Medicaid patients. Each year, states must balance their budgets, and consideration of Medicaid payment rates for providers and managed care organizations factor in to these discussions. In general, increases in base rates have lagged behind increases in costs during economic downturns as states often restrict (freeze or reduce) provider rates. Even as the economy has recovered, in fiscal years 2015 and 2016, there were more states restricting (freezing or cutting) rates for Medicaid hospital inpatient care than there were states increasing rates.25   While the economy is improving and resources are not as scarce as during a recession, states balance the need to increase Medicaid payment rates to ensure provider participation and access with overall budget decisions.

Changes in Medicaid DSH Funding

In 2014, federal DSH allotments totaled $11.7 billion.26  Under current law, DSH spending is limited by annual federal allotments and individual hospital limits (hospitals cannot receive DSH payments in excess of uncompensated care costs).  The ACA calls for reductions in Medicaid DSH payments, originally scheduled to begin in 2014 but delayed until 2018.27  These reductions will amount to $43 billion between 2018 and 2025; reductions start at $2 billion in FY 2018 and increase to $8 billion by FY 2025.  The ACA requires the Secretary of HHS to develop a methodology to allocate the reductions that must take into account certain factors that would allocate larger percentage reductions on states with the lowest percentages of uninsured individuals and states that do not target DSH payments to hospitals with high levels of uncompensated care. It is unclear if or how HHS will adjust the DSH reductions to account for the fact that some states may have higher uninsured rates because they have opted to not implement the Medicaid expansion. MACPAC analysis shows that current state DSH allocations are not tied to a hospital’s share of Medicaid and other low-income patients, its uncompensated care burden, and its delivery of essential community services.28 

In general, many hospitals and hospital associations are skeptical that the increase in patient revenue under the ACA will make up for the loss of Medicaid DSH funds, although the impact will vary depending on hospitals’ prior dependence on Medicaid DSH funding as well as federal and state government decisions on how the remaining DSH funds will be distributed across states and hospitals. Safety net hospitals are particularly vulnerable because of their high dependence on Medicaid DSH funds, high numbers of uninsured, few privately insured or Medicare patients, and generally weaker financial condition.29  An analysis of California concluded that reductions in DSH payments to the state’s public hospitals would not be fully offset by increased revenue from paying patients due to the high number of people who would remain uninsured, low Medicaid reimbursement rates, and the rising costs of care.30  Analyses by the New York City Health and Hospitals Corporation also estimated that DSH cuts will put a strain on hospitals, possibly leading to reductions in hospital medical staff and services.31 

Changes in Other Supplemental Payments

While states’ reliance on supplemental payments as a source of revenue for hospitals has increased, lack of data and transparency on state’s use of supplemental payments makes federal oversight of these programs difficult.32   Federal officials are working to reform how states use supplemental payments in managed care and waivers, as well as the use of provider taxes.

Managed Care Rules. While UPL payments to hospitals have always been restricted to fee-for-service payment only, some states have used pass-through mechanisms to direct supplemental payments to selected hospitals through managed care plans. The Medicaid managed care rules originally proposed by the federal government would have restricted states’ ability to direct supplemental payments to providers through managed care plans.33   Under the Final Rule published in May 2016, these supplemental payments to hospitals would be phased out over 10 years (2017-2027), by 10 percentage points each year. So, while still an area of concerns, states and hospitals have more time to make rate adjustments over time.

DSRIP.  The Delivery System Reform and Incentive Programs (DSRIP) allow states to use supplemental payments for delivery system reforms in their Medicaid programs.  These programs have been implemented through Section 1115 waivers in eight states, including California, Texas, Massachusetts, New Jersey, New Mexico, Kansas, and New York.34 ,35   Supplemental payments through DSRIP are being used to achieve particular goals, such as improved quality, outcomes, access to care and population health.  In most states with DSRIP programs, public hospitals are contributing all or most of the non-federal share of funding for these programs.36   The DSRIP programs are temporary, with the expectation that states and providers can transform their delivery systems so that they are more efficient, less costly, have lower use of hospital inpatient care, and more use of primary and preventive care.  While these payments are included under broad waivers that are budget neutral to the federal government, the amount of funding allocated for DSRIP programs is significant ($3.3 billion in California, $6.6 billion in Texas, $6.4 billion in New York)37 , and the phase-out of this funding will have implications for states and providers.  In renewing California’s DSRIP program in December 2015, funding is scheduled to phase down by 10% in year four and by 15% in year five.38 

Safety Net Care Pools.  Federal policy makers also have been focused on reforming the use of Medicaid Section 1115 demonstration waivers to fund state uncompensated care pools in nine states.  Officials laid out the principles for which such funds were to be used, including: (1) funds should not pay for the costs that would be covered in a Medicaid expansion; (2) they should support services provided to Medicaid beneficiaries and low-income uninsured individuals, and; (3) provider payment should promote provider participation and access, and should support plans in managing and coordinating care.39   To the extent that this funding has been used to supplement Medicaid base rates for certain hospitals, changes to these funding streams will affect hospital finances.  The agreement to renew Florida’s Low Income Pool – which reduced funds for the pool – included a $400 million increase in base rates to providers.  In May 2016, Texas received a 15 month extension of their waiver; the letter states that if CMS and the state cannot reach agreement during this extension period, CMS expects that the Uncompensated Care pool will not be renewed at the end of 2017 and that DSRIP will decrease by 25% each year starting in 2018.40 

Provider Taxes.  Provider taxes are an integral source of Medicaid financing governed by long-standing regulations.  Currently, all but one state (Alaska) reported a provider tax in FY 2015.41  Often provider taxes are used to bolster Medicaid payment rates for hospitals; however, these taxes can also be used to support state general revenues.  In Connecticut, the state has been retaining more of the provider tax to address state budget deficits instead of supporting hospitals.42  The state hospital association estimates that this has effectively decreased overall Medicaid payments from 50 percent of costs to 41 percent.43   In addition to state decisions about how to use funding from provider taxes, Congress is currently considering proposals to limit the use of provider taxes.  This action would restrict states’ flexibility to finance their share of Medicaid and could therefore shift additional costs to states or result in program cuts. Since states use provider taxes differently, limits would have different effects across states.

Conclusion

At this point, it is unclear how recent and upcoming policy changes in Medicaid will affect the financial viability of hospitals. Early analysis of the Medicare Care Report data show national declines in uncompensated care, especially in expansion states, although the data do not permit reliable estimates of trends in Medicaid payment amounts.  However, hospital margins are influenced by numerous factors, the health care and policy environment is in flux, and some hospitals will be better able to adapt to these changes than others. There is much concern from hospitals – especially safety net hospitals – about the decrease in Medicaid DSH funds and other changes in supplemental payments that they have depended on for years.  Most stakeholders from the hospital industry that we talked to thought that even after accounting for increases in Medicaid shortfall, the Medicaid expansion was a financial benefit, but changes to supplemental payments could have a much larger negative effect on hospital finances.  The overall impact of changes to supplemental payments also will depend on how much states adjust base payment rates to compensate for changes to supplemental payments.  Better data and monitoring of the effects of coverage changes as well as policy changes related to the supplemental payments will help to better evaluate hospitals financial well-being and the ability of safety net hospitals to serve Medicaid and uninsured persons.

Appendix

Appendix A:  Measuring Medicaid Payments to Hospitals

No data source consistently collects information on Medicaid costs and payment, and different estimates of Medicaid payment as a share of costs use different definitions of Medicaid costs and payments. Thus, estimates of Medicaid payment as a percent of costs are sensitive to the specific data source and definitions used to make the estimates. For example, when measuring Medicaid hospital payments, some data sources include supplemental payments, while others do not. In some data sources, these payment streams are not identified, making it difficult to understand what is and is not included. Further, in some cases, Medicaid costs may be defined to include only costs for Medicaid-covered services, while in others, the definition may include unpaid costs for services provided to Medicaid patients when Medicaid was not the primary payer—for example, costs for Medicare-funded services provided to people dually eligible for both Medicaid and Medicare.

Three main sources of estimating Medicaid payment relative to costs are the Medicare cost reports, the DSH Audit Reports and the American Hospital Association survey.  These sources vary in the data they collect and the definitions of costs and payments that they enable.  Each of these data sources may underreport other Medicaid supplemental payments, which may understate total Medicaid payments, and the data likely does not net out provider contributions towards the non-federal share, which are necessary to calculate net Medicaid payments and may contribute to overstating total Medicaid payments.

Medicare Cost Reports.  The Medicare Cost Reports (MCR) are annual reports that all Medicare-certified institutional providers are required to submit to Medicare. It is the only publicly available source of detailed financial data for most of the acute care hospitals in the U.S. These reports contain provider information such as facility characteristics, utilization data, cost and charges by cost center (in total and for Medicare), Medicare settlement data, and financial statement data that are used as part of the annual settlement between the federal government and the provider.44   These cost reports are designed to collect data necessary for Medicare reimbursement and thus do not verify or require Medicaid data, leading to questions about how reliable these data are for Medicaid payment analyses. Hospitals are not required to report DSH payments separately, but DSH payments are included as Medicaid revenues in these reports, and the reports only include costs for Medicaid-covered services.

Medicaid DSH Audit Reports.  The Medicaid DSH audit reports are required annual reports that states must submit to the federal government describing DSH payments made to each DSH hospital.45   In these reports, hospitals explicitly report DSH payments. DSH audits also include unpaid costs for services provided to Medicaid patients when Medicaid was not the primary payer. The primary limitation of this data source is that they exclude hospitals that do not receive DSH payments, which are likely to differ substantially from DSH hospitals in the amount of overpayment or underpayment from Medicaid.

American Hospital Association Reports (AHA).  The AHA uses data from their annual hospital survey to provide an estimate of Medicaid (and Medicare) payments relative to costs.  In their survey, AHA obtains information on each hospitals’ net and gross Medicaid payments, DSH, and supplemental payments. They calculate a cost-to-charge ratio and use this to determine the rate of underpayment for all hospitals. In their underpayment calculation, they include all payment adjustments.46   While AHA publishes annual reports on overall hospital uncompensated care costs, as well as Medicare and Medicaid underpayments, the detailed financial data are not available on their public use files.

As a result of these differences, as well as limitations in the underlying data, estimates of Medicaid payment as a share of cost vary (see Table A1). However, most estimates indicate that Medicaid payments cover most (more than 90%) costs, with one estimate indicating that some hospitals (those that receive DSH payments) receive Medicaid reimbursement in excess of costs.

Table A1: Estimates of Medicaid Payments as a Share of Costs
SourceDataYearEstimate of Medicaid Payment as a Share of Medicaid CostNotes
American Hospital Association (AHA)47 AHA annual survey201390%
  • Includes non-federal, acute care hospitals
  • Payments include supplemental payments and DSH
  • Cost data reflect payments for Medicaid beneficiaries for Medicaid-covered services
Medicaid and CHIP Payment and Access Commission (MACPAC)48 DSH Audit Reports201193% excluding DSH and 107% including DSH
  • Includes only hospitals that receive DSH payments
  • Payments include DSH, but these payments are reported separately
  • Cost data includes cost of services for Medicaid patients for which Medicaid is not primary payer
Authors’ analysisMedicare Cost Reports201493%
  • Includes non-federal, acute care hospitals
  • Payments include DSH
  • Cost data reflect payments for Medicaid beneficiaries for Medicaid-covered services

Endnotes

  1. American Hospital Association, “Table 4.4: Aggregate Hospital Payment-to-cost Ratios for Private Payers, Medicare,” in Trendwatch Chartbook 2015 (Chicago, IL: American Hospital Association, 2015), http://www.aha.org/research/reports/tw/chartbook/2015/table4-4.pdf. ↩︎
  2. Deborah Bachrach, Patricia Boozang, and Mindy Lipson, The Impact of Medicaid Expansion on Uncompensated Care Costs:  Early Results and Policy Implications for States (Princeton, NJ: The Robert Wood Johnson Foundation, State Health Reform Assistance Network, June 2015),   http://www.rwjf.org/en/library/research/2015/06/the-impact-of-medicaid-expansion-on-uncompensated-care-costs.html. ↩︎
  3. Robin Rudowitz and Rachel Garfield, New Analysis Shows States with Medicaid Expansion Experienced Declines in Uninsured Hospital Discharges (Washington, DC: Kaiser Commission on Medicaid and the Uninsured, September 2015), https://modern.kff.org/health-reform/issue-brief/new-analysis-shows-states-with-medicaid-expansion-experienced-declines-in-uninsured-hospital-discharges. ↩︎
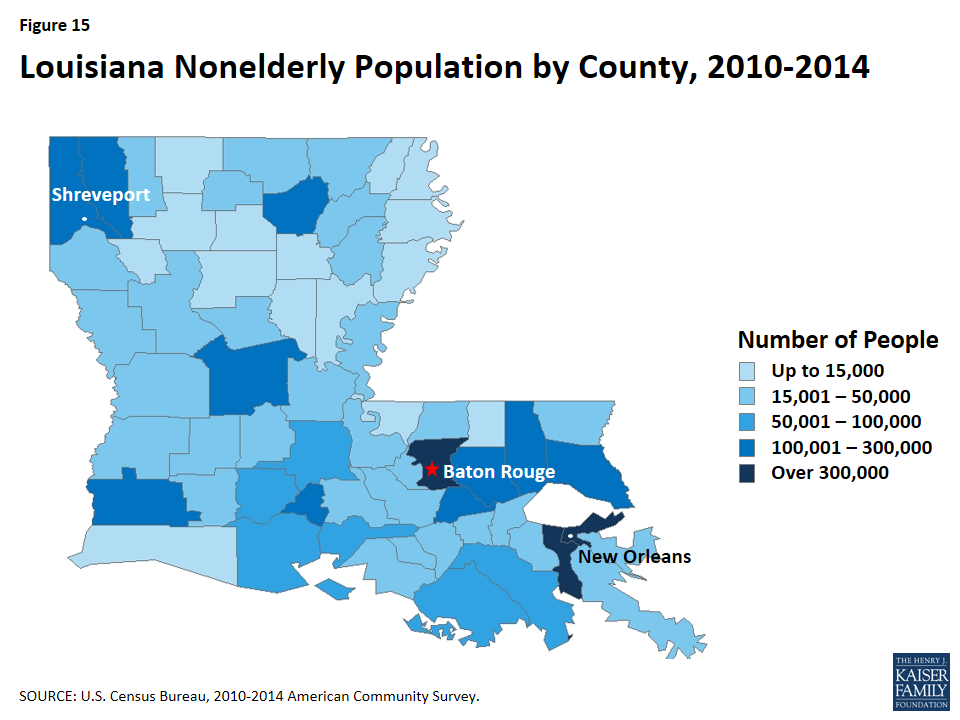
  4.   Sayeh Nikpay, Thomas Buchmueller, and Helen G. Levy, “Affordable Care Act Medicaid Expansion Reduced Uninsured Hospital Stays In 2014,” Health Affairs. 35, no. 1 (2016): 106-10, http://content.healthaffairs.org/content/35/1/106.abstract. ↩︎
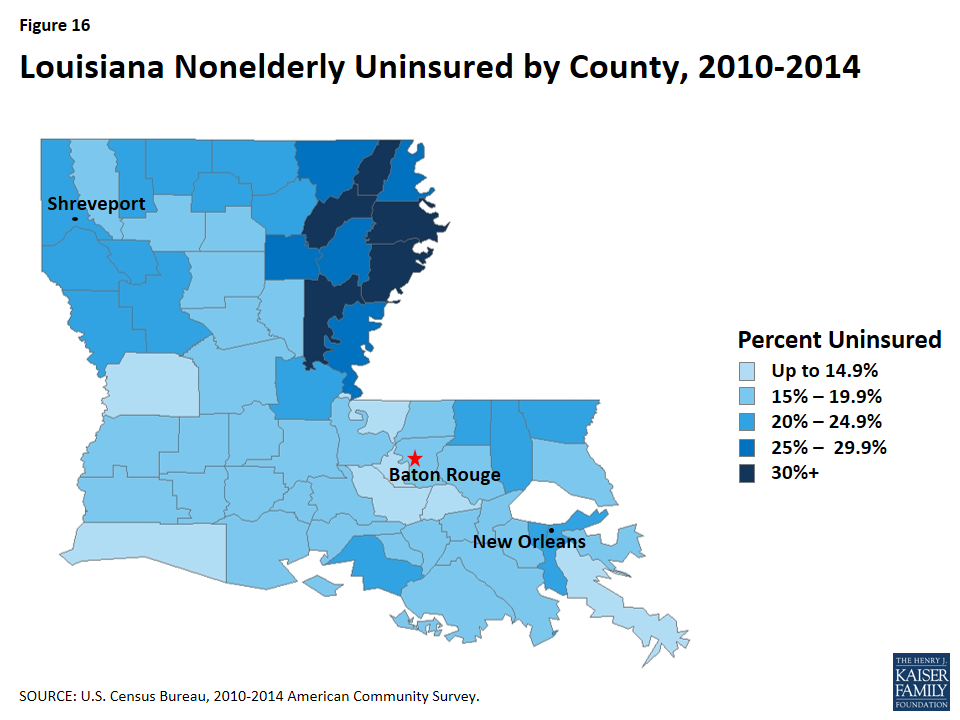
  5. Organizations interviewed for this report included the American Hospital Association, America’s Essential Hospitals, the Connecticut Hospital Association, the California Public Hospital Association, the Medicaid and CHIP Payment and Access Commission (MACPAC), and the Center for Medicare and Medicaid Services (CMS). ↩︎
  6. Medicaid and CHIP Payment and Access Commission, “Examining the Policy Implications of Medicaid Non-Disproportionate Share Hospital Supplemental Payments,” chap. 6 in March 2014 Report to the Congress on Medicaid and CHIP (Washington, DC: March 2014), 183-209, https://www.macpac.gov/publication/report-to-the-congress-on-medicaid-and-chip-314/. ↩︎
  7. Medicaid and CHIP Payment and Access Commission, “Medicaid Supplemental Payments to Hospital Providers by State, FY 2014” Exhibit 23 in December 2015 MACStats: Medicaid and CHIP Data Book. https://www.macpac.gov/wp-content/uploads/2015/11/EXHIBIT-23.-Medicaid-Supplemental-Payments-to-Hospital-Providers-by-State-FY-2014-millions.pdf ↩︎
  8. Ibid. ↩︎
  9. Ibid. ↩︎
  10. Uwe Reinhardt, “The pricing of U.S. hospital services:  Chaos behind a veil of secrecy,” Health Affairs, 25, no. 1 (2006): 57-69, http://content.healthaffairs.org/content/25/1/57.full.pdf+html. ↩︎
  11. American Hospital Association, “Table 4.4: Aggregate Hospital Payment-to-cost Ratios for Private Payers, Medicare,” in Trendwatch Chartbook 2015 (Chicago, IL: American Hospital Association, 2015), http://www.aha.org/research/reports/tw/chartbook/2015/table4-4.pdf. ↩︎
  12. AHA estimates that in 2014, Medicare paid 89 percent of costs for Medicare patients and Medicaid paid 90 percent of costs ofr Medicaid patients.  See: American Hospital Association, “Underpayment by Medicare and Medicaid Fact Sheet: Underpayment by Medicare and Medicaid Fact Sheet,” (Chicago, IL: American Hospital Association, 2016) http://www.aha.org/content/16/medicaremedicaidunderpmt.pdf ↩︎
  13. MACPAC’s analysis showed similar findings using the Medicare Cost Reports (from among a subset of hospitals with complete data from both sources). Medicaid and CHIP Payment and Access Commission, “Improving Data as the First Step to a More Targeted Disproportionate Share Hospital Policy,” chap. 3, March 2016 Report to Congress on Medicaid and CHIP, (Washington, DC: March 2016), 56-73, https://www.macpac.gov/publication/improving-data-as-the-first-step-to-a-more-targeted-disproportionate-share-hospital-policy/. ↩︎
  14. Using data from Worksheet S-10 in the 2013 and 2014 Medicare Costs Reports, we calculated revenue over costs as net Medicaid revenue divided by the product of Medicaid charges and the cost to charge ratio. We restricted the data to just non-federal acute care hospitals that had both 2013 and 2014 data. We adjusted spending amounts to reflect the entire year. We treated blanks in the data as missing data, and did not include them in the rate. Worksheet S-10 (“Hospital Uncompensated and Indigent Care Data”), 2013 and 2014 Medicare Cost Reports, https://www.cms.gov/Research-Statistics-Data-and-Systems/Downloadable-Public-Use-Files/Cost-Reports/Cost-Reports-by-Fiscal-Year.html. ↩︎
  15. Bachrach et al., op. cit. ↩︎
  16. Rudowitz and Garfield, op. cit. ↩︎
  17. Nikpay, Buchmueller, and Levy, op. cit. ↩︎
  18. Peter Cunningham, Rachel Garfield, and Robin Rudowitz, How are Hospitals Faring under the Affordable Care Act?  Early Experiences from Ascension Health.  (Washington DC: Kaiser Commission on Medicaid and the Uninsured, October 2014),   https://modern.kff.org/health-reform/issue-brief/how-are-hospitals-faring-under-the-affordable-care-act-early-experiences-from-ascension-health/ ↩︎
  19. Ibid., Table 5. ↩︎
  20.  Using the Worksheet S-10 data from the 2013 and 2014 Medicare Cost Reports, we calculated uncompensated care by summing bad debt costs and charity care costs. As we did when calculating the revenue over costs, we restricted the data to non-federal acute care hospitals that had both 2013 and 2014 data. We also adjusted spending to reflect the entire year. By linking the Medicare Cost Report data to the American Hospital Association Hospital Data, available through the AHA Data Viewer, we identified the location of each hospital. We categorized all states that had expanded by December 31, 2014 as “expansion states” and all others as “non-expansion states.” ↩︎
  21. Teresa Coughlin, Sharon Long, Rebecca Peters, Robin Rudowitz, and Rachel Garfield, Evolving Picture of Nine Safety-Net Hospitals:  Implications of the ACA and Other Strategies (Washington, DC: Kaiser Commission on Medicaid and the Uninsured, April 2015),  https://modern.kff.org/health-reform/issue-brief/evolving-picture-of-nine-safety-net-hospitals-implications-of-the-aca-and-other-strategies/. ↩︎
  22. America’s Essential Hospitals, “Our View: Essential Hospitals Rely on Medicaid Supplemental Payments,” (Washington DC: America’s Essential Hospitals, March 2016) http://essentialhospitals.org/policy/essential-hospitals-rely-on-supplemental-payments/. ↩︎
  23. Christopher Weaver, “Hospitals Expected More of a Boost From Health Law,” Wall Street Journal, June 3, 2015,    http://www.wsj.com/articles/hospitals-expected-more-of-a-boost-from-health-law-1433304242. ↩︎
  24. Kentucky Hospital Association, “Code Blue:  Many Kentucky Hospitals Struggling Financially Due to Health System changes,” (Louisville, KY: Kentucky Hospital Association, April 2015) http://www.new-kyha.com/Portals/5/NewsDocs/Code%20Blue%20Report%20Web.pdf. ↩︎
  25. Vernon Smith, Kathleen Gifford, Eileen Ellis, Robin Rudowitz, Laura Snyder, and Elizabeth Hinton, Medicaid Reforms to Expand Coverage, Control Costs and Improve Care.  Results from a 50-State Medicaid Budget Survey for State Fiscal Years 2015 and 2016.  (Kaiser Family Foundation and National Association of Medicaid Directors, October 2015) https://modern.kff.org/medicaid/report/medicaid-reforms-to-expand-coverage-control-costs-and-improve-care-results-from-a-50-state-medicaid-budget-survey-for-state-fiscal-years-2015-and-2016/. ↩︎
  26. 79 Fed. Reg. 11436 – 11445 (February 28, 2014), available at https://www.federalregister.gov/articles/2014/02/28/2014-04032/medicaid-program-preliminary-disproportionate-share-hospital-allotments-dsh-for-fiscal-year-fy-2014. ↩︎
  27. 42 U.S.C. § 1396r-4(f)(7). See https://www.law.cornell.edu/uscode/text/42/1396r-4 . ↩︎
  28. Medicaid and CHIP Payment and Access Commission, “Analysis of Current and Future Disproportionate Share Hospital Allotments,” chap. 2, March 2016 Report to Congress on Medicaid and CHIP, (Washington, DC: March 2016), 21-54, https://www.macpac.gov/publication/analysis-of-current-and-future-disproportionate-share-hospital-allotments/. ↩︎
  29. Evan Cole, Daniel Walker, Arthur Mora, Mark Diana, “Identifying Hospitals That May Be at Most Financial Risk from Medicaid Disproportionate Share Hospital Payment Cuts,” Health Affairs, 33, no. 11 (2014): 2025-2033, http://content.healthaffairs.org/content/33/11/2025.abstract. ↩︎
  30. Katherine Neuhausen, Anna Davis, Jack Needleman, Robert Broook, David Zingmond, and Dylan Roby. “Disproportionate-Share Hospital Payment Reductions May Threaten the Financial Stability of Safety-Net Hospitals.” Health Affairs, 33, no. 6 (2014): 988-996, http://content.healthaffairs.org/content/33/6/988.abstract. ↩︎
  31. Office of the New York City Comptroller, Holes in the Safety Net:  Obamacare and the Future of New York City’s Health and Hospitals Corporation, (New York, NY: Office of the New York City Comptroller, May 2015), http://comptroller.nyc.gov/wp-content/uploads/documents/Holes_in_the_Safety_Net.pdf. ↩︎
  32. Government Accountability Office, “Medicaid:  Improving Transparency and Accountability of Supplemental Payments and State Financing Methods,” (Washington, DC: Government Accountability Office, November 2015), http://www.gao.gov/products/GAO-16-195T. ↩︎
  33. Moira Forbes and Chris Park, “Issues in Medicaid Managed Care Rate Setting,” (Washington DC: Medicaid and CHIP Payment and Access Commission, May 2015) https://www.macpac.gov/wp-content/uploads/2015/05/Issues-in-Medicaid-Managed-Care-Rate-Setting.pdf. ↩︎
  34. Alexandra Gates, Robin Rudowitz and Jocelyn Guyer, An Overview of Delivery System Reform Incentive Payment (DSRIP) Waivers (Washington, DC: Kaiser Commission on Medicaid and the Uninsured, September 2014), https://modern.kff.org/medicaid/issue-brief/an-overview-of-delivery-system-reform-incentive-payment-waivers/. ↩︎
  35. Jocelyn Guyer, Naomi Shine, Robin Rudowitz, and Alexandra Gates, Key Themes From Delivery System Reform Incentive Payment (DSRIP) Waivers in 4 States (Washington, DC: Kaiser Commission on Medicaid and the Uninsured, April 2015), https://modern.kff.org/medicaid/issue-brief/key-themes-from-delivery-system-reform-incentive-payment-dsrip-waivers-in-4-states/. ↩︎
  36. Gates, Rudowitz and Guyer, op. cit. ↩︎
  37. Medicaid and CHIP Payment and Access Commission, June 2015 Report to Congress on Medicaid and CHIP, (Washington, DC: June 2015), https://www.macpac.gov/wp-content/uploads/2015/06/June-2015-Report-to-Congress-on-Medicaid-and-CHIP.pdf ↩︎
  38. Letter from CMS to Mari Cantwell, Chief Deputy Director Department of Health Care Services, California.  (Washington, DC:  CMS, December 30, 2015).  https://www.medicaid.gov/Medicaid-CHIP-Program-Information/By-Topics/Waivers/1115/downloads/ca/medi-cal-2020/ca-medi-cal-2020-ca.pdf ↩︎
  39. Letter from CMS to Justin Senior, Deputy Secretary for Medicaid, State of Florida, (Washington, DC: CMS, May 21, 2015),  https://www.medicaid.gov/Medicaid-CHIP-Program-Information/By-Topics/Waivers/1115/downloads/fl/Managed-Medical-Assistance-MMA/fl-medicaid-reform-lip-ltr-05212015.pdf. ↩︎
  40. Letter from CMS to Gary Jessee, Associate Commissioner for Medicaid/CHIP, State of Texas.  (Washington, DC: CMS, May 2016).  https://www.medicaid.gov/Medicaid-CHIP-Program-Information/By-Topics/Waivers/1115/downloads/tx/tx-healthcare-transformation-ca.pdf ↩︎
  41. Smith, Gifford, Ellis, Rudowitz, Snyder, and Hinton, op. cit. ↩︎
  42. Arielle Levin Becker, “CT Hospitals Say Obamacare Hasn’t Cut Uncompensated Care,” CT Mirror, September 29, 2014,  http://ctmirror.org/2014/09/29/ct-hospitals-say-obamacare-hasnt-cut-uncompensated-care/. ↩︎
  43. Interview with Connecticut Hospital Association. ↩︎
  44. “Cost Reports,” CMS, https://www.cms.gov/Research-Statistics-Data-and-Systems/Downloadable-Public-Use-Files/Cost-Reports/ and “Healthcare Cost Report Information System,” ResDAC, https://www.resdac.org/cms-data/files/hcris. ↩︎
  45. “Medicaid Disproportionate Share Hospital (DSH) Payments,” CMS, https://www.medicaid.gov/medicaid-chip-program-information/by-topics/financing-and-reimbursement/medicaid-disproportionate-share-hospital-dsh-payments.html. ↩︎
  46. American Hospital Association, “Underpayment by Medicare and Medicaid Fact Sheet,” op. cit. ↩︎
  47. Ibid. Telephone conversation with Caroline Steinberg from the AHA Policy Division provided additional information used in notes. ↩︎
  48. Medicaid and CHIP Payment and Access Commission, March 2016 Report to Congress on Medicaid and CHIP, (Washington, DC: March 2016), https://www.macpac.gov/wp-content/uploads/2016/03/March-2016-Report-to-Congress-on-Medicaid-and-CHIP.pdf. ↩︎

Becoming “Healthy Louisiana”: An Overview of Planning Efforts to Implement the Medicaid Expansion

Published: Jun 8, 2016

As the first act of his new Administration, Louisiana Governor John Bel Edwards signed the state’s Affordable Care Act (ACA) Medicaid expansion into law, setting in motion a key initiative that is anticipated to have far-reaching benefits for the state. Louisiana became the 32nd state in the nation (including DC), and the 7th of the 17 states that make up the American South, to adopt the Medicaid expansion to adults with incomes up to 138% of the federal poverty level (FPL), $16,394 for an individual as of 2016. Until now, childless adults in Louisiana were not eligible for Medicaid and eligibility for parents was limited to 24% FPL ($4,838 for a parent in a family of three as of 2016).1  As the newest state to expand, Louisiana’s experience may provide guidance for other states that expand Medicaid in the future. This fact sheet provides an overview of the state’s expansion planning activities. Future work will examine implementation experiences and identify results and lessons learned.

The stakes and expectations for Healthy Louisiana, as the expansion is called, are high. According to state data, up to 450,000 people may potentially be eligible for the expansion, and the state must enroll 375,000 to realize its projected state general fund savings of more than $180 million for FY2017.2  If this goal is achieved, enrollment of nonelderly, nondisabled Medicaid beneficiaries, which was 983,000 as of May 2016, would increase by 28%.3  This increase would be generally consistent with the average enrollment increase during the first year of implementation among states that expanded Medicaid, although enrollment increases across expansion states vary widely.4  The state launched enrollment in Healthy Louisiana on June 1st, and the state reports that over 200,000 individuals had been enrolled as of June 10th.5  This enrollment reflects the state’s shift of individuals from existing limited benefit health benefit programs to the full-benefit expansion.

Coverage under Healthy Louisiana will become effective July 1st, but expansion planning has been underway for several months. Preparation efforts brought together experts in Medicaid policy and procedure, communications, outreach and enrollment, IT services, and other areas. Ongoing progress will depend upon leadership, an effective federal-state partnership, buy-in from state employees and an involved stakeholder community. As the state continues its enrollment efforts, it will draw on its experience simplifying administrative practices from nearly two decades ago during the implementation of its children’s health insurance program, LACHIP. The state is planning coordinated outreach and enrollment efforts and will utilize data-driven approaches designed to accelerate enrollment. Louisiana’s planning efforts span these key areas:

  • Communications and Messaging: As one of its first implementation steps, the state established Healthy Louisiana, a brand intended to convey the state’s vision for health coverage opportunities and better health outcomes. The state created a Healthy Louisiana website to provide program information, enrollment instructions, and news. A state tour was conducted in May, concluding June 1st at an event in New Orleans, at which the Governor, other officials and advocates focused attention on the launch of the new coverage and the enrollment work that lies ahead. The state is continuing to refine its messaging strategy and to develop outreach materials, which it plans to evolve over time to maintain momentum after coverage becomes effective, July 1.
  • Systems-Assisted Approaches: Recognizing the central role that eligibility systems will play in successful enrollment efforts, the state has already begun taking steps to establish coordination between HealthCare.gov and the state Medicaid eligibility system. Louisiana also plans to employ a number of data-driven, “low touch, high impact” strategies to enroll specific populations as quickly and seamlessly as possible. By mining existing databases to identify people eligible for Medicaid – such as individuals already enrolled in limited health benefit programs and targeted households participating in the Supplemental Nutrition Assistance Program (SNAP) –the state aims to facilitate enrollment of some groups of eligible people into Medicaid without an application or by asking them to respond to an offer letter and answer a few simple questions. These approaches will help enable eligibility workers to focus their attention on applicants who need more extensive help and embed streamlined approaches into state enrollment and renewal processes over the longer term.
  • Application Assistance and Community Supports: Even with these facilitated enrollment efforts, many eligible people still will need to complete an application to enroll in Medicaid. Through both traditional and new approaches, Louisiana is planning to make enrollment assistance available where and when people need it. The state intends to expand deployment of outstationed Medicaid eligibility workers within the community and to enhance the efforts of its regional Medicaid Application Assistance Centers by providing supports and incentives. In addition, community organizations and institutions – many of which have gained experience over the past few years as navigators and certified application counselors — will be vital partners in this “all hands on deck” endeavor.
  • Targeting Specific Populations for Outreach and Enrollment: Louisiana plans to mount new efforts to find and enroll specific groups of people who are eligible for Medicaid for the first time. For example, the state is planning special activities to help connect eligible individuals to Medicaid when they reenter the community after a period of incarceration. People engaged in school-based strategies will expand their focus beyond eligible children to find and enroll newly eligible parents. There will be other opportunities for outreach and enrollment efforts targeted to other groups as well.

This fact sheet provides an initial look at the state’s planning activities. Future work will dig deeper to explore the state’s implementation experiences; the impact of its policy choices and strategies on enrollment; and the effects of the Medicaid expansion on new enrollees, providers, and the state. Louisiana’s experiences may provide lessons about productive avenues for outreach and enrollment and inform other states that may expand in the future.

  1. Tricia Brooks, Sean Miskell, Samantha Artiga, Elizabeth Cornachione, and Alexandra Gates, Medicaid and CHIP Eligibility, Enrollment, Renewal, and Cost-Sharing Policies as of January 2016: Findings from a 50-State Survey, (Washington, DC: Kaiser Commission on Medicaid and the Uninsured, January 2016), https://modern.kff.org/medicaid/report/medicaid-and-chip-eligibility-enrollment-renewal-and-cost-sharing-policies-as-of-january-2016-findings-from-a-50-state-survey/ ↩︎
  2. “Governor Edwards: Enrollment for Medicaid Expansion to Begin on June 1,” Louisiana State Website, (April 18, 2016) http://gov.louisiana.gov/news/enrollment-for-medicaid-expansion-to-begin-on-june-1 and presentation by Rebekah Gee, MD, Secretary of the Louisiana Department of Health and Hospitals, (May 9, 2016). ↩︎
  3. Calculations based on data provided by Louisiana Department of Health and Hospitals, MEMO981R2 INFOPAC Report, May 20, 2016. ↩︎
  4. Centers for Medicare & Medicaid Services, Medicaid & CHIP January 2015 Application, Eligibility, and Enrollment Data (Updated), (Baltimore, MD: Centers for Medicare & Medicaid Services, March 2015), https://www.medicaid.gov/medicaid-chip-program-information/program-information/downloads/updated-january-2015-enrollment-data.pdf ↩︎
  5. Communication with Louisiana Department of Health and Hospitals, June 8, 2016. ↩︎
News Release

Survey: Assisters Help Estimated 5.3 Million During 2016 ACA Open Enrollment, Down 10 Percent from Prior Year

1 in 3 Brokers Say Most Insurers Ended Commissions for Special Enrollment Policies

Published: Jun 8, 2016

During the third Affordable Care Act open enrollment period, assistance programs helped an estimated 5.3 million people — a number that was 10 percent lower than the prior year and that included a higher share of people renewing coverage, finds a new Kaiser Family Foundation survey of assister programs and brokers.

Both assisters and brokers report a shift toward more return customers among those who sought assistance during the 2016 ACA open enrollment period, which ran from Nov. 1, 2015 to Jan. 31, 2016. The survey finds just three in 10 assister programs (29%) say that “most to nearly all” of the consumers they helped during 2016 open enrollment were first-time applicants for ACA marketplace coverage, a drop from 53 percent in 2015. Brokers report a similar experience: More than half (52%) say that most people they helped during 2016 open enrollment were returning ACA marketplace customers, compared to 26 percent in 2015.

In its third year, the survey tracks the experiences of assistance programs signing people up for ACA coverage during open enrollment and, for consumers who qualify, during special enrollment periods. This year, for the second time, the survey includes health insurance brokers who helped people apply for non-group coverage in an ACA marketplace.

Among notable findings from brokers were reports of some insurers changing their approach to commissions for ACA marketplace policies, particularly when sold during special enrollment periods, which are available to people whose circumstances change in between open enrollment periods. Insurers have said that people enrolling during special enrollment periods are sicker than those who sign up during open enrollment. Six in 10 brokers (60%) said at least some insurers have stopped paying commissions on ACA marketplace policies sold outside open enrollment: 33 percent said most or all insurers have stopped paying commissions for special enrollment policies.

Other findings from the 2016 Survey of Health Insurance Marketplace Assister Programs and Brokers include:

  • During the 2016 open enrollment period, assister programs helped hundreds of thousands of consumers with real-time data verification problems. This included 230,000 consumers who needed assistance resolving issues with the ACA marketplace identity proofing system; at least 259,000 consumers who needed help with data-match inconsistencies related to real-time verification of income; and at least 172,000 who needed help with verification of immigration status.
  • Despite the shift to renewing consumers, about eight in 10 assister programs say “most” or “all to nearly all” consumers sought help because they lacked confidence to apply on their own and because they wanted help evaluating plan choices.

2016 Survey of Health Insurance Marketplace Assister Programs and Brokers

Authors: Karen Pollitz, Jennifer Tolbert, and Ashley Semanskee
Published: Jun 8, 2016

Executive Summary

The new system for Marketplace enrollment assistance under the Affordable Care Act (ACA) is becoming well established.  Some 5,000 Assister Programs helped consumers apply for financial assistance and select health plans for 2016 during the third Open Enrollment (OE3).  Eighty-seven percent of Programs have been in operation three years, and 7 in 10 of three year Programs report most or nearly all of their staff have also worked all three years.  Eighty-four percent of brokers certified to sell non-group Marketplace health plans this year also have worked all three Open Enrollments.  As this system of in-person help matures, important distinctions are emerging among entities which could provide opportunities to develop strategies for identifying and building on those that accomplish the most.  At the same time, substantial challenges face many Assister Programs and brokers that hinder their ability to help consumers access and successfully enroll in health coverage.

This report is based on findings from the 2016 Kaiser Family Foundation survey of Health Insurance Marketplace Assister Programs and Brokers.  The online survey was conducted from February 11 to March 4, 2016 as OE3 concluded.  As was the case in prior years, federal and state-operated Marketplaces provided contact information for directors of their Assister Programs, all of whom were invited to participate.  In addition, most Marketplaces provided contact information for brokers certified to sell their qualified non-group health plans, and for the second year, a sample of brokers was also invited to participate in the survey.

Assister Programs combined helped an estimated 5.3 million consumers during the third Open Enrollment, roughly a 10% decline from last year. This decline is significant in light of concerns over the slowing rate of annual Marketplace enrollment growth.  It may be that some already-enrolled consumers didn’t seek help again this year, particularly those in Medicaid who face a more straightforward annual redetermination process in many states, or those who elected to auto-renew their qualified health plans.  It may also be that other factors, including lack of public awareness and affordability concerns, affect the extent to which eligible uninsured individuals seek help.  Survey respondents described several key challenges, including limited resources and inherent complexities in the application and plan choice process that may also constrain the reach and productivity of Assister Programs.

Most help from Assister Programs was provided by those with very large caseloads.  About 1 in 4 Assister Programs helped more than 1,000 consumers during OE3, accounting for 80% all consumers helped by Assister Programs.  By contrast, 30% of Assister Programs helped 100 or fewer consumers during OE3, and these small caseload Programs account for just 1% of all consumers helped by Assister Programs.  Large caseload Programs include all types of Assister Programs – Navigator, Federally Qualified Health Center (FQHC) and Certified Application Counselor (CAC).  These large Programs are distinguished from smaller ones in several respects.  Large Programs were more likely to help consumers with more complex needs such as language translation (28% of large caseload Programs vs 8% of small caseload Programs), immigration-related problems (23% vs 5%), problems reporting income or household size (56% vs 35%).  In addition, large caseload Programs were more likely to help resolve Marketplace data verification problems (96% vs 81%).  Large caseload Programs were also more likely to engage in outreach activities, to help consumers resolve post-enrollment problems, and to coordinate with other Assister Programs.

Enrollment assistance shifted toward renewing consumers in 2016, though most who sought in- person help still were uninsured.  Last year 53% of Assister Programs said most or nearly all consumers they helped were new Marketplace participants.  This year, 29% said this was the case.  Increasingly Programs are serving a mix of new and renewing consumers – evidence that consumers need help to remain covered, not just to enroll for the first time.  At the same time, a majority of Programs say that most of their clients were uninsured when they sought help.  This may indicate some consumers are returning at Open Enrollment having lost their Marketplace coverage during the year.  In addition, it suggests Assister Programs remain focused on reaching the uninsured.

Some capacity shortages continue.  Overall 79% of Programs said they could serve everyone who sought help throughout OE3, but 21% had to turn some away during surge weeks in December and January.  This is unchanged from 2015.  Among large caseload Programs, 30% had to turn away at least some consumers.

Enrollment assistance remains time intensive.  For the third year, it took 90 minutes on average to help consumers enroll for the first time and like last year, it took 60 minutes on average to help renewing consumers.  Like last year, most Programs (71%) said they could help most consumers complete the plan selection process.  Also like last year, most consumers who seek help have limited understanding of the ACA and difficulty understanding insurance and comparing plan choices.  Complexity in the application itself also challenges many consumers, according to Assisters.

Assister Programs helped hundreds of thousands of consumers with Marketplace real-time data verification problems.  Programs helped nearly 230,000 consumers resolve problems related to Marketplace identity proofing.  The automated federal identity proofing system, based on credit reporting data, poses challenges for consumers without established credit history, and those who cannot pass it can face significant delays in applying for Marketplace coverage.  Several state Marketplaces have streamlined the system, including by authorizing certified Assisters to visually verify identity documents.  SBM Programs were more likely than FFM Programs (22% vs 14%) to say identity proofing problems usually could be resolved quickly during the initial visit.

Marketplaces also conduct real time verification of applicants’ immigration status and income, matching it to online data sources.  This system also poses challenges to certain consumers, for example, those who are self-employed or experience other income volatility.  In 2015, the federal Marketplace alone terminated coverage for 500,000 individuals who could not resolve data match inconsistencies (DMI) related to immigration, and reduced subsidies for 1.2 million individuals who could not resolve DMI related to income.  Nationwide, Assister Programs helped an estimated 172,000 consumers with immigration-related DMI during OE3, and 259,000 consumers with income-related DMI. This may be an indication that the volume of DMI problems is declining overall, or it may signify that many consumers faced with such problems are not getting in-person help to resolve them.  Small caseload Programs were more likely than large caseload Programs to say they would not help consumers resolve immigration DMI (19% vs. 4%) or income DMI problems (11% vs. 3%).

Medicaid file transfers can still pose challenges, especially in federal Marketplace states.  Nearly all SBM states have a single, integrated system that makes eligibility determinations for both Medicaid and Marketplace coverage. In contrast, in the 34 FFM and 4 SBM states that rely on healthcare.gov for Marketplace eligibility and enrollment functions, electronic accounts must be transferred between the federal and state systems to provide coordinated enrollment across Programs. Eight FFM states have authorized the federal system to make final Medicaid eligibility determinations, which can expedite the enrollment process. In the remaining 30 FFM states and 4 SBM states that use healthcare.gov, the federal system assesses Medicaid eligibility and the final determination is completed by the state.  Among Programs in assessment states, 34% said the Medicaid eligibility determination was usually completed in a timely manner.  Many Programs said they will try to expedite the process by helping clients file a separate application for Medicaid (44% in assessment states and 13% in determination states).  Among Programs that helped clients complete separate applications, 46% said one follow up visit was typically required, 20% said 2 or more follow up visits were typical.

Significant numbers of Assister Programs (37%) and brokers (53%) said most clients had questions about health plans that were not answered by information on the Marketplace web site. Most Assister Programs (61%) and brokers (67%) said most or nearly all consumers had difficulty understanding basic insurance concepts.  This number is down from years one and two (75%), though still substantial.  Two-thirds of Assister Programs said most QHP-eligible clients could select a plan during the initial visit; the rest said at least one follow up visit was needed.  Brokers made similar observations.

During the year, Assister Programs also helped consumers enroll through special enrollment periods (SEP) and resolve post-enrollment problems.  Assisters helped at least 830,000 consumers enroll through SEPs between Open Enrollments last year.  This is a 30% increase over SEP help we estimated following OE1 – possibly because OE1 was much longer leaving fewer months available for SEP sign ups.  Assister Programs also helped at least 349,000 consumers report mid-year changes (e.g. in income) to the Marketplace last year.  And Programs provided post-enrollment help to at least 745,000 consumers between OE2 and OE3.  Like last year, once enrolled many consumers needed help if coverage was terminated unexpectedly, claims were denied, their provider was not in the plan network or their medication was not on the plan formulary. Again as was the case last year, when Assister Programs can’t help resolve post enrollment problems on their own, usually they do not refer to Consumer Assistance Programs, but more often refer consumers back to their health plan or to the Marketplace call center.

On average, brokers each helped 110 consumers apply for Marketplace policies during the third Open Enrollment, unchanged from last year. In addition, nearly all brokers also sold policies off the Marketplace, on average 48 during OE3, also statistically unchanged from last year.  Like last year, brokers served consumers with somewhat different characteristics than those helped by Assister Programs and provided somewhat different kinds of help.  Compared to Assister Programs, brokers were less likely to help uninsured individuals (30% of brokers said most clients were uninsured vs. 56% of Assister Programs) or consumers who lack Internet at home (60% of brokers said few/no clients lacked Internet vs. 24% of Assister Programs). Forty-eight percent of brokers helped Latino clients vs. 76% of Assister Programs.  In addition, brokers were less likely to help consumers with Medicaid applications (47% did so vs. 89% of Assister Programs.)  Brokers reported higher rates of client continuity from one year to the next; 64% of brokers said most clients they helped this year were people they had helped the year before, vs. 40% of Assister Programs.

Brokers in FFM states initiate about half of Marketplace applications using alternative enrollment sites. The FFM permits use of alternative enrollment channels that meet federal minimum standards.  On average, brokers said they started about 26% of FFM applications directly on insurance company websites and 23% of FFM applications on private web broker sites.  By comparison, SBM brokers initiated two-thirds of QHP applications on the Marketplace website.  Permitting direct enrollment through alternative channels was adopted with the intent of maximizing public awareness and enrollment opportunities and encouraging technology advances such as new plan comparison tools and apps for mobile devices.  In follow up interviews, some brokers cited technology advantages of these enrollment channels including easier data entry and the availability of “dashboard” features to help them track all clients.  Others said that not having to set up a healthcare.gov account saved time.  Still others noted this shortcut could later prove disadvantageous if consumers needed to follow up with the Marketplace but did not have an account.

Beyond logistics, several brokers mentioned that some alternative enrollment channels also offer non-QHP products, such as cancer policies, short term policies, and other “excepted benefit” products that do not have to follow ACA market rules, such as the prohibition on pre-existing condition exclusions.  Alternative enrollment channels made it simpler to obtain premium quotes and enroll consumers in these products, as well.  CMS is working on improved ways to monitor the sale of QHPs through alternative enrollment channels.  It does not track sale of other types of products through these channels.

Some insurers are ending or reducing broker commissions, especially for SEP policies.  Nearly half of brokers (49%) say at least some insurers have stopped paying commissions on all Marketplace policies; 17% say most or all of the insurers they do business with have taken this action.  More often brokers (60%) say at least some insurers have stopped paying commissions on Marketplace policies sold outside of Open Enrollment to consumers eligible for SEPs; 33% of brokers say most or all insurers have stopped paying SEP commissions for Marketplace policies.  Insurers report that SEP enrollees have higher health care claims on average than people who sign up during open enrollment, and therefore want to discourage use of SEPs. Changes to SEP commissions appear to be taking place more often in FFM states than in SBM states.  Nearly half of brokers in FFM states (46%) say most or all insurers they regularly do business with have ended commissions on SEP policies, compared to 10% of brokers in SBM states.  Twenty-nine percent of FFM brokers say no insurers have ended SEP commissions on Marketplace policies, compared to 61% of SBM brokers.

Regulators in several SBM states have prohibited these commission changes.  Other state regulators and CMS, which directly regulates insurance in five FFM states, have not taken such action.  The net impact on consumer access to coverage is not clear.  Some brokers commented they will continue to help consumers enroll in QHPs during SEPs, even if unpaid, as a public service and to earn client good will.  Others said they will consider selling other coverage, such as short-term non-renewable policies, to SEP-eligible consumers instead.

Most Assister Programs (65%) and brokers (55%) said OE3 went better than OE2.  This year, respondents were also asked to rate the ACA overall out of a possible 10 points.  On average, Assister Programs rated the ACA 6.5, while brokers on average gave a rating of 4.5.  To make the ACA work better, respondents were also asked to select the top three changes they would recommend.  Changes most frequently recommended by Assister Programs among their top three were to (1) reduce health plan cost sharing (named by 51% of Programs as one of their top three), (2) expand Medicaid eligibility in all states (32%), and (3) expand premium subsidies for Marketplace plans (30%).  Changes most frequently recommended by brokers among their top three were to (1) increase broker commissions (named by 47% as one of their top three), (2) repeal the law altogether (28%), and (3) reduce health plan cost sharing (28%).

About the Assister Programs and Brokers Described in this Report

Several types of Assister Programs provide outreach and enrollment assistance in the Marketplace.

Navigator refers to Assister Programs that contract directly with State Marketplaces or with federally facilitated Marketplace to provide free outreach and enrollment assistance to consumers.   The ACA requires all Marketplaces to establish Navigator Programs and to finance Navigators using Marketplace operating revenue.  Some states use a different name to describe these Programs, though in this report all Assister Programs funded directly by Marketplaces are referred to as Navigators.  CMS provided $67 million for Navigators to work in 34 FFM and FPM Marketplaces this year, compared to $60 million last year and $67 million in year one.1    SBM state funding for Navigators exceeded $100 million in year one, that amount declined by about 15% in year two. 2   Moving forward, funding for Navigators has become more ad hoc in at least some SBM states.  The Connecticut Marketplace, for example, no longer provides for year-round Navigators.  Instead, during Open Enrollment, Access Health CT staff and temporary hires provide in-person enrollment assistance through temporary storefront sites and public libraries.  During the rest of the year help is available through volunteer CAC assister Programs and the state’s ombudsman office.  In Colorado, the Marketplace provides roughly 20 percent of resources for its Navigator Program and applies for philanthropic grants for the rest.

Certified Application Counselor (CAC) refers to Assister Programs that are recognized by a Marketplace but do not receive funding from a Marketplace.  This designation was created prior to the first Open Enrollment – when funding for Marketplace-paid Assisters, at least in the FFM, was still uncertain – to ensure that willing volunteer Programs would also be available to help.  CACs must be sponsored by an organization that will attest to the Marketplace that all of its individual Assisters meet minimum requirements.  CACs also must provide help to consumers free of charge.  Under federal rules, CACs are not required to engage in all activities required of Navigators, and they are not required to undergo training as extensive as that required for Navigators. All Marketplaces are required to recognize and certify CAC Programs, and states have flexibility to establish additional rules for CAC Programs.  Marketplaces are not required to provide funding to CACs; most of these Programs are primarily privately funded, supported by their own sponsoring organizations and other outside sources such as foundations.

Federally Qualified Health Center (FQHC) Programs are operated by health centers funded by the Health Resources and Services Administration (HRSA).  FQHCs treat patients regardless of ability to pay and, prior to enactment of the ACA, actively helped patients apply for Medicaid, CHIP, or other available coverage.  For the first year of ACA implementation, HRSA awarded $208 million to FQHCs to support enrollment assistance.  In the second year, HRSA made permanent enrollment assistance grants to FQHCs, which now total about $150 million per year.  All FQHC Assisters are required to complete at least the level of training required of CACs.  About 5% of FQHCs also serve as Navigators and so received Marketplace funding in addition to HRSA grants.  For purposes of this report, FQHCs that also receive Marketplace funding are referred to as Navigators.

Federal Enrollment Assistance Program (FEAP) refers to Assister Programs that contracted with CMS to provide supplemental enrollment help within FFM and FPM states in selected communities where large numbers of uninsured individuals reside.  Duties and requirements of FEAPs are similar to those of federal Navigators except that FEAPs provide “surge” assistance.  Most have rolled back staff and operations since Open Enrollment ended.  In this report, unless otherwise indicated, description of findings about Navigators will include FEAPs because the two types are so similar.  For the 2016 coverage year, CMS awarded contracts totaling about $29 million to two organizations to establish FEAPs in 10 states.3   FEAP contracts were initiated for the 2014 plan year and have been renewed subsequently.  CMS will continue to contract with FEAPs in year four, though the contract amount and work sites have not yet been determined.

Finally, in addition to Marketplace Assister Programs, the ACA authorized creation of state-based ombudsman programs, also called Consumer Assistance Programs, or CAPs.  The law requires CAPs to provide outreach and public education and provide enrollment assistance to consumers in the Marketplace.  In addition, CAPs must help all state residents resolve questions and disputes with their private health insurance coverage, including helping consumers to appeal denied claims.  The ACA requires Marketplace Assisters to refer consumers with post-enrollment problems to state CAPs.  The law provided initial funding for states to establish CAPs and 35 were established in 2010.  However no new appropriations have been enacted since and most CAPs have not received any new federal funding since 2012.4  Pending additional federal funding, many CAPs remain operational, albeit at reduced levels.

Broker refers to a state-licensed professional who sells private health insurance to individuals and/or businesses.  Brokers are sometimes called agents or producers. To sell non-group or small group health plans offered through a state Marketplace, brokers must register with the Marketplace annually, sign a participation agreement, and complete required training.  This year more than 80,000 brokers in federal Marketplace states and 30,000 in state-based Marketplaces were certified to help consumers apply for financial assistance financial assistance and explain coverage options.  Brokers are paid a commission by the health insurance company offering the policy that the consumer selects.  Typically insurers pay commissions when a policy is first issued and at renewal for at least several years.  Brokers also offer ongoing services to consumers once they’re covered, including help with post-enrollment questions and help buying other insurance products or financial services.

Key Findings: Section 1: Assister Programs Characteristics And People Helped

In all, more than 5,000 Marketplace Assister Programs provided outreach and enrollment help to consumers during the third Open Enrollment.  This total is based on Program data provided by all state and federal Marketplaces, and represents a 9% increase in the number of Programs operating a year ago.

Once again, most Assister Programs that help people enroll through the Marketplace are not funded by Marketplaces. Navigators and FEAPs, which are funded directly by the Marketplace, comprise about 11% of total Programs.  Assister Programs in FQHCs, primarily supported by HRSA grants, comprised another 24% and CAC Programs, which generally receive little or no public funding, comprised 65% (Figure 1).  The distribution of Assister Program types is similar to that observed last year

Figure 1: Types of Assister Programs, 2016

An estimated 30,400 Assisters together helped about 5.3 million people during the third Open Enrollment period.  The total number of full-time equivalent (FTE) Assisters remained the same this year, and the total number of consumers helped by Assister Programs fell by about 10% compared to last year.

The vast majority of consumers helped (80%) received assistance from Programs that helped more than 1,000 people.  These large caseload Programs constituted 23% of all Assister Programs this year.  Programs with mid-size caseloads (that helped between 100 and 1,000 consumers) account for 47% of all Programs and helped 19% of all consumers who received assistance.  Thirty percent of all Programs had small caseloads, helping 100 or fewer consumers during Open Enrollment; together these small caseload Programs helped just 1% of the total number of consumers who received assistance (Figure 2).

Figure 2: Distribution of Assister Programs and Consumers Helped by Program Caseload Size

Large caseload Programs include all three types – Navigator, FQHC, and CAC Programs.  This year 37% of Navigator, 31% of FQHC, and 16% of CAC Programs said they helped more than 1,000 people during Open Enrollment.  All three types of Assister Programs are also found among medium- and small-caseload Programs.  Marketplaces only contract with Navigator Programs, however, and so generally do not provide the same level of support and monitoring for most of the large caseload Programs that are responsible for most consumer assistance.

Large caseload Programs had more staff (14.5 FTEs on average) compared to small caseload Programs (average 2.2 FTEs).  The average number of consumers helped per FTE was also much greater in large caseload Programs (251) compared to small caseload Programs (16).

In addition, large caseload Programs differed from smaller Programs in the amount and type of work they did and the types of problems they helped consumers address.  Large caseload Programs were more likely than small caseload Programs to help consumers with more complex needs such as language translation (28% vs 8%), immigration-related problems (23% vs 5%), problems reporting income or household size (56% vs 35%).  In addition, large caseload Programs were more likely to help resolve Marketplace data verification problems (96% vs 81%) and more often could help consumers successfully resolve identity proofing problems (97% vs 89%).  Large caseload Programs were also more likely to engage in outreach activities (94% vs. 54%), to help consumers resolve post-enrollment problems (88% vs 53%), and to coordinate with other Assister Programs on enrollment events (39% vs 12%).

Most Assister Programs have now operated for three years.  This year 94% of Programs are returning from last year and 87% have been in operation since the first Open Enrollment.  Staff tenure is also increasing.  Nearly seven in ten three-year-old Programs report that most or all of their staff worked during all three Open Enrollments.  More experienced Programs may be more familiar with their Marketplace systems and procedures and may have developed closer ties with communities they serve (Table 1).

Most Assister Programs generally don’t coordinate with each other. Although two-thirds say coordination with other Programs improves effectiveness, most (59%) rarely if ever coordinate with other Programs.  Among those that do regularly coordinate with others, 95% said coordination is key to effectiveness.  In general, Navigators were more likely to coordinate with other Programs on activities such as planning outreach and enrollment events and resolving complex cases.  One-third of small caseload Programs said they never coordinated with others, compared to 10% of large caseload Programs.

Table 1. Characteristics of Assister Programs
Program Characteristics All Assister ProgramsProgram TypeProgram Caseload
Navigator FQHCCACLargeSmall
Returning Program94%91%^97%94%^99%91% Ɨ
Worked all three Open Enrollments87%81^94%86%^97%78% Ɨ
Service area
     Statewide13%22%12%*11%*15%12%
     Specific area within state81%73%86%*81%*79%82%
     Other6%5%3%7%^5%6%
Paid staff vs. volunteer
     Most/all volunteers10%6%4%13%4%17% Ɨ
     Most/all paid staff88%94%96%84%*^96%80% Ɨ
Number of full-time-equivalent staff and volunteers
     5 or fewer77%64%78%*79%*41%94% Ɨ
     6-1013%16%16%11%*^29%3% Ɨ
     11-205%11%3%*5%^16%1% Ɨ
     21-503%6%1%*3%*^8%1% Ɨ
     More than 501%3%1%1%6%Ɨ
     Don’t know/No answer1%2%1%1%
Mean FTE staff size5.99.54.3*5.914.52.2Ɨ
Number of consumers helped during Open Enrollment
     100 or fewer32%12%14%41%*^100 Ɨ
     101-50030%31%39%26%^
     501-1,00014%19%16%12%
     1,001-2,50014%20%18%12%66%– Ɨ
     2,501-5,0004%7%8%2%*^18%– Ɨ
     More than 5,0003%10%5%2%*16%– Ɨ
     Don’t know/No answer3%1%1%4%
Mean number helped per Program1,0261,7661,160852*^3,65735 Ɨ
Coordinate often with other Programs to:
Share staff16%24%15%*15%*24%12% Ɨ
Share appointment scheduler15%57%16%*15%*23%8% Ɨ
Plan enrollment events24%35%24%*22%*39%12% Ɨ
Plan outreach events24%36%24%*23%*38%12% Ɨ
Resolve complex cases22%31%21%*20%*31%14% Ɨ
Portion of Consumers helped who were new to Marketplace vs. renewing
Most/nearly all renewing or changing39%36%42%39%42%37%
Half new/half renewing or changing24%29%26%22%31%17% Ɨ
Most/nearly all new to Marketplace29%29%24%31%20%40% Ɨ
*Significantly different from Navigator at the 95% confidence level; ^Significantly different from FQHC at the 95% confidence level; Ɨ Significantly different from Large Caseload Program at the 95% confidence levelNOTE: Numbers may not sum to 100% due to rounding.

Assister Program budgets are mostly modest.  Twenty seven percent of all Programs reported having an annual budget for consumer assistance of $50,000 or less.  Twenty-nine percent had annual budgets between $50,000 and $500,000.  Only 5% of Programs reported annual budgets larger than $500,000.  CACs tended to have the smallest budgets (Table 2).

Navigators were more likely to receive most of their funding from the Marketplace, while FQHCs relied more heavily on grants from HRSA.  CACs were most likely to rely on re-programmed resources from their sponsoring organization or other private sector support.

Table 2. Assister Program Budgets and Sources of Funding, FY 2016

All Assister Programs

Program Type

Program Type

Program Type

Program Size

Program Size

Navigator

Navigator

FQHC

CAC

Large Caseload

Small Caseload

FY 2016 Program budget

Up to $50,000

27%

19%

14%

34%*^

3%

47% Ɨ

$50,001 – $200,000

22%

30%

33%

17%*^

32%

7% Ɨ

$200,001 – $500,000

7%

20%

10%*

4%*^

20%

1% Ɨ

$500,001 – $1,000,000

3%

6%

4%

3%

12%

1% Ɨ

More than $1,000,000

2%

5%

1%*

1%*

6%

– Ɨ

Don’t know/No answer

39%

20%

39%

41%

27%

44%

Programs receiving most (>50%) of budget from this funding source

Grants or other direct payment from Marketplace

9%

39%

3%*

5%*

15%

4% Ɨ

Grants from HRSA, other federal agency

19%

7%

36%*

15%*^

38%

9% Ɨ

Grants or payments from other state agencies

6%

9%

1%*

7%^

6%

5%

Grants from private foundations

4%

1%

1%

5%*^

2%

3%

Grants from other outside private sources

1%

1%

1%

2%

1%

2%

Funds re-programmed from sponsoring organization’s own budget

15%

4%

2%

22%*^

5%

24% Ɨ

*Significantly different from Navigator at the 95% confidence level; ^Significantly different from FQHC at the 95% confidence level; Ɨ Significantly different from Large Caseload Programs at the 95% confidence level.NOTE: Columns may not sum to 100% because not all Programs received a majority of funding from a single source.

Funding uncertainty continues for some Programs.  Thirty-two percent of Assister Programs are not at all certain funding will be available next year, and 35% are only somewhat certain. This finding held across all types of Assister Programs and in FFM and SBM states. Marketplaces are required by law to pay Navigators out of operating revenue, though most fund consumer assistance year by year instead of dedicating a portion of revenue for this purpose.  FQHC Programs receive ongoing funding from HRSA.  Overall about six in ten returning Programs report their budget this year is about the same as it was last year.  Twenty-eight percent say this year’s budget is less than last year and 35% say it is less than in year one.  Navigator Programs were more likely than others to report budget increases.

Key Findings: Section 2: In-person Assistance During Open Enrollment

The need for in-person assistance remains strong.  About eight in ten Assister Programs said most-to-nearly-all consumers sought help because they lacked confidence to apply for coverage and financial assistance on their own.  As well, about eight in ten Programs said most-to-nearly-all consumers needed help evaluating plan choices.  Fewer Assister Programs this year said that most consumers sought help with technical problems related to the Marketplace website, a sign that Marketplace IT systems continue to improve.  But similar numbers report that most consumers also had problems with various aspects of the application process, including questions about how to report their income, family status, or citizenship/immigration status.  There was a drop in the share of Programs reporting most clients had limited understanding of the ACA, though this remains a leading reason consumers seek help.  In addition, this year there was an increase in Programs who said most of their clients sought help renewing coverage (Figure 3).

Figure 3: Reasons Consumers Sought Help, 2014-2016

Enrollment assistance shifted toward renewing consumers in 2016.  This year, renewing consumers made up a substantial share of the caseload for most Assister Programs.  Twenty-nine percent of Assister Programs this year reported that most or nearly all consumers they helped were new to the Marketplace.  By comparison, last year 53% of Assister Programs said most or nearly all consumers helped were new to the Marketplace (Figure 4).  Although auto-renewal is an option, the Centers for Medicare and Medicaid Services (CMS) reported that 60% of plan renewals for 2016 were active renewals.5   This finding suggests many consumers believe they need in-person help to remain enrolled in Marketplace health plans and maintain their subsidies, not just to enroll for the first time.

Figure 4: New vs. Renewing Consumers Helped by Assister Programs, 2015-2016

Even so, most who sought help during the third Open Enrollment were uninsured. This year, a majority of Assister Programs (55%) reported that most to nearly all of the consumers they helped were uninsured at the time they sought assistance.  This is significantly lower than 83% of Programs last year and 89% of Programs in year one who said most people they helped were uninsured at the time they sought assistance (Figure 5).  Even with the shift toward helping Marketplace enrollees renew coverage, a primary focus of Assister Programs continues to be on enrolling the uninsured.

Figure 5: Consumers Helped by Assister Programs Who Were Uninsured, 2016

Demand for consumer assistance sometimes exceeded capacity.  Twenty-one percent of Programs said they could not help all who sought it during the third Open Enrollment period overall. Similar numbers this year and last year had to turn away at least some consumers during the final weeks of Open Enrollment when a surge in demand always happens (Figure 6).

Figure 6: Share of Programs Reporting Demand for Consumer Assistance Exceeded Capacity, 2014-2016

This year capacity to meet demand was especially stretched among large caseload Programs (30% had to turn at least some consumers away) compared to small caseload Programs (16%).  Programs that reported a budget decrease in 2016 were more likely to say demand for help far exceeded capacity compared to Programs whose budget stayed the same or increased from the prior year (12% vs. 4%).

Eligibility and enrollment assistance remains time-intensive.  As was the case in years one and two, Assister Programs reported that, on average, it took 90 minutes to help consumers who were applying to the Marketplace for the first time.  In addition, like last year, Programs said it took one hour on average to help consumers who were returning to the Marketplace to renew or change coverage (Figure 7).

Figure 7: Average Time Assister Programs Spent Helping New and Renewing Consumers, 2016

Why does the average time required for in-person help remain the same, even as Assisters and consumers gained experience and Marketplace websites have grown more reliable?  The answer may lie in the inherent complexity of applying for coverage and financial assistance under the ACA.  This year’s survey provides new data about specific aspects of the eligibility and enrollment process that can be challenging – real time verification by the Marketplace of applicants’ identity and application information, coordination between the Marketplace and state Medicaid programs, and the process of comparing and selecting Marketplace QHPs.

Real Time Verification by the Marketplace

On-line applications were expected to be easier and faster to complete because Marketplace websites would be able to verify consumer’s information in real time, matching it to other online databases.  However, sometimes IT system problems, or the fact that some consumers don’t have matching information in the databases Marketplaces check, result in significant delays and may even pose a barrier to enrollment for some people.    

Many consumers sought help with Marketplace identity-proofing requirements.  To protect against enrollment fraud, Marketplaces first verify in real time the identity of applicants before they can submit an application for coverage and financial assistance.  FFM states use an automated remote identity proofing process (RIDP) that compares applicant information against credit files and other online data sources.  Many SBM states also use the federal RIDP system.  One study found that certain groups of individuals are especially likely to have difficulty completing RIDP, including young adults and recent immigrants with limited credit history.6   The same study observed some SBM states have adopted alternatives or modifications to the RIDP system to streamline the process of proving one’s identity and expedite resolution of problems when they arise.

During the third Open Enrollment period, Assister Programs helped at least 230,000 consumers with identity-proofing problems. Depending on Program size, on average between 3% and 10% of consumers helped by Assister Programs during Open Enrollment encountered identity-proofing problems.

Overall, about 90% of Programs that helped consumers with identity proofing problems said they usually could help resolve them.  Those in SBM states were more likely than in FFM states (22% vs. 14%) to say they usually could resolve problems quickly during the initial visit.  This is probably because several SBM states use an alternative to RIPD.  For example in Colorado and California, certified Assisters can visually verify an applicant’s identification document, upload a copy to the Marketplace, and then proceed immediately with the application.

Across all states, most Programs said that when identity proofing problems arose they usually added significantly to visit time or necessitated a follow up visit (Table 3).  Programs in SBM states were less likely than in FFM states (3% vs. 10%) to say identity proofing problems usually could not be resolved.  Across all Marketplaces, large caseload Programs were less likely than small Programs (3% vs 11%) to say these problems usually could not be resolved.

Table 3: How did ID proofing problems affect the consumer’s application process?
 SBM Assister ProgramsFFM Assister ProgramsLarge Caseload ProgramsSmall Caseload Programs
We usually could resolve problem quickly during initial visit22%14%*14%17%
We usually could resolve problem during initial visit, but with significant additional time31%36%40%32%^
We usually could resolve problem though at least one follow up visit was usually required44%40%42%39%
We usually could not resolve the problem3%10%*3%11%
*Significantly different from SBM programs at the 95% confidence level; ^Significantly different from Large Caseload programs at the 95% confidence levelNOTE: Numbers may not sum to 100% due to rounding.

Overall, about one in four Assister Programs said they would like more training in resolution of online identity proofing problems.  Large caseload Programs were twice as likely as small caseload Programs (35% vs 17%) to say they would like more training on this topic.

Many consumers sought help for Marketplace data match inconsistencies (DMI). Marketplaces also require real time verification of consumers’ citizenship or immigration status and income.  Applicant information is matched against other online data, for example, held by the Social Security Administration, Department of Homeland Security, and Internal Revenue Service. When the Marketplace can’t verify application information online, consumers receive a notice of data match inconsistency (DMI) and are provided a temporary eligibility determination based on information they submitted.  Consumers can enroll in coverage right away, but must provide additional documentation to the Marketplace within 90 days, otherwise their coverage or subsidies may be terminated.  During 2015, the FFM terminated coverage for 500,000 individuals with citizenship or immigration DMI, and terminated or reduced premium tax credits and cost sharing subsidies for 1.2 million consumers with income DMI.7 

Most Assister Programs said they helped consumers resolve DMI problems relating to immigration or citizenships during the third Open Enrollment.  We estimate these Programs helped at least 172,000 consumers with immigration-related DMIs.  In addition, most Programs reported helping consumers with DMI problems related to income.  We estimate at least 259,000 consumers sought in-person help with income-related DMIs from these Programs.

In comparison to the number of FFM enrollees who could not resolve DMI problems last year and who lost coverage or subsidies as a result, these estimates suggest that either the number of consumers affected by DMI fell substantially this year, or most consumers with DMI are not getting help from Assister Programs.

Most Assister Programs will try to help consumers resolve DMI problems when they arise, though smaller Programs are more likely than large caseload Programs to refer consumers elsewhere for help or advise them to resolve inconsistencies on their own.  In general, large caseload Programs were also more likely to know the resolution of their client’s DMIs compared to smaller Programs (Table 4).

Table 4: Data Match Inconsistency Help by Assister Programs
 All ProgramsLarge Caseload ProgramsSmall Caseload Programs
Immigration DMI
  Helped consumer and usually knew the resolution69%76%58%*
  Helped consumer but mostly did not know the resolution19%20%23%
  Referred consumer elsewhere or advised to solve on their own11%4%19%*
Income DMI
  Helped consumer and usually knew the resolution72%80%62%*
  Helped consumer but mostly did not know the resolution21%17%27%
  Referred consumer elsewhere or advised to solve on their own7%3%11%*
*Significantly different from Large Caseload Programs at the 95% confidence level

Marketplace notices about DMI may also present a challenge.  For example, in case of an income-related DMI, FFM notices list examples of documents consumers might submit to verify different sources of projected income but do not specify which would be most appropriate for the individual applicant.8   With respect to DMI notices related to immigration or citizenship, 39% of Assister Programs said most of the time it was not clear what documentation the Marketplace wanted to the consumer to provide; 29% of Assister Programs responded this way with respect to income-related DMI notices.

One-in-five Assister Programs overall said they would like more training on the resolution of DMI problems.  Large caseload Programs were more likely to want such training (about one in three) compared to small Programs (about one in seven).

Medicaid-Marketplace Coordination

Depending on the state, consumers also needed extra help enrolling in Medicaid.  The ACA outlines a “no wrong door” approach to applying for coverage and requires a “single streamlined” application for financial assistance that can be used to determine eligibility for both QHP subsidies and Medicaid or the Children’s Health Insurance Program (CHIP).  All 13 State-based Marketplaces that do not use healthcare.gov have integrated their eligibility systems with Medicaid, eliminating the need to transfer data between systems to make eligibility determinations for coverage.  Eight FFM states allow healthcare.gov to determine Medicaid eligibility, though files are then transferred to state Medicaid agencies to complete enrollment.

In the remaining 30 states, healthcare.gov assesses Medicaid eligibility, then transfers the consumer’s file to the state Medicaid program for a final eligibility determination and to complete enrollment. Among Programs in states with integrated eligibility systems or in FFM determination states, 74% said the Medicaid enrollment process was usually completed in a timely manner.  By contrast, 34% of Programs in assessment states said that the Medicaid eligibility determination was completed in a timely manner.  To expedite the process, 44% of Programs in assessment states and 13% in determination states said they would help clients who were assessed eligible complete a separate Medicaid application.

Follow up interviews with Assister Program directors were conducted to learn why they created separate Medicaid applications.  Some observed that direct applications were often processed faster than transferred files.  Others cited difficulty in obtaining confirmation from healthcare.gov that transfers were successfully completed.  Still others noted that applying directly to Medicaid in some states can also expedite application for other benefits, such as the Supplemental Nutrition Assistance Program. Some directors said they pre-screen consumers, then submit the application to the Marketplace or the state Medicaid portal depending on the coverage the individual will most likely be eligible for. Among Assister Programs that typically help consumers complete a separate Medicaid application, two-thirds said at least one additional follow up visit was needed to complete the separate application (Table 5).

Table 5: When the Marketplace determined or assessed consumers eligible for Medicaid, what steps did you take next?
ActionAll ProgramsDetermination statesAssessment states
Followed up with Medicaid until eligibility and enrollment was complete27%34%22%*
Helped consumer complete a separate Medicaid application31%13%44%*
Referred consumer to another Assister Program3%2%4%
Advised consumer to follow up with Medicaid on their own13%7%18%*
* Significantly different from Determination states at the 95% confidence level

Comparing and Selecting Health Plans

The process of comparing and selecting health plans can also be complex.  The sheer number of plan choices can be one reason.  People living in FFM states, on average, had a choice of 50 Marketplace plans this year.9  Research on plan choice finds that having more than 10 options makes it harder for consumers to compare and evaluate.10  In addition, relatively small variations in QHPs can sometimes be meaningful to consumers.  For example, while most QHPs (not modified by cost sharing reductions) have annual deductibles well in excess of $1,000 per person, many plans impose separate deductibles for at least some services, and many exempt key services, such as primary care visits, from the deductible.11 ,12  Another survey found that most consumers said it was somewhat or very easy to compare Marketplace plans generally; 74% found it easy to compare premiums, 69% found it easy to compare plan cost sharing features, and 60% found it easy to compare plan provider networks.13 

Marketplace health plan information sometimes leaves consumer questions unanswered. This year, 37% of Programs said consumers often or almost always had questions about health plans that were not answered by information on the Marketplace website (Figure 8). This is an increase from last year (31%) and attributable mostly to Programs in FFM states.  Thirty-seven percent of FFM Programs this year, compared to 27% last year, said client’s health plan questions often were unanswered by information on healthcare.gov. Most Marketplaces have developed new plan comparison tools since the first Open Enrollment, for example, to sort options based on participating providers or to estimate consumer out-of-pocket expenses.  For 2017, new standardized plan choices may be offered in the FFM to simplify plan comparison by consumers.  Improvements to summary of benefits and coverage (SBC), a plain language summary of health plan provisions, were also approved and will be implemented in 2018.  These changes may make it easier for consumers to understand and compare plan choices in the future.

Figure 8: Assister Program Clients Who Had Health Plan Questions Unanswered by Marketplace, 2016

One in four Assister Programs say they would like additional training on qualified health plan features and how to distinguish differences between plan options.

Insurance literacy limitations among consumers persist.  This year most Assister Programs (62%) said most or almost all of their clients needed help understanding basic insurance terms and concepts such as “deductible” and “in-network service.”  This is an improvement from 74% of Programs who answered this way in the first two years, though still evidence of widespread limitations (Figure 9).  Three-in-ten Assister Programs would like additional training in health insurance literacy.

Figure 9: Assister Program Clients Needing Help Understanding Basic Insurance Concepts, 2015-2016

Assister Programs knew the plan choice for most/nearly all of QHP-eligible clients.  This year again, when asked how often they knew the plan choice of their QHP-eligible clients, 71% of Assister Programs said this was the case for most or almost all such clients – the same number who reported this in year two and an increase over year one, when website breakdowns required Assisters to spend most appointment time helping consumers with the application. Large caseload Programs were more likely than smaller Programs to observe the plan choice for most or nearly all clients who were eligible for QHPs (82% vs. 62%).  Two-thirds of Programs said most or nearly all of their QHP-eligible clients were able to complete the plan selection during the initial visit.  The other 34% said clients typically required multiple visits.

Key Findings: Section 3: Help Between Open Enrollment Periods

Returning Assister Programs helped at least 830,000 consumers with special enrollment periods in the past year.  Again this year we asked returning Assister Programs about help they provided consumers outside of Open Enrollment periods.  Most Programs were available throughout the year to help consumers who became eligible for special enrollment periods (SEP) or who needed to report other mid-year income or family changes to the Marketplace in order to update their application for subsidies.

Large caseload Programs helped more people with SEPs and reporting other mid-year changes compared to small caseload Programs (Table 6).  Nationwide, we estimate Assister Programs helped at least 830,000 consumer apply for SEPs in 2015, which is a 30% increase over the amount of SEP assistance reported for 2014.  This change may be due to the fact that the first Open Enrollment extended through April of 2014, leaving fewer remaining months that year for SEP to arise.

Table 6. Help with Special Enrollment Periods and Mid-Year Changes During 2015
 All Returning ProgramsLarge Caseload ProgramsSmall Caseload Programs
Number of People Helped with Special Enrollment Periods
Up to 50 people46%15%69%*
51-100 people12%15%6%*
101-500 people12%26%1%*
More than 500 people8%25%– *
Don’t know/No answer22%18%23%
Number of People Helped to Report Mid-Year Changes
Up to 50 people53%28%77%*
51-100 people9%14%2%*
101-500 people10%24%– *
More than 500 people3%13%– *
Don’t know/No answer24%20%21%
*Significantly different from Large caseload Programs  at the 95% confidence levelNOTE: Columns may not sum to 100% due to rounding.

Assister Programs also helped consumers report mid-year changes in their subsidy eligibility, though fewer people came in for this type of help.  Large caseload Programs, again, provided more of this type of help (Table 46).  Nationwide, we estimate Assister Programs helped at least 349,000 consumers report mid-year changes to the Marketplace in 2015.

Assister Programs provided post-enrollment help to at least 745,000 consumers between the second and third Open Enrollment periods.  This year, nearly all returning Assister Programs also offered to help consumers with post-enrollment problems, though they are not required to do so.  Large caseload Programs provided most of this assistance (Table 7).

Table 7. Help with Post-Enrollment Problems
 All Assister ProgramsLarge Caseload ProgramsSmall Caseload Programs
Number of People Helped with Post-Enrollment Problems
Up to 50 people44%11%80%*
51-100 people13%12%7%
101-500 people17%27%±*
More than 500 people10%34%-*
Don’t know/No answer17%15%13%
± Less than 1 percent; *Significantly different from Large caseload Programs at the 95% confidence levelNOTE: Columns may not sum to 100% due to rounding.

Consumers sought help with premium payment and invoicing problems, claims denials, and when their health providers were not in-network.  Consumers also returned for help because they did not understand how to use their health coverage (Figure 10).  Like last year, most Assister Programs (70%) said they could help consumers successfully resolve post-enrollment problems most of the time; 25% said they succeeded just some of the time and 5% said not very often.

Figure 10: Post-Enrollment Problems Assister Programs Encountered, 2016

The ACA requires Navigators to refer consumers with post-enrollment problems to state Consumer Assistance Programs, or CAPs.  However, federal funding for CAPs has not continued, and while many remain operational, Marketplace Assisters mostly refer consumers with post-enrollment problems elsewhere.  When asked where they refer consumers with post-enrollment problems they cannot resolve, only 19% of Assister Programs mentioned CAPs.  Instead, like last year, Assisters mostly referred consumers to the Marketplace Call Center (77%) or back to their health plan (59%) (Figure 11).

Figure 11: Where Assister Programs Referred Consumers with Post-Enrollment Problems, 2016

Key Findings: Section 4: Consumer Assistance By Health Insurance Brokers

For the second year, the survey included health insurance brokers who were certified by the Marketplace to help consumers apply for non-group coverage.  Most, though not all state Marketplaces provided contact information for at least some of their certified brokers.  As a result, survey findings may not reflect experiences generalizable to the nation as a whole.

Enrollment Assistance by Brokers

Virtually all (92%) of brokers who sold non-group coverage in the Marketplace this year had done so last year and 84% were registered with the Marketplace during the first Open Enrollment period.

Most brokers who sold Marketplace coverage (82%) also sold policies outside of the Marketplace.   On average, brokers reported helping 158 consumers, both in and outside of the Marketplace, with eligibility and enrollment during the third Open Enrollment period.  On average, brokers helped more than twice as many clients apply for coverage through the Marketplace (110) compared to outside of the Marketplace (48) (Figure 12).

Figure 12: Average Number of Consumers Helped by Brokers Inside and Outside the Marketplaces, 2016

Some brokers were busier than others.  Most (56%) said they helped up to 50 Marketplace consumers during this Open Enrollment period, while 26% of brokers said they helped more than 100.  In Medicaid expansion states, brokers helped an average of 94 people enroll in Marketplace plans during Open Enrollment; in non-expansion states, the average was 138.  These findings are similar to what brokers reported last year.

Though we cannot make estimates of the number of consumers helped by brokers nationally due to methodological limitations, brokers clearly play a significant role in helping consumers to enroll in Marketplace coverage.  For example, the California Marketplace reported last year that 43% of new enrollees in 2015 were broker-assisted.14 

This year brokers helped more renewing consumers than new enrollees.  This year 52% of brokers said most consumers they helped during Open Enrollment were clients who were returning to the Marketplace to renew or change their QHP and 21% said most clients they helped were new to the Marketplace.  By comparison, last year 49% of brokers said most consumers they helped were new to the Marketplace and 26% said most clients were renewing (Figure 13).

Figure 13: New vs. Renewing Consumers Helped by Brokers, 2015-2016

In addition, this year, brokers say fewer consumers were uninsured at the time they sought help.  Thirty percent of brokers this year said most or nearly all consumers they helped were uninsured, compared to 50% last year (Figure 14).

Figure 14: Broker Clients Who Were Uninsured, 2015-2016

Enrollment assistance was also time intensive for brokers.  Like Assister Programs, brokers reported it took, on average, 1 to 2 hours to help a new Marketplace consumer enroll in coverage, and just over an hour to help a returning consumer.  On average, brokers encountered 8 clients with identity proofing problems during Open Enrollment. Similar to Assister Programs, brokers in SBM states were twice as likely to report these problems could be resolved quickly during the initial visit (28%) compared to brokers in FFM states (14%).  Also, brokers reported 12 clients, on average, encountered DMI problems related to immigration and 21 clients, on average, encountered DMI problems related to income.  Even more often than Assister Programs, brokers said that Marketplace DMI notices were unclear; 54% said immigration DMI notices were unclear most or nearly all of the time, 60% said this about DMI income notices.

Similar to Assister Programs, 27% of brokers said that for OE3 overall, they were unable to help all who asked for it and had to turn at least some consumers away.  Brokers were much more likely to say that demand exceeded their capacity in early December, just prior to the deadline for selecting or renewing coverage for January 1. Thirty-one percent of brokers found it hard to serve all consumers during this surge period, compared to 17% who said demand for help exceeded their capacity during the final two weeks of Open Enrollment.

Between Open Enrollments, brokers helped consumers with SEPs and post-enrollment problems.  On average, brokers helped about 27 SEP-individuals enroll in coverage, or less than one per week, about the same number they reported for the prior year.  Nearly all (94%) brokers will help clients with post-enrollment problems that may arise.  Between the second and third Open Enrollment periods, brokers report they helped 47 clients, on average, with post-enrollment problems, similar to the number they reported last year.

Comparing Activities of Brokers and Assister Programs

Like last year, brokers generally engaged in similar consumer assistance activities as Assister Programs, but with emphasis on different services.  For example, the vast majority of both brokers and Assister Programs said they help consumers compare and select QHPs, apply for premium tax credits, and resolve post-enrollment problems.  But as was also the case last year, compared to Assister Programs, brokers were less likely to engage in outreach and public education activities (40% vs 76%) and less likely to help consumers apply for exemptions from the individual mandate (24% vs 50%).  Compared to Assister Programs brokers were more likely to help small businesses select coverage (29% vs 4%).

Compared to Assister Programs, when clients received a notice of data match inconsistency from the Marketplace, brokers were somewhat less likely to help the consumer; 76% said they will help consumers resolve immigration-related DMI, compared to 89% of Assister Programs.  Brokers were also less likely, compared to Assister Programs, to help individuals eligible for Medicaid and CHIP (47% vs 89%).  Brokers who said they helped consumers with Medicaid applications were more likely to be from SBM states, where Marketplace eligibility systems are better integrated with Medicaid.

Also similar to Assister Programs, most brokers said they would like to receive additional training on a range of topics, including tax related issues, Marketplace appeals and renewal procedures, Medicare, and Medicaid.

Comparing Clients of Brokers and Assister Programs

Similar to Assister Programs, brokers overwhelmingly said consumers they helped had limited understanding of the ACA and limited health insurance literacy.  In other respects, though, broker clients differed somewhat from consumers served by Assister Programs.  For example,

  • 85% of brokers said few or none of their clients needed language translation help, compared to 54% of Assister Programs
  • 60% of brokers said few or none of their clients lacked internet at home, compared to 24% of Assister Programs
  • 48% of brokers said they helped Latino clients, compared to 76% of Assister Programs
  • 30% of brokers said most or nearly all clients they served were uninsured when they sought help, compared to 56% of Assister Programs
  • 8% of brokers said most or nearly all clients had income low enough to qualify for Medicaid, compared to 42% of Assister Programs.

Brokers also were more likely than Assister Programs (64% vs 40%) to say most of the consumers they helped this year were people whom they had also helped during the previous Open Enrollment period.

Use of Alternative Enrollment Channels

This year we asked brokers about their use of Marketplace websites vs. alternative enrollment channels when helping clients apply for Marketplace health plans.  Federal regulations permit direct enrollment by individuals through insurance company websites into the Marketplace health plans they offer, and also through private web broker sites which are required to display all qualified health plans offered in the Marketplace.  Permitting direct enrollment into QHPs through these alternative channels was adopted with intent of maximizing public awareness and enrollment opportunities and to encourage technological innovations such as plan compare tools and apps for mobile devices.  State Marketplaces can decide whether to allow enrollment into QHPs through insurance company or web broker sites; the FFM allows use of these alternative enrollment channels.

Alternative enrollment channels must meet federal standards for accuracy and completeness of health plan information.  Alternative enrollment channels may also market other products that are not QHPs (for example, supplemental policies, accident-only policies, dread-disease policies); those that do must clearly distinguish non-QHP products from QHPs and indicate that federal premium and cost sharing subsidies only apply to QHPs.  In addition, alternative enrollment channels in the federal Marketplace must follow other standards.  All insurance companies that sell plans on the FFM have the capability of enrolling consumers directly on their own website.  According to CMS staff, fewer than two dozen web broker sites have been certified and are actively used in FFM states currently.15   To be certified, sponsors of these sites must complete training similar to that required of brokers and attest to CMS that their site meets all other standards.

In FFM states, consumers (or their brokers) who enroll through alternative channels enter information about themselves, their dependents, income.  Then they are re-directed to healthcare.gov which determines eligibility to participate in the Marketplace and for subsidies.  Finally, consumers are re-directed back to the alternative enrollment site where they can view the resulting net cost of health plan options, select a plan, and enroll.

On average, FFM brokers initiated 51% of QHP applications on healthcare.gov, 26% on insurance company sites, and 23% on web broker sites.  SBM brokers initiated two-thirds of QHIP applications on the state Marketplace site, 19% on insurance company sites, and 15% on web broker sites (Figure 15).

Figure 15: Where Brokers Initiated QHP Applications, by Marketplace Type, 2016

Some survey participants volunteered additional information about the pros and cons of using alternative enrollment channels.  Some noted technical and functionality advantages of alternative enrollment channels they used.  For example, some web broker sites provide a dashboard to track client accounts.  Ease of data entry was also mentioned as an advantage in some alternative enrollment channels; for example, some alternative channels provide a single screen to enter data on all family members, compared to healthcare.gov which requires data entry on separate screens for each household member.  Some alternative channels permit consumers to apply even if they do not have an email address. By contrast, healthcare.gov requires consumers to provide an email address to open an account, and this is burdensome for some consumers who do not have internet at home.  Brokers also said they sometimes started applications on other channels when the FFM site was functioning slowly, or vice versa.

Several mentioned one disadvantage of using alternative enrollment channels, namely that when an application is started off healthcare.gov, the consumer does not have an account created on the FFM site. Without an account, consumers can’t access the healthcare.gov Message Center, for example, where important updates about requests for additional documentation and other information are posted and easily accessible. Another broker observed that, without a healthcare.gov account, consumers who need to report mid-year changes can only submit them by phone to the call center.

Finally, some brokers noted that some alternative channels also sell non-QHP products and can provide quotes for these products along with the QHP.  A few said that they sell a significant volume of accident-only policies, cancer policies, short term policies, and other excepted benefit products to consumers who feel they need added protection from high cost sharing under QHPs.   Excepted benefit policies are not required to follow ACA market rules, such as the prohibition on pre-existing condition exclusions.  Currently, CMS does not require alternative channels to report data on non-QHP products sold to QHP enrollees.  Staff say they are working on improved ways to monitor the sale of QHP products through alternative enrollment channels.16 

Changing Broker Commissions

Some insurers are ending or reducing broker commissions, especially for SEP policies.  Nearly half of brokers (49%) said at least some insurers have stopped paying commissions on all Marketplace policies; 17% said most or all of the insurers they do business with have taken this action.  Twenty-nine percent of brokers reported most or all insurers they do business with have reduced commissions on all Marketplace policies, while 14% said most or all insurers have reduced commissions on certain Marketplace policies, such as gold policies.  Late in 2015, United HealthCare announced first that it would cut agent commissions from as much as 10% to 2%, then, effective in 2016, suspend commissions entirely for the sale of Marketplace policies.17  In response several other insurers announced they, too, would end or reduce broker commissions for at least some Marketplace policies or enrollments.18 

More often, brokers reported insurers were terminating or reducing commissions for policies sold to people eligible for SEP.  Insurers report that SEP enrollees have higher health claims on average than people who sign up during Open Enrollment, and therefore want to discourage use of SEPs.19   Sixty percent of brokers said at least some insurers have stopped paying commissions on Marketplace policies sold outside of Open Enrollment.  One-third reported most or all insurers have stopped paying SEP commissions for Marketplace policies (Table 8).

Table 8: Changing Broker Commissions
 Marketplace PlansOff-Marketplace Plans
Insurer Change to Broker CommissionsBrokers Who Say All/Most Insurers Made This Change Brokers Who Say No Insurers Made this ChangeBrokers Who Say All/Most Insurers Made This Change Brokers Who Say No Insurers Made this Change
Open Enrollment
End commission all plans17%51%11%59%
End commission certain plans (eg, gold)14%56%12%60%
Reduce commission all plans29%35%22%43%
Reduce commission certain plans (eg gold)14%56%14%54%
Special Enrollment
End commission all plans33%40%27%46%
End commission certain plans (eg, gold)22%55%21%54%
Reduce commission all plans15%58%15%55%
Reduce commission certain plans (eg gold)11%64%12%62%

Changes in SEP commissions appear to be taking place more often in FFM states than in SBM states.  Nearly half of brokers in FFM states (46%) reported most or all insurers they regularly do business with have ended commissions on SEP policies, compared to 10% of brokers in SBM states.  Twenty-nine percent of FFM brokers reported no insurers have ended SEP commissions on Marketplace policies, compared to 61% of SBM brokers. So far, authorities in several SBM states have prohibited such broker commission reductions.  The Connecticut Insurance Department ruled against United’s action for 2016 on grounds that broker commissions had been incorporated into health plan rate filings the state had already approved.20   Colorado’s regulator ruled that elimination of broker commissions on certain policies, including SEP policies, would constitute discrimination and an unfair marketing practice.21  The Kentucky Department of Insurance issued an advisory opinion that failure to pay agent commissions in accordance with filed rates would be a violation of the Insurance Code.22   The California Marketplace is considering new requirements for participating insurers to pay the same commission rates for all their policies year round.23 

In other states, including those directly regulated by CMS, which have not blocked commission modifications, the effect on access to coverage remains to be seen.  Some agents who volunteered information after the survey said they would continue to help SEP-eligible consumers enroll in major medical health plans, even if they aren’t paid a commission, because it’s the right thing to do and because they hope consumers will ask for help renewing coverage at the next Open Enrollment, when commissions would apply.  Others said they would consider selling short-term non-renewable policies to SEP-eligible consumers instead.

Key Findings: Section 5: Assister And Broker Opinions Of The Aca

Assister Programs and brokers were asked, in general, how the third Open Enrollment compared to the second.  Both acknowledged improvements: 65% of Assister Programs and 55% of brokers said OE3 went much better or somewhat better than OE2.

In addition, this year the survey asked both Assister Programs and brokers to rate the ACA overall on a scale of 1-10, with 10 signifying the law is working perfectly and 1 that it is not working at all.  Respondents were also offered a menu of possible ways to change the law and asked to select the top three changes they would recommend.

Assister Programs gave the ACA a rating of 6.5 out of 10, on average.  The top three recommended changes by Assister Programs were:

  • Reduce health plan deductibles and cost sharing (51% included this among top three changes; 23% named this change as their first priority);
  • Expand Medicaid eligibility in non-expansion states (32% named among top three changes; 16% designated as first priority); and
  • Expand subsidies (30% named among top three; 12% as first priority) (Figure 16).
Figure 16: Priority Changes to ACA Recommended by Assister Programs

Brokers gave the ACA a rating of 4.5 out of 10, on average.  Their top priority changes were:

  • Increase broker commissions (47% included among the top three changes; 20% named this as the top priority);
  • Repeal the law altogether (28% listed among top three changes; 20% as first priority): and
  • Reduce health plan deductibles and cost sharing (28% included among their top three changes; 6% named as first priority (Figure 17).
Figure 17: Priority Changes to ACA Recommended by Brokers

Key Findings: Discussion

The new ACA system for in-person enrollment assistance through Marketplaces is becoming well established.  The vast majority of Programs have operated for three years and most of their staff have worked all three years, as well.  With tenure comes increasing expertise with Marketplace rules and procedures and familiarity with communities served.  There are now opportunities to build on the strengths of the most seasoned Programs and Assisters – perhaps offering more in-depth training and continuing education to develop specialized skills.

Fewer consumers were helped by Assister Programs this year.  Perhaps not coincidentally, the annual rate of Marketplace enrollment growth slowed this year, as well.  Investing in consumer assistance could help to increase enrollment, although those investments have to compete against other needs in federal, state, and marketplace budgets.  Evidence suggests consumers’ need for in-person help won’t go away any time soon:  an increasing share of consumers seeking help this year were renewing vs. applying for the first time; most still have limited understanding of health insurance and the ACA; and many still lack confidence to apply on their own.  There is also substantial churn in Marketplace enrollment – for example, as people gain or lose jobs with health benefits – creating an influx of new consumers seeking coverage and in-person help between Open Enrollment periods.

Uncertainty is also a challenge for Assister Programs, with one in three not certain that funding will be available next year.   The FFM has reduced funding uncertainty by adopting multi-year agreements with Assister Programs, though the amount of funding is decided year-by-year.

The survey reveals that the bulk of consumer help through Assister Programs is provided by a minority of large Programs–80% of all consumers helped in OE3 were served by just one-quarter of all Assister Programs.  These large-caseload Programs include Navigators, which contract directly with Marketplaces, and FQHC and CAC Programs, which are certified by Marketplaces but not necessarily as familiar to Marketplace officials.  Large caseload Programs may provide the greatest opportunity for improving consumer assistance in the future; however, these programs face resource constraints and were the most likely to say that demand for help exceeded their capacity to provide it, especially during surge times.

Assisters continue to report that it takes 90 minutes on average to help new Marketplace participants, and 60 minutes on average for returning consumers.  That the process remains time intensive, even after IT systems have improved, indicates how complicated the application process can be for consumers.  Consumers face particular challenges when “real time” data verification and file transfers don’t work, and significant delays and enrollment barriers can result.  It appears that many, if not most individuals who experience data verification difficulties are not being helped by Assister Programs.

Brokers, who have emerged as an important avenue for marketplace enrollment, are, not surprisingly, concerned about the loss of revenue as insurance companies reduce or end commissions, actions taken most often this year for SEP enrollments.  Millions of consumers are estimated to become eligible for SEPs during the year, but only a fraction take up the opportunity to enroll.24   SEP enrollments can help offset normal churn of individuals who return to group health plans or public coverage during the year.  Loss of broker commissions, combined with adoption of new SEP eligibility verification requirements by the FFM, could dampen Marketplace enrollment.

The survey shows that brokers in FFM states rely heavily on alternative enrollment channels, especially to the extent these offer enhanced functionality.  However, little is known about the experiences of consumers who apply through them or how often consumers buy other products through these sites, such as short-term policies or plans that target specific diseases.

Finally, Assisters and brokers on the front lines have valuable insights into how health reforms are working for consumers.  Lower cost sharing in Marketplace health plans was identified as a priority by both Assister Programs and brokers.  Reducing cost sharing presents tradeoffs – increasing premiums or government subsidies for low-income consumers – but could also be a factor helping to sustain enrollment growth.

Methods

The Kaiser Family Foundation 2015 Survey of Health Insurance Marketplace Assister Programs and Brokers was designed and analyzed by KFF researchers and administered by Davis Research. This nationwide survey was conducted through an online questionnaire from February 11, 2016 through March 4, 2016.

To recruit Assister Program survey participants, we asked officials CMS and from States operating SBM or FPM Marketplaces to provide contact information for the directors of their certified Assister Programs. In addition, we requested contact information for the directors of enrollment assistance activities in each of the FQHCs from HRSA.  All Assister Programs received an email with a link to the survey inviting the director to participate. In the event the person receiving the survey was not the appropriate person to complete it, they were asked to provide the contact name and email for the appropriate person within their organization.

To analyze results, we assigned Assister Programs to one of four types based on their primary source of funding.  The first type, Navigators, were those identified by Marketplace officials contracted with and received grant funding directly from the Marketplace.     The second type, FEAP, were those identified by CMS as contractors that operate in certain FFM states and that otherwise act as Navigators.  We tracked FEAP responses separately in the survey, but for most data analysis presented in this report we combined responses of FEAPs and Navigators.   The third type, FQHCs, were those that received grant funding from HRSA to provide enrollment assistance. We identified FQHCs using the contact list provided by HRSA.  A small percentage of FQHC Programs receive both HRSA grants and Marketplace Navigator grant funding; these were categorized as Navigators for our analysis.  All other Assister Programs certified to provide assistance in Marketplaces were designated as CACs.

A total of 5,094 Programs were invited to participate in the study, and 688 Programs responded and were included (for a response rate of 13.5%).  Because response rates varied by Program type, data were weighted to reflect the distribution in the initial sample by Program type and Marketplace type; for our analysis, FFM and FPM Marketplaces were grouped together.  (FFM + FPM, and SBM).  Weighted and unweighted proportions of the final sample by Program type are shown in the table below.

 Unweighted % of totalWeighted % of total
FFM/FPM CAC33%46%
FFM/FPM FQHC16%16%
FFM/FPM Navigator/FEAP10%3%
SBM CAC16%18%
SBM FQHC10%9%
SBM Navigator/FEAP14%8%

Nationwide Estimates

Using responses provided by Assister Programs in the study, we were able to estimate the number of Assister Program staff and the number of consumers they helped with eligibility and enrollment in Medicaid/CHIP and Qualified Health Plans during the second Open Enrollment period nationwide, by extrapolating response data to the national level.  Survey participants were asked to provide the number of full-time equivalent Assisters in their Program and the number of consumers helped.  Respondents who did not provide a numeric value for the number of consumers helped were asked to estimate a number using a range of options.  In making our calculation, we used the midpoint value for responses that provided a range of numbers of consumers helped.   Non-responses were imputed based on the type of Assister Program. A limitation of our national-estimates methodology is that outliers in our response data (i.e. assister programs that helped over 10,000 people during open enrollment, or who had more than 100 staff), when extrapolated to the national level may have an outsize influence on our estimates of total helped and total assister staff nationwide.

We also surveyed the work of Assister Programs outside of Open Enrollment as they helped people apply for Special Enrollment Periods, report mid-year changes to the Marketplace, and resolve post-enrollment problems.  Using response data provided by returning Assister Programs, we were able to estimate the number of people nationally who received help from Assister Programs between the first and second Open Enrollment periods with each of these types of issues.

Brokers

To recruit brokers in the Federally-Facilitated Marketplace (FFM) states, we obtained contact information from a file of brokers in the FFM states, made publicly available through healthcare.gov.25   To obtain broker contact information from the SBM and FPM states, we asked Marketplaces to provide contact information, and when that was not provided, compiled contact information that was publicly available on Marketplace websites.   As we estimate that there are tens of thousands of brokers selling non-group Marketplace policies nationwide, we drew a sample of 9,432 brokers based on their distribution by Marketplace type (FFM, FPM, or SBM).  Our general sampling rule was to randomly select 10% of all contacts in each state; we oversampled in ten states where we had fewer than 500 contacts to begin with.  Because we did not have a complete sample of Marketplace brokers in all states, we were not able to compute national estimates of the numbers of consumers helped by brokers.

Out of the 9,432 brokers who were invited to participate in the study, 418 responded and were included (for a response rate of 4%).

Toplines and Margin of Sampling Error

Survey toplines with overall frequencies of both Assister Programs and Brokers for all survey questions are available at https://www.kff.org/health-reform/report/2016-survey-of-health-insurance-marketplace-assister-programs-and-brokers.

The sample size and margin of sampling error (MOSE) for the total sample and key subgroups of Assister Programs are shown in the table below. All statistical tests of significance account for the effect of weighting.

GroupN (unweighted)MOSE
Total688+/-4 percentage points
CAC341+/-5 percentage points
FQHC179+/-7 percentage points
Navigator and FEAP168+/-8 percentage points
BrokersN (unweighted)MOSE
Total418+/-5 percentage points


Endnotes

  1. Center for Consumer Information and Insurance Oversight, “Navigator Grant Recipients for States with Federally-facilitated or State Partnership Marketplace,” available at http://www.cms.gov/CCIIO/Programs-and-Initiatives/Health-Insurance-Marketplaces/Downloads/Navigator-Grantee-Summaries-UPDATED-05-05-15.pdf. ↩︎
  2. In year 3, the 14 SBM states were California, Colorado, Connecticut, District of Columbia, Hawaii, Idaho, Kentucky, Maryland, Massachusetts, Minnesota, New York, Rhode Island, Vermont and Washington.  The 3 consumer assistance FPM states were Delaware, New Hampshire and West Virginia.  Arkansas and Illinois were approved for status as a consumer assistance FPM in year one, but have since ceased providing state support for consumer assistance.  The FPM states were included with FFM states for this analysis. ↩︎
  3. During the third Open Enrollment period, FEAPs operated in Arizona, Florida, Georgia, Indiana, Louisiana, North Carolina, New Jersey, Ohio, Pennsylvania, and Texas. ↩︎
  4.   Twelve CAP programs received limited supplemental grants for FY 2015:  California, Connecticut, District of Columbia, Maine, Maryland, Massachusetts, Michigan, Mississippi, Missouri, New York, North Carolina, and Vermont. ↩︎
  5. https://www.cms.gov/Newsroom/MediaReleaseDatabase/Fact-sheets/2015-Fact-sheets-items/2015-12-30.html ↩︎
  6. http://www.cbpp.org/research/remote-identity-proofing-impacts-on-access-to-health-insurance ↩︎
  7. https://www.cms.gov/Newsroom/MediaReleaseDatabase/Fact-sheets/2016-Fact-sheets-items/2016-03-11.html ↩︎
  8. http://kffhealthnews.org/news/paperwork-inconsistencies-causing-thousands-to-lose-obamacare-subsidies/ ↩︎
  9. https://aspe.hhs.gov/basic-report/health-plan-choice-and-premiums-2016-health-insurance-marketplace ↩︎
  10. See for example A Frakt, “Too Many Choices,” Academy Health, 2013, available at http://blog.academyhealth.org/too-many-choices/ ↩︎
  11. Patient Cost Sharing in Marketplace Plans, 2016, Kaiser Family Foundation, available at https://modern.kff.org/health-costs/issue-brief/patient-cost-sharing-in-marketplace-plans-2016/ ↩︎
  12. “Five Facts About Deductibles” CMS blog post November 17, 2015, available at https://blog.cms.gov/2015/11/ ↩︎
  13. 2016 Survey of Non-Group Health Insurance Enrollees, Wave 3, Kaiser Family Foundation, available at https://modern.kff.org/health-reform/poll-finding/survey-of-non-group-health-insurance-enrollees-wave-3/ ↩︎
  14. http://www.coveredca.com/news/ ↩︎
  15. Personal communication, April 29, 2016 ↩︎
  16. Personal communication, April 29, 2016. ↩︎
  17. http://insurancenewsnet.com/oarticle/unitedhealthcare-to-stop-paying-insurance-agents-for-selling-aca-health-plans ↩︎
  18. http://www.usatoday.com/story/news/nation/2016/03/31/insurers-cut-commissions-restrict-when-and-what-plans-people-buy/82210946/ ↩︎
  19. http://kffhealthnews.org/news/licking-wounds-insurers-accelerate-moves-to-limit-health-law-enrollment/ ↩︎
  20. http://ctmirror.org/2016/02/12/state-says-unitedhealthcare-cant-ax-broker-commissions/ ↩︎
  21. http://csahu.org/images/B-4_87_Prohibition_on_Differing_Commission_Structures_for_the_Sale_of_Health_Benefit_Plans.pdf ↩︎
  22. http://insurance.ky.gov/Documents/AdvOp16_01AgentCommissionPayments010616.pdf ↩︎
  23. http://www.benefitspro.com/2016/04/08/covered-california-posts-agent-comp-draft ↩︎
  24. See for example, M Buettgens et al, “More than 10 Million Uninsured Could Obtain Marketplace Coverage through Special Enrollment Periods,” November 2015, available at http://www.urban.org/sites/default/files/alfresco/publication-pdfs/2000522-More-than-10-Million-Uninsured-Could-Obtain-Marketplace-Coverage-through-Special-Enrollment-Periods.pdf ↩︎
  25. https://localhelp.healthcare.gov/ ↩︎

The Louisiana Health Care Landscape

Published: Jun 8, 2016

In 2005, Hurricane Katrina wreaked havoc on the health system in Louisiana, shuttering major safety-net hospitals in New Orleans and decimating access to care for low-income and uninsured populations. Currently, Louisiana is experiencing changes to its health care delivery and payment systems as the state expands Medicaid, provides new coverage options through the federal health insurance marketplace, and streamlines application and enrollment processes for coverage programs. This fact sheet provides an overview of resident socio-demographic characteristics, population health, health coverage, and the health care delivery system in Louisiana both pre-Hurricane Katrina and in the era of health reform.

Figure 1: The Southern Region of the U.S.

Demographics

Louisiana is home to more than 4.5 million people, making it the 25th most populous state in the U.S and 10th most populous in the South.1  It is bordered by four states and is one of seventeen states located in the country’s Southern region (Figure 1). Louisiana’s topography is mostly flat but defined by the Mississippi River Delta where the Mississippi River enters into the Gulf of Mexico and salt marshes that run along the Gulf of Mexico coastline.2 

Much of Louisiana is rural, but the population is concentrated in a handful of counties. Among the state’s 64 parishes (Louisiana counties are called parishes), three had total nonelderly populations that exceeded 300,000 (East Baton Rouge, Jefferson, and Orleans), accounting for over one-quarter of the state’s population (Figure 15, Appendix).3 

Figure 2: Racial and Ethnic Distribution of Louisiana Residents, Compared to the U.S. Overall, 2014

Louisiana is racially and ethnically diverse. While people of color account for 41% of the state’s population compared to 39% of the national population, the make-up of the minority population is different from the national landscape (Figure 2). In particular, compared to the U.S. overall, a much larger share of Louisianans identify as Black (31% vs. 12% nationally).4  Hispanics account for 6% of the population in Louisiana, which is less than the share in the U.S. overall (18%).  Over half of Louisiana’s population (58%) identifies as non-Hispanic White.

Other socio-demographic population patterns in Louisiana, including citizenship status and age distribution, mirror other states in the South and the U.S. overall (Table 1). Over one-quarter (26%) Louisiana residents are children, more than nine in ten (95%) are U.S.-born citizens, and almost one-quarter of nonelderly adults (22%) have at least a college degree. Nearly two-thirds of residents (65%) live in a household with at least one full-time worker.

Table 1: Selected Demographic Characteristics of the Louisianan Population,Compared to the South and U. S. Overall, 2014
 LouisianaSouthU. S.
Race/Ethnicity
White58%58%62%
Black31%19%12%
Hispanic6%17%18%
Other Race/Ethnicity5%6%8%
Age
0-1826%25%25%
19-6462%61%61%
65+12%14%15%
Citizenship Status
U.S.-Born Citizen95%88%87%
Naturalized Citizen2%5%6%
Non-Citizen3%7%7%
Educational Attainment of Adults (19 and older)
Less than High School15%13%11%
High School Graduate35%31%30%
Some College/Assoc. Degree28%28%29%
College Graduate or Greater22%28%30%
SOURCE: Kaiser Family Foundation estimates based on the Census Bureau’s March 2015 Current Population Survey (CPS: Annual Social and Economic Supplement).
Figure 3: Poverty Rates by Race/Ethnicity and Age in Louisiana, 2014

In addition to a higher overall share of Louisianans living in poverty than the national average (23% vs. 15%), Louisiana has wide disparities in poverty rates by race/ethnicity and age. In Louisiana, Blacks are almost three times as likely as Whites to be poor (Figure 3). As in most other states, children in Louisiana are substantially more likely than adults to live in a poor household. As of 2014, one- third (33%) of Louisiana children under age 19 lived in poverty, compared to one in five nonelderly adults (20%) and 16% of adults age 65 and older.5 

Population Health

Louisiana falls well below national averages in rankings of state population health. Louisiana ranks 50th overall among the 50 states in the United Health Care Foundation’s report, America’s Health Rankings 2015.6  In the Commonwealth Fund rankings of state health system performance, Louisiana maintained a very low ranking of 48th among 51 states (including DC) between 2009 and 2015.7  According to the Centers for Disease Control and Prevention (CDC), compared to other states, Louisiana has relatively higher rates of diseases of the heart, HIV, and drug-related mortality compared to national averages.8  The teen pregnancy rate has been steadily declining to 69 pregnancies per 1,000 women aged 15-19 in 2010 from 108 per 1,000 in 1992. However, Louisiana’s 2010 teen pregnancy rate still remains well above national levels (69 vs. 57 pregnancies per 1,000.9 ) At 483.4 cases per 100,000 people, Louisiana had the fourth highest cancer incidence rate nationally and third highest among states in the South in 2012. The state also ranked fourth both nationally and among states in the South with a cancer death rate of 190.5 deaths per 100,000 people.10 

Along with states across the nation, Louisiana is experiencing a high number of drug overdose deaths. According to the CDC, the age-adjusted rate of drug overdose deaths in Louisiana in 2014 was 16.9 per 100,000, higher than the national rate of 14.7 per 100,000. However, unlike the 6.5% national increase in drug overdose-related deaths between 2013 and 2014, the rate in Louisiana decreased by 5.1% over that same period.11 

Disparities in health and health care access exist in Louisiana. As in other states across the country, measures of health status in Louisiana vary by race/ethnicity, and patterns across these measures in Louisiana are similar to national data (Table 2). Over one quarter (28%) of Black residents in Louisiana report being in fair or poor general health compared to 19% of those who identify as White and 14% of those who identify as Hispanic. Additionally, Blacks (74%) are more likely to be overweight or obese than Whites (67%) and Hispanics (66%). Disparities in access to care also exist in Louisiana. As at the national level, Hispanics in Louisiana are more likely to report having no personal doctor (37%) compared to Blacks (31%) and Whites (22%).

Table 2: Selected Measures of Health Status and Health Access for Adults by Race/Ethnicity in Louisiana Compared to the United States, 2014
Share reporting that they: LouisianaUnited States
WhiteBlackHispanicWhiteBlackHispanic
Have fair or poor general health19%28%14%15%22%26%
Smoke24%25%20%18%20%14%
Are overweight or obese67%74%66%63%73%70%
Have no personal doctor22%31%37%18%24%41%
Have not had a checkup in the past 2 years14%11%20%17%11%22%
Had mental distress in the past month33%34%36%34%35%34%
Have diabetes10%15%9%10%15%11%
NOTE: Data for Whites and Blacks exclude Hispanics. Adults are anyone 18 years or older. Mental distress indicates respondents reported that their mental health was not good at least one day out of the past 30 days.SOURCE: KCMU analysis of the Centers for Disease Control and Prevention (CDC)’s Behavioral Risk Factor Surveillance System (BRFSS) 2014 Survey Results.

State and local efforts are working to address health disparities in Louisiana. Louisiana’s Bureau of Minority Health Access & Promotions was established by the Louisiana Department of Health and Hospitals and the Minority Health Affairs Commission in 1999 to address public health issues for minority populations and poor Whites.12  In 2015, the U.S. Department of Health and Human Services Office of Minority Health awarded Louisiana a five year grant, supporting collaborations between the local, state, and national communities to develop and implement effective policies supporting obesity and overweight health statuses prevention in minority communities and increase access to physical activities and healthy food choices.13  Research institutions in the state are also working to study and improve health equity across Louisiana. For example, the Louisiana Center for Health Equity is working to eliminate health disparities rooted in poverty, lack of access to quality health care, and unhealthy environmental conditions.

State Economy, Budget, and Medicaid

The recent decline in oil prices has caused economic and fiscal pressures in Louisiana. Louisiana, like most other states, saw economic conditions slowly improve following the Great Recession. In 2014, Louisiana’s total state Gross Domestic Product (GDP) was $251.6 billion, making it the 23rd largest economy in the country14 , but the state experienced slower growth between 2013 and 2014 than the national average (2.7% vs. 4.1% increase in GDP between 2013 and 2014). Unlike the health care and social assistance sectors, which together accounted for over one-tenth (14%) of the total increase in GDP between 2013 and 2014, the state saw a nearly double digit decline in GDP from the oil and related sectors during this period as oil prices declined.15  In contrast to the national level, unemployment rates increased from 5.5 percent in January 2014 (a post-recession low and below the national average) to 7.0 percent in November 2014 (above the national average at that point.) The unemployment rate has declined since then but remains above national levels (6.3% vs. 5.0% in April 2016).16  The decline in economic activity in the oil and related sectors has also resulted in declines in severance tax revenues (which in Louisiana make up nearly 10 percent of state tax revenues); total state tax revenues in Louisiana have started to decline as has been the case in other oil-dependent states.17 

Figure 4: Budget Expenditures by Funding Source for Louisiana, SFY 2014

Governor Edwards, who took office in January 2016, indicated the state faced a budget shortfall for this current fiscal year (FY 2016) and as well as for FY 2017 that was caused in part by the decline in oil prices as well as other actions taken in prior years related to revenues.18  He called a special session to address the issue in February 2016 that resulted in some measures to close part of the shortfall that included spending cuts and limited revenue increases.19  The general session, scheduled to end June 6, is considering cuts to the Department of Health and Hospitals as well as the Taylor Opportunity Program for Students (TOPS) that provides scholarships to students.  The governor has indicated that he may convene another special session to explore additional revenue options.20 

Medicaid and the State’s Budget

Medicaid spending accounted for over one-quarter (27%) of total (both state and federal) state budget spending in state fiscal year (SFY) 2014 (Figure 4). Medicaid is the second largest category of state general fund spending behind elementary and secondary education and is the single largest source of federal funds flowing into the state. Medicaid costs are shared by the state and the federal government, with the federal government paying more than half (63%) of Louisiana Medicaid expenditures.21  For every dollar that Louisiana spends on Medicaid, the federal government sent $1.56 in matching funds to the state in fiscal year 2014.22 

Figure 5: Medicaid Enrollment and Expenditures, FY 2011

While a majority of Medicaid enrollees in Louisiana are children and nonelderly adults, the elderly and people with disabilities account for a disproportionate share of the program’s expenditures. As of FY 2011, children made up 53% of Medicaid enrollees in Louisiana but accounted for just under one-quarter (23%) of total Medicaid expenditures (Figure 5). The elderly and people with disabilities accounted for over one-quarter (27%) of enrollees but 65% of total program costs. Average spending per beneficiary in Louisiana was $4,869, the sixth lowest in the South and much lower than the national average of $5,790 (Figure 6).

Following national trends, Louisiana continues to shift toward community-based, rather than institutional, long-term services and supports (LTSS).23  In FY 2014, Louisiana’s Medicaid program spent $2.2 billion on LTSS, devoting approximately 39%, or $865 million, to home and community-based services (HCBS).24  The share of Medicaid LTSS dollars that have been devoted to HCBS increased from 37% in FY 2009 to 39% in FY 2014, which mirrors a national shift toward serving more people in home and community-based settings rather than institutions. This “rebalancing” of Medicaid LTSS expenditures is due in large part to beneficiary preferences for HCBS, the lower cost of HCBS relative to comparable institutional care, and states’ community integration obligations under the Supreme Court’s Olmstead decision.25 

Figure 6: Average State Medicaid Spending per Beneficiary Among States in the South Region, FY 2011

Health Coverage in Louisiana

In 2014, Louisiana had the one of the highest uninsured rates (13%) in the U.S. Half (50%) of Louisianans were covered under private health insurance, with 45% of Louisianans covered by employer-sponsored insurance and the remaining 5% covered by individual26  coverage (Figure 7). Over one quarter (26%) were covered by Medicaid/other public coverage and 11% were covered by Medicare. Of the over half million beneficiaries enrolled in Medicare, nearly a third (30%) were enrolled in Medicare Advantage plans in 2015.27 

Individuals who were uninsured in 2014 were primarily low-income, in working families, and White non-Hispanic. Because most elderly Louisianans are covered by Medicare, most uninsured are nonelderly (under age 65). The majority of nonelderly, uninsured Louisianans in 2014 had at least one full-time worker in their household (65%) and had income below 400% of the federal poverty level (FPL, 85%). Almost half (49%) of nonelderly, uninsured Louisianans identified as White, over one-third (37%) identified as Black, and 15% identified as Hispanic (Figure 8). Additionally, Figure 16 (Appendix) shows how the uninsured rate varies across parishes in Louisiana.

Figure 7: Health Insurance Coverage of the Total Population in Louisiana, 2014

Affordable Care Act Implementation and Coverage Changes

A main goal of the Affordable Care Act (ACA) was to increase coverage of the uninsured population, including many of the 645,000 Louisianans who were uninsured prior to ACA implementation. The ACA sought to accomplish this through insurance market reforms and by establishing new coverage pathways, including providing premium subsidies to most uninsured individuals with incomes up to 400% FPL to purchase coverage on the Health Insurance Marketplace and an expansion of Medicaid to cover nearly all nonelderly adults up to 138% FPL ($16,394 per year for an individual or $27,820 for a family of three in 2016). The Supreme Court decision on the ACA’s constitutionality effectively made the adult Medicaid expansion a state option.28   

In Louisiana, coverage through the Health Insurance Marketplace went into effect in January 2014, and the Medicaid expansion will be implemented in July 2016. When the ACA provisions went into effect in January 2014, Louisiana did not elect to establish a state-based exchange or to implement the Medicaid expansion. On January 1, 2014, the federal government established a federal Health Insurance Marketplace. Louisiana’s new Governor, Governor John Bel Edwards, adopted the Medicaid expansion in January 2016, with coverage beginning July 1, 2016.

Figure 8: Characteristics of the Nonelderly Uninsured in Louisiana, 2014

The uninsured rate in Louisiana has been relatively flat following implementation of the ACA. Compared to the rest of the nation, which saw a significant decline in the uninsured rate in 2014 and 2015, the uninsured rate for the nonelderly in Louisiana decreased slightly from 15% in 2013 to 12% in 2015 (Figure 9), but this change is not statistically significant. In Louisiana, many uninsured individuals fell into the “coverage gap” in 2014 and 2015, prior to the adoption of the Medicaid expansion. In addition, while enrollment in Marketplace coverage was slow to take hold, it has grown over time.29  With Louisiana’s implementation of the Medicaid expansion in 2016, it is likely that the state will see a significant drop in the uninsured rate as people enroll in this new coverage option.

As part of the ACA, all states are required to implement new, simplified eligibility and enrollment processes, and Louisiana has made progress in implementing some of these changes. As of January 2016, individuals in Louisiana can apply for both Medicaid and Health Insurance Marketplace coverage through multiple pathways, including in-person, over the phone, by mail, and online.30  Simplified renewal process have been in place in Louisiana since prior to the ACA (Box 1).

Box 1: Louisiana’s Renewal Strategies Prior to the Affordable Care Act (ACA)

Prior to the ACA, Louisiana was recognized as a national leader for streamlining renewal processes for children receiving Medicaid and CHIP benefits. Relying heavily on data available from other sources to establish continued eligibility, the state’s renewal processes have been championed nationally. Over nine in ten (95%) children had their Medicaid or CHIP coverage renewed, and fewer than 1% lost coverage due to procedural reasons in 2008, in advance of the state’s use of Express Lane Eligibility (ELE).31  According to a 2014 report for the U.S. Assistant Secretary for Planning and Evaluation (ASPE), over three-quarters (76%) of children’s completed renewals were based on data matches.32 ,33  Other renewal strategies Louisiana has employed include 12 months continuous eligibility, rolling or “off cycle” renewals, electronic case files and signatures, and the use of a reasonable certainty standard when determining eligibility.34 

The Children’s Health Insurance Program Reauthorization Act of 2009 (CHIPRA) established “Performance Bonuses” for states to support the enrollment and retention of eligible children in Medicaid. The Performance Bonuses provided additional federal funding for qualifying states that took steps to simplify Medicaid and CHIP enrollment and renewal procedures and increased Medicaid enrollment of children above a baseline level. Louisiana won CHIPRA Performance Bonus Awards for three consecutive years (FYs 2009, 2010, and 2011) due in part to their work in renewals.35 

Figure 9: Uninsured Rate among Nonelderly Louisianans, 2013, 2014, and 2015


Health Insurance Marketplace

Louisianans are able to shop for health plans through HealthCare.gov, the federal Health Insurance Marketplace. Louisiana is one of 34 states in which the federal government established and is running the Health Insurance Marketplace.36  Monthly premiums for a benchmark Qualified Health Plan (QHP) in New Orleans before tax credits are $332 for an individual in 2016, an increase of 12% from 2015.37  In 2015, five carriers offered individual coverage in the Marketplace. Louisiana Health Cooperative stopped offering coverage in 2016, and, as a result, 16,000 enrollees had to find a new plan in 2016.38 

Figure 10: Number of Individuals Selecting a Marketplace Plan, as a Share of the Potential Marketplace Population in Southern States, as of February 2016

On February 1, 2016, at the end of the Marketplace’s third open enrollment period, 214,000 Louisianans had selected a Marketplace plan, almost nine in ten (89%) of whom were eligible for premium subsidies to purchase coverage. Over one third (37%) of Marketplace enrollees in Louisiana were under age 35. Almost half (48%) of Louisianans enrolled in Marketplace coverage were new customers.39  Among all states, Louisiana had the 22nd largest share of the potential Marketplace population enrolled in a Marketplace plan as of February 2016 (45%) and the seventh largest share in the South (Figure 10).40 

Support for outreach and enrollment in Louisiana is being provided by the federal government and private organizations. In 2015, two organizations received $1.561 million in federal navigator grant funds to provide enrollment assistance to Louisianans (Table 3). One of these two organizations, Southwest Louisiana Area Health Education Center operates statewide and has been awarded grants for all three open enrollment periods. Since 2013, federal funding for consumer assistance in Louisiana has decreased by over $200,000 and the number of organizations providing such services decreased from four to two.

Table 3: Navigator Grant Recipients, their Funding Levels, and Percent of Total Grants Distributed, 2013-2015
Organization2013 Funding2014 Funding2015 Funding
Total Funding Level$1,767,174$1,133,256$1,560,723
  Capital Area Agency on Aging, District II, Inc.$100,000$110,000
  Family Road of Greater Baton Rouge$513,189
  Martin Luther King Health Center, Inc.$81,066
  National Healthy Start Association$391,846
  Southern United Neighborhoods$486,123
  Southwest Louisiana Area Health Education Center$1,099,985$1,023,256$1,047,534
NOTE: “–“denotes that that organization was not a Navigator grant recipient in that year.
Source: Center for Consumer Information and Insurance Oversight, 2013, 2014, and 2015 Navigator Grant Recipients, https://www.cms.gov/cciio/programs-and-initiatives/health-insurance-marketplaces/assistance.html

Medicaid in Louisiana After the ACA

Louisiana is the 32nd state (including DC) in the nation and the 7th of the 17 states that make up the American South to adopt the ACA Medicaid expansion. While most states implemented the Medicaid expansion on January 1, 2014, Louisiana did not expand under Governor Bobby Jindal. The newly elected Governor, John Bel Edwards, campaigned on implementing the Medicaid expansion and signed an executive order on January 12, 2016, his second day in office, adopting the Medicaid expansion.41  Unlike its neighbor Arkansas, Louisiana is implementing the Medicaid expansion using a State Plan Amendment (SPA), rather than a waiver; the SPA was approved by HHS in April 2016.42  Enrollment under the expansion began June 1, 2016, and coverage is scheduled to go into effect July 1, 2016.43  Through the Medicaid expansion, the state anticipates enrolling over 300,00044  Louisianans by using coordinated outreach and enrollment efforts and innovative, data-driven approaches to accelerate enrollment. Louisiana is the first state to obtain a state plan amendment to use Supplemental Nutrition Assistance Program (SNAP) data to facilitate enrollment of eligible individuals into Medicaid (other states have received approval to use SNAP data to facilitate Medicaid enrollment through waiver authority).45  Louisiana also plans to target specific populations for outreach and enrollment, for example, by connecting individuals to Medicaid upon reentry into the community following release from incarceration.

In April 2016, Governor Edwards testified before Louisiana’s Senate Health and Welfare Committee stating that the expansion would result in state general fund savings. Additionally, estimates from the Louisiana Department of Hospitals and Health (DHH) in 2013 and the Louisiana Legislative Fiscal Office (LFO) in 2015 show net savings, with more saving when the state will receive a 100% match for dollars spent on individuals who are newly eligible.

Figure 11: Medicaid/CHIP Income Eligibility Thresholds Pre- and Post- Medicaid Expansion Adoption In Louisiana

Eligibility levels for parents and childless adults will increase after implementation of the Medicaid expansion (Figure 11). When the coverage expansion takes effect on July 1, 2016, Louisiana’s parent eligibility threshold will increase from 24% ($4,838 for a family of three in 2016) FPL to 138% FPL ($27,820 for a family of three in 2016). Childless adults will be newly eligible for coverage with incomes up to 138% FPL ($16,394 for an individual in 2016).46  Eligibility levels for children and pregnant women through Medicaid and CHIP will remain higher at 255% FPL ($51,408 for a family of three in 2016) and 214% FPL ($43,142 for a family of three in 2016), respectively.

As a result of the adoption of the Medicaid expansion, a third of the uninsured population moved from falling into a “coverage gap” to being eligible for coverage. Before the state expanded Medicaid, a third of the nonelderly uninsured population fell into a “coverage gap” because they were childless adults or earned too much to qualify for Medicaid but not enough to qualify for Marketplace tax credits. After the adoption of the Medicaid expansion, over half (53%) of nonelderly uninsured people in the state are eligible for Medicaid or CHIP. Additionally, one in five (20%) is eligible for premium tax credits to help purchase private coverage in the Marketplace.47 

Figure 12: Managed Care Penetration Rates in Louisiana and 39 States with Managed Care, July 2015

Most Medicaid beneficiaries are currently enrolled in managed care plans. In Louisiana, 71% of the total Medicaid population are enrolled in one of the state’s nine managed care plans (Figure 12).48  However, the penetration rate varies across eligibility groups. Almost all (99%) of children are enrolled in a Medicaid managed care plan whereas only about one-third (37%) of low-income adults and two-fifths (40%) of seniors and people with disabilities are enrolled in Medicaid managed care plans. All of the nine Medicaid managed care plans are owned by a multi-state parent firm.49  As of December 2015, Louisiana had integrated all specialized behavioral health care services into the state’s Medicaid managed care program.50  

Safety Net in Louisiana

In Louisiana, health care for the indigent is a state, rather than local, responsibility. The state, through its safety net hospitals, provides care free of charge for state residents with incomes at or below 200% FPL. For uninsured individuals above 200% FPL, charges are reduced by 40%.51  While the hospitals provide low-income, uninsured individuals with a broad array of medical services, the system’s focus is acute care and provides fewer options for primary care.52 ,53 

Prior to 2012, Louisiana essentially had a “two-tier” health system. The insured population (including those with Medicare and Medicaid) had access to a range of community hospitals and physicians, while the poor and uninsured were mostly cared for through the Louisiana State University (LSU)-run system of 10 state-funded inpatient hospitals (including New Orleans Charity Hospital before Hurricane Katrina) and a network of more than 350 clinics. Eight of the ten state hospitals fell under the administrative responsibility of the LSU Health Care Services Division (LSUHCSD) and two were operated by LSU Health Sciences Center in Shreveport.54 

The health system providing care to the uninsured in Louisiana was largely driven by financing mechanisms. Medicaid represented not only a system of health care coverage for low-income people in Louisiana but also a mechanism of financing health care for the uninsured. Louisiana was a major user of Medicaid DSH funding; in FY 2014, Louisiana’s $1.1 billion in DSH funds accounted for over 15% of all Medicaid spending in the state (compared with about under 4% nationwide).55  DSH payments are made by a state’s Medicaid program to hospitals that the state designates as serving a “disproportionate share” of low-income or uninsured patients. These payments are in addition to the regular payments such hospitals receive for providing inpatient care to Medicaid beneficiaries. In Louisiana, the state allocated most of its Medicaid DSH payments to the LSU system to finance care for the uninsured. While the LSU system offered outpatient and ambulatory care services, Louisiana’s use of Medicaid DSH funds in this way created a reliance on inpatient hospital care for the poor.56 

Prior to Hurricane Katrina in 2005, Charity Hospital and University Hospital were hubs of the LSU system in New Orleans, serving a largely poor, predominantly minority population through inpatient care clinics, a network of outpatient clinics, and one of the busiest emergency departments (EDs) in the country. Nearly three-quarters of Charity Hospital’s patients were African American, and 85% had annual individual incomes of less than $20,000.57  In 2003 more than half of the inpatient care provided by Charity Hospital was for patients without insurance, compared with only 4% of inpatient care at other New Orleans hospitals.58  It was also the dominant provider of substance abuse, psychiatric, and HIV/AIDS care in the New Orleans area and the only Level 1 trauma center on the Gulf Coast.

Hurricane Katrina devastated the New Orleans health care safety net, closing Charity Hospital, University Hospital, and most of the city’s other hospitals. Both of these hospitals were eventually replaced by University Medical Center New Orleans (UMCNO) in August 2015, which is now the city’s main trauma and safety-net hospital.59  UMCNO cost $1.1 billion to construct, most of which was provided by the Federal Emergency Management Agency (FEMA).60 

In summer 2012, the Louisiana Legislature reduced Medicaid funding, applying the majority of the cuts to the public hospital system.61  In late 2012 and early 2013, the LSU hospitals were leased to private companies, creating private-public partnerships to operate the hospitals. In the partnerships, the private companies lease and operate the hospital and its affiliated clinics. Of the ten original charity hospitals, five62  were transitioned to the private partners during FY 2013 and another four63  were transitioned during FY 2014.64  Only one hospital, Lallie Kemp Regional Medical Center in Independence, Louisiana, is still operated by the state.65  The privately run hospitals are required to continue to provide indigent care to uninsured individuals with incomes up to 200% FPL, graduate medical education, and care to public offenders.66  While contracts with the hospitals state that the hospitals must continue to provide these services, it is currently unclear how the privatization has impacted access to care for the uninsured. Additionally, as of 2014, Our Lady of the Lake’s hospital agreement allowed the hospital to discontinue providing care to public offenders.67 

Box 2: Impact of Hurricane Katrina on Primary Care in New Orleans

Before Hurricane Katrina, the delivery system was hospital dominated. With the destruction of this system in 2005, efforts to broaden community based primary care have increased.  After Hurricane Katrina in 2005, the state received $100 million for a federal Primary Care Access Stabilization Grant (PCASG) through September 2010 to increase coverage for low-income populations in New Orleans. This funding restored and expanded access to primary care services, including mental health and dental care. To maintain funding after the grant ended, the state received approval for a Section 1115 waiver in September 2010 called the Greater New Orleans Community Health Connection (GNOCHC) Program.

The current waiver (extended in 2014) provides limited benefit coverage (primary and preventive care, behavioral health, some specialty care and care coordination68 ) for uninsured, nonelderly adults with incomes up to and including 100% FPL living in or around the city of New Orleans (Orleans, Jefferson, St. Bernard, or Plaquemines parishes) and not currently eligible for other public coverage. Under the waiver, the state can implement an enrollment cap to control costs. Care is provided by those providers that participated in the PCASG program that preceded the GNOCHC waiver. The most recent renewal also removes Early and Periodic Screening, Diagnostic and Treatment (EPSDT) for individuals ages 19 and 20, retroactive eligibility, and non-emergency medical transportation.69 ,70 

Figure 13: Selected Characteristics of Patients Served by Federally Qualified Health Centers in Louisiana, 2014

Louisiana’s safety net providers play an important role in delivering health care to the state’s most vulnerable populations. Louisiana’s community health centers provide access to primary and preventive services for low-income and underserved residents. Louisiana is home to 30 federally qualified health centers (FQHCs), which operate 162 sites throughout the state. In 2014, the state’s FQHCs saw over 303,000 patients and provided nearly 1.1 million patient visits. Over a third (37%) of their patients were uninsured and two-fifths (40%) had Medicaid coverage (Figure 13). Nearly all (93%) had incomes below 200% FPL, including over three-quarters (77%) who had income below 100% FPL.71 

There is unmet need for health care providers in Louisiana. As of April 2014, Louisiana had 118 primary care Health Professional Shortage Areas (HPSA), 102 dental HPSAs, and 109 mental health HPSAs. In primary care and dental care providers per population, Louisiana fared better than the U.S. overall in percent of need met to adequately serve the population. Seventy-eight percent of the primary health care provider need and 62% of dental care provider need in Louisiana was met, compared to 60% for primary care and 41% for dental care nationally (Figure 14). However, Louisiana has less than half (42%) of the number of mental health care providers needed to adequately serve the population, compared to just over half (51%) for the nation as a whole.72 

Figure 14: Percent of Primary Care, Dental Care, and Mental Health Care Practitioner Capacity Need Met, April 2014

As of 2014, Louisiana ranked 10th in the country for the ratio of medical students to 100,000 population (45.3 in Louisiana compared to 30.4 nationally). However, Louisiana ranked 20th among states in the percentage of physicians completing graduate medical education in the state who remain in-state to practice (47%).73  Louisiana is one of 17 states with licensure laws that limit the autonomy of nurse practitioners in at least one area of practice.74 

Looking Ahead

With 4.5 million residents, health coverage and care decisions Louisiana will continue to have important implications for the health and well-being of the state’s most vulnerable populations and the national healthcare landscape. With Louisiana being the most recent state to adopt the Medicaid expansion, the coverage gap is eliminated for the uninsured adults below poverty and a continuum of care coverage will be available for all uninsured Louisianans. Outreach and enrollment efforts will be important to connect the newly insured to coverage. Meanwhile, the health care system in Louisiana is evolving and changing to meet new demands as providers adapt to the changing health coverage landscape.

Appendix

Figure 15: Louisiana Nonelderly Population by County, 2010-2014
Figure 16: Louisiana Nonelderly Uninsured by County, 2010-2014
  1. The Kaiser Family Foundation’s State Health Facts. Data Source: Kaiser Family Foundation estimates based on the Census Bureau’s March 2015 Current Population Survey (CPS: Annual Social and Economic Supplement). Accessed February 10, 2016. “Total Number of Residents,” https://modern.kff.org/other/state-indicator/total-residents/. ↩︎
  2. World Atlas, Louisiana, http://www.worldatlas.com/webimage/countrys/namerica/usstates/paland.htm. ↩︎
  3. US Census Bureau, 2010-2014 American Community Survey, County Total Population Estimates. ↩︎
  4. Kaiser Family Foundation estimates based on the Census Bureau’s March 2015 Current Population Survey (CPS: Annual Social and Economic Supplement). ↩︎
  5. Kaiser Family Foundation estimates based on the Census Bureau’s March 2015 Current Population Survey (CPS: Annual Social and Economic Supplements). ↩︎
  6. United Health Care Foundation, America’s Health Rankings (2015), http://www.americashealthrankings.org/. ↩︎
  7. The Commonwealth Fund. Aiming Higher: Scorecard on State Health System Performance, 2014, http://www.commonwealthfund.org/publications/fund-reports/2014/apr/2014-state-scorecard. ↩︎
  8. The Centers for Disease Control and Prevention (CDC), National Center for Health Statistics, Division of Vital Statistics, National Vital Statistics Reports (NVSR) Volume 64, Number 2, Table 19, http://www.cdc.gov/nchs/data/nvsr/nvsr64/nvsr64_02.pdf. ↩︎
  9. K. Kost and S. Henshaw. “U.S. Teenage Pregnancies, Births and Abortions, 2010: National and State Trends by Age, Race and Ethnicity. Table 3.3.” http://www.guttmacher.org/pubs/USTPtrends10.pdf. ↩︎
  10. United States Cancer Statistics (USUC), Centers for Disease Control and Prevention (CDC), 2012 Selected Cancers Ranked by State, https://nccd.cdc.gov/USCS/cancersrankedbystate.aspx#text. ↩︎
  11. Rose Rudd, Noah Aleshire, Jon Zibbell, and R. Matthew Gladden, Increases in Drug and Opioid Overdose Deaths – United States, 2000-2014 (Atlanta, Louisiana: Centers for Disease Control and Prevention, January 1, 2016), http://www.cdc.gov/mmwr/preview/mmwrhtml/mm6450a3.htm. ↩︎
  12. Louisiana Department of Health and Hospitals, Bureau of Minority Health Access & Promotions, http://new.dhh.louisiana.gov/index.cfm/page/269/n/171. ↩︎
  13. U.S. Department of Health and Human Services Office of Minority Health, Louisiana State Partnership Grant to Address Health Disparities Program (LPAHD), http://minorityhealth.hhs.gov/omh/content.aspx?lvl=2&lvlid=66&ID=126. ↩︎
  14. U.S. Bureau of Economic Analysis, Current-Dollar GDP by State, Louisiana, 2014 (December 10, 2015). ↩︎
  15. U.S. Bureau of Economic Analysis, Current-Dollar GDP by State, Louisiana, 2014 (December 10, 2015). ↩︎
  16. Louisiana and state figures from Table 3, Civilian Labor Force and Unemployment by State and Selected Area, Seasonally Adjusted (April 14, 2016), http://www.bls.gov/news.release/laus.t03.htm. U.S. figure from Bureau of Labor Statistics, Unemployment Rate (Seasonally Adjusted) (February 17, 2016), http://data.bls.gov/cgi-bin/surveymost?bls. ↩︎
  17. Lucy Dadayan and Donald Boyd, Double, Double, Oil and Trouble. The Nelson A. Rockefeller Institute of Government, February 2016. http://www.rockinst.org/pdf/government_finance/2016-02-By_Numbers_Brief_No5.pdf. ↩︎
  18. Governor Edwards Announces Solutions to Stabilize Louisiana Budget, Office of the Governor, January 19, 2016, http://gov.louisiana.gov/news/gov-edwards-announces-initial-solutions-to-fy16-and-fy17-budget-shortfalls. ↩︎
  19. Edwards Issues Statement on Revenue Estimating Conference Meeting, Office of the Governor, March 16, 2016, http://gov.louisiana.gov/news/edwards-issues-statement-on-revenue-estimating-conference-meeting. ↩︎
  20. House Bill 1, Louisiana State Legislature, http://legis.la.gov/legis/BillInfo.aspx?s=16RS&b=HB1&sbi=y. ↩︎
  21. Urban Institute analysis of CMS Form 64 data as of June 2015, https://modern.kff.org/medicaid/state-indicator/federalstate-share-of-spending/. ↩︎
  22. 80 Fed. Reg. 73779-73782. (November 25, 2015), at https://www.gpo.gov/fdsys/pkg/FR-2015-11-25/pdf/2015-30050.pdf. ↩︎
  23. Steve Eiken, Kate Sredl, Brian Burwell, Paul Saucier, Medicaid Expenditures for Long-Term Services and Supports (LTSS) in FY 2013: Home and Community-Based Services were a Majority of LTSS Spending, (Centers for Medicare and Medicaid Services and Truven Health Analytics, June 308, 2015), https://www.medicaid.gov/medicaid-chip-program-information/by-topics/long-term-services-and-supports/downloads/ltss-expenditures-fy2013.pdf. ↩︎
  24. Steve Eiken, Kate Sredl, Brian Burwell, and Paul Saucier, Medicaid Expenditures for Long-Term Services and Supports (LTSS) in FY 2014: Managed LTSS Reached 15 Percent of LTSS Spending (Bethesda, MD: Truven Health Analytics, April 2015), https://www.medicaid.gov/medicaid-chip-program-information/by-topics/long-term-services-and-supports/downloads/ltss-expenditures-2014.pdf. ↩︎
  25. The Olmstead decision found that the unjustified institutionalization of persons with disabilities violates the Americans with Disabilities Act. Olmstead v. L.C. 527 U.S. 581 (1999), http://www.law.cornell.edu/supct/html/98-536.ZS.html. ↩︎
  26. Includes individuals and families that purchased or are covered as a dependent by non-group insurance. ↩︎
  27. State Health Facts. “Medicare Advantage Enrollment as a Percent of Total Medicare Population” (Kaiser Family Foundation, 2015), https://modern.kff.org/medicare/state-indicator/enrollees-as-a-of-total-medicare-population/. ↩︎
  28. MaryBeth Musumeci, A Guide to the Supreme Court’s Affordable Care Act Decision (Washington, D.C.: Kaiser Family Foundation, June 2012), https://modern.kff.org/health-reform/issue-brief/a-guide-to-the-supreme-courts-affordable/. ↩︎
  29. Health Insurance Marketplaces 2016 Open Enrollment Period: Final Enrollment Report for the period: November 1, 2015 – February 1, 2016, Office of the Assistant Secretary for Planning and Evaluation (ASPE), Department of Health and Human Services (HHS), March 11, 2016, https://aspe.hhs.gov/sites/default/files/pdf/187866/Finalenrollment2016.pdf. Addendum to the Health Insurance Marketplaces 2016 Open Enrollment Period: Final Enrollment Report for the period: November 1, 2015 – February 1, 2016, Office of the Assistant Secretary for Planning and Evaluation (ASPE), Department of Health and Human Services (HHS), March 11, 2016, https://aspe.hhs.gov/sites/default/files/pdf/188026/MarketPlaceAddendumFinal2016.pdf. ↩︎
  30. Tricia Brooks, Sean Miskell, Samantha Artiga, Elizabeth Cornachione, and Alexandra Gates, Medicaid and CHIP Eligibility, Enrollment, Renewal, and Cost-Sharing Policies as of January 2016: Findings from a 50-State Survey (Washington, DC: Kaiser Family Foundation’s Commission on Medicaid and the Uninsured, January 2016), https://modern.kff.org/medicaid/report/medicaid-and-chip-eligibility-enrollment-renewal-and-cost-sharing-policies-as-of-january-2016-findings-from-a-50-state-survey/ ↩︎
  31. Tricia Brooks, The Louisiana Experience: Successful Steps to Improve Retention in Medicaid and SCHIP (Washington, D.C.: Georgetown Center for Children and Families, February 2009) http://ccf.georgetown.edu/ccf-resources/louisiana-experience-successful-steps-improve-retention-medicaid-schip/ ↩︎
  32. Administrative renewal is conducted for children whose families have a financial situation that makes continued eligibility almost certain, and ex-parte renewal is when caseworkers determine a child’s eligibility with reasonable certainty by investigating multiple data sources, including SNAP, TANF, and wage/unemployment insurance information, etc. ↩︎
  33. Stan Dorn, Sarah Minton, Erika Huber, Examples of Promising Practices for Integrating and Coordinating Eligibility, Enrollment and Retention: Human Services and Health Programs Under the Affordable Care Act (Washington, D.C.: The Urban Institute, July 21, 2014), https://aspe.hhs.gov/pdf-report/examples-promising-practices-integrating-and-coordinating-eligibility-enrollment-and-retention-human-services-and-health-programs-under-affordable-care-act. ↩︎
  34. Stan Dorn, Sarah Minton, Erika Huber, Examples of Promising Practices for Integrating and Coordinating Eligibility, Enrollment and Retention: Human Services and Health Programs Under the Affordable Care Act (Washington, D.C.: The Urban Institute, July 21, 2014), https://aspe.hhs.gov/pdf-report/examples-promising-practices-integrating-and-coordinating-eligibility-enrollment-and-retention-human-services-and-health-programs-under-affordable-care-act. ↩︎
  35. State Health Facts. “CHIPRA Performance Bonus Awards” (Washington, D.C.: Kaiser Family Foundation, FY 2009-2013), https://modern.kff.org/other/state-indicator/chipra-performance-bonuses/. ↩︎
  36. State Health Facts. “State Decisions for Creating Health Insurance Marketplaces” (Kaiser Family Foundation, February 19, 2015), http://modern.kff.org/health-reform/state-indicator/health-insurance-exchanges/. ↩︎
  37. State Health Facts, “Monthly Silver Premiums for a 40 Year Old Non-Smoker Making $30,000/Year” (Washington, D.C.: Kaiser Family Foundation, 2015-2016), https://modern.kff.org/other/state-indicator/monthly-silver-premiums-for-a-40-year-old-non-smoker-making-30000year/. ↩︎
  38. State Health Facts. “Number of Issuers Participating in the Individual Health Insurance Marketplaces” (Washington, D.C.: Kaiser Family Foundation, 2014 – 2016), https://modern.kff.org/other/state-indicator/number-of-issuers-participating-in-the-individual-health-insurance-marketplace/. ↩︎
  39. According to ASPE’s January 2016 Enrollment Report: “New Consumers” are those individuals who selected a 2016 Marketplace medical plan (with or without the first premium payment having been received directly by the issuer) as of the reporting date, and did not have a Marketplace plan selection as of November 2015. ↩︎
  40. Health Insurance Marketplaces 2016 Open Enrollment Period: Final Enrollment Report for the period: November 1, 2015 – February 1, 2016, Office of the Assistant Secretary for Planning and Evaluation (ASPE), Department of Health and Human Services (HHS), March 11, 2016, https://aspe.hhs.gov/sites/default/files/pdf/187866/Finalenrollment2016.pdf. Addendum to the Health Insurance Marketplaces 2016 Open Enrollment Period: Final Enrollment Report for the period: November 1, 2015 – February 1, 2016, Office of the Assistant Secretary for Planning and Evaluation (ASPE), Department of Health and Human Services (HHS), March 11, 2016, https://aspe.hhs.gov/sites/default/files/pdf/188026/MarketPlaceAddendumFinal2016.pdf. ↩︎
  41. Louisiana Office of the Governor, Edwards Signs Executive Order to Provide Health Care for Working Families, January 12, 2016, http://gov.louisiana.gov/news/edwards-signs-executive-order-to-provide-health-care-for-working-families. ↩︎
  42. Centers for Medicare and Medicaid Services, Louisiana State Plan Amendment to Expand Medicaid, https://www.medicaid.gov/State-resource-center/Medicaid-State-Plan-Amendments/Downloads/LA/2016/LA-16-0004.pdf. ↩︎
  43. Centers for Medicare and Medicaid Services, Louisiana State Plan Amendment to Expand Medicaid, https://www.medicaid.gov/State-resource-center/Medicaid-State-Plan-Amendments/Downloads/LA/2016/LA-16-0004.pdf. ↩︎
  44. “Governor Edwards: Enrollment for Medicaid Expansion to Begin on June 1,” Louisiana State Website, April 18, 2016  http://gov.louisiana.gov/news/enrollment-for-medicaid-expansion-to-begin-on-june-1 and presentation by Rebekah Gee, MD, DHH Secretary, May 9, 2016. ↩︎
  45. U.S. Department of Health and Human Services, Press Release, “HHS Secretary Sylvia M. Burwell Applauds Louisiana Medicaid Expansion Under the Affordable Care Act,” http://www.hhs.gov/about/news/2016/05/31/hhs-secretary-sylvia-m-burwell-applauds-louisiana-medicaid-expansion-under-affordable-care-act.html ↩︎
  46. Tricia Brooks, Sean Miskell, Samantha Artiga, Elizabeth Cornachione, and Alexandra Gates, Medicaid and CHIP Eligibility, Enrollment, Renewal, and Cost-Sharing Policies as of January 2016: Findings from a 50-State Survey (Washington, DC: Kaiser Family Foundation’s Commission on Medicaid and the Uninsured, January 2016), https://modern.kff.org/medicaid/report/medicaid-and-chip-eligibility-enrollment-renewal-and-cost-sharing-policies-as-of-january-2016-findings-from-a-50-state-survey/. ↩︎
  47. Rachel Garfield, Anthony Damico, Cynthia Cox, Gary Claxton, and Larry Levitt, New Estimates of Eligibility for ACA Coverage among the Uninsured, (Washington, D.C.: Kaiser Family Foundation, January 2016), http://files.kff.org/attachment/data-note-new-estimates-of-eligibility-for-aca-coverage-among-the-uninsured. ↩︎
  48. State Health Facts. “Medicaid Managed Care Penetration Rates by Eligibility Group” (Washington, D.C.: Kaiser Family Foundation, July 1, 2015), https://modern.kff.org/medicaid/state-indicator/managed-care-penetration-rates-by-eligibility-group/. ↩︎
  49. State Health Facts. “Medicaid MCOs and their Parent Firms” (Washington, D.C.: Kaiser Family Foundation, March 2015), https://modern.kff.org/other/state-indicator/medicaid-mcos-and-their-parent-firms/. ↩︎
  50. Louisiana Department of Health and Hospitals, DHH Announces Plans to Integrate Behavioral Health Services into Medicaid Managed Care Plans, November 19, 2014, http://dhh.louisiana.gov/index.cfm/newsroom/detail/3165. ↩︎
  51. LUS Policy 2525-12 Charity Care, http://www.lsu.edu/bos/hospital-ceas/umcmc/docs/LSU-Policy-2525-12-Charity-Care-3.pdf. ↩︎
  52. Don Gregory and Alison Neustrom, “A New Safety Net: The Risk and Reward of Louisiana’s Charity Hospital Privatization” (Baton Rouge, LA: Public Affairs Research Council of Louisiana, 2013), http://www.parlouisiana.org/s3web/1002087/docs/parhospital2013.pdf. ↩︎
  53. It is unclear whether the indigent care system will be affected by the adoption of the Medicaid expansion, but should lead to a reduction in the uninsured and would mean more coverage options for those currently uninsured and using these programs. ↩︎
  54. Robin Rudowitz, Diane Rowland and Adele Shartzer, Health Care In New Orleans Before And After Hurricane Katrina, Health Affairs 25, no.5 (2006):w393-w406, doi: 10.1377/hlthaff.25.w393 originally published online August 29, 2006, http://content.healthaffairs.org/content/25/5/w393.full?keytype=ref&siteid=healthaff&ijkey=NVgQvGWGxvVqA. ↩︎
  55. State Health Facts. “Distribution of Medicaid Spending by Service” (Washington, D.C.: Kaiser Family Foundation, May 4, 2016), https://modern.kff.org/medicaid/state-indicator/distribution-of-medicaid-spending-by-service/. ↩︎
  56. Stephen Zuckerman and Teresa Coughlin, Initial Health Policy Reponses to Hurricane Katrina and Possible Next Steps (Washington, D.C.: Urban Institute, February 2006),  http://www.urban.org/sites/default/files/alfresco/publication-pdfs/900929-Initial-Health-Policy-Responses-to-Hurricane-Katrina-and-Possible-Next-Steps.PDF. ↩︎
  57. Robin Rudowitz, Diane Rowland and Adele Shartzer, Health Care In New Orleans Before And After Hurricane Katrina, Health Affairs 25, no.5 (2006):w393-w406, doi: 10.1377/hlthaff.25.w393 originally published online August 29, 2006, http://content.healthaffairs.org/content/25/5/w393.full?keytype=ref&siteid=healthaff&ijkey=NVgQvGWGxvVqA. ↩︎
  58. Uncompensated care cost data for 2003 provided to the authors of the Health Affairs article by the Louisiana Hospital Association. ↩︎
  59. University Hospital was reopened in 2006 under the name LSU Interim Hospital. This hospital was then closed and moved all of its patients to University Medical Center New Orleans in August 2015. ↩︎
  60. University Medical Center New Orleans, “About Us,” http://www.umcno.org/aboutumc. ↩︎
  61. “Louisiana Cuts Medicaid Program to the Bone,” The Times-Picayune (New Orleans, Louisiana), July 13, 2012, http://www.nola.com/politics/index.ssf/2012/07/louisiana_cuts_medicaid_progra.html. ↩︎
  62. The five hospitals privatized in FY 2013 were: Earl K. Long Medical Center in Baton Rouge (now closed, services moved to Our Lady of the Lake Hospital); Interim LSU Public Hospital in New Orleans (now University Medical Center New Orleans); University Medical Center in Lafayette (now Lafayette General Medical Center); Leonard J. Chabert Medical Center in Houma (now Ochsner Leonard J. Chabert Medical Center); and W.O. Moss Regional Medical Center in Lake Charles (now Moss Memorial Health Clinic). ↩︎
  63. The four hospitals privatized in FY 2014 were: LSU Medical Center in Shreveport (now University Health Shreveport); E. A. Conway Medical Center in Monroe (now University Health Conway); Huey P. Long Medical Center in Pineville (now closed, services moved to a new campus that offers an Urgent Care Clinic, Medicine Clinic, Specialty Clinic, and Pharmacy Services); and Bogalusa Medical Center (Our Lady of the Angels Hospital). ↩︎
  64. Don Gregory and Alison Neustrom, “A New Safety Net: The Risk and Reward of Louisiana’s Charity Hospital Privatization” (Baton Rouge, LA: Public Affairs Research Council of Louisiana, 2013), http://www.parlouisiana.org/s3web/1002087/docs/parhospital2013.pdf. ↩︎
  65. Don Gregory and Alison Neustrom, “A New Safety Net: The Risk and Reward of Louisiana’s Charity Hospital Privatization” (Baton Rouge, LA: Public Affairs Research Council of Louisiana, 2013), http://www.parlouisiana.org/s3web/1002087/docs/parhospital2013.pdf. ↩︎
  66. Hospital Cooperative Endeavor Agreements, LSU Board of Supervisors, http://www.lsu.edu/bos/hospital-ceas.php. ↩︎
  67. Cooperative Endeavor Agreement by and Among Our Lady of the Lake Hospital, Inc. and Board of Supervisors of LSU and Agricultural and Mechanical College, The State of Louisiana through the Division of Administration, and the Louisiana Department of Health and Hospitals, http://www.lsu.edu/bos/hospital-ceas/ololbr/docs/CEA.pdf. ↩︎
  68. The waivers benefit package offers care coordination, immunizations/flu vaccines, laboratory and radiology, mental health, primary care, preventive care, substance abuse services, and specialty care (when referred from a primary care provider). ↩︎
  69. Greater New Orleans Community Health Connection (GNOCHC) Waiver Approval, November 25, 2014, https://www.medicaid.gov/Medicaid-CHIP-Program-Information/By-Topics/Waivers/1115/downloads/la/la-gnoch-ca.pdf. ↩︎
  70. It is unclear whether the Section 1115 waiver will be affected by the adoption of the Medicaid expansion, but should lead to a reduction in the uninsured and would mean more coverage options for those currently uninsured and using these programs. ↩︎
  71. U.S. Department of Health and Human Services, Health Resources & Services Administration (HRSA) Health Center Program, 2014 Health Center Data, Louisiana Program Grantee Data, http://bphc.hrsa.gov/uds/datacenter.aspx?year=2014&state=LA. ↩︎
  72. Bureau of Clinician Recruitment and Service, Health Resources and Services Administration (HRSA), U.S. Department of Health & Human Services, HRSA Data Warehouse: Designated Health Professional Shortage Areas Statistics, as of April 28, 2014, https://datawarehouse.hrsa.gov/Tools/HDWReports/Reports.aspx. ↩︎
  73. Association of American Medical Colleges, Louisiana Physician Workforce Profile 2014, https://www.aamc.org/download/447182/data/louisianaprofile.pdf. ↩︎
  74. American Association of Nurse Practitioners, State Practice Environment 2015, https://www.aanp.org/images/documents/state-leg-reg/stateregulatorymap.pdf. ↩︎
News Release

New Campaign Features Top YouTube and Social Media Stars To Educate Young People About Latest In HIV/AIDS

Published: Jun 6, 2016

“Girl, no! You cannot get HIV like that!,” exclaims YouTube star Todrick Hall in a new video for HIV BEATS, an upbeat and informative new series from #endHIV and Greater Than AIDS, made in collaboration with YouTube. 

Featuring top YouTube influencers, the series debuts on the 35th anniversary of the first case of HIV/AIDS (June 5). HIV BEATS aims to connect with younger audiences about game-changing advances in HIV prevention, testing and treatment. The CDC reports people under 25 now account for a quarter of new infections in the U.S., and are among those least likely to know their status and to be on treatment if living with HIV.

RuPaul’s Drag Race winner, Bob the Drag Queen, purrs seductively in his video about PrEP, a pill that prevents HIV. While Todrick, who has more than 2.1 million YouTube subscribers, sets the record straight about common misperceptions about how HIV is and is not transmitted, a continued source of HIV stigma.

Also featured in the fun and fact-filled campaign are Davey Wavey (YouTuber; 900k+ subscribers) on what it means to be “undetectable;” Zackary Drucker (I Am Cait; Transparent) on how HIV treatment improves health and reduces transmission; Catrific (YouTuber; 700k+) on preventing mother to child HIV transmission; and Amber’s Closet (YouTuber; 500k+) on HIV testing options. Collectively, the roster and partner organizations have a starting social reach of more than 8 million, a significant share of the population the campaign hopes to reach.

“HIV Beats is a millennial response from a generation that has never lived without HIV/AIDS,” said Zachary Barnett, Founder and Executive Director of the Abzyme Research Foundation which is running the #endHIV Campaign. “We are thrilled to unleash so much creativity in the HIV prevention space, and also introduce younger audiences to our HIV cure efforts.”

“An AIDS-free future is possible, but young people must be engaged,” said Tina Hoff, Senior Vice President and Director, Health Communications & Media Partnerships, Kaiser Family Foundation, which directs Greater Than AIDS. “HIV BEATS reaches young people where they are with the information they need to stay healthy, regardless of status.”

Filmed at YouTube Space LA, HIV Beats was directed by Miranda Penn Turin, edited by Bec Stupac, and produced by Diktator. Songwriter Lucian Piane (Sia, RuPaul, RuPaul’s Drag Race, Adam Lambert) provided original music and Melissa Schade, who works with Ryan Heffington (Sia), choreographed. Production was supported by unrestricted grant funding from Gilead Sciences, Inc. to the Abzyme Research Foundation. Gilead Sciences, Inc. has had no input into the development or content of these materials.

To watch all the videos and learn more about the HIV BEATS campaign, go to: HIVbeats.greaterthan.org


About #endHIV

#endHIV is a campaign of the Abzyme Research Foundation to advance a new therapeutic HIV vaccine.  Using cutting-edge abzyme technology developed by Dr. Sudhir Paul at the University of Texas, Houston Medical Center, the vaccine is in the process of seeking permission from the FDA for Phase I human trials. 

About Greater Than AIDS

Greater Than AIDS is a leading national public information response focused on the U.S. domestic epidemic. Launched in 2009 by the Kaiser Family Foundation and Black AIDS Institute, it is supported by a broad coalition of public and private sector partners, including: major media and other business leaders; Federal, state and local health agencies and departments; national leadership groups; AIDS service and other community organizations; and foundations, among others. Through targeted media messages and community outreach, Greater Than AIDS works to increase knowledge, reduce stigma and promote actions to stem the spread of the disease. While national in scope, Greater Than AIDS focuses on communities most affected.

About Kaiser Family Foundation

The Kaiser Family Foundation, a leader in health policy analysis, health journalism and communication, is dedicated to filling the need for trusted, independent information on the major health issues facing our nation and its people. The Foundation is a non-profit private operating foundation based in Menlo Park, California.

Connecting the Justice-Involved Population to Medicaid Coverage and Care: Findings from Three States

Authors: Jennifer Ryan, Lucy Pagel, Katy Smali, Samantha Artiga, Robin Rudowitz, and Alexandra Gates
Published: Jun 1, 2016

Executive Summary

This brief provides an overview of initiatives to connect the justice-involved population to Medicaid coverage and care in three states—Arizona, Connecticut, and Massachusetts. These states are leading efforts in these areas and provide key lessons about how to coordinate across health care and corrections and the potential of such initiatives to better link individuals to physical and behavioral health services. While their experiences to date point to important benefits stemming from these efforts, more time and data are needed to examine the effects on health and criminal justice outcomes. In sum, this brief finds:

Each of the case study states is connecting individuals to Medicaid coverage at multiple points within the justice system. The states have processes to suspend Medicaid eligibility for incarcerated individuals and to enroll incarcerated individuals who receive inpatient care. They also have initiatives to enroll inmates prior to release from incarceration and individuals on probation and parole. In Connecticut, about 60% of the incarcerated population is enrolled in Medicaid upon release, and, in Massachusetts, the majority of individuals released from prison each year are enrolled. Arizona reaches a smaller share of the incarcerated population since it targets efforts to those with serious mental illness and complex health conditions, but plans to broaden its scope in the future. Even with these efforts, there remain enrollment barriers, including difficulty reaching individuals who move into and out of custody quickly and system limitations.

The study states also connect individuals to health care in the community as they are released from jail or prison. To date, the initiatives primarily target individuals with significant health needs. They help individuals establish connections with community providers, schedule appointments, and obtain referrals for care or other services. The study states also have processes to provide individuals access to prescription drugs upon release. Newly released individuals face a range of access barriers even with this support. Providing assistance through individuals with a shared incarceration history, helping individuals address their priority needs, and identifying culturally competent providers can help overcome these challenges.

These approaches have increased coverage, facilitated access to care, and contributed to administrative efficiencies and state savings, but effects on criminal justice outcomes have not been measured. Savings include avoided capitation payments, increased federal funds for inpatient care for incarcerated individuals, and reduced costs in other programs. More research is needed on the effects on health and criminal justice outcomes, including recidivism rates. Strong leadership and close collaboration across stakeholders are key to success given that these are complex initiatives that involve multiple agencies.

Issue Brief

Introduction

Many individuals who are involved with the criminal justice system have significant physical and mental health needs. With the Affordable Care Act (ACA) Medicaid expansion to low-income adults adopted in 32 states to date, many individuals involved with the justice system are now eligible for Medicaid. Connecting these individuals to health coverage can facilitate their integration back into the community by increasing their ability to address their health needs, which may contribute to greater stability in their lives and broader benefits. An increasing number of states have efforts underway to enroll eligible individuals moving into and out of the justice system into Medicaid. Moreover, some states are looking beyond coverage to help link individuals to health services in the community upon release from incarceration.

Building on previous briefs about health coverage and Medicaid eligibility for the justice-involved population, this brief provides an overview of initiatives to connect the justice-involved population to Medicaid coverage and care in three states—Arizona, Connecticut, and Massachusetts. These states are leading efforts in these areas and provide key lessons about how to coordinate across health care and corrections and the potential of such initiatives to better link individuals to physical and behavioral health services. It is based on telephone interviews conducted in early 2016 with a range of stakeholders, including Medicaid agency staff, staff from the state Departments of Corrections (DOCs), Justice departments, providers and health plans, and advocates.

Background

The justice-involved population has significant physical and behavioral health needs. They have high rates of disease, including tuberculosis, HIV, Hepatitis B and C, arthritis, diabetes, and sexually transmitted disease compared to the general population.1  They also have significant behavioral health needs. Over half of prison and jail inmates have a mental health disorder, with local jail inmates experiencing the highest rate (64%). Moreover, the majority of inmates with a mental health disorder also have a substance or alcohol use disorder.2 

The criminal justice system is comprised of a range of different correctional facilities. It includes prisons, which typically house longer-term felons or inmates serving a sentence of more than one year, and jails, which house individuals awaiting trial or sentencing and those convicted of misdemeanors and serving shorter terms that are typically less than one year. There also are community-based supervision arrangements, including probation, parole, and halfway houses. The federal correctional system consists of prisons overseen by the Federal Bureau of Prisons, which house individuals convicted of a federal crime and generally serving a term of more than one year. State correctional systems oversee prisons housing individuals convicted of state crimes and generally serving terms of more than one year. Each state governs its own prison system through a Department of Corrections. Jails typically are governed by the local city or county governments. However, the structure of the system varies across states. For example, some states, including C0nnecticut, have a unified system in which the state oversees both the state prisons and jails.

Individuals may be enrolled in Medicaid while incarcerated. There is no federal statute, regulation, or policy that prevents individuals from applying for, being enrolled in, or being renewed for Medicaid while incarcerated. In April 2016 guidance, the Centers for Medicare and Medicaid Services (CMS) reiterated that incarcerated individuals may be determined eligible for Medicaid and that the state Medicaid agency must accept applications and process renewals for incarcerated individuals (Box 1).3 

Box 1: Medicaid Eligibility for Incarcerated Individuals

In guidance released in April 2016, CMS clarified that:

  • Incarceration does not preclude an inmate from being determined Medicaid-eligible.
  • The state Medicaid agency must accept applications from inmates to enroll in Medicaid or renew Medicaid enrollment during the time of their incarceration.
  • If the individual meets all applicable Medicaid eligibility requirements, the state must enroll or renew the enrollment of the individual effective before, during, or after the period of time spent in the correctional facility.
  • Once enrolled, the state may place the inmate in a suspended eligibility status during the period of incarceration.

Source: Centers for Medicare & Medicaid Services, “To facilitate successful re-entry for individuals transitioning from incarceration to their communities,” State Health Official Letter SHO #16-007, April 28, 2016, https://www.medicaid.gov/federal-policy-guidance/downloads/sho16007.pdf

Although individuals may be enrolled in Medicaid while they are incarcerated, Medicaid will not cover the cost of their care, except for inpatient services. In its recent guidance, CMS clarified who is considered an inmate of a public institution and therefore only able to receive Medicaid coverage for inpatient care. It also clarifies some groups that are not considered inmates of a public institution and, thus, can receive Medicaid coverage for all covered services if enrolled (Box 2).

Box 2: Who is an Inmate of a Public Institution?

An inmate of a public institution is a person living in a public institution, including a correctional institution. Correctional institutions include state or federal prisons, local jails, detention facilities, or other penal settings. An important consideration of whether an individual is an “inmate” is his or her legal ability to exercise personal freedom. Inmates may be enrolled in Medicaid but are only able to receive Medicaid coverage for inpatient care.

The following groups are NOT inmates of a public institution and can receive Medicaid coverage for all covered services if enrolled:

  • Individuals on probation, parole, or community release pending trial;
  • Individuals residing in corrections-related, supervised community residential facilities, unless the individual does not have freedom of movement and association while residing at the facility; and
  • Individuals on home confinement.

Source: Centers for Medicare & Medicaid Services, “To facilitate successful re-entry for individuals transitioning from incarceration to their communities,” State Health Official Letter SHO #16-007, April 28, 2016, https://www.medicaid.gov/federal-policy-guidance/downloads/sho16007.pdf

Overview of Study State Initiatives

Medicaid Enrollment Efforts

Historically, most states terminated Medicaid coverage for enrollees who became incarcerated because reimbursement was not available for most services provided to inmates of public institutions and most individuals involved with the justice system were not eligible for Medicaid prior to the ACA. However, given eligibility gains as a result of the ACA Medicaid expansion and CMS guidance encouraging states to facilitate connections to coverage and care, there has been increased movement among states to suspend rather than terminate Medicaid coverage for enrollees who become incarcerated.4  Over 30 states reported that they suspend Medicaid coverage as of January 2016.5  Suspending Medicaid coverage allows individuals to have their coverage active immediately upon release, facilitating their ability to access services. It also expedites access to federal Medicaid funds if an individual receives inpatient care during a period of incarceration that qualifies for Medicaid reimbursement. Beyond increased use of suspension, there also are growing efforts to enroll uninsured individuals into Medicaid prior to release from incarceration. For example, New York and Maryland recently released proposals to facilitate individuals’ connections to Medicaid upon release from incarceration.6 

As described below, each of the case study states—Arizona, Connecticut, and Massachusetts—is connecting individuals involved with the justice system to Medicaid coverage in multiple ways, including suspending Medicaid eligibility for incarcerated individuals, enrolling incarcerated individuals into Medicaid when they receive inpatient care that qualifies for Medicaid coverage, enrolling individuals in Medicaid prior to release from incarceration, and enrolling individuals in other areas of the justice system, including those on probation and parole.

Suspending Medicaid Eligibility

In Arizona, the Medicaid agency has suspense agreements in place with the Arizona DOC, Arizona Department of Juvenile Corrections (ADJC), and 9 out of the state’s 15 county jail systems, which together account for 90% of the state’s incarcerated population. (See agreement template here.) These efforts began as a pilot in one of the state’s larger county jail systems around 2005 and have expanded over time. Participating jails and prisons send a daily file of bookings and releases to the state Medicaid agency to identify cases to be placed in suspension status and those that need the suspension status lifted due to release. This is an electronic, automated process in most participating counties. When an individual is placed in suspension status, the state discontinues capitation payments to managed care plans for the individual, since he or she is only eligible for coverage of inpatient care while incarcerated. About 9,000 Medicaid enrollees are in suspension status in any given month. Upon release from jail or prison, individuals’ coverage is reactivated without them having to reapply. The Medicaid agency also processes renewals while individuals are incarcerated.

Connecticut places an enrollee in suspension status once he or she has been in custody for 60 days. Waiting 60 days before moving an enrollee into suspension status helps prevent disruptions in coverage for individuals who move into and out of incarceration over very short periods of time. Because Connecticut does not have managed care in its Medicaid program, there are no financial consequences related to waiting 60 days to activate the suspension. About 2,300 people were in suspension status as of April 2016. The DOC notifies the Medicaid agency as individuals are released and full benefits are restored. The state implemented this suspension process in June 2015. Prior to implementing this process, Medicaid coverage was discontinued for approximately 1,200 individuals each month due to their incarceration status.

Massachusetts has established a special fee-for-service limited inpatient Medicaid benefit. When the Medicaid agency is notified that an enrollee is incarcerated, eligibility staff update the individual’s coverage to this limited hospital benefit. Full benefit coverage is turned back on upon release.

Enrolling Incarcerated Individuals Who Receive Inpatient Care

In Arizona, the state has a separate agreement with counties regarding Medicaid coverage for inpatient hospital care for incarcerated individuals. (See agreement template here.) The Medicaid agency receives information from the hospital when inpatient care is provided to an inmate. If an individual is not already in suspension status, an application is initiated and processed to initiate Medicaid coverage for the care that is provided during the inpatient stay.

Connecticut processes new applications for individuals who receive inpatient care and are not in suspension status in order to access Medicaid coverage for the care. Hospitals are no longer required to submit an application if an inmate is in suspension status to access the coverage. The state hopes to implement a more automated process in the future that will rely on data matching rather than applications.

In July 2015, Massachusetts launched a statewide effort to enroll inmates with inpatient stays into Medicaid. If an individual has a scheduled inpatient stay, the individual is enrolled prior to receiving the care. If the care is unexpected, the individual is enrolled while in the hospital. The state’s DOC medical care vendor is assisting with these enrollments. As part of implementation of this policy, the DOC conducted significant outreach to the hospitals to educate them about the change in financing for this care.

Pre-Release Enrollment Efforts

Arizona began enrolling individuals into Medicaid prior to release a number of years ago with targeted efforts for people with serious mental illness and complex health needs. Medicaid applications for uninsured individuals are submitted via the online application or faxed or mailed from the jails and prisons to the Medicaid agency about 30 days prior to release. There is a dedicated unit within the Medicaid agency to process these applications. Approval is pended until there is a confirmed release date. Once release is confirmed, enrollment information and the Medicaid card is provided to the facility to give to the individual upon release. Since its initial efforts began, the state has expanded its focus to include women prisoners. Over time, the state plans to expand these efforts to the broader population with mental health and substance abuse needs and eventually to the entire pre-release population. The state recently passed legislation establishes new requirements for Arizona DOC to increase enrollment and care coordination for people transitioning out of prison.7  Arizona also has county-led initiatives to connect individuals to coverage prior to release (Box 3).

Box 3: Connecting Individuals to Coverage in Maricopa County, Arizona

Maricopa County is Arizona’s most populous county and includes the Tucson area. The county is working in partnership with local organizations to connect individuals to Medicaid:

  • Health insurance navigators are placed in the county’s Probation Assessment Centers to provide education and enrollment assistance to individuals eligible for release. Since February 2014, over 1,000 individuals have been enrolled in Medicaid through this pathway.
  • Inmates in the Maricopa County jail ALPHA program also are connected to coverage prior to release. ALPHA is an intensive 16 week substance abuse treatment program that provides transitional planning for integration into the community, including assistance enrolling in Medicaid. Nonprofit health educators educate ALPHA participants on health coverage options and how to use health coverage and provide assistance with completing applications. Since the program began in November 2015, 95 ALPHA participants have qualified for Medicaid upon release.8 

Connecticut has a dedicated Pre-Release Entitlement Unit within the Department of Social Services to facilitate processing of applications prior to release. The positions in the unit are funded through the DOC, the Judicial Branch, and the Department of Mental Health and Addiction Services. The unit works with staff at correctional facilities to expedite processing of applications for people prior to release. These efforts began many years ago with an initial focus on the seriously mentally ill population and have gradually expanded over time. Currently, the goal is to target everyone upon release.

Massachusetts launched a MassHealth/DOC Prison Reintegration Pilot Program beginning in 2015, under which MassHealth, the Medicaid agency, works with the DOC to enroll prisoners into Medicaid prior to their release. Previously, pre-release enrollment efforts within jails occurred on an ad hoc basis, but a statewide approach was launched in 2015. Currently, jails and prisons submit a notification to Medicaid 30 days prior to an individual’s release. If there is a Medicaid application on file from within the past 12 months, eligibility is determined based on that application and a prospective date is established for full Medicaid coverage based on the individual’s expected release date. If an application is not on file, a new application is completed. Some corrections staff have been trained as Certified Application Counselors (CACs) and assist individuals nearing release with completing the application and explaining the benefits.

Enrollment for Individuals in Other Areas of the Justice System

The study states also have initiatives to connect individuals in other areas of the justice system to coverage, including those on probation and parole. Community supervision arrangements account for 70% of the justice-involved population and nearly all jurisdictions have more individuals under community supervision than in jail or prison.9  As such, connections with individuals under community supervision provide important opportunities to enroll individuals into health coverage.  In Connecticut, every person sentenced to probation from court is screened for Medicaid. If they are not already enrolled, a new application is initiated with the probation officer. Once complete, the applications are scanned and sent to DSS, where a dedicated eligibility worker enters them into the system and a determination is made. The Judicial Branch funds one eligibility position at DSS to process these applications. Currently over 400 probation officers are involved in this process. Massachusetts has trained parole officers as CACs, and they assist with completing applications. In addition to enrollment efforts through adult probation offices, Arizona also recently began working to enroll individuals who are awaiting trial into coverage.

Connecting Individuals to Care in the Community

Beyond connecting individuals to coverage, efforts to connect individuals to care in the community upon release are important for supporting their reintegration and enabling them to address their health needs. Each of the three study states has various initiatives underway to establish connections to care in the community.

Arizona

Arizona’s care coordination efforts currently are focused on people with serious mental illness and complex health needs. Beginning as many as 180 days prior to release, a release planner is notified of an individual’s upcoming release. In cases where the individual has a serious mental illness diagnosis, a connection is then established with one of the state’s Regional Behavioral Health Authorities (RBHAs) to initiate the planning and care coordination process. A liaison from the RBHA works with staff at the correctional facility to help ensure the individual completes their Medicaid application as well as a care coordination form that identifies conditions. The RBHA liaison then provides necessary treatment referrals, schedules appointments, and ensures that the individual has a supply of medications upon release. Stakeholders noted that one challenge they face in coordinating care is that correctional facilities are scattered throughout the state, and where an individual is incarcerated may not necessarily be the same area as where they will reside after release. To address this challenge, the state has tried to release individuals with higher needs closer to Phoenix and Tucson, where the majority of the population is concentrated.

Among the broader population being released, individuals are provided a 30 day medication supply. In addition, the pharmacy system will show individuals enrolled in Medicaid prior to release as having active Medicaid coverage within 24-48 hours of release, enabling them to fill prescriptions at community pharmacies if necessary.

Looking ahead, the state plans to have managed care plans play a similar role as the RBHAs in coordinating care for physical health needs. The state is amending contract language with each health plan to require increased care coordination for individuals as they transition out of jails and prisons. Plans will be required to connect with individuals with complex health needs prior to release to establish appointments and connect them to care in the community. The state is also developing plan performance measures in this area. The goal is to have all plans in progress with this effort by October 2016. In addition, the state is working closely with the RBHAs and managed care plans to establish clinics that will be collocated within probation and parole offices.

Connecticut

Beginning 60-90 days prior to release, Discharge Planners begin working with people who have identified physical and mental health needs to coordinate care. Connecticut has implemented a detailed screening process to identify inmates with health issues. Discharge Planners work with individuals who have identified health needs to coordinate medical and mental health appointments, identify community providers, connect individuals to a local community health center, and provide 30-day prescriptions and prescription drug vouchers to ensure they have immediate access to required medications upon release. These discharge planning services are included as part of the contract with the DOC medical care vendor. The contract requires the vendor to have discharge planners in all correctional facilities.

The Department of Public Health also funds a program that provides release planning for people diagnosed with HIV. As part of this program, 90 days prior to release, case managers from outside of the facilities meet with individuals to connect them to care in the community and make sure they will have all their medications available upon release.

Re-entry Counselors work with individuals without identified health needs. Re-Entry Counselors help ensure that individuals have complete Medicaid applications but provide less personalized care coordination than Discharge Planners. For example, they may hold group pre-release planning sessions.

Probation officers also provide health education. Individuals are required to report to their probation officer within ten business days of sentencing if the sentence does not include a term of incarceration, providing an opportunity to discuss health care. In addition to assisting with enrollment if needed, probation officers provide education on the importance of Medicaid coverage and how to use coverage. The probation department developed FAQs to assist with these efforts.

Building off of a pilot that was launched in 2010, individuals are provided a voucher to obtain up to 30 days of prescription drugs from a community pharmacy. This helps ensure that individuals can obtain a supply of medications without being dependent upon what the facility has on hand at the time an individual is released.

Massachusetts

Since 2013, the DOC in Massachusetts has utilized its medical vendor to provide patient education and continuity of care for individuals being released. Re-entry counselors help individuals make appointments with providers, ensure appropriate placements in care facilities as needed, and provide referrals to social services. If individuals already have a provider in the community, re-entry staff help to reconnect them to that provider or similar care. Individuals receive a paper copy of their medical record upon their release. If a community provider needs a copy of a patient’s medical record, the provider can contact DOC and obtain information with the patient’s permission. The state also provides individuals with a supply of medication upon release and a prescription. In addition, the state has a Recovery Support Navigator program designed to help address the opioid epidemic by providing targeted care coordination assistance to people with substance use disorders as they transition back to the community (Box 4).

Box 4: Recovery Support Navigator Program in Massachusetts

Originally funded through a grant from the state Attorney General’s Office and expanded through the Massachusetts Bureau of Substance Abuse Services, Massachusetts provides reentry support for individuals receiving Medication Assisted Treatment (MAT) for substance use. The program matches individuals preparing for release from state prison with Recovery Support Navigators, who are trained to provide non-clinical peer support services. The Navigator ensures that the person connects with an outpatient treatment program within 24 hours of release and maintains contact for a year to provide ongoing support. Since it began two years ago, the program has enrolled 229 participants, exceeding its initial goal of 150 enrollees. More than 100 participants have accessed MAT in the community and 100% report having had all their reentry needs addressed through this program.10 

Experiences to Date and Lessons Learned

Impacts on Individuals, Administration, and Budgets

The study states’ enrollment efforts have increased coverage among individuals moving into and out of the justice system. Facilitating enrollment through multiple pathways is key for reaching people at different points within the justice system, including when they enter the system, during incarceration, prior to release, and when under community supervision. Connecticut reports that about 60% of the incarcerated population is enrolled in Medicaid upon release, either through reinstatement of suspended coverage or through the pre-release enrollment process. In Massachusetts, over 70% of individuals released from prison in Fiscal Year 2015 had a MassHealth application submitted, and over three-quarters of submitted applications were approved.11  (Most individuals who did not have an application submitted were already enrolled.) Arizona’s enrollment efforts have reached a smaller share of the total incarcerated population, since they have been targeted to those with serious mental illness and complex health needs. The state plans to expand enrollment efforts to the broader incarcerated population, including individuals with a substance use disorder. However, as the state broadens its focus, the volume of individuals to reach may be challenging since approximately 120,000 inmates are released each year from county jails and state prisons. To expand its capacity to reach individuals, the state is making changes to its eligibility system to support more pre-release applications being submitted online. In addition, because of the state’s robust suspension process, there are fewer individuals that need to be newly enrolled prior to release.

Anecdotal experiences and data suggest that the study states’ initiatives have facilitated access to care for individuals as they transition back to the community. Stakeholders reported that coverage and care coordination initiatives support greater access to health services in the community for newly released individuals, particularly with respect to behavioral health services. Research from Connecticut found that individuals who were enrolled in Medicaid prior to release connected to outpatient care more quickly than those that were not pre-enrolled.12  They also used more outpatient care and had reduced use of inpatient care.13  However, there were no significant differences in their number of visits to the emergency room, and they were more likely to use the emergency room than those that were not pre-enrolled.14  Data from Massachusetts show that, among former prisoners that had Medicaid coverage in the year after their release, 84% used any covered service, including nearly half (47%) who had a behavioral health visit.15  Moreover, more than half of those who had a medical or behavioral health visit were seen within the first 60 days post release.16 

The enrollment initiatives have contributed to gains in administrative efficiencies and state savings. In Arizona, implementation of suspension policies reduced state costs by avoiding capitation payments to managed care plans while individuals are incarcerated.  The state reports $30 million in avoided capitation payments in Fiscal Year 2015. In Massachusetts, the jails and prisons have realized savings as a result of receiving federal Medicaid funds for inpatient care provided to incarcerated individuals. The state DOC estimates that, since it initiated these efforts in July 2015, it has offset more than $4.2 million in costs for inpatient care provided to prisoners at private hospitals. Massachusetts anticipates that these savings will continue to increase, since the state will soon begin to claim reimbursement for inpatient care provided in the state hospital that serves a large share of inmates. In Connecticut, gains in Medicaid coverage among the probation population have led to savings for the state’s Judicial Branch, allowing them to increase capacity of other services that do not qualify for Medicaid reimbursement. Stakeholders in the study states also pointed to administrative savings and efficiencies. For example, they indicated that suspension policies have reduced the volume of applications that need to be processed for individuals who receive inpatient care while incarcerated as well as prior to release.

There remains very limited data how these efforts impact criminal justice outcomes, including recidivism rates. Research in Connecticut found that individuals enrolled in Medicaid prior to release had more days in the community prior to re-incarceration compared to those that were not pre-enrolled. However, overall, there is a lack of data on the impact of these initiatives on criminal justice outcomes. Stakeholders universally agreed that more research is needed for increased understanding of how connections to coverage and care among this population are impacting their health and broader criminal justice outcomes, including recidivism rates, over time.

Remaining Enrollment and Access Barriers

Even with multiple enrollment efforts in place, some subsets of individuals remain difficult to reach. In particular, stakeholders commented that it is difficult to reach the jail population because a large share of the population moves in and out of custody quickly and their release dates are often unpredictable. Stakeholders in Massachusetts indicate that working with the parole board is helpful for reaching cases in which there is a quick turnaround and the facility does not have adequate time to assist the individual with enrollment before release.

System limitations remain a key challenge to enrollment efforts. Although states have significantly upgraded or launched new modernized Medicaid eligibility systems as part of implementation of the ACA, due to coding and other system limitations, the three study states rely on workarounds or manual processes for some of their enrollment efforts targeted to justice-involved populations. For example, all three case study states primarily rely on paper applications for pre-release enrollment efforts. In addition, some of the smaller counties in Arizona have not implemented suspension due to limits in their system functionalities that would make it difficult to transfer information to Medicaid. Moreover, Connecticut and Massachusetts use manual processes to reactivate people from suspension status upon release. Because of the manual process, there are some cases in which individuals are released without their coverage being reactivated. The states are planning for continued system modifications to make the pre-release enrollment efforts and suspense processes more automated in the future.

Establishing connections with individuals early is key for facilitating connections to community care, but individuals face a range of challenges to accessing care even with support. All three study states initiate care coordination efforts prior to individuals being released back to the community. However, stakeholders noted that individuals face many barriers to care even with this support. They indicated that health care is one of many competing priorities for newly released individuals. They often have many requirements to meet associated with parole/probation and more pressing needs that take priority over health care. Stakeholders stressed the importance of meeting people where they are to address their priority needs and recognizing that health care is one piece of interrelated issues, including housing, food, and employment. Stakeholders also pointed to the importance of finding culturally competent providers in the community and noted that discrimination among providers against people with a criminal history can present a barrier to care. Community health workers with a shared history of incarceration can play a key role in overcoming these barriers, as seen in the Transitions Clinic program, which has two locations in Connecticut (Box 5).

Box 5: Using Community Health Workers to Overcome Barriers to Access to Care at the Transitions Clinics in Connecticut

The Transitions Clinic Network (TCN) is a national network of medical homes for individuals with chronic diseases recently released from prison. The network is comprised of 14 clinics in several states, including 2 locations in Connecticut. Each clinic that adopts the Transitions Clinic Program employs a community health worker with a history of incarceration as part of the clinical team. This shared history facilitates their ability to develop trusted relationship with individuals that are reentering the community. The community health workers establish connections with individuals prior to release to initiate initial appointments at the clinic and play a key role as part of the health care team post-release by helping individuals engage in health care services and connect to broader supports to address social determinants of health.

Sharing information between jails and prisons and community providers remains a challenge, but the study states are working to improve this coordination. Stakeholders noted that continued reliance on paper processes and medical charts limits the ability to share information from jails and prisons to community providers. For example, in Connecticut, the DOC utilizes a paper chart and medical records often do not get passed on to community providers. The DOC recently purchased an electronic health record and is currently in the design phase of implementation. Similarly, work is underway in Arizona to connect the DOC and jails to the state’s health information exchange, and the DOC recently implemented an electronic health record.

Operations and Implementation

Approaches and challenges vary based on the structure and organization of the state correctional system. For example, Connecticut has a unified state correctional system in which the state oversees both the state prisons and jails. As such, the state can implement statewide approaches that will reach all of its state prisons and jails through a single agency. In contrast, Arizona and Massachusetts have state run prisons, but the jails are overseen at the county level. As such statewide initiatives in these states require coordination across counties. Moreover, the organizational relationship across the state agencies, including DOC and jail systems, Medicaid, Departments of Health and mental health agencies also varies across states and impacts how states approach enrollment and care connection efforts.

Initiatives in the study states started with a focus on targeted, high-need populations and have gradually expanded over time. For example, Arizona began its efforts focused on the seriously mentally ill population and individuals with complex health needs and has expanded to broader populations over time. Similarly, Connecticut’s efforts began back in the early 2000’s under a federally-funded grant that supported work by the mental health agency and Medicaid agency to connect individuals with serious mental illness to coverage and have broadened significantly over time. Massachusetts’ work in this area began as a small pilot program to keep people connected to coverage and has expanded to a statewide effort. Stakeholders indicated that starting with smaller, focused efforts provided an opportunity to launch initiatives with more limited staff and financial resources and to work through challenges before broadening the scope of efforts and investment of resources.

Leadership and collaboration is key for supporting successful initiatives. Stakeholders unanimously pointed to the importance of strong leadership for driving policy, process, and operational changes to support these efforts. For example, Arizona selected justice as one of three topic areas for its Statewide Innovation Model grant, which has helped raised the profile of the state’s work in this area. In addition, the Governor announced in his “State of the State” address that reducing recidivism is one of his key priorities for the year. In Massachusetts, the Governor and legislative leaders formed a bipartisan working group to explore criminal justice policy reform. Stakeholders also consistently stressed the need for vested interest and commitment from both the Medicaid and Corrections side and the importance of sharing resources across agencies. A strong partnership between the DOC and the state Medicaid agency was consistently noted as key element of each of the study states’ successes.

Consistent and clear communication among stakeholders were also cited as important components of success. In Massachusetts, a statewide task force was established that brought together Medicaid, DOC, and the jails. Stakeholders noted that having the Medicaid agency convene with the jails was key for understanding each jail’s processes and operations and establishing processes that would work within each facility. Connecticut held re-entry roundtables around the state, in which eligibility specialists, discharge planners, community providers and other stakeholders came together to share lessons learned and improve processes. In Arizona, a statewide criminal justice stakeholder group with over 50 participants across the continuum of health and justice meets on a quarterly basis. Stakeholders also pointed to the importance of documenting everyone’s role through written agreements. In Arizona suspension policies are established through Memoranda of Understandings between Medicaid and each county jail, the ADJC, and the Arizona DOC that clarify roles and responsibilities. Similarly, in Connecticut, written agreements are in place between each involved agency that document roles, responsibilities, and funding of positions.

Recognizing that this is a long-term effort is important for maintaining ongoing support. Stakeholders noted that these are complex initiatives that require coordination across multiple agencies as well as system upgrades and modifications to facilitate new processes. They noted it is important to enter into these efforts recognizing that success does not happen overnight and sometimes multiple approaches are needed to address the many moving parts of the system.

Conclusion

The three case study states profiled in this brief have achieved success enrolling individuals involved with the justice system into Medicaid and facilitating their connections to care in the community, particularly for individuals with significant health needs. Supported by strong leadership, commitment, and close collaboration across agencies, the initiatives in these states have led to increased coverage, facilitated access to care, and contributed to gains in administrative efficiencies and state savings. However, more research is needed to understand effects on broader criminal justice outcomes, including recidivism rates. Even with these successful efforts, there remain barriers to enrollment and access among the justice-involved population. The study states are working to address many of these barriers as they continue to expand and refine their efforts moving forward.

This brief was prepared by Jennifer Ryan, Lucy Pagel and Katy Smali with Harbage Consulting and Samantha Artiga, Robin Rudowitz and Alexandra Gates with the Kaiser Family Foundation. The authors extend their appreciation to all the participants for sharing their time and perspectives to inform this project.

Endnotes

  1. National Institute of Corrections, “Solicitation for a Cooperative Agreement—Evaluating Early Access to Medicaid as a Reentry Strategy,” Federal Register 76, no. 129 (2011): 39438-39443; Ingrid Binswanger, Nicole Redmiond, and LeRoi Hicks, “Health Disparities and the Criminal Justice System: An Agenda for Further Research and Action,” Journal of Urban Health 89, no. 1 (2012): 98–107; and Laura Maruschak, Medical Problems of Prisoners (Washington, DC: US Department of Justice, Office of Justice Programs, Bureau of Justice Statistics, April 2008), http://www.bjs.gov/content/pub/pdf/mpp.pdf. ↩︎
  2. Doris James and Lauren Glaze, Mental Health Problems of Prison and Jail Inmates, (Washington, DC: US Department of Justice, Office of Justice Programs, Bureau of Justice Statistics, September 2006), http://www.bjs.gov/content/pub/pdf/mhppji.pdf ↩︎
  3. Centers for Medicare and Medicaid Services, To facilitate successful re-entry for individuals transitioning from incarceration to their communities, State Health Official Letter SHO #16-007, (Baltimore, MD: Centers for Medicare and Medicaid Services, April 2016),  https://www.medicaid.gov/federal-policy-guidance/downloads/sho16007.pdf ↩︎
  4. Catherin McKee, Sarah Somers, Samantha Artiga, and Alexandra Gates, State Medicaid Eligibility Policies for Individuals Moving Into and Out of Incarceration, (Washington, DC: Kaiser Commission on Medicaid and the Uninsured, August 2016), https://modern.kff.org/report-section/state-medicaid-eligibility-policies-for-individuals-moving-into-and-out-of-incarceration-issue-brief/ ↩︎
  5. Unpublished data from a national survey conducted by the Kaiser Commission on Medicaid and the Uninsured with the Georgetown University Center for Children and Families, 2016. ↩︎
  6. Governor Cuomo Marks National Re-Entry Week by Seeking to Expand Medical Coverage for Individuals Leaving Incarceration, (Albany, NY: New York Governor’s Office, April 2016), https://www.governor.ny.gov/news/governor-cuomo-marks-national-re-entry-week-seeking-expand-medical-coverage-individuals-leaving and, Maryland HealthChoice Section 1115 Waiver Renewal Application, (Baltimore, MD: Maryland Department of Health and Mental Hygiene), https://mmcp.dhmh.maryland.gov/Documents/1115%20HealthChoice%20Waiver%20Final%20Draft%20V2%204.29.16.pdf ↩︎
  7. HB2701, Budget Reconciliation 2016-2017, (Arizona 2016) http://www.azleg.gov/DocumentsForBill.asp?Bill_Number=hb2701&Session_Id=115 ↩︎
  8. County partners with state, nonprofits to help inmates get care before release, Mesa Independent, March 31, 2016, http://mesaindependent.com/maricopa-county/maricopa-county-helping-inmates-get-health-care-before-release/ ↩︎
  9. Danielle Kaeble, Lauren Glaze, Anastasios Tsoutis, and Todd Minton, Correctional Populations in the United States, 2014 (Washington, DC: U.S. Department of Justice, January 2016), http://www.bjs.gov/content/pub/pdf/cpus14.pdf. ↩︎
  10. Spectrum’s Recovery Support Navigator Program Changes Lives, Spectrum Health Systems, March 2016, http://www.spectrumhealthsystems.org/2015/spectrum-s-recovery-support-navigator-program-changes-lives ↩︎
  11. Massachusetts Department of Correction Performance and Outcome Measurements, Fiscal Year 2015. ↩︎
  12. Hsiu-Ju Lin, Linda Frisman, and Coleen Gallagher, Expedited Medicaid Restoration in Connecticut, American Public Health Association Annual Meeting, Boston, MA, November 2013. ↩︎
  13. Ibid. ↩︎
  14. Ibid. ↩︎
  15. Paul Kirby, Warren Ferguson, and Ann Lawthers, Post-Release MassHealth Utilization, Center for Health Policy and Research, University of Massachusetts Medical School. ↩︎
  16. Ibid. ↩︎

Puerto Rico: Datos Básicos

Published: May 26, 2016
Indicadores seleccionados sobre Puerto Rico, comparados con los 50 estados y DC
 Puerto Rico50 estados y DC
Población total (2014)1 3,522,000314,896,000
Cambio porcentual desde 20062 -10%+7%
Características demográficas (2014)3 
Ciudadanos nacidos en EE.UU.97%87%
Identficados como hispanos99%17%
Mayores de 65 años17%14%
Por debajo del 100% FPL46%15%
Cobertura de salud (2014)4 
Cubiertos por ESI/Compra directa34%59%
Cubiertos por Medicaid/CHIP49%19%
Cubiertos por Medicare o Military11%10%
Sin seguro6%12%
Estadísticas económicas
Ingreso medio del hogar (2014)$18,9285 $53,6576 
Tasa de desempleo ajustada estacionalmente (marzo 2016)7 12%5%
Estadísticas de salud
Adultos que reportan en general buena/pobre salud (2014)8 35%18%
Casos de enfermedad por el virus del zika adquiridos localmente (desde mayo de 2016)9 6690
Tasa de diagnósticos de VIH por cada 100,000 habitantes (2014)10 22.716.5
Tasa de mortalidad infantil por cada 100,000 niños nacidos vivos (2013)11 7.16.0
Reglas federales del Medicaid12 
Tasa de participación federalFijada al 55%Rangos de 50 al 83% basados en el ingreso per cápita en el estado
Fondos federales

Limitados a $321 millones en el año fiscal 2014

Sin límites
  • Puerto Rico, un territorio de Estados Unidos, está ubicado en el Caribe. Los puertorriqueños son ciudadanos nacidos en Estados Unidos.
  • Las deudas de Puerto Rico ascienden a $73 mil millones, o aproximadamente 2.5 veces el tamaño del presupuesto para el año fiscal 2016 propuesto por el gobernador.13  Un proyecto de ley está pendiente en el Congreso de Estados Unidos para reestructurar la deuda de Puerto Rico.
  • El Affordable Care Act (ACA) proveyó a Puerto Rico de dos fuentes de fondos para el Medicaid además de la asignación anual cubierta. La primera es una asignación de $5.5 mil millones para usar entre 2011 y 2019. En el año fiscal 2014, los fondos del ACA representaron el 71% del total de la financiación del Medicaid para el territorio, y Puerto Rico había usado 42% de los $5.5 mil millones. La segunda fuente de fondos es una asignación de $925 millones que la isla recibió en lugar de crear su propio mercado de seguros. Estos fondos están disponibles hasta el año fiscal 2019, después que los $5.5 mil millones se hayan agotado.14 
  • El zika plantea un reto de salud pública, y financiero, para Puerto Rico. El número de casos ha aumentado de forma constante desde que se confirmara el primero en la isla en diciembre de 2015.15 
  • La crisis financiera de Puerto Rico ha añadido presión a un sistema de atención de salud ya tenso. Los informes noticiosos describen la escasez de electricidad y agua en hospitales, retrasos en el acceso a los suministros críticos, y la emigración de los médicos.16 ,17 ,18 
  1. Kaiser Family Foundation analysis of U.S. Census Bureau, 2014 American Community Survey, 1-Year estimates. ↩︎
  2. Kaiser Family Foundation analysis of U.S. Census Bureau, 2006 and 2014 American Community Survey, 1-Year estimates. ↩︎
  3. Kaiser Family Foundation analysis of U.S. Census Bureau, 2014 American Community Survey, 1-Year estimates. ↩︎
  4. Ibid. ↩︎
  5. U.S. Census Bureau; American Community Survey, 2014 American Community Survey 1-Year Estimates, Table S1903; generated by Alexandra Gates and Melissa Majerol; using American FactFinder; http://factfinder2.census.gov; (16 February 2016). ↩︎
  6. Ibid. ↩︎
  7. Bureau of Labor Statistics, “Regional and State Employment and Unemployment,” March 2016, http://www.bls.gov/news.release/laus.toc.htm. ↩︎
  8. KFF analysis of CDC, Behavioral Risk Factor Surveillance System, 2014. ↩︎
  9. CDC, Zika virus disease in the United States, 2015-2016, as of May 11, 2016, http://www.cdc.gov/zika/geo/united-states.html. ↩︎
  10. CDC, National Center for HIV/AIDS, Viral Hepatitis, STD, and TB Prevention (NCHHSTP) Atlas, 2014. ↩︎
  11. Mathews TJ, MacDorman MF, Thoma ME, Infant Mortality Statistics from the 2013 period linked birth/infant death data set. National vital statistics reports; vol 64 no 9. Hyatsville, MD: National Center for Health Statistics, 2015. ↩︎
  12. Congressional Research Service, “Puerto Rico and Health Care Finance: Frequently Asked Questions,” Feb 2016. ↩︎
  13. The Governor’s proposed buget for all funds in FY 2016 was $28.8 billion.  For more information see the Governor’s budget at: Commonwealth of Puerto Rico Office of Management and Budget, Proposed 2015-2016, http://www2.pr.gov/presupuestos/presupuesto2015-2016/Pages/default.aspx. ↩︎
  14. Congressional Research Service, “Puerto Rico and Health Care Finance: Frequently Asked Questions,” Feb 2016. ↩︎
  15. CDC, Zika virus disease in the United States, 2015-2016, as of May 11, 2016, http://www.cdc.gov/zika/geo/united-states.html. ↩︎
  16. Vann R. Newkirk II, “Will Puerto Rico’s Debt Crisis Spark a Humanitarian Disaster?” The Atlantic, (May 9, 2016), http://www.theatlantic.com/politics/archive/2016/05/puerto-rico-treasury-visit/482562/. ↩︎
  17. Lizette Alvarez and Abby Goodnough, “Puerto Ricans Brace for Crisis in Health Care,” New York Times (August 2, 2015), http://www.nytimes.com/2015/08/03/us/health-providers-brace-for-more-cuts-to-medicare-in-puerto-rico.html. ↩︎
  18. Nick Timiraos, “Treasury Secretary Jacob Lew Tours Puerto Rico to Urge Action in Congress,” Wall Street Journal (May 9, 2016), http://www.wsj.com/articles/treasury-secretary-jacob-lew-tours-puerto-rico-to-urge-action-in-congress-1462814534. ↩︎