Medicaid Payment Transparency Rules: State Reporting Requirements and Limitations
States have substantial flexibility in setting Medicaid payment rates, which can affect provider participation in Medicaid and enrollee access to care. Previous research found that Medicaid fees for selected physician services were about 75% of Medicare fees and that physicians were much less likely to accept new patients insured by Medicaid than those with other coverage. However, information about Medicaid payment rates has been limited. Greater transparency could make it easier to compare Medicaid rates across states and payers and help inform payment decisions aimed at supporting provider participation and enrollee access to care. These goals differ somewhat from broader federal policy debates that aim to make health care prices more visible to consumers, researchers, and policymakers in an effort to reduce overall costs to consumers. Medicaid already has significant out-of-pocket protections for enrollees given their low incomes.
In 2024, the Centers for Medicare & Medicaid Services (CMS) finalized new transparency provisions for Medicaid fee-for-service (FFS) and separate requirements for managed care. The requirements differ because under FFS, states directly pay providers for services rendered, whereas under managed care, states pay a health plan or managed care organization (MCO) to deliver services and the MCO establishes payment rates for providers. In fiscal year (FY) 2024, 42% of Medicaid spending was paid through FFS and 53% was paid through managed care. As some provisions of the FFS rule go into effect, CMS has provided additional guidance to states on implementing FFS requirements, including specifications for conducting the comparative rate analysis. The FFS reporting requirements took effect in July 2026, meaning that data are now available online.
This brief describes the transparency requirements that took effect in July 2026, uses T-MSIS data to assess the share of FFS spending and claims captured by certain reporting requirements, and discusses limitations of the new transparency requirements. This brief lays the groundwork for future KFF analyses of Medicaid provider payment rates and how those rates may compare to Medicare. Key takeaways include:
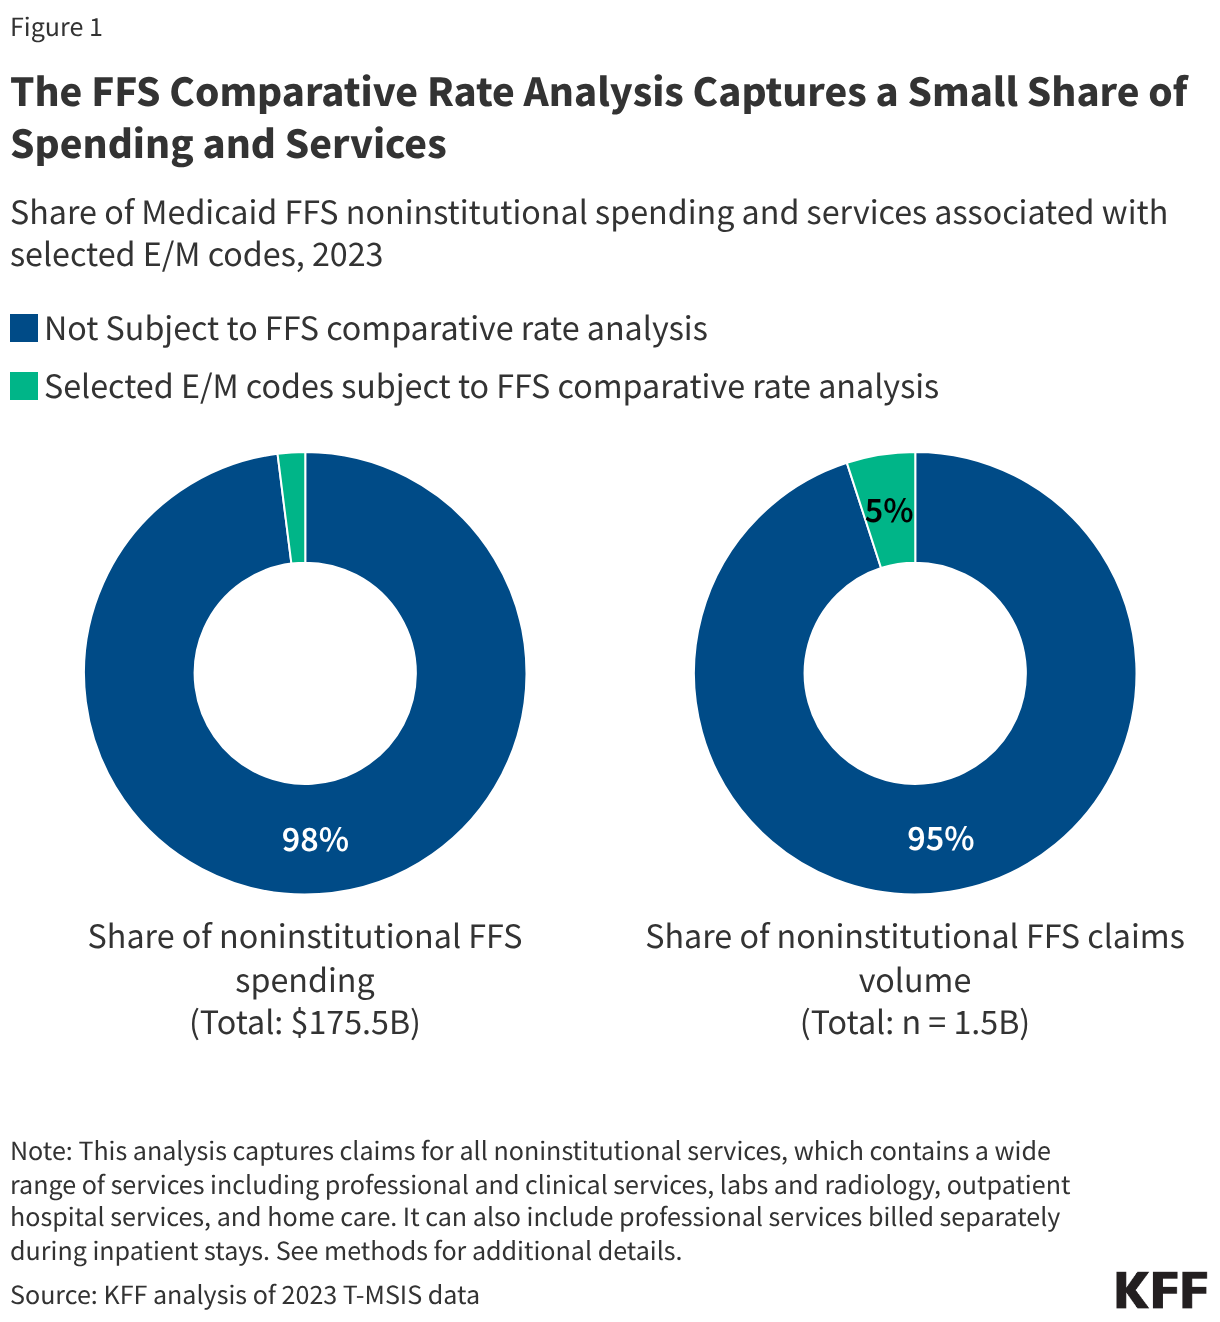
- To help states implement the new payment transparency requirements, CMS specified 68 billing codes that states must use to compare Medicaid FFS rates to Medicare; however, those codes account for a small share of spending (2% of noninstitutional FFS spending) and number of services delivered (5% of noninstitutional FFS claims or services delivered). In addition to capturing a narrow set of services, it may be challenging to compare Medicaid rates to Medicare for certain services and populations, and the value of the information will vary by state based on which delivery systems they use and the extent to which FFS payment rates govern the rates paid by MCOs.
- States also report more comprehensive lists of payment rates. Differences in reporting practices and variation in rates by population and geographic area can make it difficult to compare comprehensive payment rates across states, including for the narrower set of services covered by the Medicaid-to-Medicare comparative analyses.
What are the new payment transparency rules for Medicaid?
States have substantial flexibility to set Medicaid provider payment methods and rates, particularly under FFS, where state Medicaid agencies pay providers directly. The 2024 Access rule established new FFS payment transparency requirements. The rule also included payment transparency requirements for certain long-term care services, while a separate 2024 rule established managed care payment transparency requirements. The long-term care and managed care provisions are outside the scope of this analysis.
Box 1. Key Medicaid Payment Transparency Requirements.
The Ensuring Access to Medicaid Services final rule (Access rule) and the Medicaid and CHIP Managed Care Access, Finance, and Quality final rule (Managed care rule) made substantial changes to the regulations governing Medicaid, including new requirements for states to provide information about Medicaid payment rates. Key requirements include:
Conduct comparative rate analyses. Under the fee-for-service (FFS) Access rule, states must use select codes to compare their FFS payment rates for primary care, obstetrical and gynecological care, and outpatient mental health and substance use disorder services to Medicare rates, and publish the analysis every two years, with the first analysis published by July 1, 2026.
Publish fee schedules. Under the FFS Access rule, states must publish all FFS rates on a publicly available and accessible website and make updates within one month of a payment rate change. This provision went into effect July 1, 2026. This includes applicable FFS rates for inpatient hospital services, outpatient services, and nursing facility services.
Disclose payment rates for home care. Under the FFS Access rule, states must publish the average hourly rate paid for personal care, home health aide, homemaker, and habilitation services, starting on July 1, 2026, and publish the disclosure every two years.
Require states to submit annual payment analysis. Under the managed care rule, states submit an annual analysis comparing managed care plans’ payments for certain services to Medicare rates and comparing certain home care rates to state FFS payment rates using paid claims data from the plans. The requirement applies to managed care rating periods beginning on or after July 9, 2026, with states submitting the analyses six months after the applicable rating period ends in their Network Adequacy and Access Assurances Reports. Reports submitted on or after January 1, 2028 must include the new analyses.
CMS specified 68 evaluation and management (E/M) billing codes that states must use for the FFS comparative rate analysis. The E/M codes cover office visits and other services involving the evaluation and management of patients and may be used for primary care, obstetrical and gynecological care, and outpatient mental health and substance use disorder services. Starting in July 2026, and every two years thereafter, states must report FFS rates for each code and show rates that vary by provider type, geographic area, or population. States must compare each Medicaid rate with the corresponding Medicare rate and report the Medicaid-to-Medicare payment ratio. All E/M codes required by CMS have a Medicare established payment rate, but some may have limited or no Medicare coverage. This may be particularly common for codes that are seldom used in Medicare, such as services for children.
The fee schedule requirement applies broadly to FFS payment rates, but CMS does not prescribe a standard format for posting the information. States were required to post most FFS payment rates on publicly accessible state websites by July 1, 2026. CMS does not prescribe a standard format, which may result in variation in the presentation and organization of those rates.
What share of Medicaid FFS spending and claims will be affected by the rules?
The FFS comparative rate analysis captures a small share of spending and claims: 2% of noninstitutional FFS spending and 5% of noninstitutional claims (Figure 1). The estimates included in this analysis use Medicaid claims from noninstitutional services, which encompasses a wide range of services including professional and clinical services, labs and radiology, outpatient hospital services, and home care. It can also include professional services billed separately during inpatient stays.
Which Medicaid enrollees are most likely to use services subject to the transparency requirements?
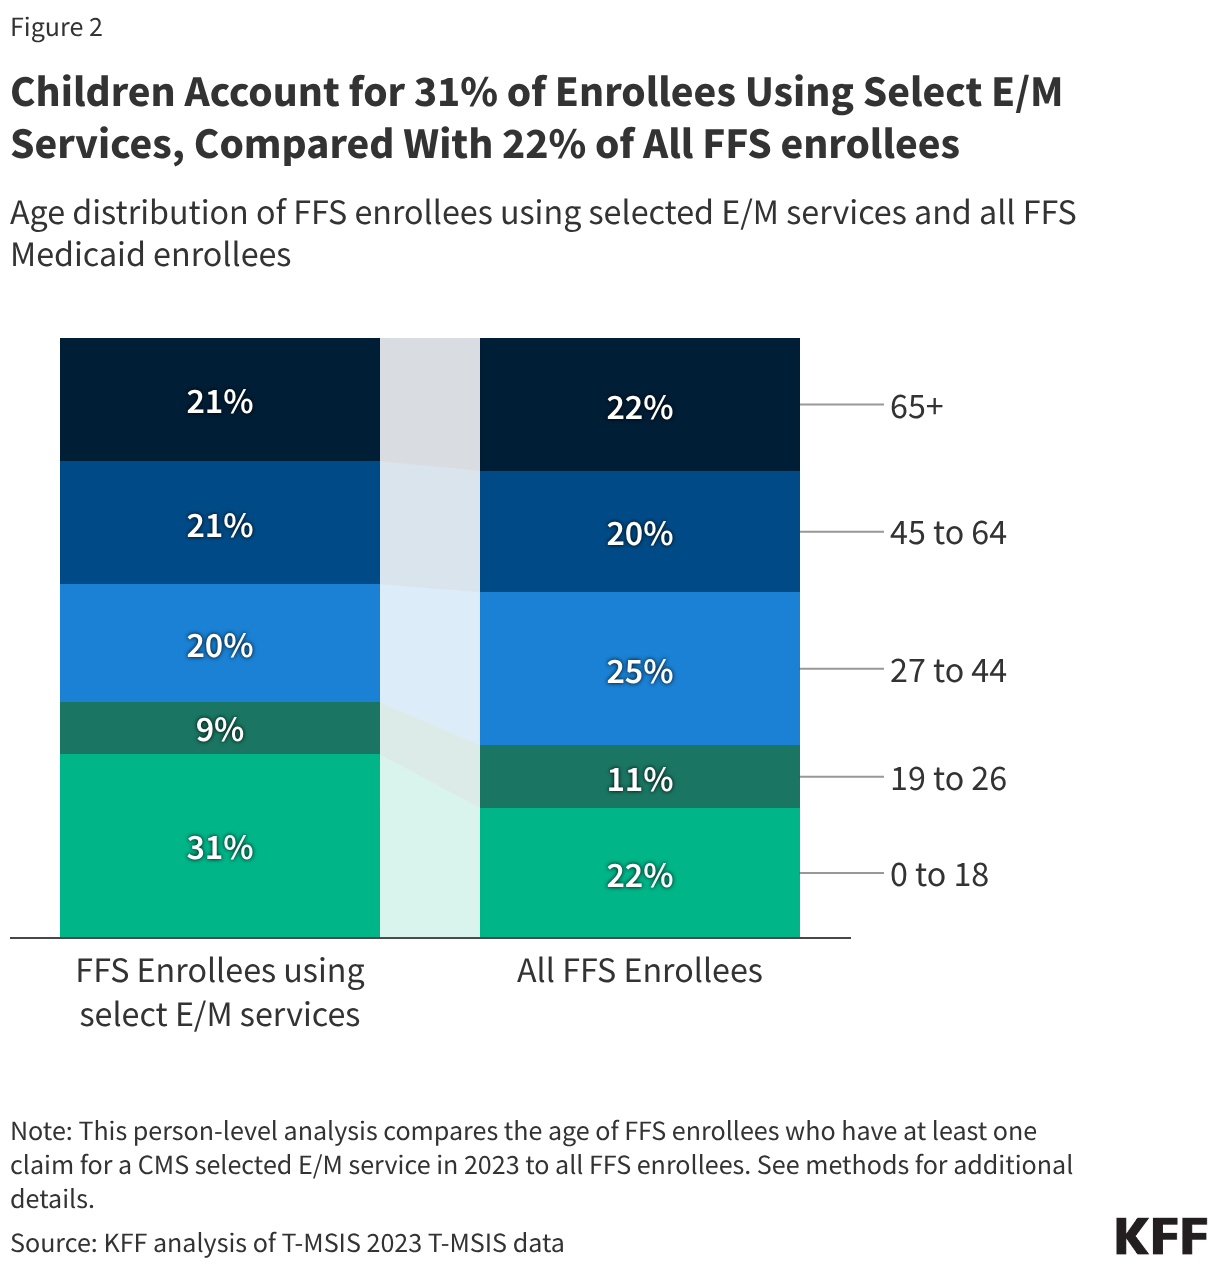
Children account for 31% of enrollees using selected E/M services, compared with 22% of all FFS enrollees (Figure 2). This difference may partly reflect that the analysis includes E/M codes that are commonly used for pediatric well-child and sick visits. Enrollees with chronic conditions are also overrepresented. Approximately 66% of those using the selected services had at least one chronic condition, compared with about 35% of the overall FFS population, likely reflecting their greater use of health care services (data not shown).
What are the limitations?
The comparative rate analysis provides a more consistent basis for comparing rates across states, but it captures a narrow set of services and has some limitations. By requiring states to report rates for the same services and characteristics relative to Medicare, it allows for more consistent comparisons across states. However, the selected E/M service codes account for only 5% of FFS noninstitutional claims, leaving 95% outside the standardized comparisons with Medicare. Comparisons may also be complicated by differences in how states set payment rates, including variation by population or geographic area. In addition, in some states, certain provider types may not bill with E/M codes, such as psychologists, social workers, and counselors.
It may be challenging to compare Medicaid rates to Medicare for certain services and populations. The intent of the comparative rate analysis was to provide transparency into how FFS rates for primary care, obstetrical and gynecological care, and outpatient mental health and substance use disorder services compare to Medicare rates. However, Medicare may be a less meaningful benchmark for populations and services with limited Medicare coverage, such as children and well-child visits.
The fee schedule requirement is broader, but the published information is not standardized, making comparisons more challenging. Requiring states to post all FFS rates may improve access to payment information. However, differences in how states organize fee schedules and structure their payments may make comparisons with Medicare or other states difficult and time-consuming. For example, Rhode Island and Virginia provide searchable databases, while some other states, such as Nebraska, Washington, and Kentucky, post downloadable fee schedules, which can be in different formats–PDF, excel, or both. States also differ in how they show rates across provider type and geography, and in whether they centralize fee schedules on one page or provide links to multiple web pages.
The usefulness of the FFS payment transparency information will vary by state based on which delivery systems they use and the extent to which FFS payment rates govern the rates paid by MCOs. In states that rely primarily on FFS or use a mix of FFS and managed care, the disclosed rates apply to a larger share of Medicaid services. In states that rely primarily on managed care, FFS rates may apply to relatively few services and provide a less complete picture of provider payment levels overall. The information will also be useful in states that rely heavily on managed care if the FFS payment rates serve as benchmarks for MCO payments.
Methods
Medicaid Claims Data: This analysis used the 2023 T-MSIS Research Identifiable Files, including the other services (OT) line and header files and the demographic and eligibility (DE) files. The OT file captures claims for all noninstitutional services, which encompasses a wide range of services including professional and clinical services, labs and radiology, outpatient hospital services, and home care. It also includes professional services billed separately during inpatient stays. The analysis includes Medicaid and Medicaid-CHIP (M-CHIP) enrollees and excludes Separate CHIP (S-CHIP), which was identified using CHIP_CD_01-CHIP_CD_12 = 2, 3, 4, or missing and ELGBLTY_GRP_CD_01-ELGBLTY_GRP_CD_12 = 61-68.
State Exclusion Criteria: Illinois was excluded due to a known issue with duplicate lines in the OT line file. In addition, the DQ Atlas also reported unusable procedure codes for the “OT institutional files” for this state.
Defining Fee-for-Service (FFS) Medicaid: The analysis defines claims as FFS if the T-MSIS claim type code of 1 (CLM_TYPE_CD=1). The analysis identifies FFS enrollees as people with zero months of comprehensive managed care enrollment. To determine enrollment in comprehensive MCOs, enrollment was limited to plans from the list MC_PLAN_ID_01_MM-MC_PLAN_ID_16_MM from the Managed Care Participation segment of the T-MSIS eligibility file which also has a positive capitated payment to a plan on behalf of the enrollee in the month (MM) in the T-MSIS Other Services (OT) file. This analysis calculated positive capitated payment to a plan on behalf of the enrollee in a month by summing the MDCD_PD_AMT for claims with CLM_TYPE_CD = 2 (Medicaid or Medicaid-expansion Capitated Payment) having a SRVC_END_DT in the month in 2023. Capitated payments were attributed to a specific plan using the MC_PLAN_ID from the OT file.
Share of Spending and Service Volume Associated with Selected E/M Codes: To estimate the share of FFS spending associated with CMS selected evaluation and management (E/M) codes for the FFS comparative rate analysis, the analysis sums Medicaid payment amounts at the line (LINE_MDCD_PD_AMT) for FFS lines with a selected E/M code and divides this amount by payments for all FFS lines in the OT file. To estimate the share of FFS service use associated with CMS selected evaluation and management codes (E/M) codes for the FFS comparative rate analysis, the analysis sums the number of FFS service lines with a selected E/M code and divides it by the total number of FFS OT service lines .