Medicaid Enrollment & Spending Growth: FY 2021 & 2022
Issue Brief
Key Takeaways
In March 2020, the COVID-19 pandemic generated both a public health crisis and an economic crisis, with major implications for Medicaid – a countercyclical program – and its beneficiaries. During economic downturns, more people enroll in Medicaid, increasing program spending at the same time state tax revenues may be falling. While state revenues have substantially rebounded after dropping precipitously at the onset of the pandemic, the public health crisis has continued as a new surge of COVID-19 infections, hospitalizations, and deaths, fueled by the Delta variant, began to take hold in the U.S. in late July and August 2021. To support Medicaid and provide broad state fiscal relief, the Families First Coronavirus Response Act (FFCRA), enacted in March 2020, authorized a 6.2 percentage point increase in the federal Medicaid matching rate (“FMAP”) (retroactive to January 1, 2020) if states meet certain “maintenance of eligibility” (MOE) requirements. Since then, the MOE requirements and temporary FMAP increase have been the primary drivers of Medicaid enrollment and spending trends. The fiscal relief and the MOE requirements are tied to the duration of the public health emergency (PHE).
This brief analyzes Medicaid enrollment and spending trends for state fiscal year (FY) 2021 and FY 2022 (which for most states began on July 1)1 based on data provided by state Medicaid directors as part of the 21st annual survey of Medicaid directors in states and the District of Columbia. Forty-seven states2 responded to the survey by mid-September 2021, although response rates for specific questions varied. In their survey responses, most states anticipated that the fiscal relief and MOE would end in December 2021 and that had major implications for enrollment and spending projections. The PHE was recently extended to mid-January 2022, which would affect these projections and possibly delay anticipated effects of slowing enrollment and spending currently assumed in state budgets for FY 2022. The methodology used to calculate enrollment and spending growth and additional information about Medicaid financing can be found at the end of the brief. Key survey findings include the following:
- Enrollment growth: After increasing sharply in FY 2021 (10.3%) due to the MOE requirements and the pandemic’s economic effects, responding states expect Medicaid enrollment growth to slow to 4.5% in FY 2022, based largely on the assumption that the PHE and the related FFCRA MOE requirements will end in FY 2022 (most states assume mid-way through FY 2022).
- Total spending growth: FY 2022 state budgets for responding states assume total Medicaid spending growth will slow to 7.3% compared to 11.4% in FY 2021. States identified enrollment growth as the primary driver of FY 2021 expenditure growth and assume slower enrollment growth will result in lower total spending growth in FY 2022.
- State spending growth: While states reported that the state (nonfederal) share of Medicaid spending grew by 4.0% in FY 2021, they projected sharper FY 2022 growth of 14.0% based on the assumption that the PHE and related enhanced FMAP would expire in mid–FY 2022, shifting the state and federal spending shares even though total Medicaid spending growth is expected to slow.
As in 2020, the 2021 survey was fielded during a time of great uncertainty. State fiscal conditions had improved, but the rate of recovery varied across the states and employment indicators had not yet reached pre-pandemic levels. After COVID-19 infection rates dropped to encouragingly low levels in the late spring of 2021, a summer surge driven by the Delta variant was generating more uncertainty around the PHE end date, to which the MOE requirements and enhanced FMAP are tied. In their survey responses, most states projected slowing Medicaid enrollment growth and total spending growth along with increases in the share of state Medicaid spending in FY 2022 due to the assumption that MOE requirements and the enhanced FMAP would end in December 2021, half-way through the fiscal year for most states. However, the PHE was recently extended to mid-January 2022 and may be extended further if cases and deaths from the Delta variant remain high or increase heading into the winter. Extensions of the PHE would likely delay state projections/trends for spending and enrollment growth depicted in this report (for FY 2022). How states respond to the eventual end of the PHE and the unwinding of their MOE will have significant implications for enrollment and spending.
Context
Following declines from 2017 through 2019, total Medicaid and CHIP enrollment nationwide began to grow following the onset of the COVID-19 pandemic. Between February 2020 and April 2021, enrollment grew to 82.3 million, an increase of 11.1 million or 15.5%. In 2020, Medicaid (together with CHIP) provided coverage to nearly one in five Americans. This enrollment growth reflects both changes in the economy, as people enrolled following income and job losses, as well as the FFCRA MOE provisions that require states to ensure continuous coverage for current Medicaid enrollees to access a temporary increase in the FMAP rate. Total Medicaid spending was over $662 billion in FY 2020 with 67.4% paid by the federal government and 32.6% financed by states. Medicaid accounts for one in six dollars spent in the health care system and more than half of spending on long-term services and supports.3
States experienced a dramatic and rapid reversal of their fiscal conditions when the pandemic hit in March 2020. Before the pandemic, unemployment was low, states expected revenues to grow for the 10th consecutive year, and state general fund spending was on track to grow by 5.8%. In this context, governors developed FY 2021 budget proposals that reflected continued revenue and spending growth. The pandemic began during the second half of FY 2020 and quickly reversed state fiscal conditions. Early estimates projected state budget shortfalls of up to $555 billion for fiscal years 2020 through 2022, and states experienced their first general fund revenue decline in FY 2020 since the Great Recession, though some declines in revenue can be attributed to states delaying their 2020 income tax collections from April to July (the start of FY 2021 for most states). Faced with continued uncertainty regarding the course of the pandemic, ongoing revenue collections, and additional federal fiscal relief, states adopted conservative FY 2021 budgets. Unlike the federal government, states must meet balanced budget requirements. To address budget shortfalls heading into FY 2021, states used strategies such as layoffs or furloughs for state workers, hiring freezes or salary reductions, across the board spending cuts, or one-time use of rainy day funds.
State economic conditions have since improved mitigating the need for widespread spending cuts last year. National economic indicators have moderated in recent months. For example, September 2021 saw a national unemployment rate of 4.8% across all states including DC, below the peak of 14.8% in April 2020 but still above the February 2020 rate of 3.5% right before the pandemic. State revenue collections have rebounded due, in part, to federal aid provided to states, improved state sales tax collections on online purchases, and smaller personal income tax revenue declines due to the disproportionate impact of the pandemic on low-income workers. While state general funds are estimated to have grown by 3% in FY 2021, general fund spending in FY 2021 remained 2% below spending projections made before the pandemic. In FY 2022, however, general fund spending is expected to grow by 5%. In contrast to budgets adopted for FY 2021, proposed FY 2022 state budgets did not include general fund spending decreases, and most states enacted FY 2022 budgets with increased state spending and revenue.
Viewed nationally, state fiscal conditions have improved, but pandemic-related economic impacts vary by state. The severity of the pandemic-induced economic downturn and speed of recovery varies by state depending on state characteristics such as tax structure, industry reliance, social distancing policies and behaviors, and virus transmission. Economic indicators are improving across states, with indicators for some states returning to pre-pandemic levels while others remain distressed. For example, in September 2021, Nebraska saw an unemployment rate of 2.0%, which is below their pre-pandemic rate of 3.0% in February 2020, while Nevada’s unemployment rate was 7.5%, well above their pre-pandemic unemployment rate of 3.7%. While state revenues overall appear to have surpassed pre-pandemic levels, there is variation across states. Also, this data pre-dates the recent Delta variant fueled COVID-19 surge and is volatile due to most states delaying their income tax filing deadlines for 2020 and 2021.
While the FFCRA FMAP increase currently continues to support Medicaid programs and provide broad fiscal relief to states, states are preparing for the FMAP increase to end in FY 2022. In the past, federal fiscal relief provided through Medicaid FMAP increases during significant economic downturns has helped to both support Medicaid and provide efficient, effective, and timely fiscal relief to states. FFCRA uses this model as well by providing a temporary 6.2 percentage point increase in the Medicaid FMAP from January 1, 2020 through the end of the quarter in which the PHE ends. The current PHE declaration expires in mid-January 2022, meaning the enhanced FMAP will remain in place until the end of March 2022 unless the PHE is extended further. This FMAP increase does not apply to the Affordable Care Act (ACA) expansion group, for which the federal government already pays 90% of costs. To be eligible for the funds, states must meet certain MOE requirements that include not implementing more restrictive Medicaid eligibility standards or higher premiums and providing continuous eligibility for enrollees through the end of the PHE. Though the recent rise in COVID-19 cases and deaths due to the Delta variant cast uncertainty on the duration of the PHE, states are beginning to prepare for the end of MOE requirements, and new guidance from CMS gives states 12 months to address Medicaid eligibility renewals and redeterminations following the end of the PHE.
Key Findings
Trends in Enrollment Growth FY 2021 and FY 2022
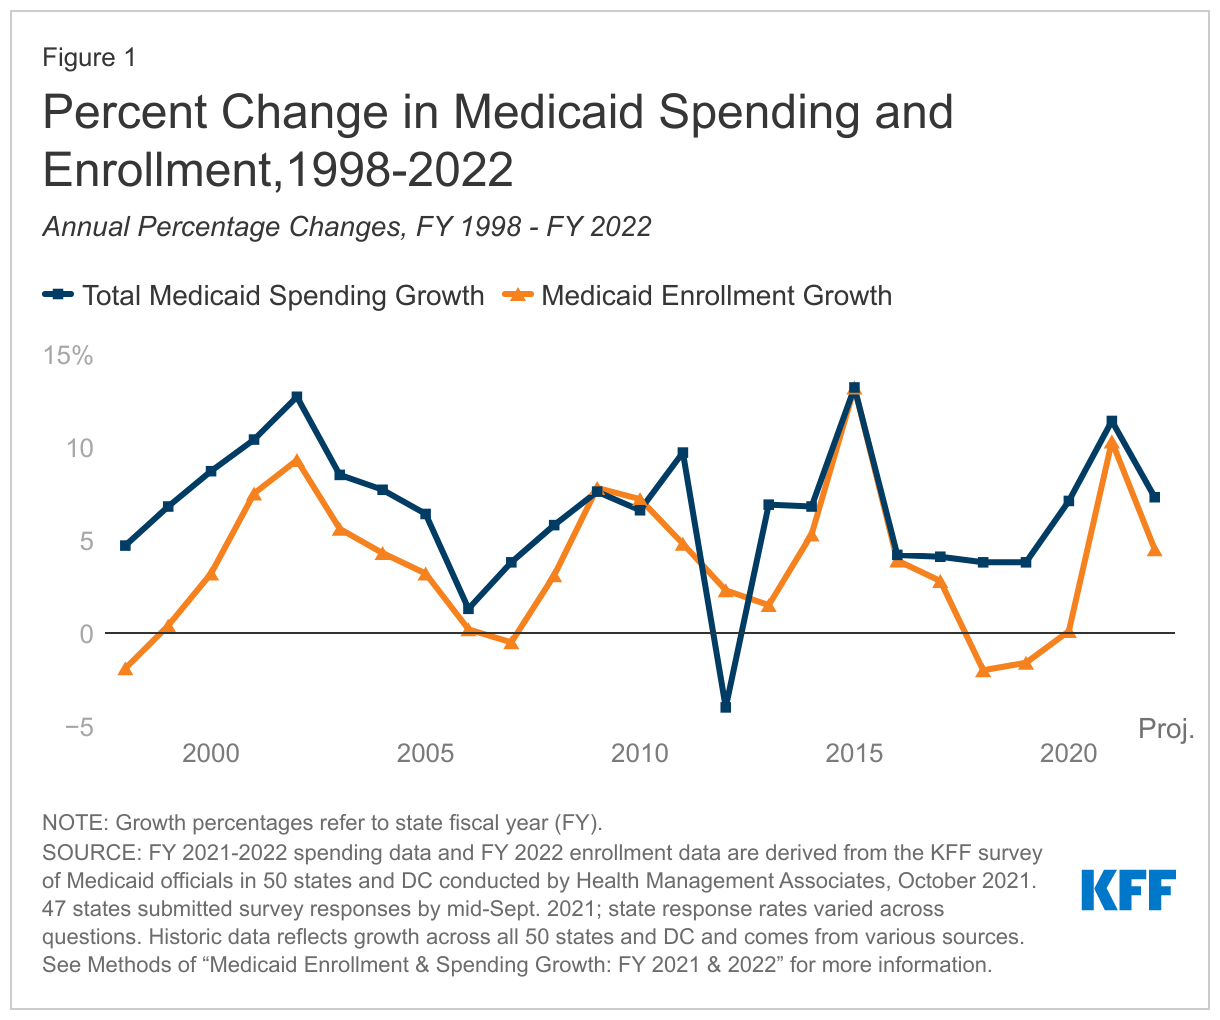
Medicaid enrollment growth peaked in FY 2021 and is expected to slow in FY 2022 (Figure 1). Medicaid enrollment growth peaked in FY 2015 due to ACA implementation and tapered thereafter. Enrollment actually declined in FY 2018 and FY 2019 and was relatively flat in FY 2020. Enrollment rose sharply, however, in FY 2021 (10.3%), and is projected to continue to grow, though more slowly, in FY 2022 (4.5%). Many states noted uncertainty in their projections due to the unknown duration of the PHE and related MOE requirements. Following the end of the MOE requirements, redeterminations will resume, and eligibility will end for beneficiaries who are determined to no longer meet eligibility standards. For budget projections, a majority of states were assuming the MOE would end as of December 31, 2021. This assumption was contributing to slowing enrollment growth in FY 2022; however, states also identified challenges to resuming normal eligibility operations such as the need for system changes, staffing shortages, and the volume of new applications and redeterminations.
States largely attributed enrollment increases to the FFCRA’s MOE requirements. All responding states reported that the MOE requirements were a significant upward pressure on FY 2021 enrollment. Over two-thirds of responding states reported that the MOE was likely to be a significant upward driver of FY 2022 enrollment, though some assumed that this upward pressure would end mid-year. In the absence of the MOE, individuals may lose Medicaid coverage because they have a change in circumstance (such as an increase in income), because they fail to complete renewal processes or paperwork even when they remain eligible, or because they age out of a time- or age-limited eligibility category (e.g., pregnant women or former foster care youth). In FY 2021, only about a quarter of states noted that the economy was a significant upward pressure on enrollment. Conversely, signs of economic improvement at the time of the survey likely contributed to some states citing economic conditions as a downward pressure on enrollment in FY 2022. Among Medicaid expansion states that responded to the survey, expansion adults were the most frequently mentioned eligibility group with notably higher rates of enrollment growth relative to other groups. States also reported that groups more sensitive to changes in economic conditions (e.g., children, parents, and other expansion adults) grew faster than the elderly and people with disabilities.
Trends in Spending Growth FY 2021 and FY 2022
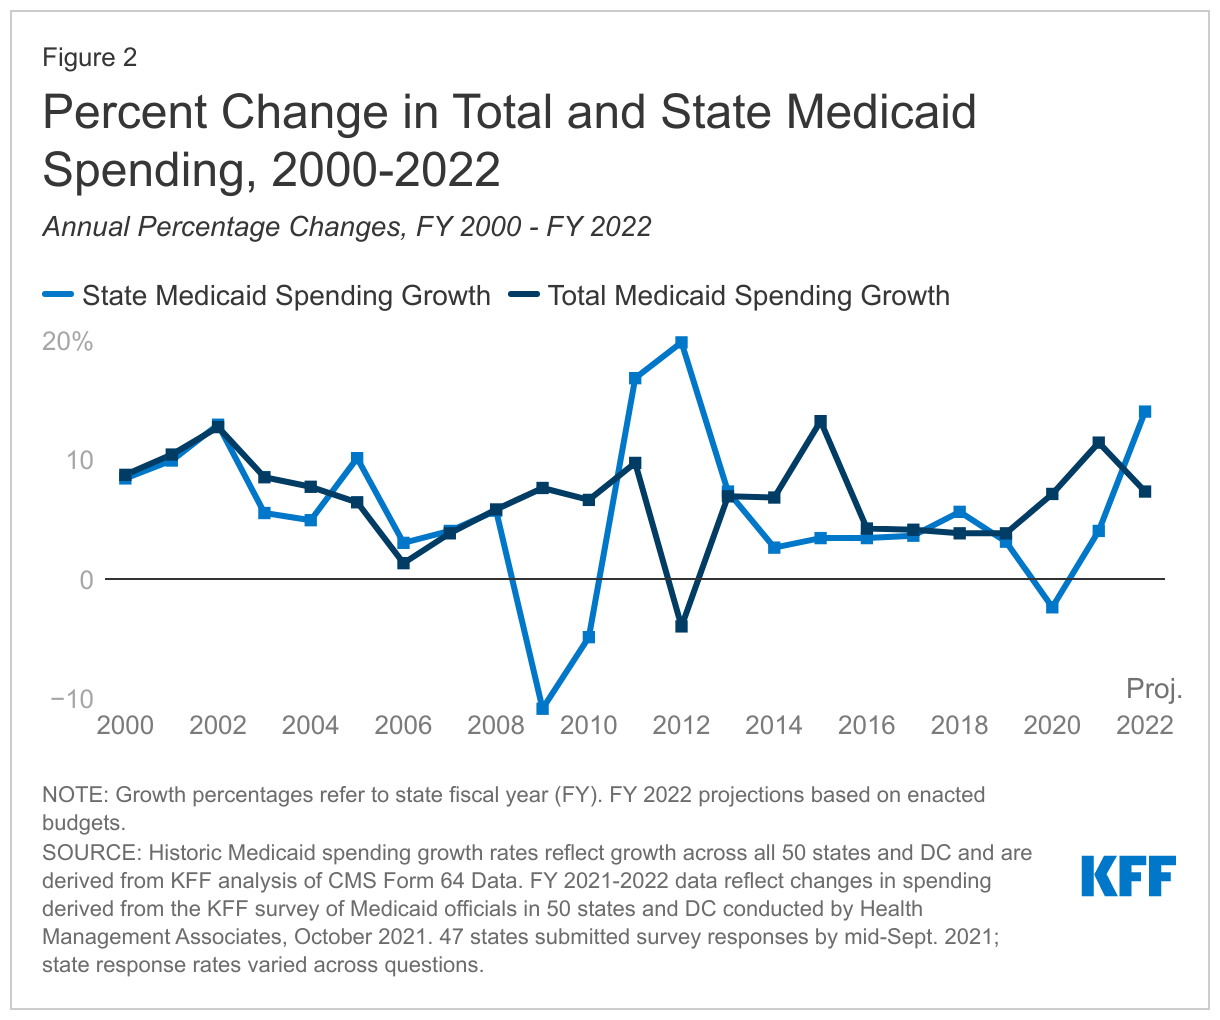
FY 2022 state budgets for responding states assume total Medicaid spending growth will slow to 7.3% compared to a peak of 11.4% in FY 2021 (Figure 2). High rates of enrollment growth, tied first to the Great Recession and later to ACA implementation, were the primary drivers of total Medicaid spending growth over the last decade. Following ACA implementation but prior to the pandemic, declining or slowing enrollment growth resulted in more moderate spending growth. In prior surveys, states noted that spending growth in FY 2020 (prior to the major effects of the pandemic) was tied to increasing costs for prescription drugs (particularly for specialty drugs), rate increases (most often for managed care organizations, hospitals, and nursing facilities), overall medical inflation, pressures from an aging state population, and a higher acuity case-mix.
FY 2021 spending growth increased sharply, primarily due to enrollment growth. Some states noted upward pressures from increased COVID-19 related expenditures, but half of states reported pandemic-related utilization decreases for non-COVID care as a downward pressure on overall spending. A majority of states reported acute care utilization on a per member basis decreased in FY 2021, but most of these states expect a full rebound in acute care services utilization in FY 2022 (most states were responding to the survey before a new surge in cases from the Delta variant were emerging). Most states indicated nursing facility utilization decreased in FY 2021; however, a majority of states noted the decreased utilization was partially or fully offset by utilization in home and community-based services (HCBS). Among states seeing decreases in nursing facility utilization, only a small number expect nursing facility utilization to fully rebound in FY 2022. Changes in payment rates and utilization patterns for acute and long-term care services may have contributed to states reporting that per enrollee spending for the elderly and people with disabilities was growing faster relative to other groups in FY 2021.
For FY 2022, a majority of states expect enrollment growth trends to be a primary factor driving total spending growth. While a majority of states cited enrollment as an upward pressure, over a third of states expect enrollment to become a downward pressure in FY 2022, assuming that the MOE requirements end midway through FY 2022 and states would resume redeterminations resulting in slower enrollment growth. Beyond enrollment, states reported additional upward pressure coming from provider rate or cost changes and increased utilization driven by a return to pre-pandemic utilization levels or by pent up demand resulting from pandemic-related delays in care.
Assumptions about the duration of the PHE and the expiration of the enhanced FMAP affected state Medicaid spending growth assumptions (Figure 2). The state share of Medicaid spending typically grows at a similar rate as total Medicaid spending growth unless there is a change in the FMAP rate. During the Great Recession, state spending for Medicaid declined in FY 2009 and FY 2010 due to fiscal relief from a temporary FMAP increase provided in the American Recovery and Reinvestment Act (ARRA). State spending increased sharply when that fiscal relief ended.
This pattern has repeated during the pandemic-induced economic downturn, with state Medicaid spending declining in FY 2020, increasing but at a slower rate than total spending in FY 2021, and then projected to increase sharply to surpass total Medicaid spending in FY 2022 due to assumptions about the expiration of the fiscal relief. More than three-quarters of responding states assumed the enhanced FMAP rate would end December 31, 2021, half-way through the state fiscal year, with only two states assuming a later date. The spike in state spending growth reflects these assumptions. However, the recent PHE extension to mid-January 2022 extends the enhanced FMAP through at least March 2022, which will mitigate the state spending increase observed here. Of course, a further extension of the PHE due to the Delta variant or other factors could mean that the enhanced FMAP would be in place through June 2022 (the end of the state fiscal year for most states), meaning the spike in state spending would not occur until the following fiscal year.
Nearly all responding states report using the federal fiscal relief to support costs related to increased Medicaid enrollment. About two-thirds of responding states also report using the fiscal relief to help address Medicaid or general budget shortfalls and mitigate provider rate and/or benefit cuts. Fewer states anticipate Medicaid budget shortfalls in FY 2022 (prior to the Delta variant surge) compared to last year’s survey, reflecting improving state revenues that allow states to fund their share of Medicaid spending increases. However, many states noted the importance of federal fiscal relief to avoiding a shortfall and uncertainty of a shortfall due to the unknown duration of the enhanced FMAP.
Conclusion and Looking Ahead
State economic conditions have improved, though the recovery varies across states and employment indicators have not yet reached pre-pandemic levels. Almost all states have adopted budgets for state fiscal year 2022 (which started July 1 in most states), and revenue and spending projections incorporated improvements in revenue reflecting increased economic activity due to COVID-19 vaccination efforts and eased restrictions, assumptions about the duration of the PHE, and federal stimulus funds that were part of the American Rescue Plan. A summer surge in COVID-19 cases, hospitalizations, and deaths driven by the Delta variant, however, has generated greater uncertainty regarding future state fiscal conditions.
The end date of the PHE remains uncertain and will have significant implications for Medicaid enrollment and spending. The recent COVID-19 surge casts further uncertainty around the duration of the PHE and the MOE requirements and enhanced FMAP that are tied to the PHE. The MOE requirements and enhanced FMAP have already been extended further than most states anticipated in their budget projections and may be extended even further if the current COVID-19 surge continues or worsens. If the PHE is extended beyond January, Medicaid enrollment growth will likely continue in FY 2022, but the expected increase in state Medicaid spending will be delayed while the enhanced federal fiscal relief remains in place. Regardless of when the PHE ends, most states will start to prepare for the eventual unwinding of their MOE policies and procedures, as resuming Medicaid eligibility renewals will be a large administrative task for states. Guidance from CMS gives states 12 months to complete renewals and redeterminations following the end of the PHE. Additional guidance and oversight from the federal government could help mitigate differences in how states approach the end of the MOE. With the unwinding, states are likely to face pressures to contain growth in state spending tied to enrollment, particularly after the enhanced FMAP ends, even as they work to overcome challenges with systems and staffing to ensure that eligible individuals remain covered by Medicaid or transition to other sources of coverage.
Methods
Methods
Definition of Medicaid Spending. Total Medicaid spending includes all payments to Medicaid providers for Medicaid-covered services provided to enrolled Medicaid beneficiaries. Medicaid spending also includes special disproportionate share hospital (DSH) payments that subsidize uncompensated hospital care for persons who are uninsured and unreimbursed costs of care for persons on Medicaid. Total Medicaid spending does not include Medicaid administrative costs and federally mandated state “Clawback” payments to help finance the Medicare Part D prescription drug benefit for Medicaid beneficiaries who are also enrolled in Medicare. States are also asked to exclude costs for the Children’s Health Insurance Program (CHIP). Total Medicaid spending includes payments financed from all sources, including state funds, local contributions, and federal matching funds. Historical state Medicaid spending refers to all nonfederal spending, which may include local funds and provider taxes and fees as well as state general fund dollars.
Methodology. KFF commissioned Health Management Associates (HMA) to survey Medicaid directors in all 50 states and DC to identify and track trends in Medicaid spending, enrollment, and policymaking. Given differences in the financing structure of their programs, the U.S. territories were not included in this analysis. This is the 21st annual survey, conducted at the beginning of each state fiscal year from FY 2002 through FY 2022. The KFF/HMA Medicaid survey for this report was sent to each Medicaid director in June 2021. Forty-seven states provided survey responses by mid-September 2021. The four states that did not respond by this time are Delaware, Minnesota, New Mexico, and Rhode Island.
For FY 2021 and FY 2022, annual rates of growth for Medicaid spending were calculated as weighted averages across all states. For FY 2021 and FY 2022, 46 states reported Medicaid expenditure growth rates, and publicly available data was used for New Mexico’s expenditure growth. Weights for spending were derived from the most recent state Medicaid expenditure data for FY 2020, based on estimates prepared for KFF by the Urban Institute using CMS Form 64 reports, adjusted for state fiscal years. These CMS-64 data were also used for historic Medicaid spending and include all 50 states and DC. For FY 2018 and 2019, spending for New York was adjusted to reflect unexplained anomalies in the state spending on the CMS-64 data.
The average annual Medicaid enrollment growth rate for FY 2022 was calculated using weights based on Medicaid and CHIP preliminary monthly enrollment data for April 2021 published by CMS. For FY 2022, 42 states reported Medicaid enrollment growth rates, and publicly available data was used for New Mexico’s enrollment growth. The data reported for FY 2021 and FY 2022 for Medicaid spending and FY 2022 for Medicaid enrollment are weighted averages, and therefore, data reported for states with larger enrollment and spending have a greater effect on the national average.
Historical enrollment trend data for FY 1998 to FY 2013 reflects the annual percentage change from June to June of monthly enrollment data for Medicaid beneficiaries collected from all states and DC. Enrollment trend data for FY 2014 to FY 2021 reflects growth in average monthly enrollment based on KFF analysis of the Medicaid & CHIP Monthly Applications, Eligibility Determinations, and Enrollment Reports from CMS for all 50 states and DC. FY 2021 growth is preliminary through April 2021. Note that several states have revised monthly enrollment data as far back as June 2017 to better align with reporting criteria for the CMS, Medicaid & CHIP Monthly Applications, Eligibility Determinations, and Enrollment Reports. Data for months prior to June 2017 have not been revised and may use slightly different criteria for reporting monthly enrollment and generally result in larger enrollment totals.
Appendix
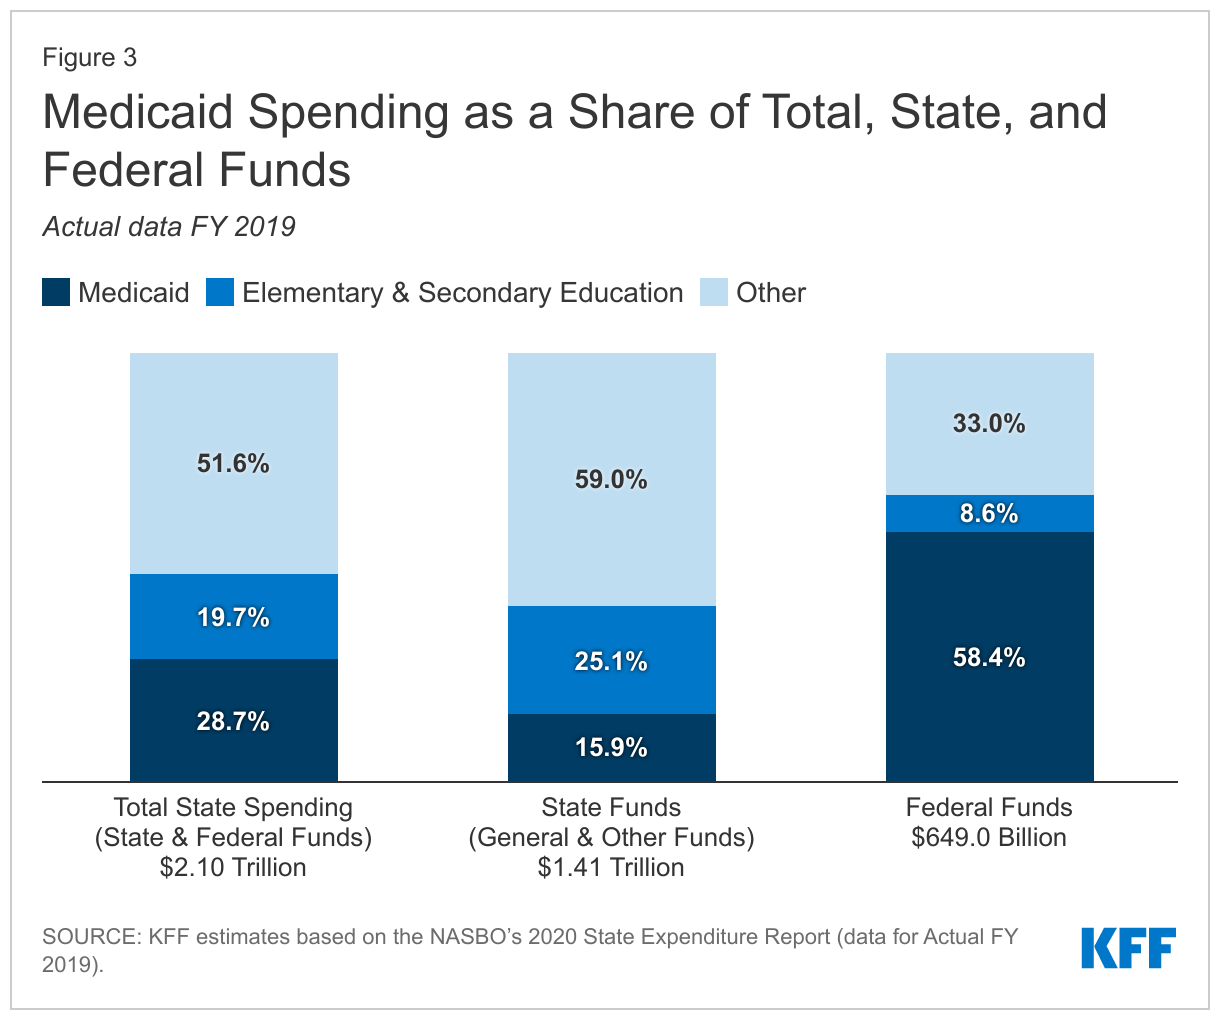
Medicaid Financing Structure. The federal government jointly funds the Medicaid program with states by matching qualifying state Medicaid expenditures. The federal match rate (known as the Federal Medical Assistance percentage, or "FMAP") is calculated annually for each state using a statutory formula based on a state’s average personal income relative to the national average which results in higher FMAP rates for poorer states. The FMAP formula relies on three years of lagged personal income data, so data for federal fiscal years (FFYs) 2017 to 2019 was used to calculate FFY 2022 FMAP rates, which range from a floor of 50% (applicable to 12 states) to a high of 78% (for Mississippi). Because of the federal matching structure, Medicaid is both a state budget expenditure item and a source of federal revenue for states. In FY 2019 (the latest year of actual data), Medicaid accounted for 28.7% of total state spending, but 15.9% of state funds (general fund plus other state funds), a far second to spending on K-12 education (25.1% of state funds). Medicaid is the largest single source of federal funds for states, accounting for over half (58.4%) of all federal funds received by states (Figure 3).
Medicaid and the Economy. Medicaid is a countercyclical program. During economic downturns, more people qualify and enroll in Medicaid, increasing program spending at the same time that state tax revenues may be stagnating or falling. Prior to the current pandemic, to mitigate these budget pressures, Congress had twice passed temporary FMAP increases to help support states during economic downturns, most recently in 2009 as part of the American Recovery and Reinvestment Act (ARRA). The ARRA-enhanced FMAP rates provided states over $100 billion in additional federal funds over 11 quarters, ending in June 2011.4
Medicaid and the ACA. Effective January 1, 2014, the ACA expanded Medicaid eligibility to millions of non-elderly adults with income at or below 138% of the federal poverty level (FPL) –$17,774 per year for an individual in 2021.5 The law also provided 100% federal funding for expansion adults through 2016, phasing down to 90% in 2020 and future years. The June 2012 Supreme Court ruling on the ACA effectively made the Medicaid expansion optional for states; as of October 2021, 39 states (including DC) had adopted the expansion, including Missouri and Oklahoma, which have adopted the expansion through ballot measures and implemented beginning in state fiscal year 2022.
Endnotes
- State fiscal years begin on July 1 except for these states: New York on April 1; Texas on September 1; Alabama, Michigan, and District of Columbia on October 1. ↩︎
- The four states that did not respond by mid-September 2021 are: Delaware, Minnesota, New Mexico, and Rhode Island. ↩︎
- U.S. Centers for Medicare & Medicaid Services (CMS). National Health Expenditure Data Fact Sheet: Table 4, National Health Expenditures by Source of Funds and Type of Expenditure: Calendar Years 2011-2018 (CMS, March 2020), https://www.cms.gov/Research-Statistics-Data-and-Systems/Statistics-Trends-and-Reports/NationalHealthExpendData/NHE-Fact-Sheet.html. ↩︎
- To be eligible for ARRA funds, states could not restrict eligibility or tighten enrollment procedures in Medicaid or CHIP. Vic Miller, Impact of the Medicaid Fiscal Relief Provisions in the American Recovery and Reinvestment Act (ARRA) (Washington, DC: Kaiser Commission on Medicaid and the Uninsured, October 2011), http://kff.org/medicaid/issue-brief/impact-of-the-medicaid-fiscal-relief-provisions/. ↩︎
- U.S. Department of Health & Human Services, Office of the Assistant Secretary for Planning and Evaluation. U.S. Federal Poverty Guidelines Used to Determine Financial Eligibility for Certain Federal Programs (January 2021), https://aspe.hhs.gov/poverty-guidelines ↩︎