Medicaid Enrollment Churn and Implications for Continuous Coverage Policies
Issue Brief
Recent policy actions and proposals in Medicaid have renewed focus on the problem of churn, or temporary loss of coverage in which enrollees disenroll and then re-enroll within a short period of time. The Families First Coronavirus Response Act (FFCRA) passed during the coronavirus pandemic requires states to provide continuous coverage to Medicaid enrollees until the end of the month in which the public health emergency (PHE) ends to receive enhanced federal funding. During this time, people did not churn on and off Medicaid, but churn may resurface when the continuous enrollment requirement ends. The Build Back Better reconciliation bill under consideration in Congress would begin to phase out the continuous enrollment requirement and the enhanced match beginning April 1, 2022. Additionally, the bill would require states to provide 12-month continuous coverage for children and for postpartum individuals in Medicaid and the Children’s Health Insurance Program (CHIP), which could reduce churn for those groups. Currently more than half of states already provide 12-month continuous coverage for children on an optional basis.
To help inform the current policy discussion, this brief provides estimates of churn for people enrolled in Medicaid in 2018. We use 2017 and 2019 as look-back and look-ahead years, respectively, so we can examine what happens to people a full year before and after an enrollment date or disenrollment date in 2018. We also provide estimates of churn by eligibility group and compare rates in Medicaid expansion versus non-expansion states. Overall, we find that 10% of full-benefit enrollees have a gap in coverage of less than a year, and rates are higher for children and adults compared to aged and people with disabilities. Churn rates also vary substantially by state, ranging from 5% or less in some states to 15% or more in others. Churn has implications for access to care as well as administrative costs faced by states. Detail on the data and methods underlying this analysis are in the Methods section at the end of the brief.
Background
The temporary loss of Medicaid coverage in which enrollees disenroll and then re-enroll within a short period of time, often referred to as “churn,” occurs for a several reasons. Enrollees may experience short-term changes in income or circumstances that make them temporarily ineligible. Alternatively, some people who remain eligible may face barriers to maintaining coverage due to renewal processes and periodic eligibility checks. Eligible individuals are at risk for losing coverage if they do not receive or understand notices or forms requesting additional information to verify eligibility or do not respond to requests within required timeframes.
Some enrollees may be at higher risk of churn than others. Working individuals whose monthly income fluctuates may be more likely to experience churn in states that have adopted frequent electronic data matches during the year. For example, adult enrollees without disabilities, most of whom are working, may have irregular work hours, overtime, or multiple part-time jobs that can lead to month-to-month changes in income. In contrast, elderly adults and people with disabilities, particularly those who qualify for Supplemental Security Income (SSI), are less likely to experience monthly income changes or other changes in circumstances. Most states conduct data matches on a periodic basis to identify changes in circumstances between annual renewal periods. If the data checks identify changes in income or other factors that affect eligibility and the individual is unable to resolve the discrepancy within the specified timeframe (often limited to within 10 days from the date of the notice), the person can be disenrolled from coverage.
Churn can result in access barriers as well as additional administrative costs. When individuals who remain eligible for coverage are disenrolled, they may experience gaps in coverage that could limit access to care and lead to delays in getting needed care. Research indicates that enrollees who experience fluctuations in coverage are more likely to report difficulties getting medical care and are more likely to end up in the hospital with a preventable condition. In addition, there are administrative costs associated with disenrolling an enrollee and then subsequently processing a new application.
What are the rates of churn in Medicaid?
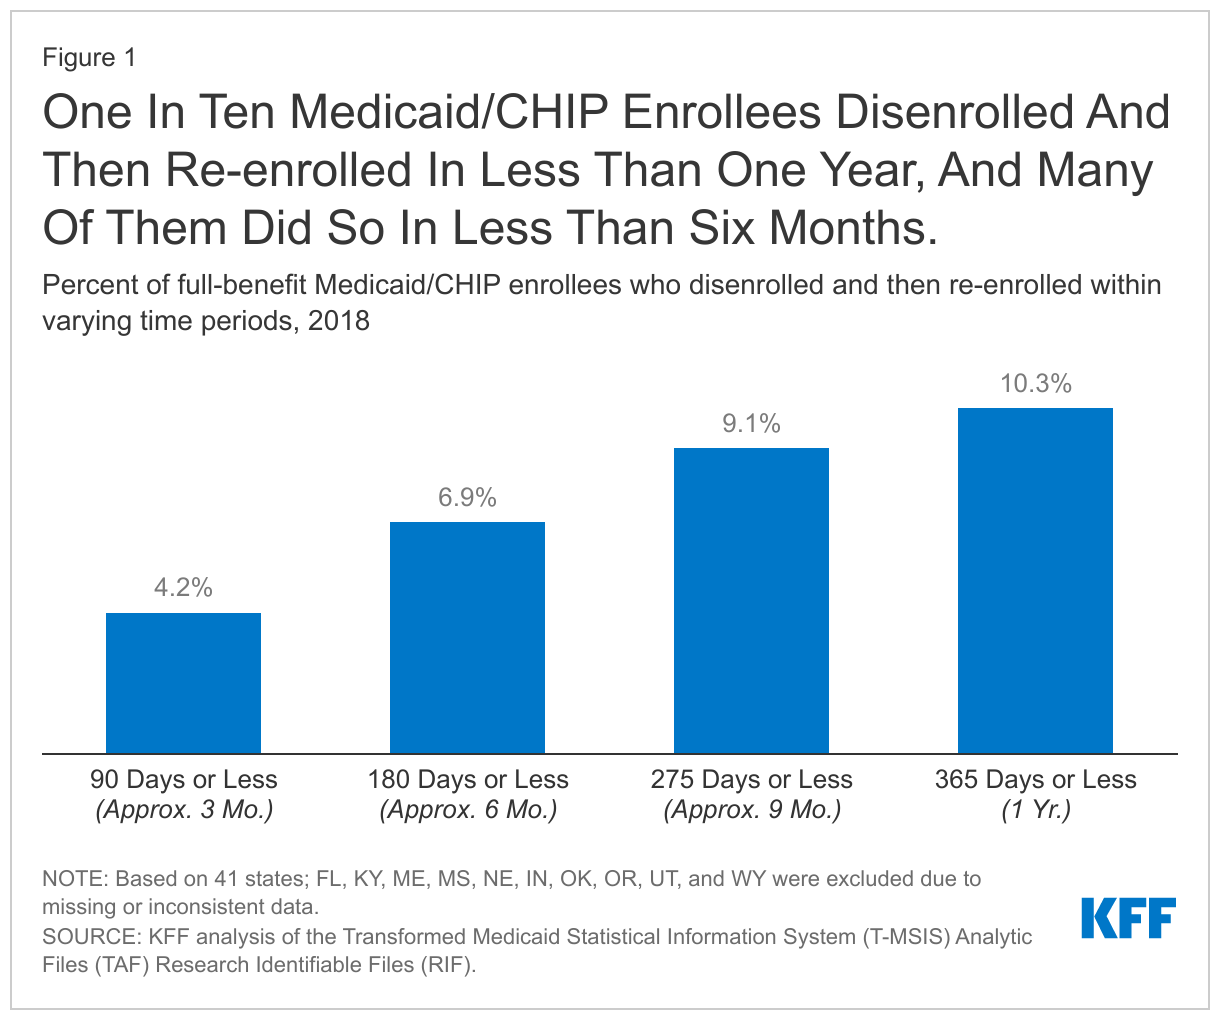
Among full-benefit beneficiaries enrolled at any point in 2018, 10.3% had a gap in coverage of less than a year. About 4.2% were disenrolled and then re-enrolled within three months and 6.9% within six months (Figure 1).
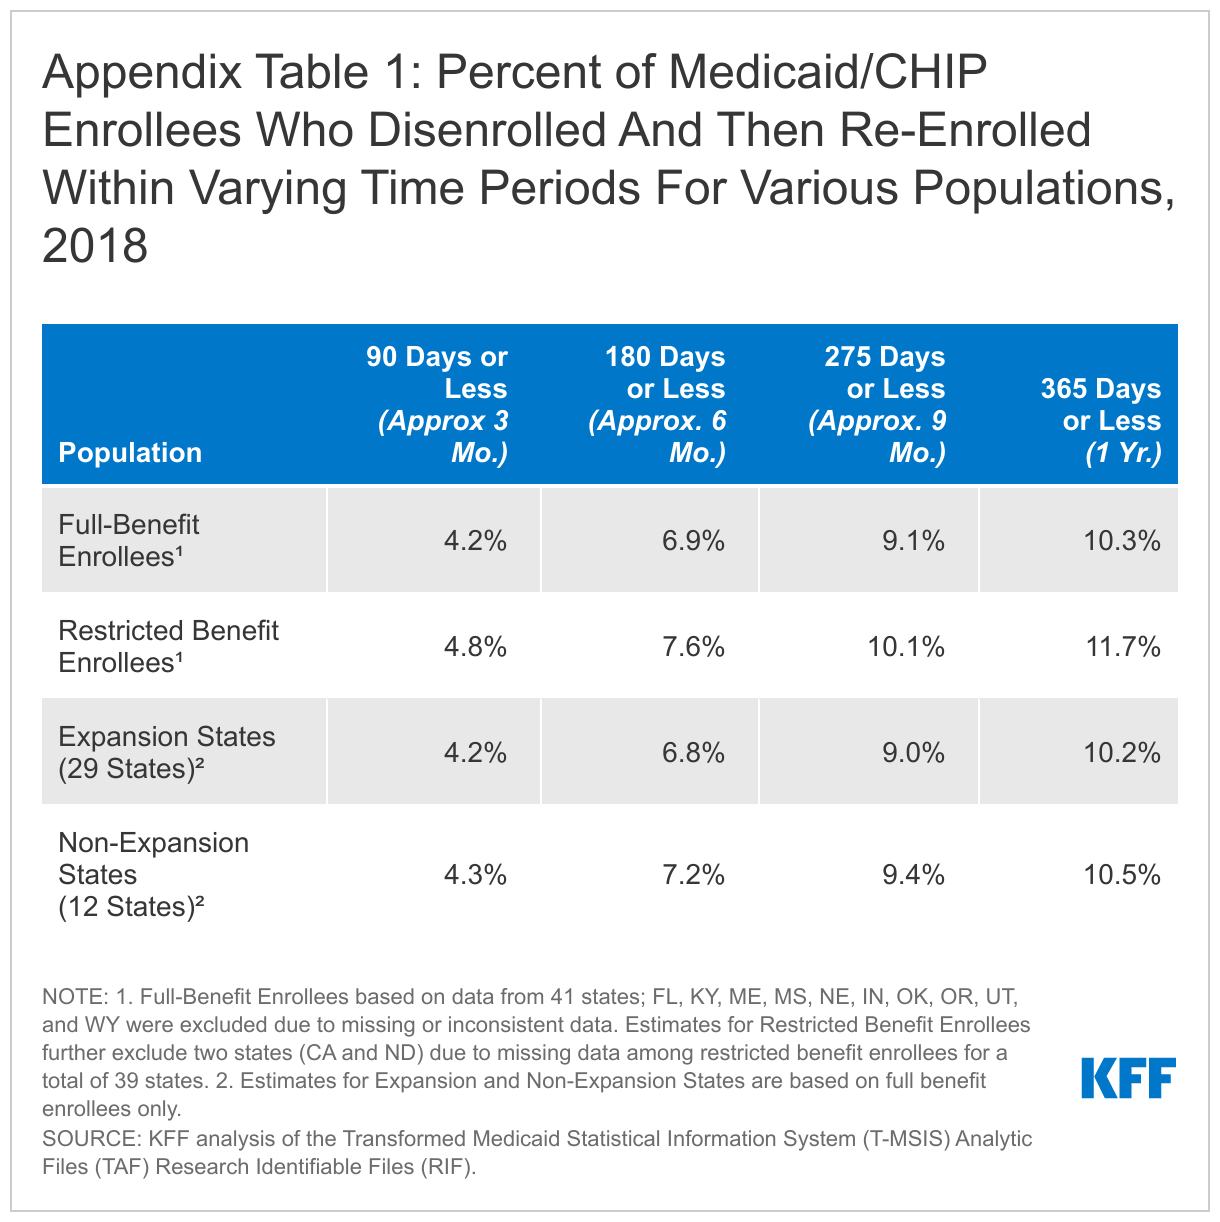
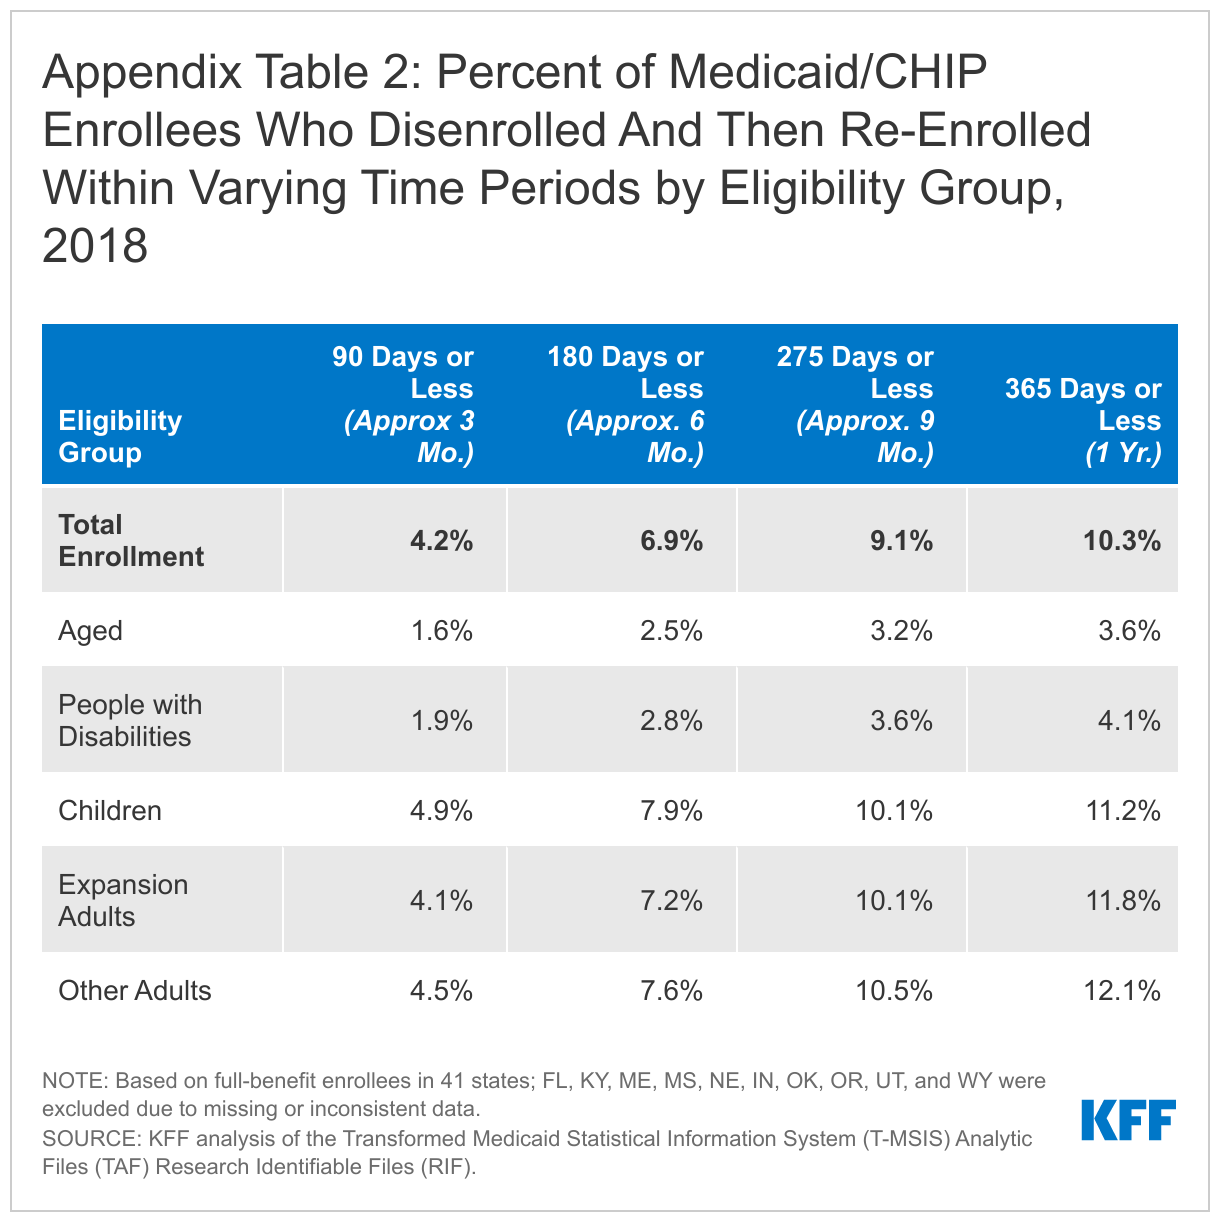
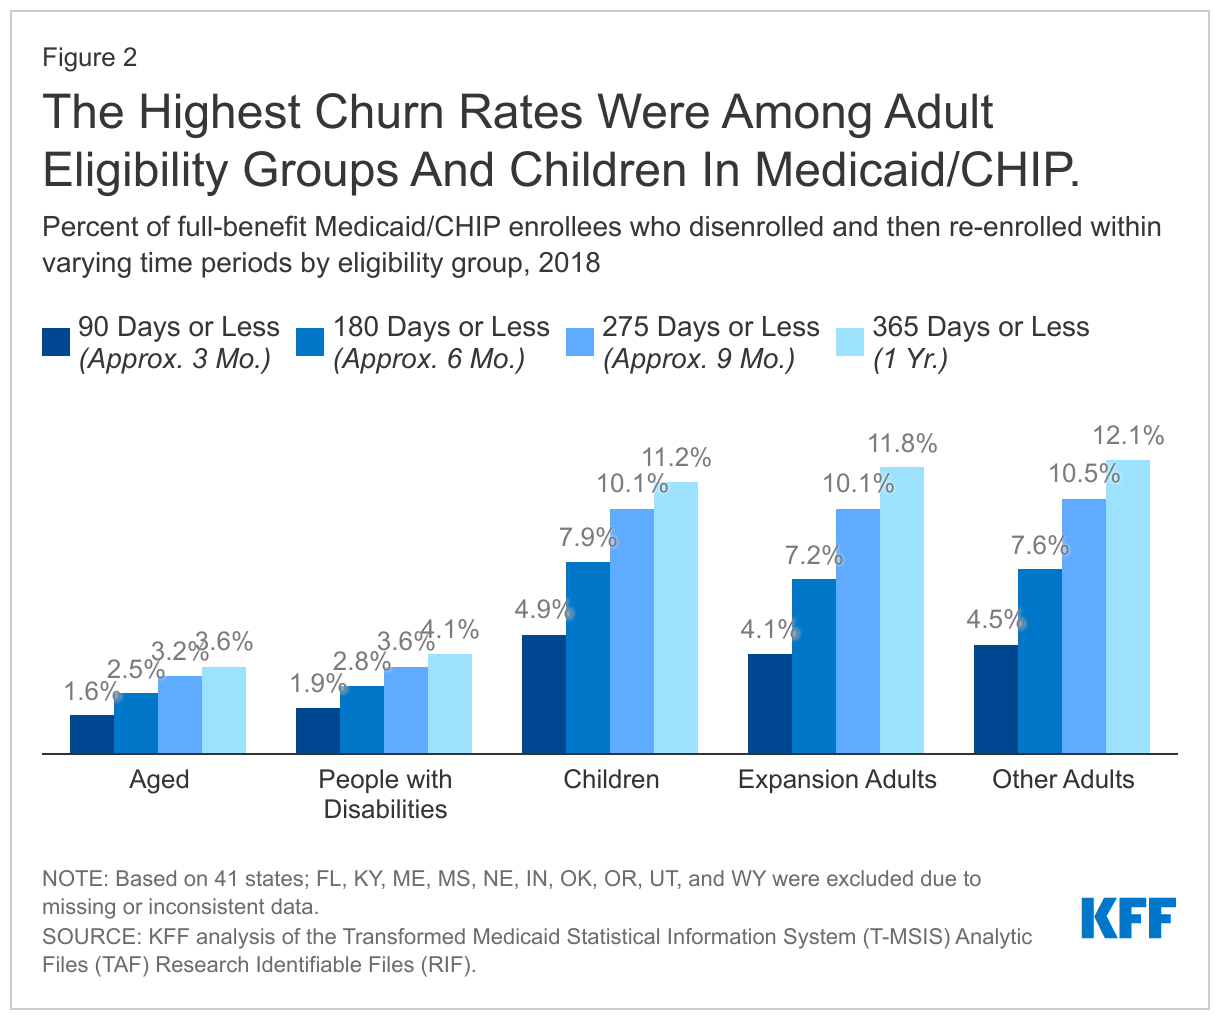
Rates of churn were higher for children and adults compared to aged adults and people with disabilities (Figure 2). We estimate that 11.2% of full-benefit children and 12.1% of adults were disenrolled and then subsequently re-enrolled within one year. Analysis also shows that rates of churn are higher for enrollees with partial benefit packages, but there are similar churn rates across expansion and non-expansion states (Appendix Table 1). However, there is considerable variation in churn rates across states, with 4 states (HI, AZ, DC, and NC) having 5% of enrollees or fewer disenrolling and then re-enrolling within a year, and 4 states (TX, WI, NH, and PA) having 15% of enrollees or more disenrolling and re-enrolling within a year.
What are current policy issues related to churn?
The continuous enrollment requirement related to the coronavirus pandemic has all but halted Medicaid churn for the past year and a half, but disenrollments are expected resume once the requirement ends. In part due to the continuous enrollment requirement, Medicaid/CHIP enrollment has increased from February 2020 to May 2021 by 11.5 million (or 16.2%) to 82.8 million individuals. However, when the continuous enrollment requirement ends, states will begin processing renewals and individuals may lose coverage if they are no longer eligible or face barriers during the redetermination process, such as providing required documentation.
The Build Back Better Act (BBBA) that is currently being debated in Congress would phase out the continuous enrollment requirement beginning April 1, 2022. To continue receiving a phased-down enhanced federal match rate, states would be required to follow rules about disenrolling people that could help to reduce rates of churn. For example, states could only disenroll individuals who have been enrolled at least 12 consecutive months and must limit eligibility redeterminations to a set proportion of enrollees each month through September 2022. States could not disenroll individuals based on returned mail unless there were at least two failed attempts to contact the individual through at least two modalities (e.g., mail and text messages). States would also have to report monthly data on call center statistics (average volume, wait times, and abandonment rates) as well as rates of eligibility renewals, redeterminations, and coverage terminations due to changes in circumstances (e.g., increased income) or due to administrative reasons (e.g., failing to provide required documentation).
Prior to the pandemic, some states had adopted policies and processes to reduce churn and promote continuous coverage. For example, as of January 2020, 35 states account for anticipated income changes, such as recurring seasonable employment or a job change, when determining eligibility at renewal. Some states also use projected annual income for the remainder of the calendar year when determining ongoing eligibility at renewal or when an individual has a potential change in circumstances between renewal periods. States can also implement processes that improve communications with enrollees to help prevent them from losing coverage because they do not receive or respond to notices from the state. Such actions include conducting regular data matches with the U.S. Postal Service National Change of Address Database, working with managed care plans and providers to update enrollees’ address information, and calling enrollees or sending email or text notifications when returned mail from a notice sent to an enrollee is received.
The BBBA would require states to implement 12-month continuous coverage for children and postpartum individuals. States have the option to provide 12 months of continuous coverage for children. Under this option, states allow a child to remain enrolled for a full year unless the child ages out of coverage, moves out of state, voluntarily withdraws, or does not make premium payments. As such, 12-month continuous eligibility eliminates coverage gaps due to fluctuations in income over the course of the year. A recent MACPAC analysis found that states with 12-month continuous coverage for children had lower rates of churn among children enrolled in Medicaid and CHIP compared to states without this policy. Currently, 34 states provide 12-month continuous eligibility to at least some children in either Medicaid or CHIP. The Build Back Better Act would require states to extend 12-month continuous coverage for children in Medicaid and CHIP and would also require 12-month continuous coverage for postpartum individuals, a change from the current requirement of 60-day postpartum coverage.
Methods
Data Source and Linkage
Our analysis is based on the Transformed Medicaid Statistical Information System (T-MSIS) Analytic Files (TAF) Research Identifiable Files (RIF). We include beneficiaries who were enrolled at any point in 2018. We use the 2018 Demographic Eligibility (DE) Base file to determine eligibility pathway based on last-best eligibility data. We draw enrollment dates from the 2017-2019 DE Dates files. Our analysis uses enrollment dates from 2017 and 2019 for look-back and look-ahead years, respectively, so that we can examine what happens to enrollees a full year before and after an enrollment start date or disenrollment date in 2018. Data for 2019 are from the preliminary version of the T-MSIS RIF. All other DE Base and DE Dates files are final versions (Release 1).
State Exclusion Criteria
We use 41 states in our analysis. We exclude 10 states (FL, IN, KY, ME, MS, NE, OK, OR, UT, and WY) due to missing or inconsistent data based on state-level information available at the DQ Atlas as well as our own analysis. We relied on data quality assessments from DQ Atlas to exclude states that have a “medium concern”, “high concern”, or “unusable” data quality assessment for: (1) the average monthly Medicaid/CHIP enrollment compared to an external enrollment benchmark (Medicaid/CHIP Performance Indicator Data) (five states (IN, KY, ME, MS, NE)); (2) the average length of enrollment gaps, and (3) the percent of beneficiaries with overlapping Medicaid and S-CHIP enrollment spans (no states were excluded based on measures 2 or 3). We further excluded states based on: (4) the percent of beneficiaries missing an eligibility group code (threshold of >=10%, excluded OR); (5) the percent of beneficiaries with only one enrollment span (threshold of >=99.5, excluded FL, KY, and WY); and (6) the percent of beneficiaries with three or more enrollment spans in a year (threshold of >=5%, excluded OK). Notably, our exclusion criteria for related to the number of enrollment spans in a year are less restrictive than that in the DQ Atlas because we did not want to make assumptions about the number of enrollment spans in our analysis, but did want to remove extreme cases that are the most likely to represent inaccurate enrollment dates.
For analysis that includes restricted benefit enrollees, we further excluded two states (CA and ND) due to large amounts of missing data among restricted benefit enrollees. CA was excluded because roughly 75% of observations coded with restricted benefits in the DE Base file were missing a federal identifier (BENE_ID). ND was excluded due to large amounts of missing enrollment data in the DE Dates files and, after merging the DE Dates and DE Base files, more than half (53%) of restricted benefit enrollees in the DE Base file did not have a matching BENE_ID in the DE Dates file and were dropped from the analysis.
Beneficiary Linking, Eligibility Classification, and Exclusion
We linked individuals across years using BENE_ID, which are unique enrollee identifiers created by the Chronic Conditions Warehouse and are recommended for use when combining data for multiple years. We also use BENE_ID to link the DE Base and DE Dates files. We assigned restricted benefit status and eligibility group code using a last-best approach for 2018, which assigns eligibility based on the most recent eligibility code in 2018. We classified eligibility groups using a hierarchy that first checked if the eligibility group code was missing, then for medically needy eligibility, disability (under age 65), and expansion adult. Any enrollees in the DE Base file that had a non-missing eligibility code and had not been assigned an eligibility group through this hierarchy were then were assigned by age to children (ages 20 and under), adults (ages 21 to 64), and aged (ages 65 and over).
The 2018 DE Base files for 41 states in our analysis contained 82.9 million observations after removing a small number of “dummy” records that represent enrollees who have claims data but no eligibility data provided by the states. We removed observations missing eligibility codes or restricted benefit status codes (624,000 observations), people qualifying through a medically needy pathway (1.7 million observations), people missing a BENE_ID for linking files (3.1 million observations), and people with duplicated BENE_ID (262,000 observations). After merging with the DE Dates files, there were less than 5,000 enrollees who did not have a matching BENE_ID in the DE Dates and DE Base files and were dropped from the final sample. Our final sample included 77.2 million unduplicated enrollees. Of these, 71.3 million were full-benefit enrollees. Our analysis of restricted benefit enrollees included 5.4 million people in the 39 states included in that component of the analysis.
Calculating Churn
The DE Dates files provide a start and end date for every enrollment span in our time period. As noted above, our analysis uses enrollment dates from 2017 and 2019 for look-back and look-ahead years for a more complete picture of churning. Before calculating churn rates, we first merged all overlapping and contiguous enrollment spans for enrollees, which we defined as enrollment spans that are separated by one day or less. For example, if a person has two enrollment spans with an end date and a start date that are one day apart (i.e., the person disenrolled and re-enrolled the next day), we considered these spans to be contiguous and merged them into one enrollment span. After merging overlapping and contiguous spans, we identified enrollment gaps, which we defined as the number of days between two enrollment spans for an enrollee. To be counted as “churn” in our analysis, a person would have had (1) an enrollment gap of 365 days or less and (2) and enrollment gap that started or ended in 2018. For example, a person that disenrolled in 2017 but then re-enrolled within 365 days in 2018 would be included in our churn estimates. Similarly, a person who disenrolled in 2018 and then re-enrolled in less than 365 days would also be counted in our churn estimates. Sensitivity analyses that only included gaps longer than 31 days showed a marginal decrease in churn rates (approximately 1 percentage point); while shorter gaps could reflect data reporting errors, they also could be true disenrollments followed by relatively quick re-enrollment.
Previous studies have estimated Medicaid churn rates at around 10%. There is some variation across studies due to use of different data sources, national versus state-specific estimates, and the focus on different populations (e.g., children versus adults). A recent analysis from MACPAC, which used the same data source but different methods as our analysis found that 8% of Medicaid and CHIP enrollees re-enrolled in coverage within one year of disenrolling. The most significant difference in our methods from MACPAC analysis was that the MACPAC analysis only utilized a look-ahead year, while our analysis includes a look-ahead year and a look-back year. There are other differences in methods from MACPAC’s analysis, but those likely have a smaller impact than the use of a look-back year. Our estimate of a 10% churn rate overall is also similar to estimates of 9% and 11% from studies of churn in specific states.
Appendix