Texans’ Experiences with Health Care Affordability and Access
Topline-Kaiser-Family-Foundation-Episcopal-Health-Foundation-Texas-Health-Policy-Survey
Executive Summary
Texas is a state with a diverse population and is home to the largest number of uninsured residents among U.S. states. In a new survey, the Kaiser Family Foundation and the Episcopal Health Foundation sought to gauge Texans’ views on health policy priorities, as well as their own experiences in the health care system. This brief, the second based on the survey, examines Texas residents’ experiences with health care affordability and access to care.
Affording health care tops Texans’ financial concerns , per @KaiserFamFound / @Health4Texas survey of Texas residents on health costs and access
The survey finds that health care affordability is a major concern for many Texans. Over half of Texas residents say it is difficult for their family to afford health care, higher than the shares that say the same about housing, utilities, transportation, or food. About four in ten say they’ve had problems paying medical bills in the past year, and roughly six in ten say someone in their household has postponed or skipped some sort of medical care in the past year because of the cost; both of these shares are higher than the shares measured nationally in Kaiser Family Foundation tracking polls.
Problems with health care affordability are much more commonly reported among Texans with lower incomes, those with health problems, and the uninsured. Cost is a barrier to getting insurance, too; among the uninsured, the most commonly reported reason for not having insurance is not being able to afford the cost. However, insurance does not offer ironclad protection against health care affordability problems. Even among those with insurance, many Texans report problems paying medical bills or skipping or delaying care because of the cost.
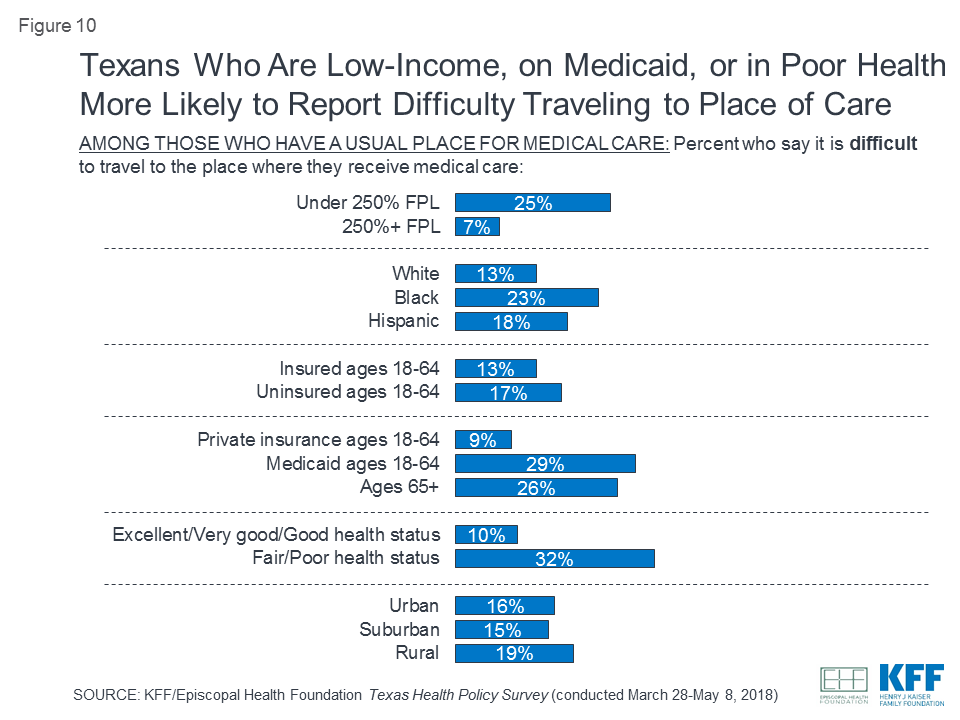
While most adults in Texas report having a place to go when they are sick or need advice about their health, about a quarter say they either have no usual place for care or that they rely on a hospital emergency room. The share without a usual place for care beyond the ER is higher among lower-income Texans and Black and Hispanic residents, and rises to about half among the non-elderly uninsured. Even for those with a usual place for care, difficulty traveling to this place is a problem for some Texans, particularly those with lower incomes, those with Medicaid coverage, and individuals who report being in fair or poor health.
Findings
Texans’ Struggles with Health Care Affordability
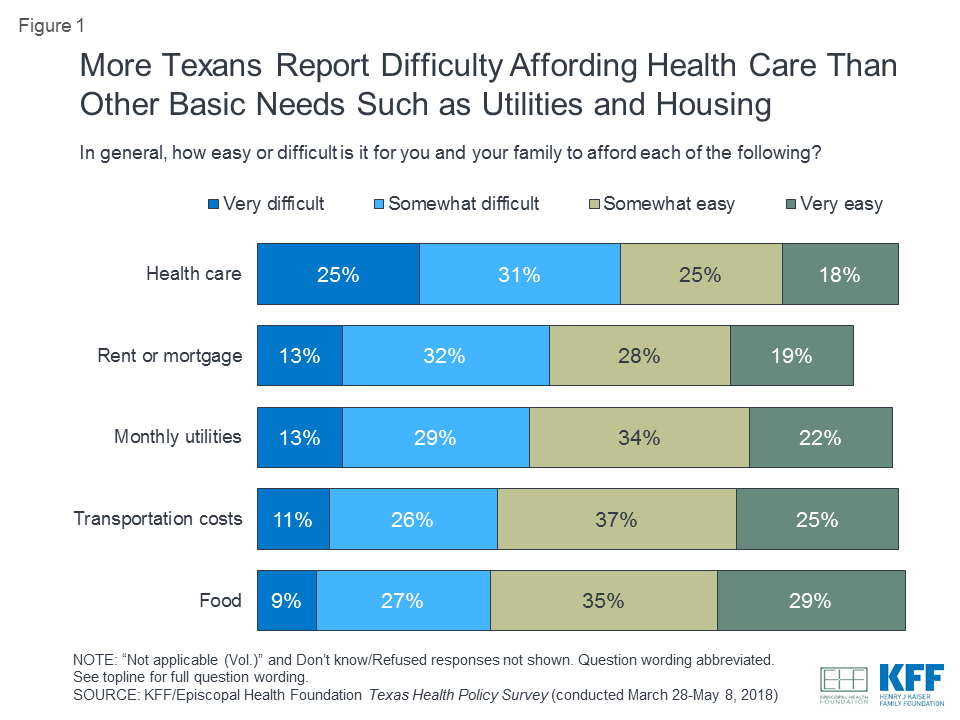
The survey finds that affordability of health care is a concern for many Texans, more so than affordability of other basic needs such as housing and transportation. Over half (55 percent) of Texas residents say it is difficult them and their family to afford health care, including a quarter who say it is “very difficult” (Figure 1). Fewer report finding it difficult to afford the cost of their rent or mortgage (45 percent), monthly utilities (42 percent), gasoline or other transportation costs (37 percent), or food (36 percent).
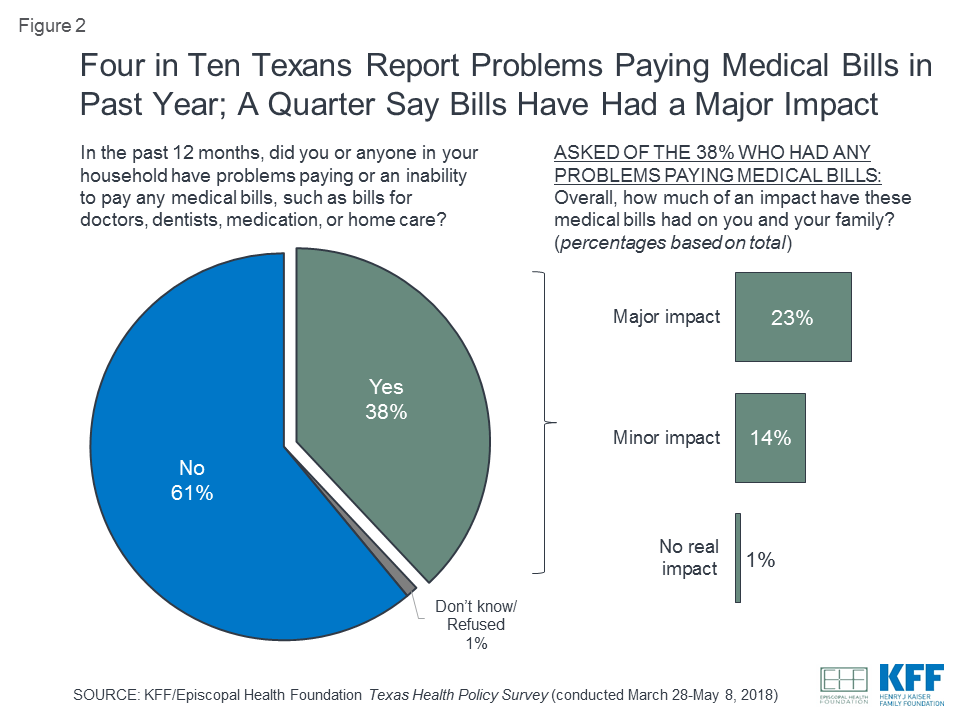
Poll: 38% of Texans say they or someone in their household had problems paying medical bills in the past year; most of this group say it had a major impact.
In addition to general difficulty affording care, about four in ten Texas (38 percent) say they or someone in their household had problems paying medical bills in the past 12 months (Figure 2). Among Texans who had problems paying medical bills, most say the bills have had a major impact on their family (23 percent of all Texans) while 14 percent say they have had a minor impact and few say they’ve had no real impact (1 percent).
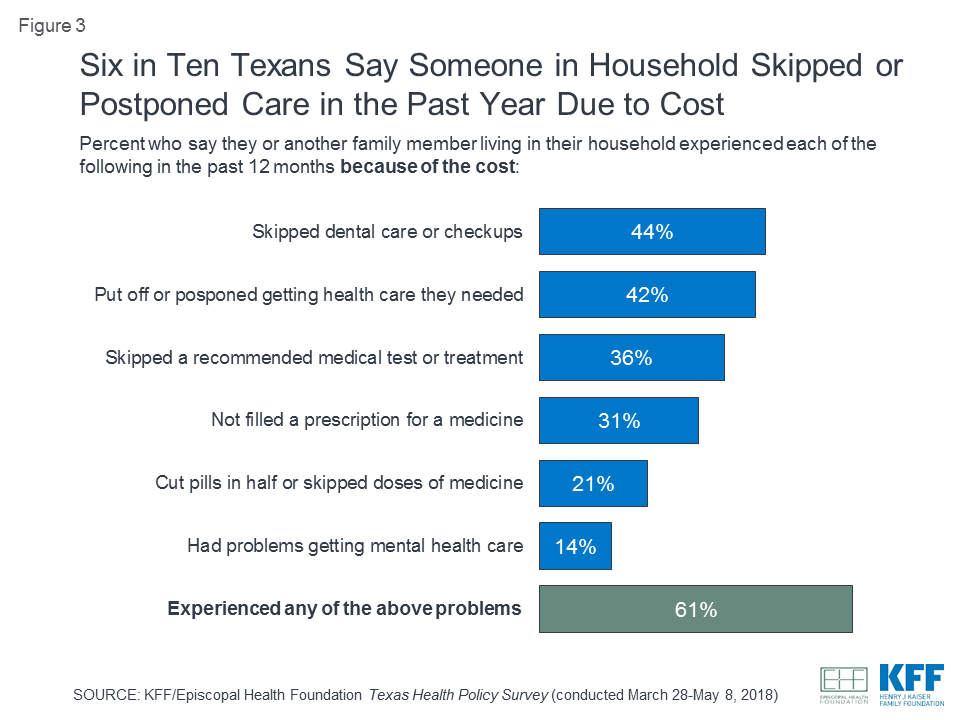
Further highlighting Texans’ challenges with health care expenses, a considerable share say they or a family member living in their household have skipped or put off getting some form of care in the past year because of the cost (Figure 3). The most common of these are skipping dental care or checkups (44 percent) and putting off or postponing needed health care (42 percent). About a third report skipping a recommended medical test or treatment (36 percent) or not filling a prescription for a medicine (31 percent). Fewer Texans say they or a family member cut pills in half or skipped doses of medicine (21 percent), or that they had problems getting mental health care (14 percent) in the past year due to cost. In total, six in ten Texans (61 percent) say they or another family member have done at least one of these in the past year because of the cost.
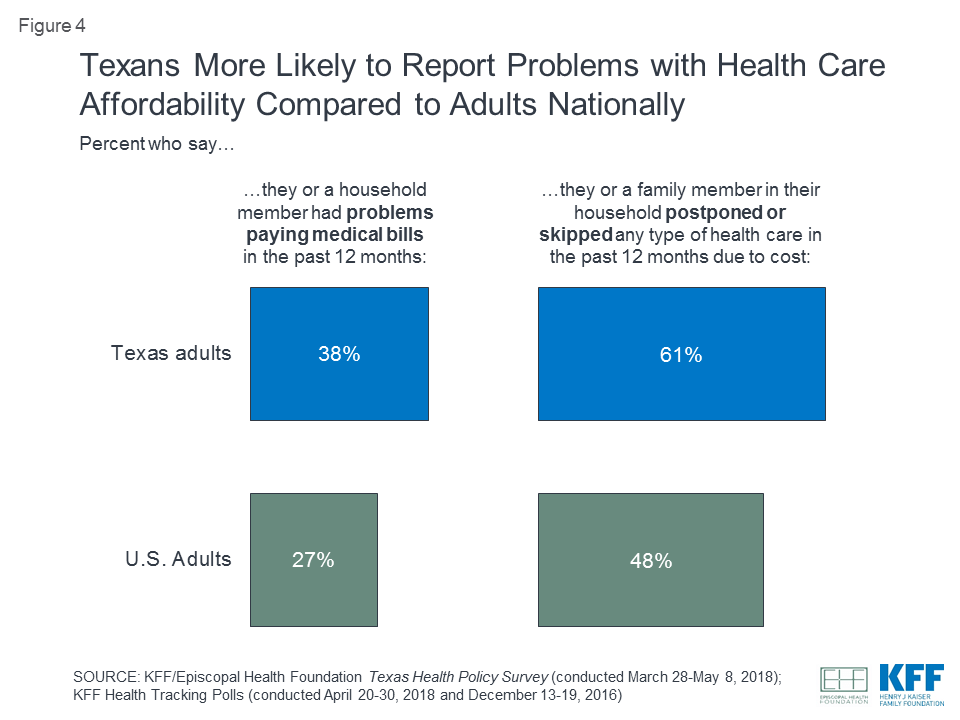
The shares of Texans who report problems with health care affordability are higher than the shares of adults nationally who report the same in recent Kaiser Health Tracking Surveys. For example, 38 percent of Texans say they or someone in their household had problems paying medical bills in the past 12 months, compared with 27 percent of adults nationally who reported the same in a KFF poll in March 2018. And in Texas, 61 percent say they or a family member skipped or postponed some type of health care in the past year because of the cost, higher than the 48 percent of adults nationally who reported the same in a December 2016 KFF survey (Figure 4). These differences between Texas and national averages likely reflect the fact that Texas has a somewhat higher share of people living in poverty and a larger share of people without health insurance compared to national averages.
Problems with Health Care Affordability by Demographic Group
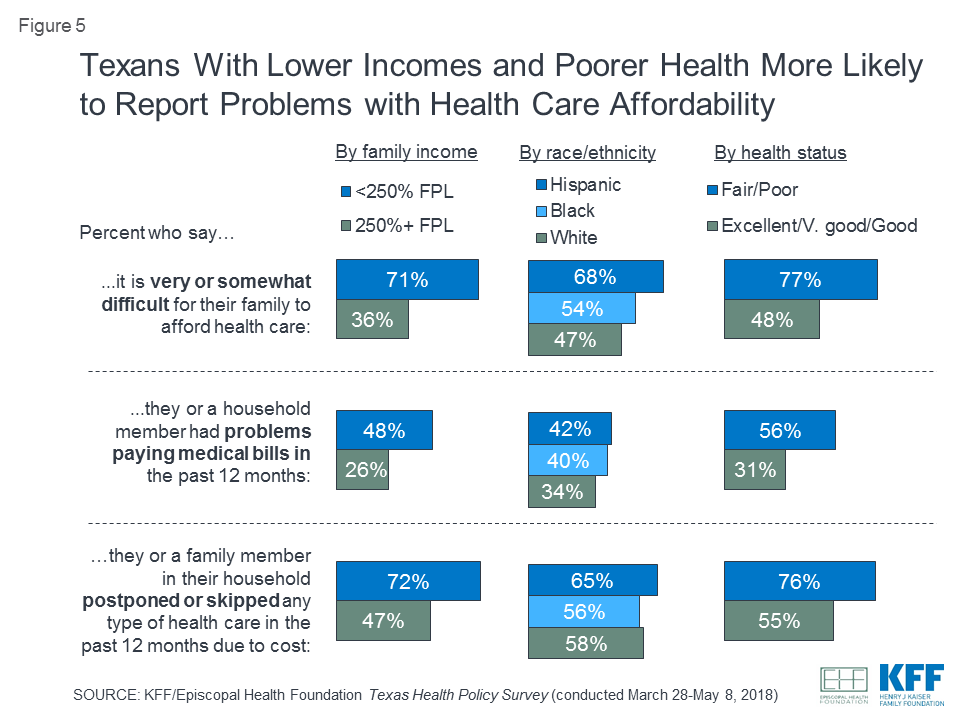
When it comes to problems related to health care costs, certain groups of Texans are more likely than others to report difficulty. In general, those with lower incomes, Hispanic residents, and those in poorer health are more likely to report experiencing these types of problems compared to their higher-income, white, and healthier counterparts (Figure 5).
For example, Texans with self-reported family incomes under 250 percent of the federal poverty level (FPL) are nearly twice as likely as those with higher incomes to say it is difficult for their family to afford health care (71 percent versus 36 percent). They are also much more likely to say they’ve had problems paying medical bills in the past year (48 percent versus 26 percent) and to say someone in their family has put off or postponed some type of medical care in the past year because of the cost (72 percent versus 47 percent).
Similarly, Hispanic residents are more likely to report difficulty affording health care compared to their Black and white counterparts (68 percent, 54 percent, and 47 percent, respectively). Hispanic Texans are also more likely than whites to say they’ve had problems paying medical bills in the past 12 months (42 percent versus 34 percent). However, there is no significant difference by race or ethnicity in the share who report skipping or postponing care because of the cost. Health status makes a difference on all these measures; those who say their own health is only fair or poor are much more likely than those who report being in better health to report difficulty affording health care (77 percent versus 48 percent), problems paying medical bills (56 percent versus 31 percent), and skipping or postponing care due to cost (76 percent versus 55 percent).
Problems with Health Care Affordability among the Uninsured
Texas is home to the largest number of uninsured adults and has the highest uninsured rate of any U.S. state; 21 percent of adults between the ages of 19-64 in Texas are uninsured, compared to the national average of 12 percent.1 One contributing factor to the uninsured rate is the fact that Texas has not expanded Medicaid under the Affordable Care Act, and Texas has relatively strict adult Medicaid eligibility criteria compared to other states.2
Previous research, both nationally and in Texas, has found that individuals without health insurance are more vulnerable to high medical bills and more likely to report problems with health care affordability compared to their insured counterparts.3 The current survey finds similar results. Large majorities of uninsured Texans ages 18-64 say that health care is difficult for their family to afford (82 percent) and that someone in their household has skipped or postponed some type of medical care in the past year because of the cost (76 percent). About half of the uninsured (49 percent) say someone in their household had problems paying medical bills in the past 12 months (Figure 6).
However, while problems with health care affordability are a major problem for the uninsured, it is notable that insurance doesn’t offer ironclad protection against such problems. Even among Texans ages 18-64 with health insurance, nearly half (47 percent) say health care is difficult for their family to afford, about six in ten (58 percent) report skipping or postponing care due to cost, and about a third (35 percent) say they’ve had problems paying medical bills in the past year.

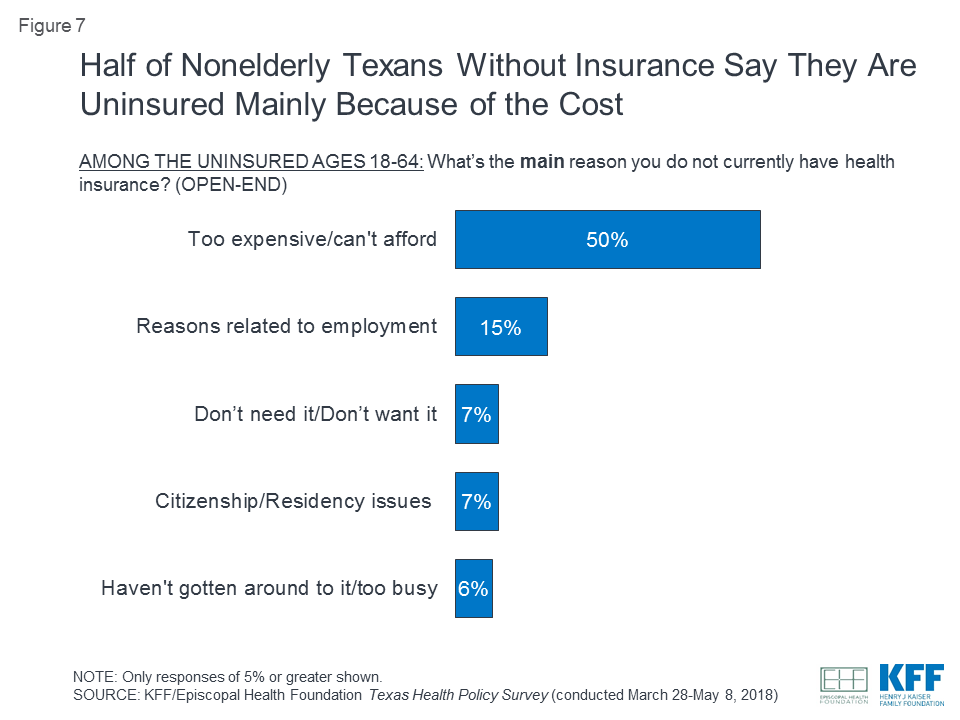
For the uninsured, issues with affordability extend not only to health care services, but also to their ability to obtain health insurance. Among Texans ages 18-64 who are uninsured, the top reason reported for not having insurance is because is too expensive or they cannot afford it (50 percent, Figure 7). Smaller shares cite other explanations such as reasons related to employment (15 percent), citizenship or residency issues (7 percent), or being too busy (6 percent). Just 7 percent of those without coverage say they are uninsured because they don’t want insurance or feel they don’t need it. These findings are consistent with previous research from the Episcopal Health Foundation and Rice University’s Baker Institute among uninsured adults in Texas and national results from previous Kaiser Family Foundation surveys.4
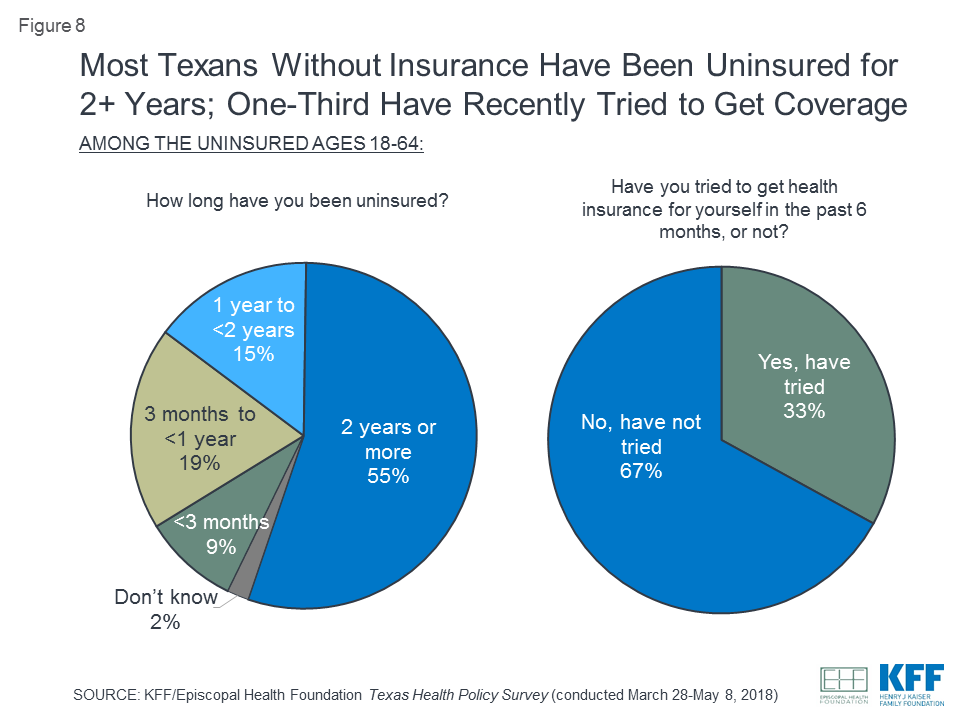
Problems with health care affordability among the uninsured also reflect the fact that for most of the uninsured in Texas, lack of coverage is a long-term problem. Seven in ten non-elderly adults without health insurance say they have gone without coverage for at least a year, including over half (55 percent) who say they have been uninsured for two years or more. Just a third of the uninsured say they have tried to get coverage for themselves in the past 6 months (Figure 8).
Usual Source of Care for Texas Residents
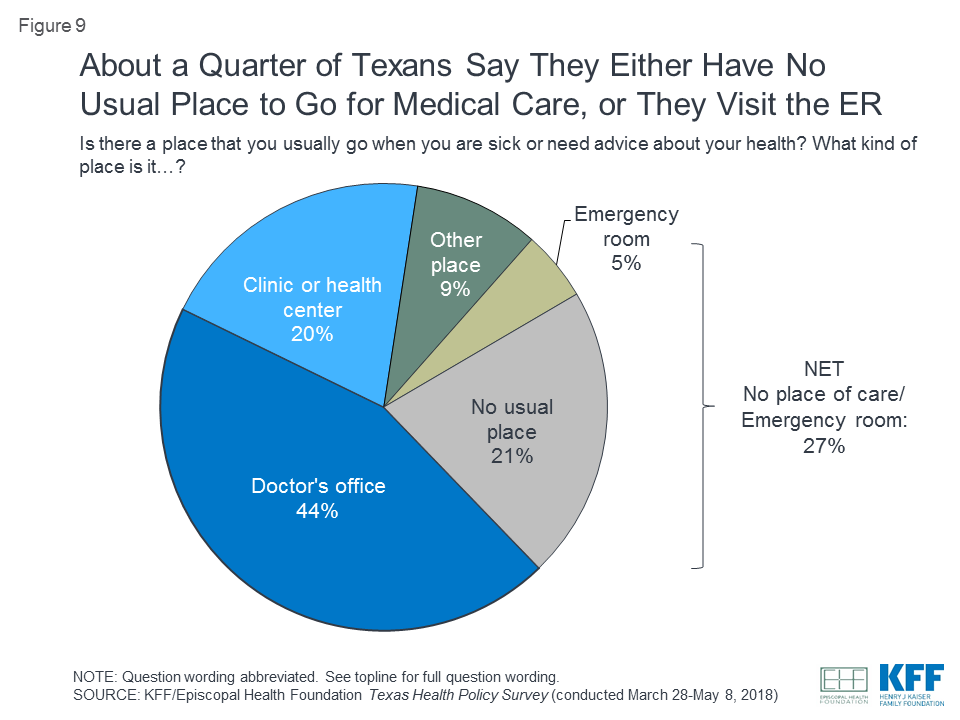
Beyond the cost of health care, access to providers can be a barrier to receiving needed medical care for some individuals. About a quarter of Texans say that there is either no place they usually go when they are sick or need advice about their health (21 percent), or the place they usually go to is a hospital emergency room (5 percent). About four in ten Texans (44 percent) say they usually go to a doctor’s office, while one in five say they visit a clinic or health center, and smaller shares report relying on another place of care such as an urgent care center or hospital outpatient department (Figure 9).
There are differences by race/ethnicity, income, and insurance status in the places where Texans report receiving their medical care. Lower-income adults, those without health insurance, and Black and Hispanic residents are more likely than their higher-income, insured, and white counterparts to say they don’t have a usual source of care or they rely on hospital emergency rooms. Hispanic adults and those with lower incomes are also more likely than other groups to report visiting a clinic or health center for their care (Table 1).
| Table 1: Usual Source of Care for Texans | |||||||
| Self-reported Income | Race/Ethnicity | Insurance Status(among age<65) | |||||
| <250% FPL | 250%+ FPL | White | Black | Hisp. | Insured | Uninsured | |
| Percent who have a usual place for medical care, besides emergency room (NET) | 72% | 86% | 84% | 82% | 67% | 84% | 56% |
| Doctor’s office | 32 | 56 | 55 | 43 | 27 | 50 | 15 |
| Clinic or health center | 23 | 17 | 15 | 19 | 28 | 20 | 24 |
| Urgent care/Outpatient/Other | 8 | 11 | 10 | 9 | 7 | 9 | 8 |
| Percent who have no usual place of care or usual place of care is emergency room (NET) | 36 | 16 | 19 | 29 | 38 | 20 | 53 |
| Emergency room | 8 | 1 | 4 | 10 | 5 | 4 | 10 |
| No place for care | 28 | 14 | 15 | 18 | 33 | 16 | 44 |
Even among Texans who have a place they usually go to when sick or in need of advice, difficulty traveling to this place can be a barrier for some. Overall, the large majority of Texans with a usual place for medical care say it is either “very easy” (61 percent) or “somewhat easy” (23 percent) to travel there, but 16 percent say it is “somewhat” (13 percent) or “very difficult” (3 percent). More vulnerable individuals, such as Texans with lower incomes, Medicaid enrollees, seniors, and those in fair or poor health are particularly likely to report difficulty traveling to the place they usually receive care. For example, among those with a usual place to go for medical care, Texans with self-reported incomes under 250 percent of the federal poverty level are three times as likely as higher-income residents to say it is difficult to travel to that place (25 percent versus 7 percent). And among Texans ages 18-64 with Medicaid coverage and those who report being in fair or poor health, roughly three in ten say it is difficult to travel to their place of care (Figure 10).
Methodology
The Kaiser Family Foundation/Episcopal Health Foundation Texas Health Policy Survey was conducted by telephone March 28 – May 8, 2018 among a random representative sample of 1,367 adults age 18 and older living in the state of Texas (note: persons without a telephone could not be included in the random selection process). Interviews were administered in English and Spanish, combining random samples of both landline (439) and cellular telephones (928, including 688 who had no landline telephone). Sampling, data collection, weighting and tabulation were managed by SSRS in close collaboration with Kaiser Family Foundation and Episcopal Health Foundation researchers. Episcopal Health Foundation paid for the costs of the survey fieldwork, and Kaiser Family Foundation contributed the time of its research staff. Both partners worked together to design the survey and analyze the results.
The sampling and screening procedures included an oversample component designed to increase the number of respondents ages 18-64 with Medicaid or non-group health insurance coverage. This included 180 respondents who were reached by calling back respondents in Texas who had previously completed an interview on either the SSRS Omnibus poll or the Kaiser Health Tracking Polls and indicated they fit one of the oversample criteria (based on age and type of health insurance coverage). It also included an oversample of counties with higher shares of Medicaid recipients.
The dual frame cellular and landline phone sample was generated by Marketing Systems Group (MSG) using random digit dial (RDD) procedures. All respondents were screened to verify that they resided in Texas. For the landline sample, respondents were selected by asking for the youngest adult male or female currently at home based on a random rotation. If no one of that gender was available, interviewers asked to speak with the youngest adult of the opposite gender. For the cell phone sample, interviews were conducted with the qualifying adult who answered the phone.
A multi-stage weighting design was applied to ensure an accurate representation of the Texas adult population. The first stage of weighting involved corrections for sample design, including accounting for oversampling of high-Medicaid counties, as well as non-response for the callback sample. In the second weighting stage, demographic adjustments were applied to account for systematic non-response along known population parameters. Population parameters included gender, age, race, Hispanicity (broken down by nativity), educational attainment, phone status (cell phone only or reachable by landline), state region, and residence in a low-income county. This stage excluded the Medicaid and non-group oversample components. Based on this second stage of weighting, estimates were derived for types of health insurance coverage (Medicaid, non-group, employer-sponsored, all else) in the Texas population. The last stage of weighting included all respondents and included health insurance coverage based on the previous stage’s outcomes. Weighting parameters were based on estimates from the U.S. Census Bureau’s March 2017 Current Population Survey (CPS), with the exception of population density of the respondent’s county of residence which was based on the 2010 Census, and telephone use (cell phone-only, landline-only, dual-user) which was based on data from the January-June 2016 National Health Interview Survey.
The margin of sampling error including the design effect for the full sample is plus or minus 3 percentage points. For results based on subgroups, the margin of sampling error may be higher. Sample sizes and margins of sampling error for subgroups are available by request. Note that sampling error is only one of many potential sources of error in this or any other public opinion poll. Kaiser Family Foundation public opinion and survey research is a charter member of the Transparency Initiative of the American Association for Public Opinion Research.
Endnotes
- Kaiser Family Foundation estimates based on the Census Bureau’s March Current Population Survey (CPS: Annual Social and Economic Supplements), 2014-2017, https://modern.kff.org/other/state-indicator/adults-19-64/ ↩︎
- Kaiser Family Foundation, Where Are States Today? Medicaid and CHIP Eligibility Levels for Children, Pregnant Women, and Adults, March 2018, https://modern.kff.org/medicaid/fact-sheet/where-are-states-today-medicaid-and-chip/ ↩︎
- See, for example, Marks E, Sim S, Ho V, and Balihe P, Health Reform Monitoring Survey – Texas Issue Brief #17: Affordability of Health Services among Non-Elderly Texas Adults, Rice University’s Baker Institute and Episcopal Health Foundation, January 2016, http://www.episcopalhealth.org/files/4614/5211/2043/Issue_Brief_17_FINAL.pdf and DiJulio B, Kirzinger A, Wu B, and Brodie M, Data Note: Americans’ Challenges with Health Care Costs, Kaiser Family Foundation, March 2017, https://modern.kff.org/health-costs/poll-finding/data-note-americans-challenges-with-health-care-costs/ ↩︎
- See, for example, Marks E, Sim S, Ho V, and Balihe P, Health Reform Monitoring Survey – Texas Issue Brief #18: Why were 20% of Adult Texans Uninsured in 2015?, Rice University’s Baker Institute and Episcopal Health Foundation, January 2016, http://www.episcopalhealth.org/files/1514/5392/5799/Issue_Brief_18_FINAL.pdf and DiJulio B, Firth J, Hamel L, and Brodie M, Kaiser Health Tracking Poll: November 2015, Kaiser Family Foundation, November 2015, https://modern.kff.org/health-reform/poll-finding/kaiser-health-tracking-poll-november-2015/ ↩︎