What We Know So Far About 2026 ACA Marketplace Enrollment, Premiums, and Deductibles
The enhanced premium tax credits established by the American Rescue Plan in 2021 and extended through 2025 by the Inflation Reduction Act significantly expanded Affordable Care Act (ACA) Marketplace affordability, driving enrollment to record highs. When those enhancements expired at the end of 2025, premium payments rose sharply for many enrollees, particularly those with incomes above 400% FPL who had been newly eligible for subsidies under the enhanced credits.
This analysis draws on data from the Centers for Medicare & Medicaid Services (CMS) and state-based Marketplace (SBM) Open Enrollment reports, as well as KFF survey data and individual market enrollment estimates from Wakely Consulting Group, to examine early indicators of how the expiration of enhanced premium tax credits has affected effectuated enrollment levels (i.e., enrollment among people who have paid their premiums), plan selections, and out-of-pocket costs in 2026.
Key Findings
- Based on reports to date of sign-ups and premium payments, average monthly effectuated ACA Marketplace enrollment could fall to about 17.5 million people in 2026 and could be as low as 16.5 million people, down from 22.3 million people in 2025.
- A disproportionately large share of the drop in sign-ups (27%) is among people with incomes just above the “subsidy cliff” (between 400%-500% FPL), despite this group making up just 3% of plan selections in 2025.
- Premium payments from enrollees increased by an average of 58% from $113 to $178 per month. This is lower than the 114% increase KFF projected if everyone had stayed in the same plan because many people bought down to higher-deductible plans and because those just past the subsidy cliff with the steepest increases dropped ACA coverage at higher rates. Additionally, the 114% increase was among people receiving a tax credit whereas the 58% increase is among all consumers, including the most number who did not receive a tax credit in 2025.
- Average ACA Marketplace deductibles increased by 37% (or $1,027 per person) to a record high of $3,786 in 2026. This is the steepest increase in deductibles ever seen in this market and largely reflects the shift from silver plans with reduced deductibles for lower-income enrollees to bronze plans with very high deductibles.
How Many People Are Leaving the ACA Marketplace?
Plan sign-ups fell by over a million to 23.1 million people during the 2026 Open Enrollment Period, the sharpest single-year drop since the ACA Marketplaces launched. However, Open Enrollment plan selection data alone do not capture the full scope of coverage loss — they measure how many people chose a plan or were automatically renewed, not how many ultimately paid their premiums for their coverage. Effectuated enrollment (the number of people who pay premiums and maintain effective coverage) is expected to fall even further than previous years as 2026 unfolds and many enrollees are unable to afford higher premium payments without enhanced tax credits, signaling significant mid-year attrition on top of already declining sign-ups.
According to an analysis of proprietary data on January premium payments by Wakely Consulting Group, approximately 86% of January 2026 enrollees in the individual market (of which over 90% was through ACA Marketplaces in 2025) paid their first month’s premium, with considerable variation across states. State-based exchanges, many of which have their own premium subsidy programs and more robust outreach efforts, tended to retain higher shares of enrollees than federally-facilitated exchanges.
Accounting for unpaid premiums, mid-year attrition, and other factors, Wakely estimates that average effectuated enrollment in the individual market could decline by between 17% and 26% in 2026 compared to the number of people who had effectuated coverage in 2025.
If applied to the ACA Marketplaces (which represent the vast majority of the individual insurance market in 2025), Wakely’s estimated enrollment decline could translate to an average of about 17.5 million enrollees over the course of 2025, which would represent a potential drop of 4.8 million people from the Marketplaces relative to 2025. To arrive at this estimate, the midpoint value of the range Wakely projects for individual market enrollment to decline by (21.5%) was applied to the average effectuated enrollment in the ACA Marketplace for the first 7 months of 2025. The low and high ends of the grey region in Figure 1 represent estimated effectuated enrollment if the endpoints of the range estimate (17% and 26%, respectively) were applied, ranging from a drop of 3.8 to 5.8 million.
Several other sources of information also point to a sharp decline in ACA effectuated enrollment associated with the expiration of enhanced premium tax credits. A decline of effectuated enrollment to 17.5 million aligns closely with the Congressional Budget Office’s previous projection of a roughly 25% ACA Marketplace contraction in enrollment following the expiration of the enhanced premium tax credits. CBO had projected average monthly ACA Marketplace enrollment of 16.9 million for 2026. Federal data reported on by NOTUS indicated a similarly steep increase in cancellations and terminations due to nonpayment, with about 19 million enrollees in the weeks following Open Enrollment.
Moreover, a KFF survey fielded in late February and early March of 2026 showed that 9% of 2025 Marketplace enrollees had become uninsured, 4% of returning ACA Marketplace enrollees had not yet paid their first month’s premiums, and that one in six (17%) returning enrollees were not confident they could afford their premiums for the entire year.
Recently published data from California, the nation’s largest state-based Marketplace, indicate that the cancellation rate among consumers who renewed coverage increased roughly six percentage points from 2025 such that nearly one in five renewing consumers actively terminated their plans before the end of March or had their coverage cancelled due to nonpayment.
Some states, like Maryland, expect that in the coming months, high premium payments will prompt even more people to either actively cancel their plans or be terminated due to nonpayment of premiums. These cancellations, whether active or passive, will drive a gap between the number of plan sign-ups and effectuated coverage.
Who Dropped ACA Marketplace Coverage?
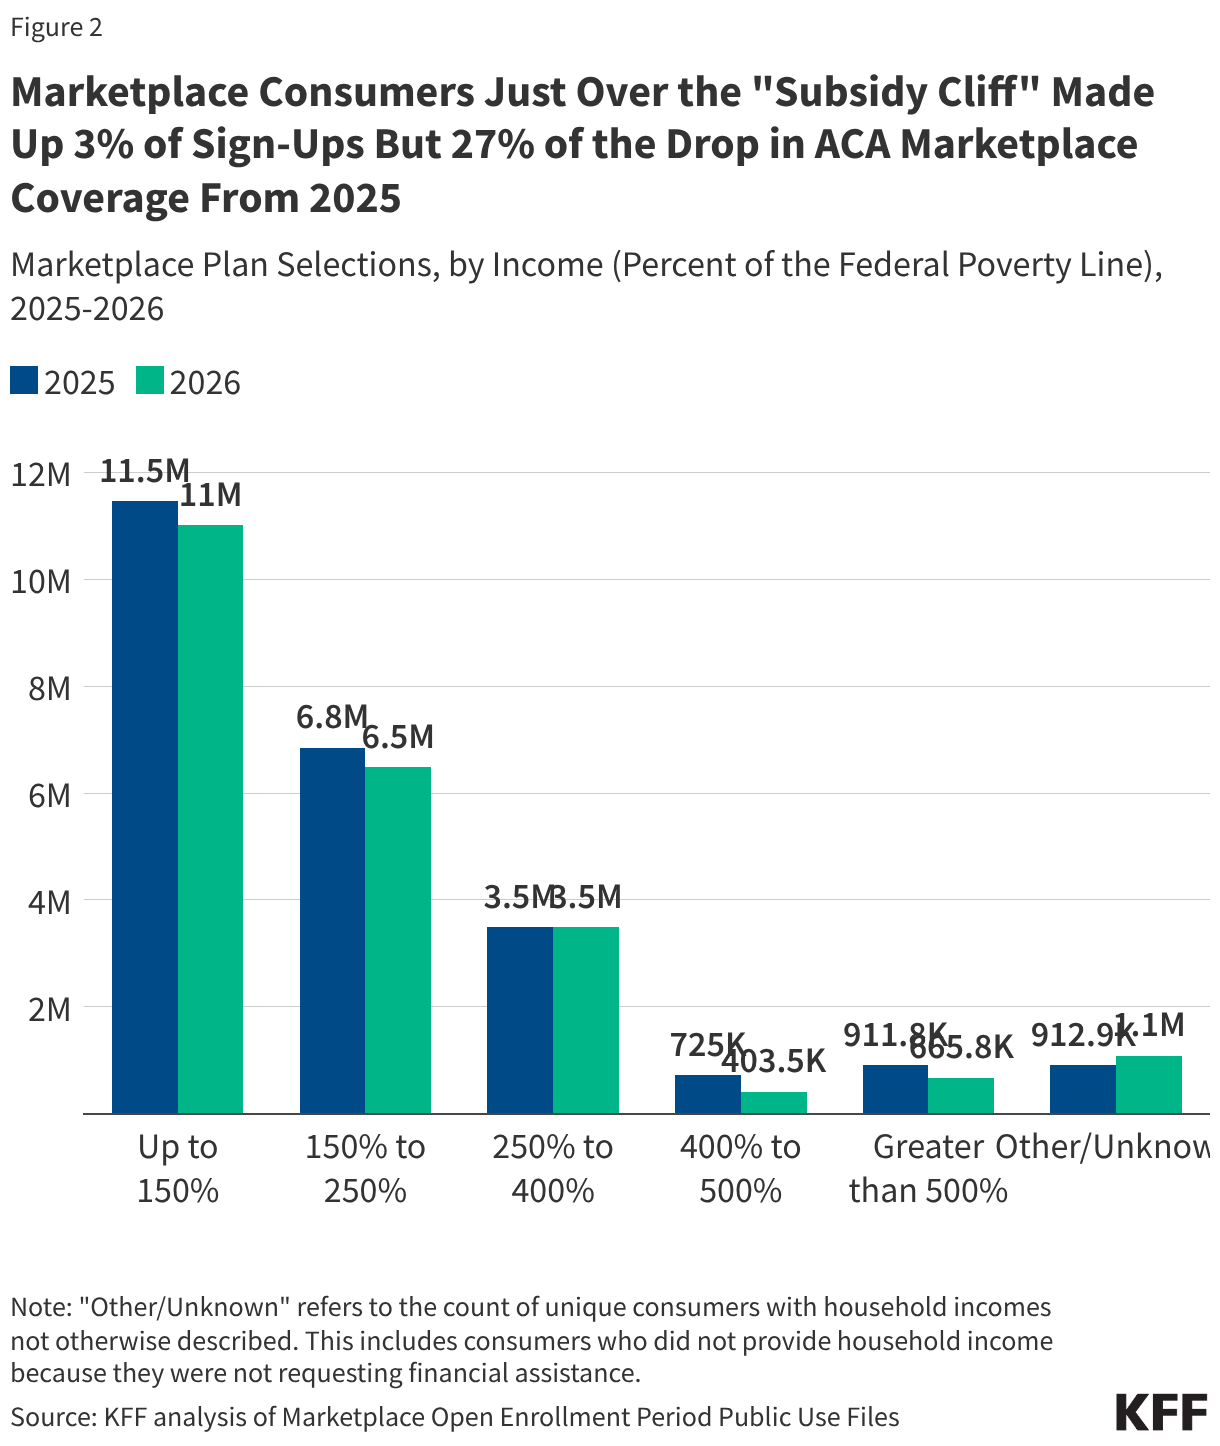
While there is no publicly available effectuated enrollment data broken out by income, the plan selection data indicate that a large share of the drop in ACA Marketplace coverage is among consumers above 400% of the federal poverty level (FPL), where eligibility for premium tax credits ends (“subsidy cliff”). Under the enhanced premium subsidies, people with incomes above 400% of the poverty level had their premium payments for a benchmark silver plan capped at 8.5% of income. People with incomes above 400% up to 500% FPL, who represented just 3% of 2025 sign-ups, accounted for 27% of the drop in sign-ups from 2025 to 2026. Plan sign-ups for this group fell by 44% (over 321,000 people). Those with incomes above 500% FPL accounted for an additional 21% of the difference.
Overall, consumers with incomes known to be above the subsidy cliff made up just 7% of 2025 enrollment but nearly half (48%) of the decline in plan selections from 2025 to 2026. (There are about 1 million consumers for whom household income is unknown, so the actual share of consumers who are above the subsidy cliff may be higher.)
Lower-income consumers, who continue to receive financial assistance but still saw increases in their premium payments with the expiration of the enhanced tax credits, dropped ACA Marketplace coverage at lower rates. Still, they account for a large share of the decline in sign-ups. Sign-ups for those with incomes below 150% FPL — the largest income group in the Marketplace — fell by roughly 441,000 people (a 4% drop from 2025), accounting for 37% of the decline. Those with incomes greater than 150% and up to 250% FPL accounted for 30% of the drop in ACA Marketplace coverage. Plan selections among consumers with incomes above 250% up to 400% FPL was roughly flat, as losses among the 250 to 300% FPL group were largely offset by gains among the 300 to 400% FPL group.
Declines in plan sign-ups for young adults ages 18 to 34 account for more of the decrease in ACA Marketplace plan selections than any other age group. This is in line with expectations detailed in insurer rate filings from last year, which reported that the expiration of the enhanced premium tax credits would cause younger adults, who are typically healthier, to leave the Marketplace. Sign-ups in this age group declined by 542,000, or 8%, from 6.7 million people in 2025 to 6.2 million people in 2026, comprising 46% of the total decline in ACA Marketplace sign-ups.
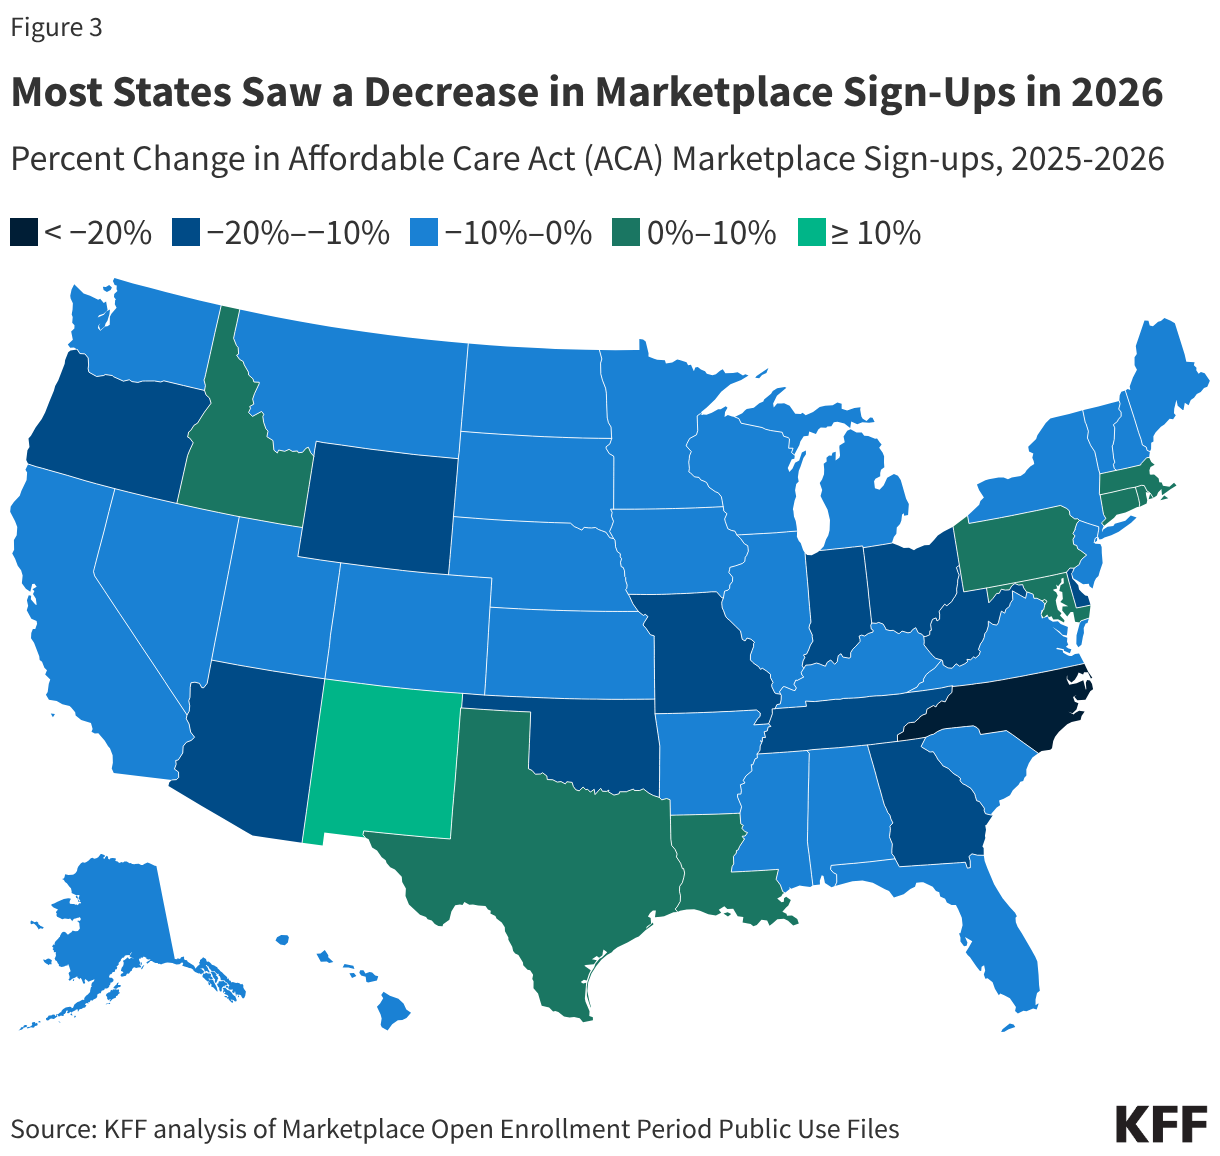
Marketplace plan selections declined in 41 states in 2026. In percentage terms, plan selections fell the most in North Carolina (22%), Ohio (20%), West Virginia (17%) and Indiana, Delaware, and Arizona (all 16%).
A smaller number of states saw stable or modestly increasing sign-ups, in some cases reflecting state-specific policy decisions that helped offset the loss of enhanced federal premium tax credits. Notably, New Mexico experienced an 18% increase in plan selections, likely due in part to the state’s supplemental financial assistance program, which temporarily backfills the entirety of the lost federal premium assistance.
Increases in Premium Payments
In 2026, the average monthly premium payment among consumers net of tax credits (including those who did not receive premium tax credits) rose 58% from $113 to $178 in 2025. With the expiration of enhanced premiums tax credits, KFF previously estimated that premium payments would increase by 114% on average for subsidized ACA Marketplace enrollees to keep their same plan in 2026. However, as discussed more below, many Marketplace enrollees bought down to bronze plans (with lower premiums and higher deductibles). Additionally, people with the steepest increases in premiums — those who lost eligibility for tax credits entirely — appear to have left the market at a disproportionately high rate.
At the same time, the share of people receiving premium tax credits fell from 92% in 2025 to 87% in 2026, the first decline in subsidy uptake since 2020. This is due, in part, to the loss of financial assistance eligibility for people making greater than 400% of poverty and the relatively large exodus from the market among people with incomes over this amount, who would have faced some of the largest premium increases if they had remained in the market.
Increase in Deductibles
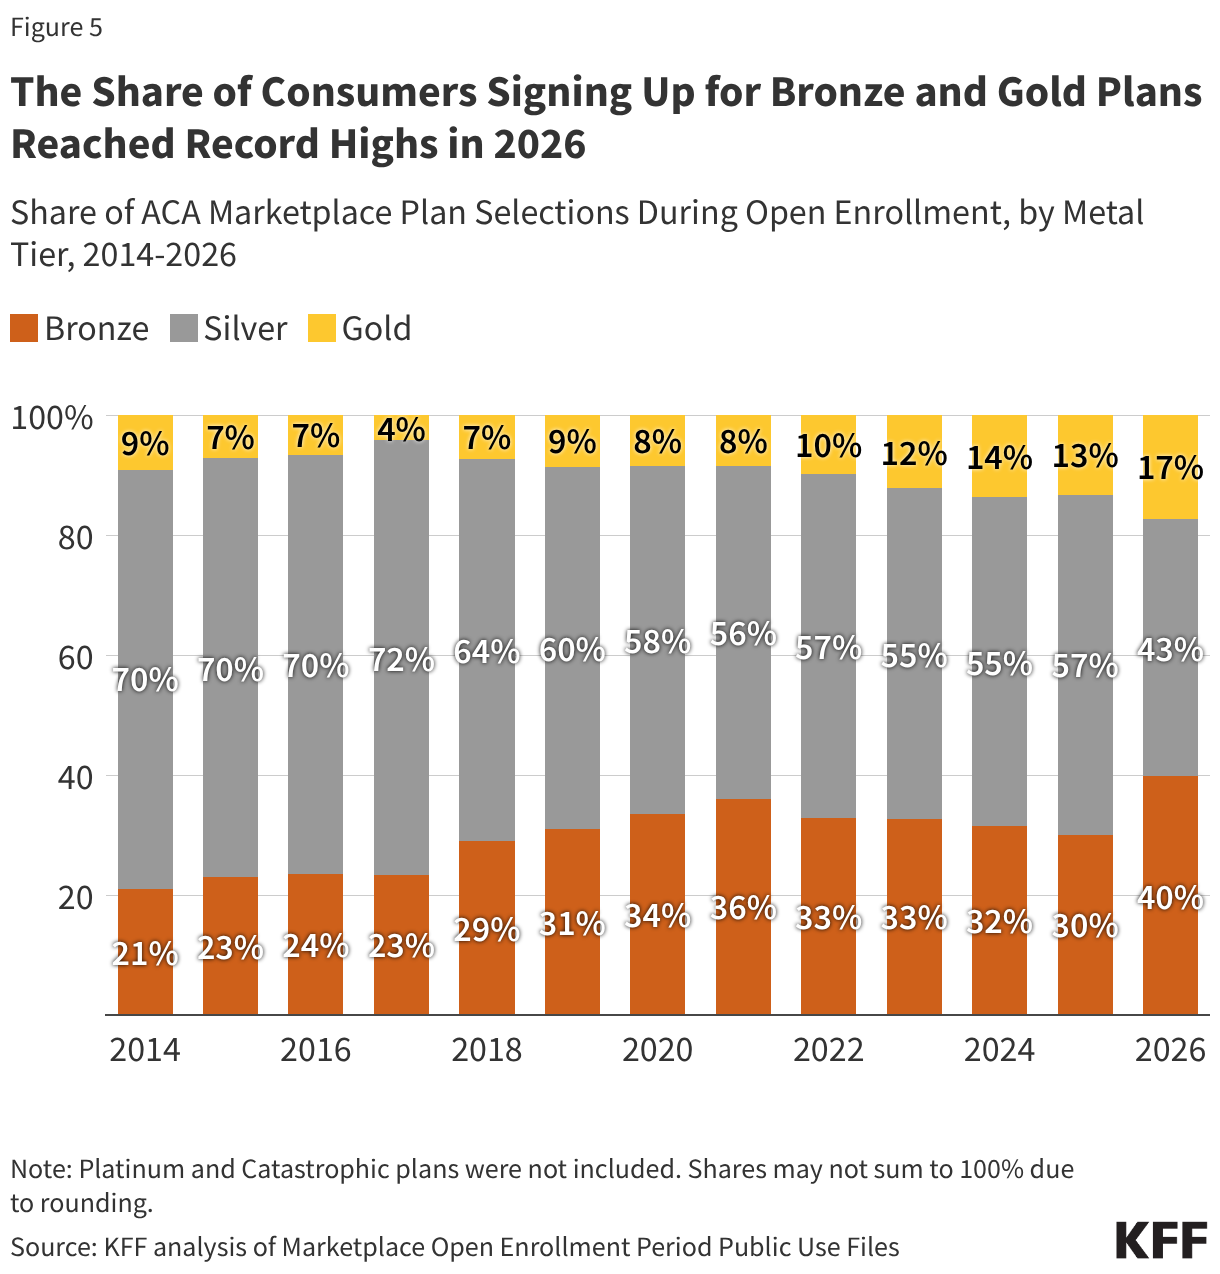
To offset these increases in premium payments with the expiration of enhanced premium tax credits, a number of consumers switched to bronze plans, which have lower premiums but higher deductibles. The share of people selecting bronze plans increased from 30% (7.3 million people) in 2025 to 40% (9.2 million people) in 2026, while the share selecting gold plans rose from 13% (3.2 million people) to 17% (4.0 million people). Meanwhile, the share of ACA marketplace consumers selecting a silver plan fell from 57% (13.7 million people) to 43% (9.8 million people), marking a record low and the first time fewer than half of ACA consumers have selected a silver plan.
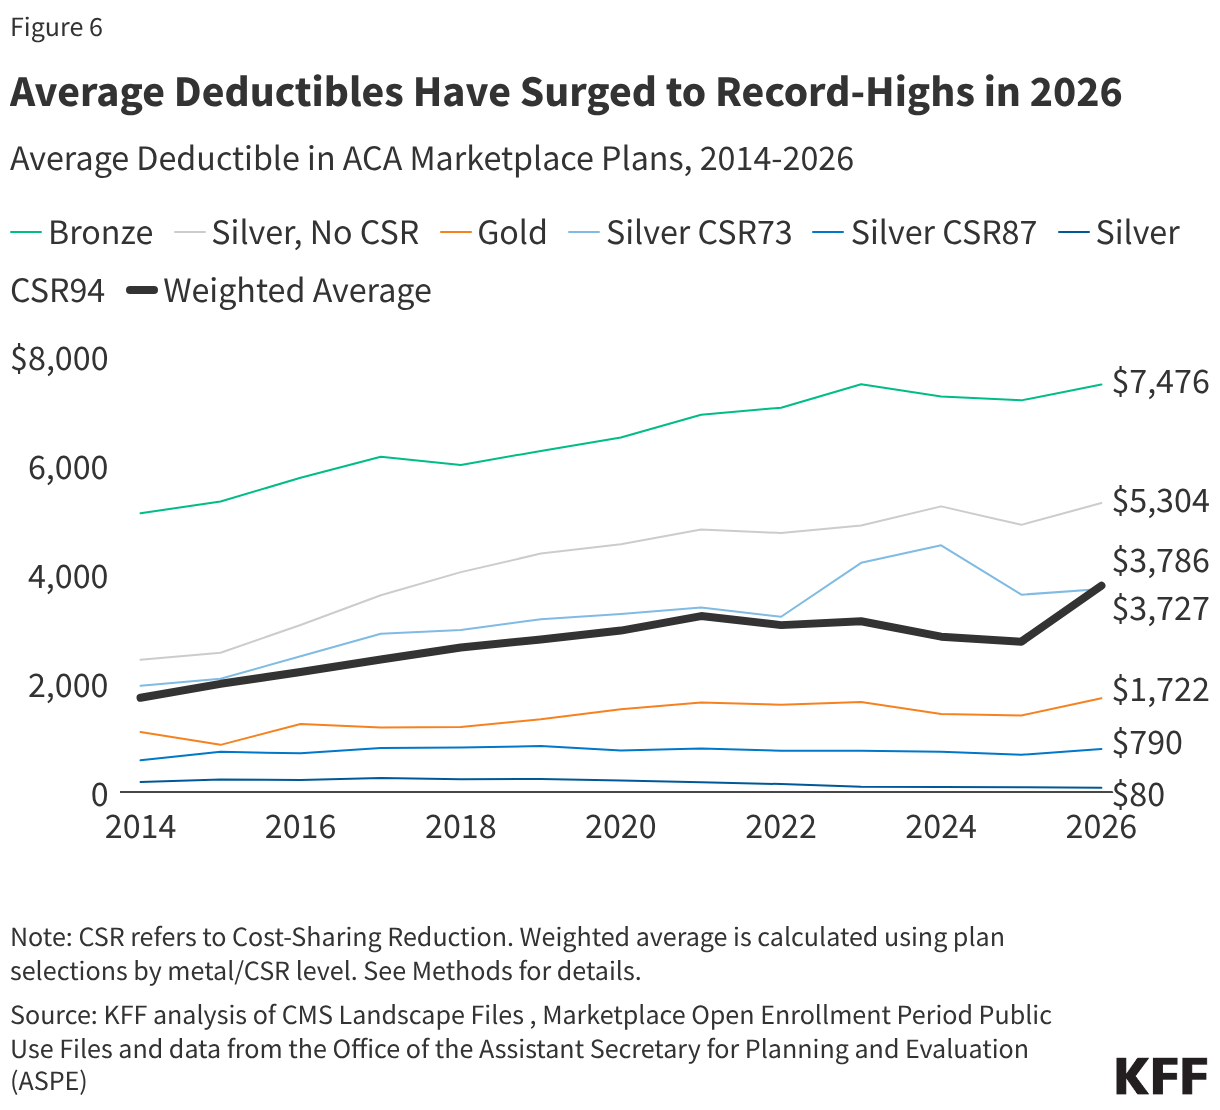
With more people signing up for bronze plans than ever before, average deductibles in the ACA Marketplaces are rising. From 2025 to 2026, the average deductible in the ACA Marketplaces has grown by over a thousand dollars per person, a 37% increase, from $2,759 to $3,786. This marks the steepest increase ever in the average Marketplace deductible since the markets launched in 2014. For context, if the distribution of plan selections across metal levels had stayed the same as in 2025, the average Marketplace deductible would have gone up just 6% (to $2,912).
The lowest income Marketplace enrollees (100-250% FPL) also qualify for cost-sharing reductions (CSRs), which lower their out-of-pocket costs (deductibles, copayments, and coinsurance) when paying for health care services if they enroll in silver plans. These CSR plans are offered on a sliding scale, such that those with lower incomes receive more assistance. The average silver deductible available to a person making up to 150% of poverty is $80, compared to $5,304 for the standard silver plan. Previously, with enhanced premium tax credits, silver plans enrollees in this low-income group could get a silver plan with a $0 monthly premium payment. After the expiration of enhanced tax credits, an enrollee would now pay 4.19% of their income, or about $82 a month for a single person at 150% of poverty to keep that low-deductible silver plan.
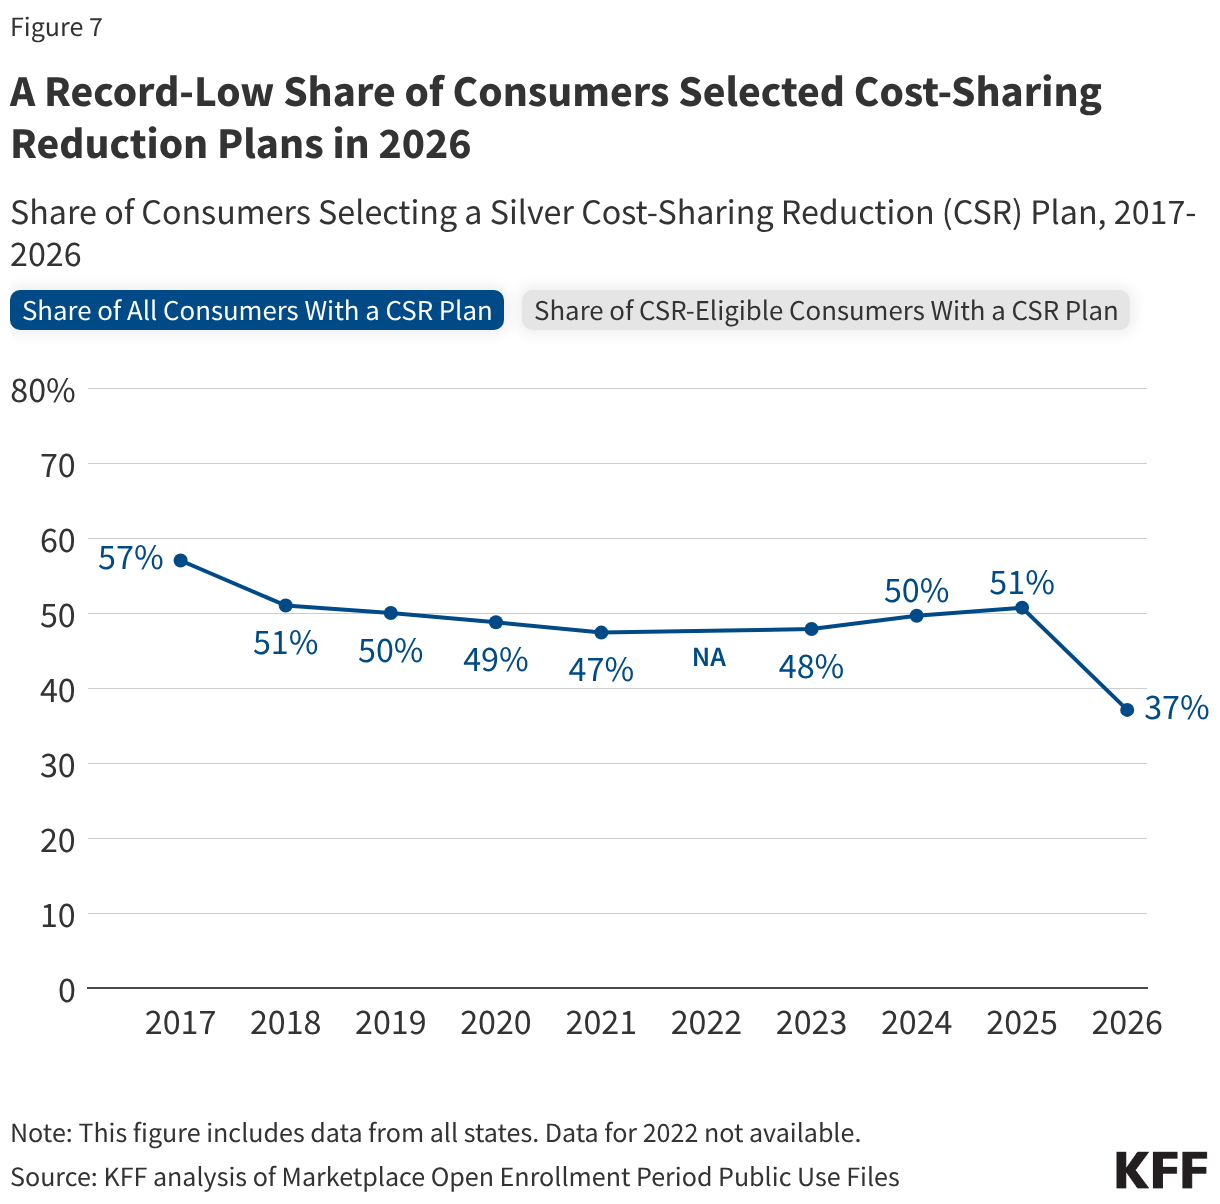
The share of all Marketplace consumers selecting a cost-sharing reduction (CSR) plan fell to its lowest level on record in 2026 (37%). Available data suggests that people are choosing non-CSR plans despite having the income to be eligible for this financial assistance. In 2025, 66% of people in states using the federal platform who were eligible for CSRs signed up for a silver CSR plan. But in 2026, the share of eligible consumers in Healthcare.gov states who selected a CSR plan fell to 45%.
A More Complete Picture is Still to Come
All the information available so far on the demographics of people who left the ACA Marketplace and the increase in premium payments and deductibles is based on plan selections, not effectuated enrollment. Even among those who do effectuate coverage, some could lose it during the year if they cannot afford to continue their premium payments. When CMS publishes effectuated enrollment data later this year, it will include only aggregate counts — without the demographic and plan-level breakdowns available in the plan selection files. Additionally, a grace period was available for returning enrollees to have until late March to make their premium payments, and CMS effectuated enrollment data fully reflecting that grace period may not be available for another year. As a result, a complete picture of how the expiration of enhanced premium tax credits reshaped who has coverage and what kind of plan they hold may not be available for some time.
Methods
This analysis used plan selection and effectuated enrollment data from the Centers for Medicare & Medicaid Services (CMS) and state-based Marketplace (SBM) Open Enrollment reports for plan selections (sign-ups). The estimate of the potential loss in ACA effectuated enrollment (Figure 1) references the report “Who Paid, and Who Stayed? Early 2026 Enrollment Trends in the Individual Market” produced by the Wakely Consulting Group. ACA effectuated enrollment values reflect average monthly effectuated enrollment estimates over the full year for 2017-2024 and over the first seven months for 2025. Potential 2026 enrollment was estimated by applying the midpoint of Wakely Consulting Group’s estimates of reduction in individual market enrollment to average 2025 Marketplace effectuated enrollment. Blue dots represent high and low estimates of effectuated enrollment. Wakely’s estimate may understate enrollment decline in the Marketplaces if a higher share of off-Exchange enrollees pay their January premiums.
Changes in sign-ups by income (Figure 2) and state (Figure 3) were extracted from Open Enrollment Public Use Files. The “Other/Unknown” income category refers to the count of unique consumers with household incomes not otherwise described. This includes consumers who did not provide household income because they were not requesting financial assistance. Trends in average premium (net of tax credits) and share of consumers with advanced premium tax credits (APTC) were taken from the CMS Health Insurance Exchanges 2026 Open Enrollment Report. Average premium payment includes those who signed up both with and without APTC. Distribution of metal level (Figure 5), sourced from the Open Enrollment Period Public Use Files and data from the Office of the Assistant Secretary for Planning and Evaluation (ASPE), does not include platinum and catastrophic plans, which each had <1% of plan selections in 2026. Shares may not sum to 100% due to rounding.
Average deductible over time by plan type (Figure 6) trends the individual medical deductible in plans with combined medical and prescription drug deductibles for only plans offered in the federally facilitated Marketplace, with plan design information from the Medical Individual Market file of the QHP Landscape Files. Plans included were not adjusted for states transitioning to state-based exchanges. First, simple averages over distinct plans were calculated within each metal level (or CSR variant) and were not weighted by plan enrollment. A distinct plan was defined by having a unique state, issuer, metal level, and cost-sharing design combination. In 2014 and 2015, a distinct plan took into consideration the plan marketing name. “Expanded bronze” and “bronze” plans were combined; catastrophic and platinum plans were excluded from analysis. Second, the weighted average was calculated using plan selection data at the metal and CSR (or FPL) level from Marketplace Open Enrollment Period Public Use Files and ASPE data. Share of CSR and non-CSR variants among those selecting silver plans for 2017 and earlier were from the 2017 Open Enrollment income distribution among silver plan selections; consumers selecting a silver plan with income ≥100% to ≤150% of FPL , >150% to ≤200% of FPL , and >200% to ≤250% of FPL were assumed to have selected CSR94, CSR87, and CSR73 variants, respectively. All other years, including 2026, used plan selection, metal level, and CSR distributions from that year.
The share of CSR-eligible consumers with a CSR plan (Figure 7) was calculated from Open Enrollment Public Use Files. While the overall share of consumers with a silver CSR plan includes all states, the share of eligible consumers that signed up for a CSR plan pertains to states using the federally facilitated exchange that year, without adjustment for states transitioning to state-based exchanges.