Medicare

New & Noteworthy

Data Visualization

The Facts About Medicare Spending

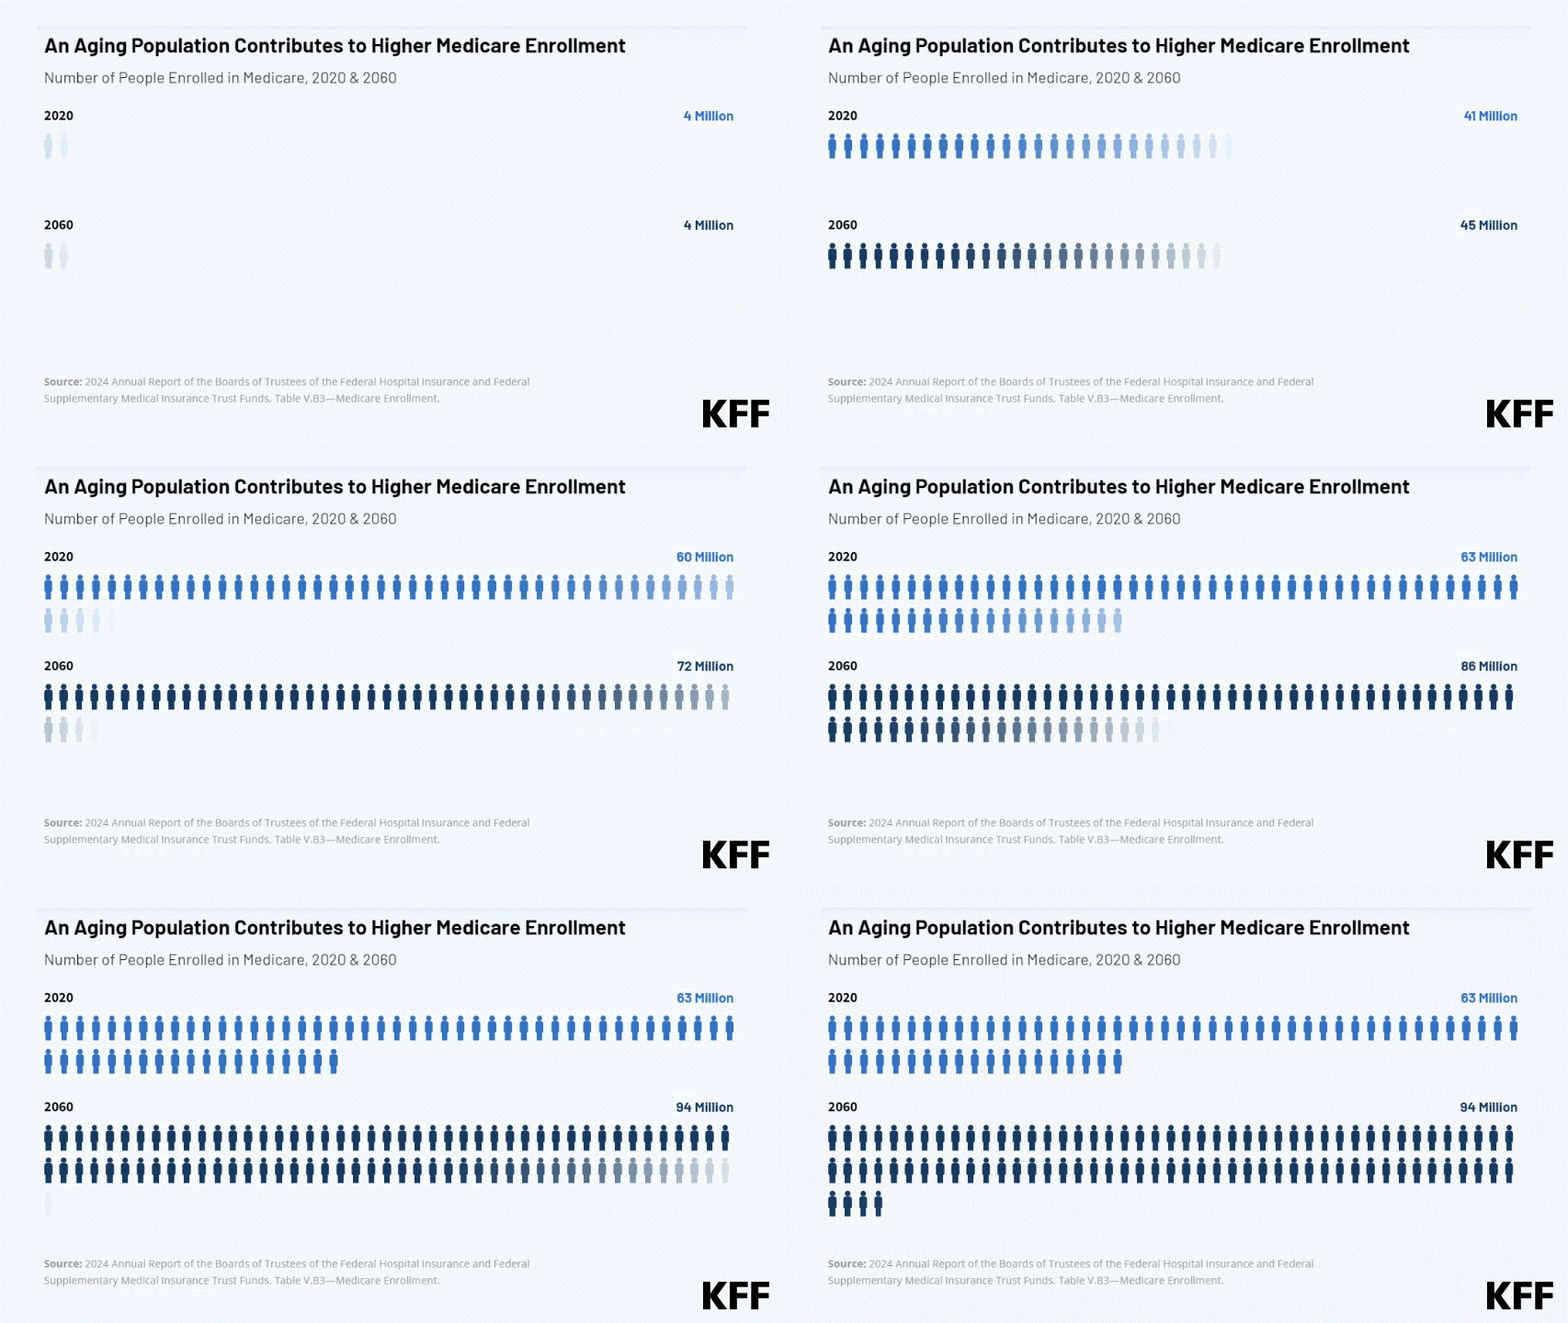
This interactive provides the facts on Medicare spending. Medicare, which serves 67 million people and accounts for 12 percent of the federal budget and 21 percent of national health spending, is often the focus of discussions about health expenditures, health care affordability and the sustainability of federal health programs.

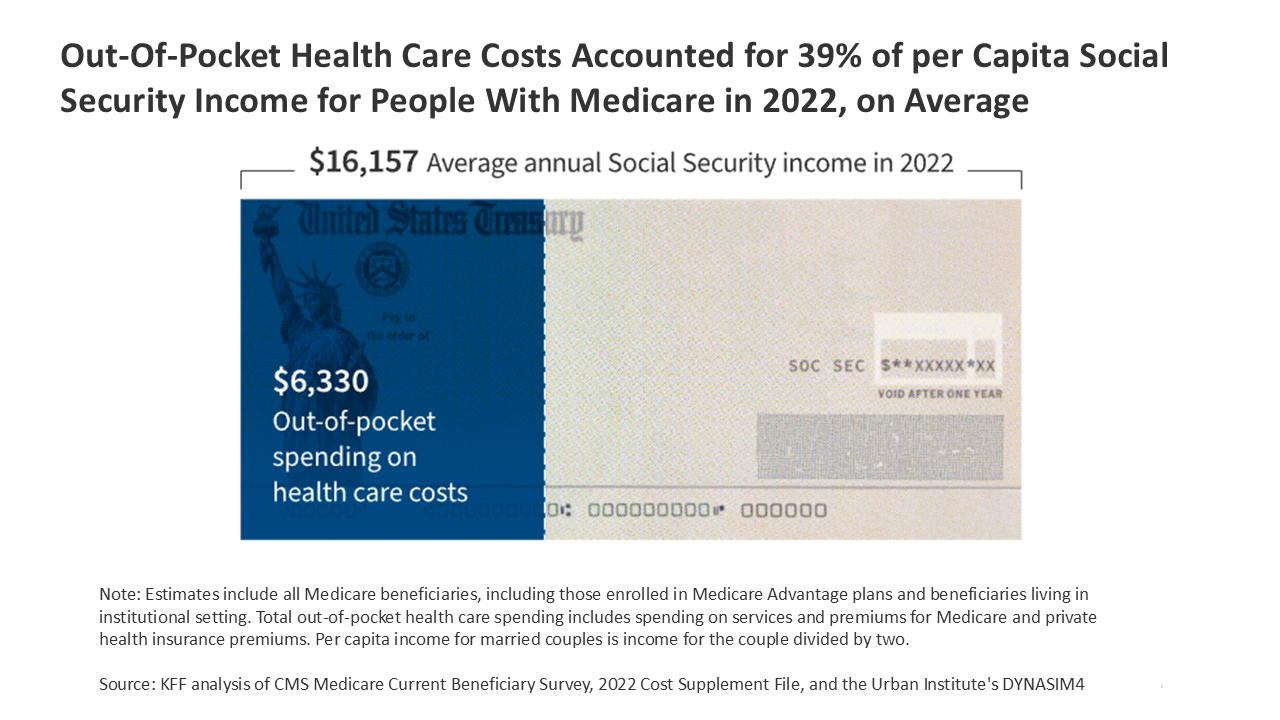
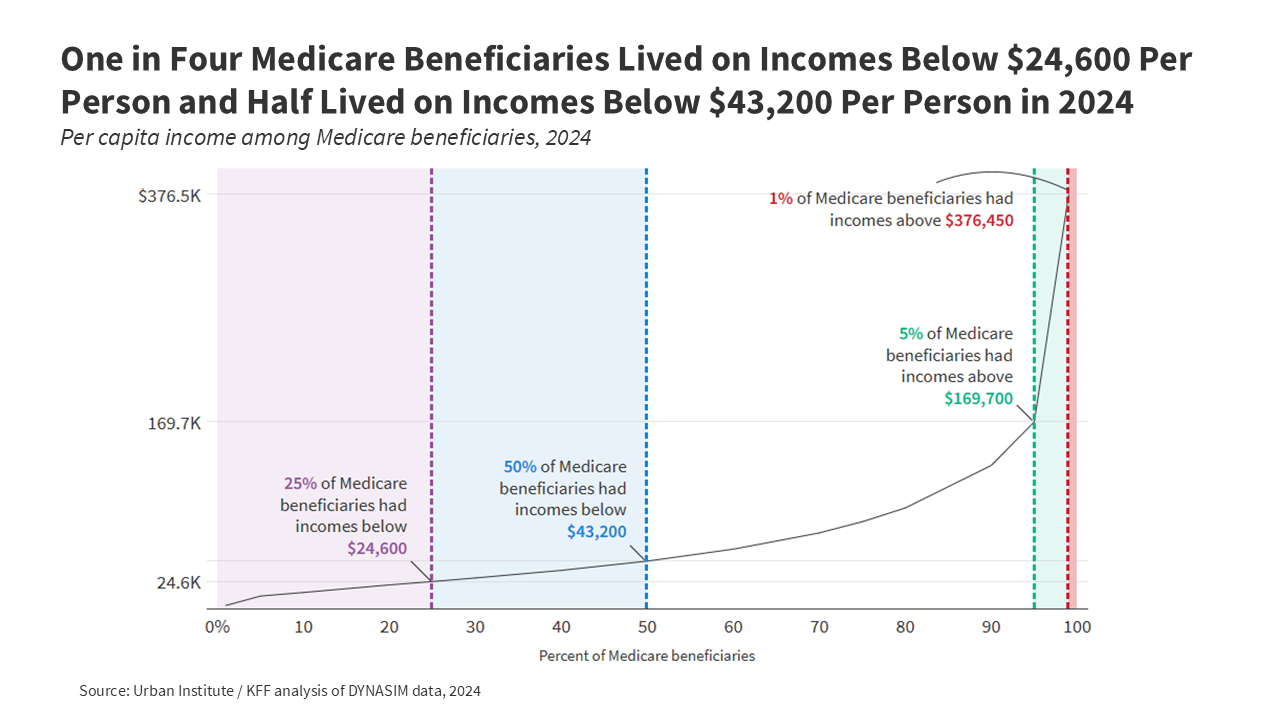
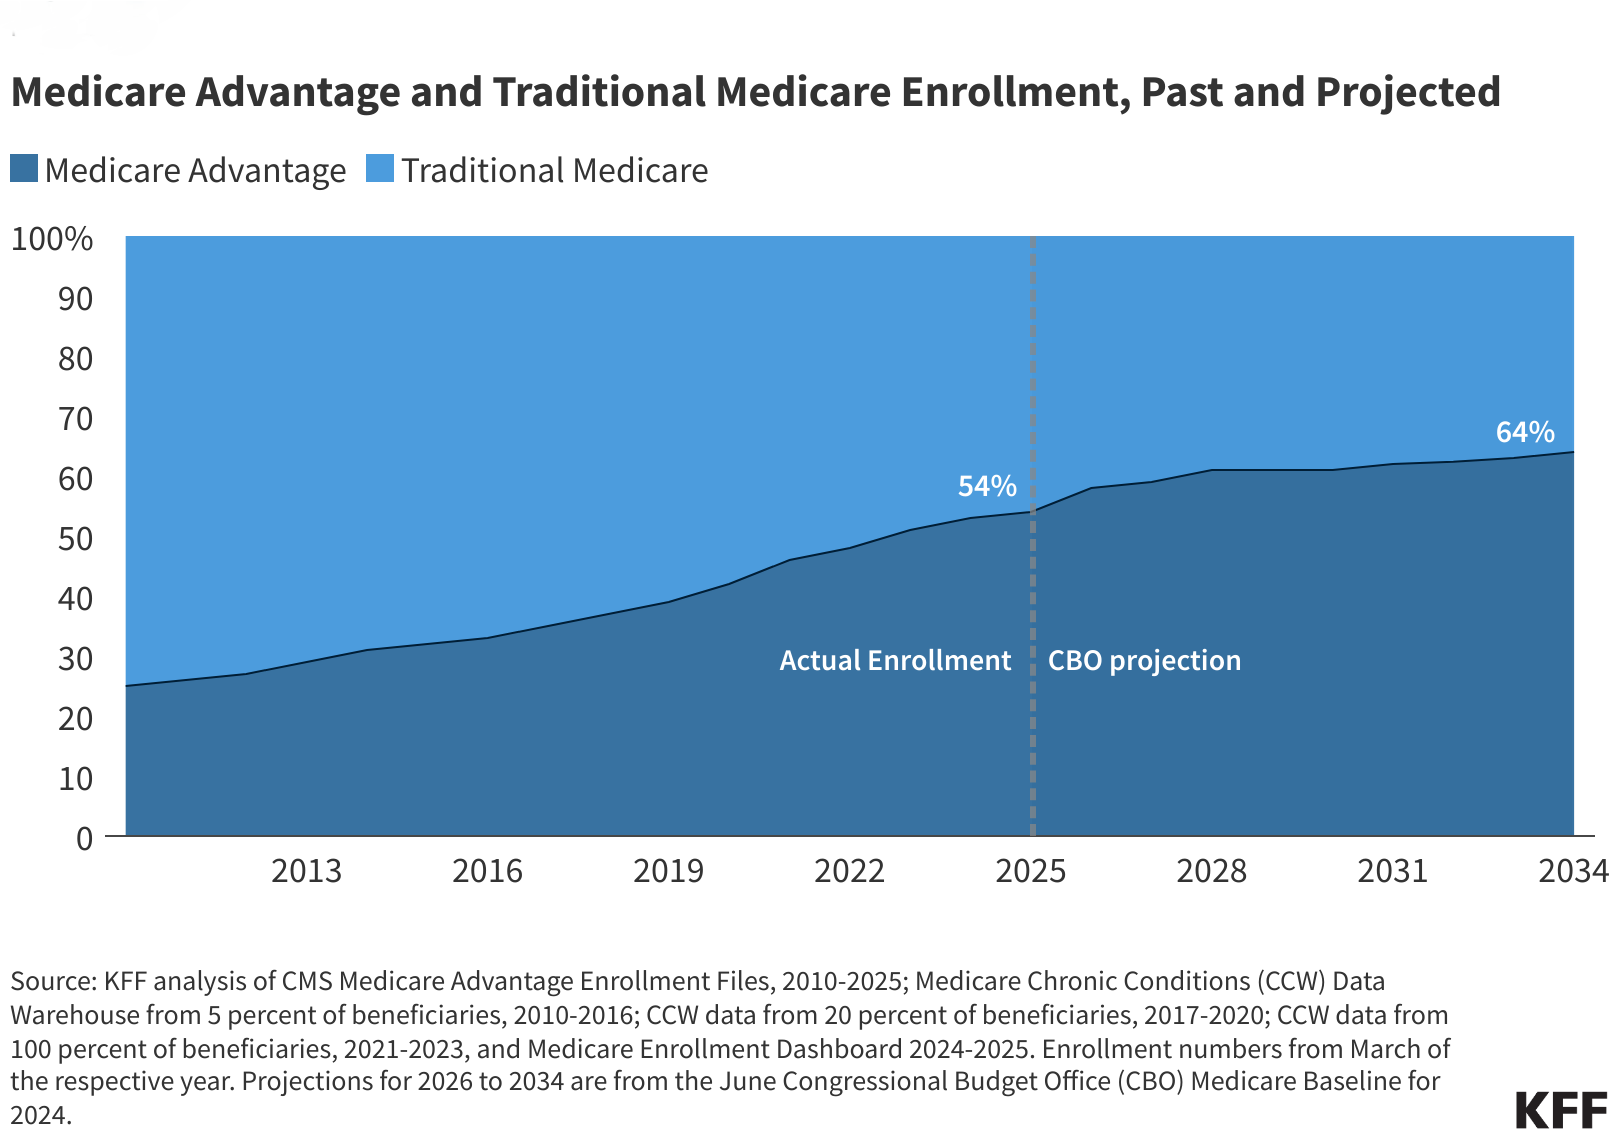
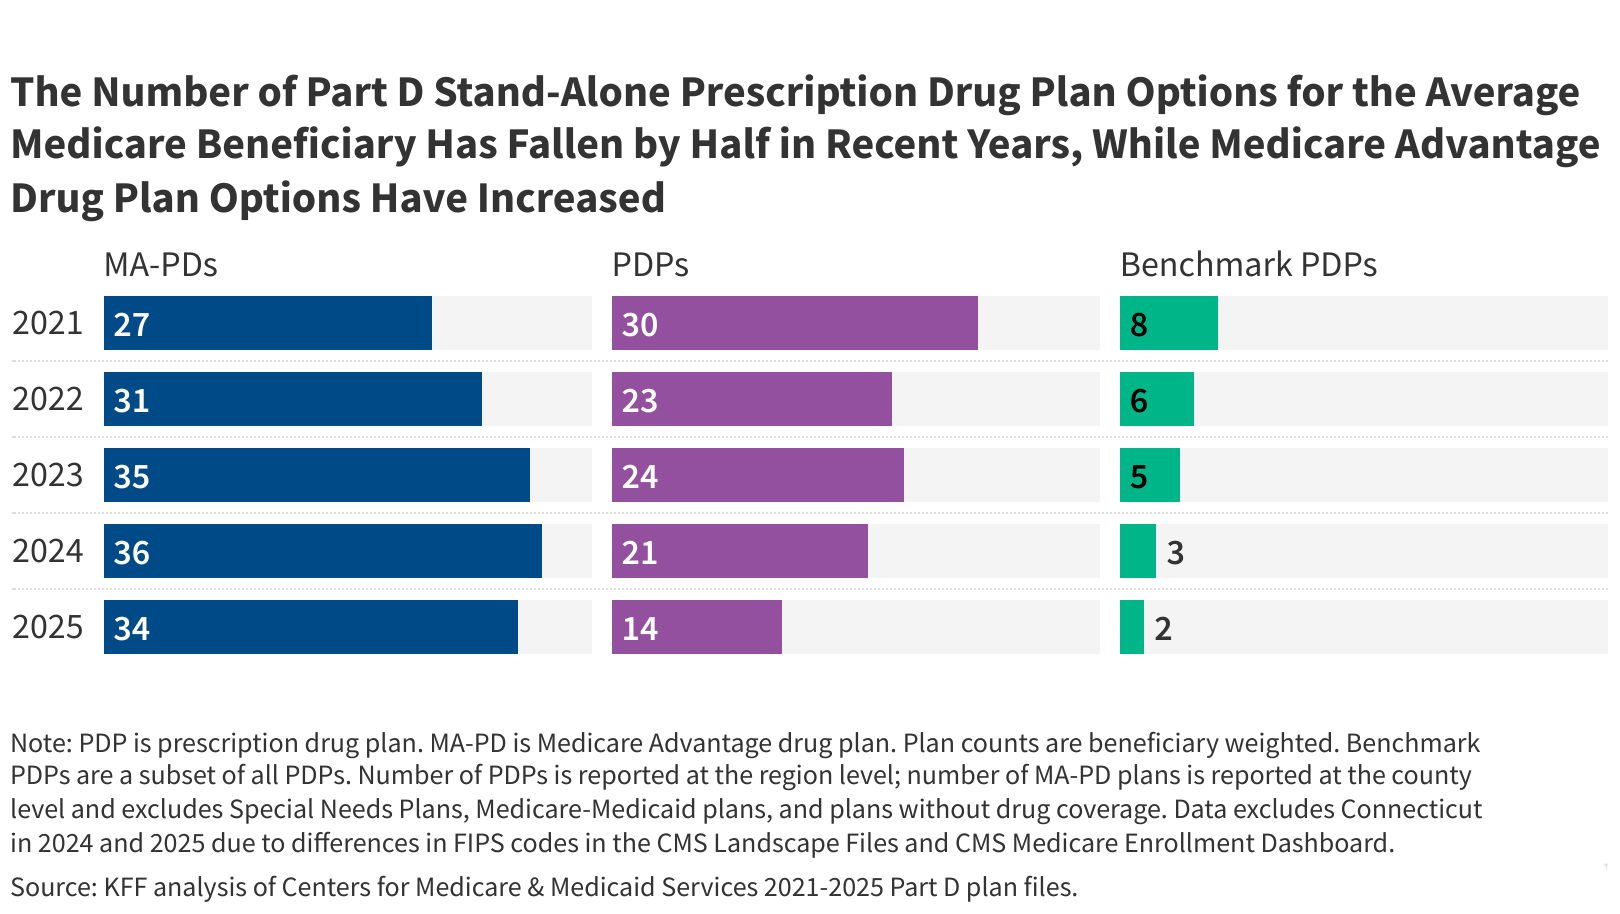
Explore data on enrollment growth, Medicare spending trends overall and per person, growth in Medicare spending relative to private insurance, spending on benefits and Medicare Advantage, Part A trust fund solvency challenges, and growth in out-of-pocket spending by beneficiaries.

Related: FAQs on Medicare Financing and Trust Fund Solvency

Read More

Subscribe to KFF Emails

Choose which emails are best for you.
Sign up here

Filter

891 - 900 of 1,568 Results

  • What’s in the Administration’s 5-Part Plan for Medicare Part D and What Would it Mean for Beneficiaries and Program Savings?

    Issue Brief

    With rising concern over increases in prescription drug costs, the Trump Administration has proposed what it calls a “5-part plan” that would change several features of the Medicare Part D drug benefit. This brief describes the Administration’s five Part D proposals and discusses the potential implications for people with Part D prescription drug coverage and Medicare program spending, based on estimates from the Congressional Budget Office.

  • JAMA Forum: Medicare-For-All or Medicare-For-More?

    Perspective

    In this May 2019 post for The JAMA forum, Larry Levitt examines how the early discussion and positioning among the presidential candidates offers a glimpse into how a debate about Medicare-for-all might play out.

  • Visualizing Health Policy: The Role of Medicare Advantage

    News Release

    This Visualizing Health Policy infographic provides a snapshot of the role of Medicare Advantage plans, an alternative to traditional Medicare, including information about the proportion of Medicare beneficiaries who are enrolled in Medicare Advantage plans, geographic differences in Medicare Advantage penetration, the trend of increasing enrollment in Medicare Advantage plans, and the concentration of enrollment…

  • Visualizing Health Policy: The Role of Medicare Advantage

    Other

    This September 2014 Visualizing Health Policy Infographic examines the role of private plans, such as HMOs and PPOs, in Medicare. These Medicare Advantage plans offer an alternative to traditional Medicare and provide all benefits covered under Medicare Parts A and B, and often Part D. The infographic includes data on Medicare Advantage penetration across the country. It shows the concentration of enrollment among a small number of firms and affiliates, and displays the extent to which Medicare pays more for Medicare Advantage enrollees than for beneficiaries in fee for service Medicare, on average, and that the payment differential is declining

  • The Rising Cost of Living Longer: Analysis of Medicare Spending by Age for Beneficiaries in Traditional Medicare

    Report

    This analysis provides a detailed look at per person Medicare spending on the nearly 30 million beneficiaries over age 65 who are enrolled in the traditional Medicare program. Among the key findings of the report is that per person spending rises with age, peaking at age 96. But this rise is not entirely explained by Medicare spending on end of life care, which declines with age. What Medicare spends money on also changes as beneficiaries age. Hospital care is the largest component of Medicare spending throughout the age curve, up to age 100, but there is less spending on physician services and more on home health, skilled nursing and hospice care as beneficiaries age.