Medicare

New & Noteworthy

Data Visualization

The Facts About Medicare Spending

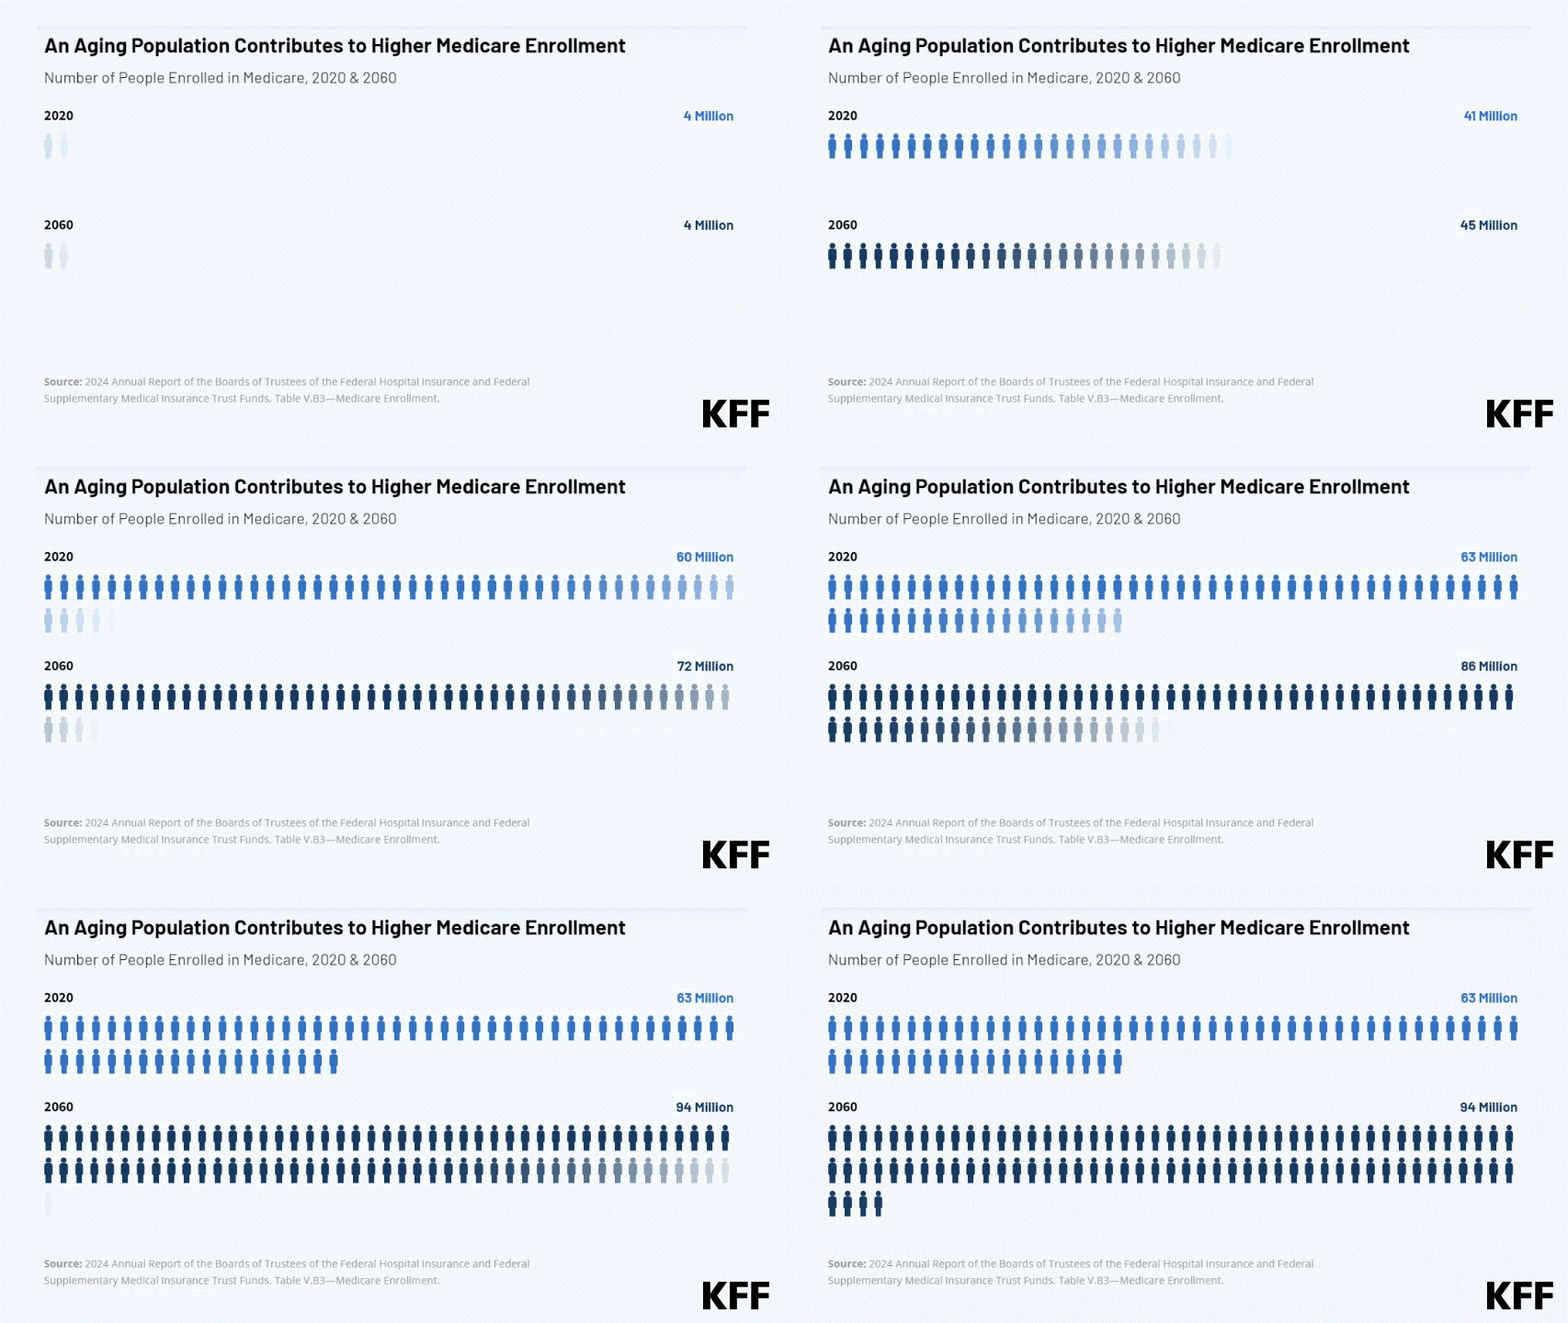
This interactive provides the facts on Medicare spending. Medicare, which serves 67 million people and accounts for 12 percent of the federal budget and 21 percent of national health spending, is often the focus of discussions about health expenditures, health care affordability and the sustainability of federal health programs.

Explore data on enrollment growth, Medicare spending trends overall and per person, growth in Medicare spending relative to private insurance, spending on benefits and Medicare Advantage, Part A trust fund solvency challenges, and growth in out-of-pocket spending by beneficiaries.

Related: FAQs on Medicare Financing and Trust Fund Solvency

Read More

Subscribe to KFF Emails

Choose which emails are best for you.
Sign up here

Filter

731 - 740 of 1,568 Results

  • Primary Care Physicians Accepting Medicare: A Snapshot

    Issue Brief

    This Data Note presents findings on reported acceptance of Medicare patients among non-pediatric primary care physicians, based on data from the Kaiser Family Foundation/Commonwealth Fund 2015 National Survey of Primary Care Providers. In addition to comparing physicians’ acceptance of Medicare to private insurance and Medicaid, this Data Note also explores the characteristics of non-pediatric primary care physicians who accept new Medicare patients and who have greater shares of Medicare patients in their caseloads.

  • Medicare Advantage and Traditional Medicare: Is the Balance Tipping?

    Issue Brief

    In this brief, we look beneath national trends to examine Medicare Advantage penetration rates and growth rates in counties across the country to assess the extent to which Medicare Advantage plans are poised to cover more beneficiaries than traditional Medicare across the country.

  • Medicare Open Enrollment Preview

    Event Date:
    Event

    With Medicare Advantage (Part C) and prescription drug (Part D) open enrollment beginning October 15th, this briefing took a close look at what to expect, including trends in premiums and cost sharing, plan availability and benefit design.

  • Medicare Part D: A First Look at Plan Offerings in 2016

    Issue Brief

    During the Medicare open enrollment period, beneficiaries have the opportunity to enroll in a plan that provides Part D prescription drug coverage, either a stand-alone prescription drug plan (PDP) to supplement traditional Medicare, or a Medicare Advantage drug plan. This issue brief provides an overview of the 2016 PDP marketplace, focusing on key changes from 2015, based on analysis of data from the Centers for Medicare & Medicaid Services. It presents analysis of PDP availability, premiums, benefit design, and low-income subsidy plans.

  • What’s In and What’s Out? Medicare Advantage Market Entries and Exits for 2016

    Issue Brief

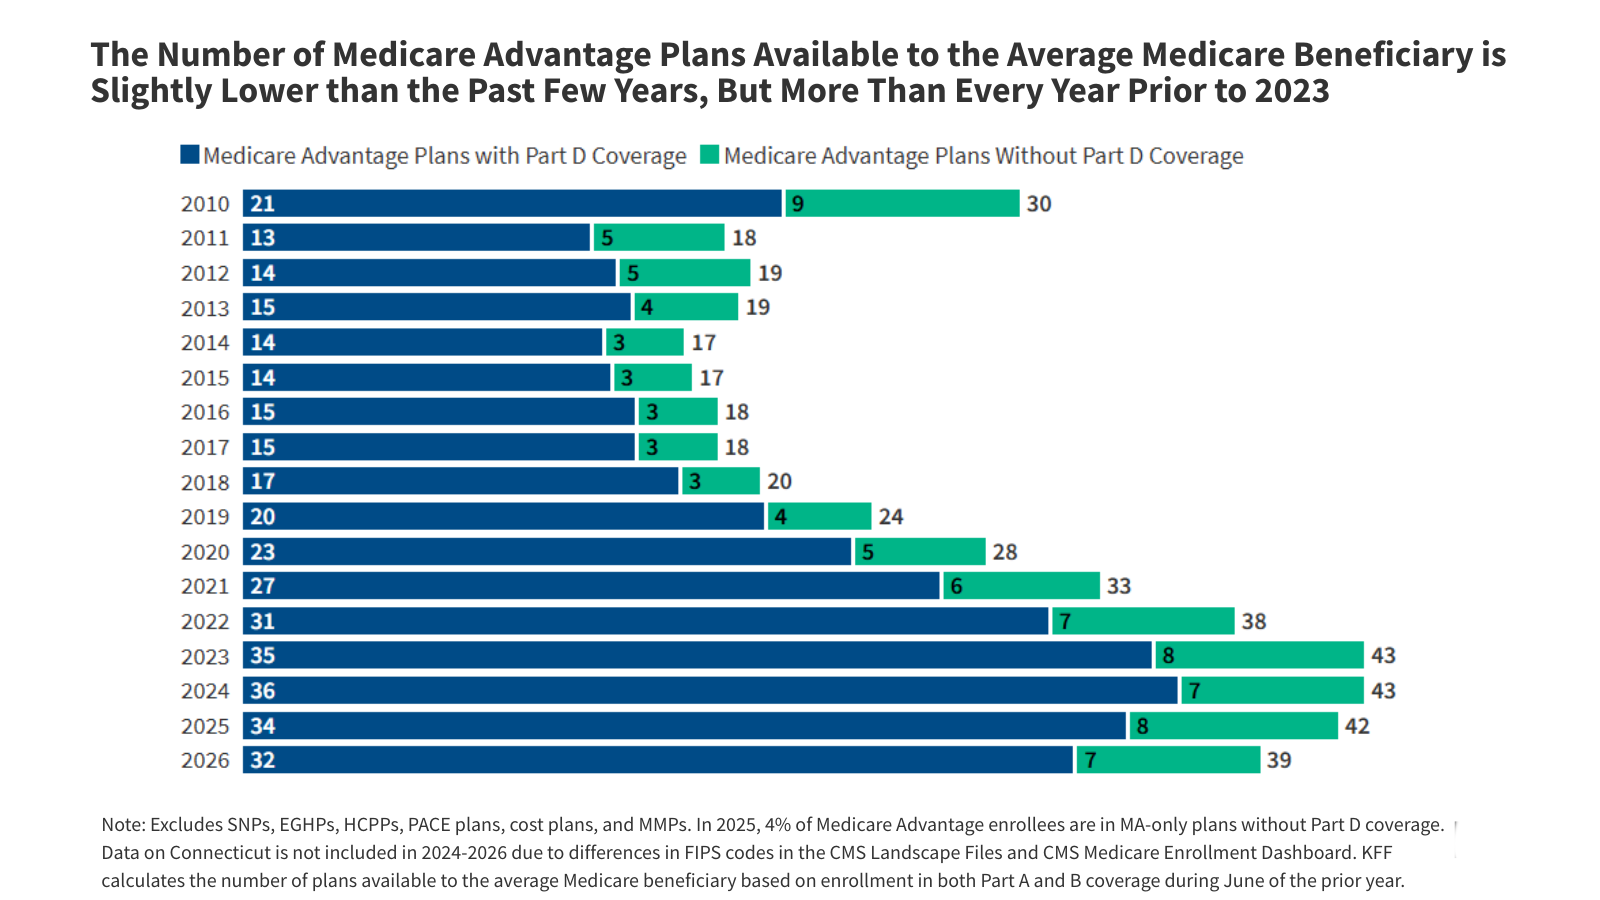
    This Issue Brief examines the availability of Medicare Advantage plans nationwide and by state in 2016, and tracks changes in plan availability since 2012. It documents the number and share of Medicare Advantage enrollees affected by plan withdrawals each year, the characteristics of plans that will be entering or exiting the market in 2016, and the potential implications of these changes for Medicare Advantage enrollees.

  • The Latest on Geographic Variation in Medicare Spending: A Demographic Divide Persists But Variation Has Narrowed

    Report

    This report uses the most current data available to analyze Medicare per beneficiary spending, by county, in 2013; the growth in Medicare per beneficiary spending between 2007 and 2013, by county; and the extent to which geographic variation in Medicare per beneficiary spending has increased or decreased over time. The analysis finds that beneficiaries living in counties with relatively high Medicare per beneficiary spending tend to be sicker and poorer than beneficiaries living in lower-spending counties and that the gap between high and low-spending counties narrows but does not close after adjustments are made for differences in prices and beneficiaries’ health status. The analysis also shows that the amount of variation between the highest- and lowest-spending counties appears to have narrowed in recent years, raising questions as to whether these changes are due to specific shifts in payment policy. An interactive U.S. map showing county-level Medicare spending is also available.