Medicare

New & Noteworthy

Health Provisions in the 2025 Federal Budget Reconciliation Law

On July 4, President Trump signed the budget reconciliation bill, previously known as the “One Big Beautiful Bill Act,” into law. This summary provides background, description, budgetary impact and related information on the health care provisions of the law in four categories: Medicaid, the Affordable Care Act, Medicare and Health Savings Accounts (HSAs).

Medicare Open Enrollment FAQs

This list of Frequently Asked Questions (FAQs) about the Medicare Open Enrollment period covers a range of topics related to enrollment, including Medicare Advantage, Part D, Medigap, and more.

State Profiles for Dual-Eligible Individuals

This data collection draws on Medicare and Medicaid administrative data to present national and state-level information on people who are covered by both Medicare and Medicaid, referred to as dual-eligible individuals (also known as dually-enrolled beneficiaries).

Data Visualization

The Facts About Medicare Spending

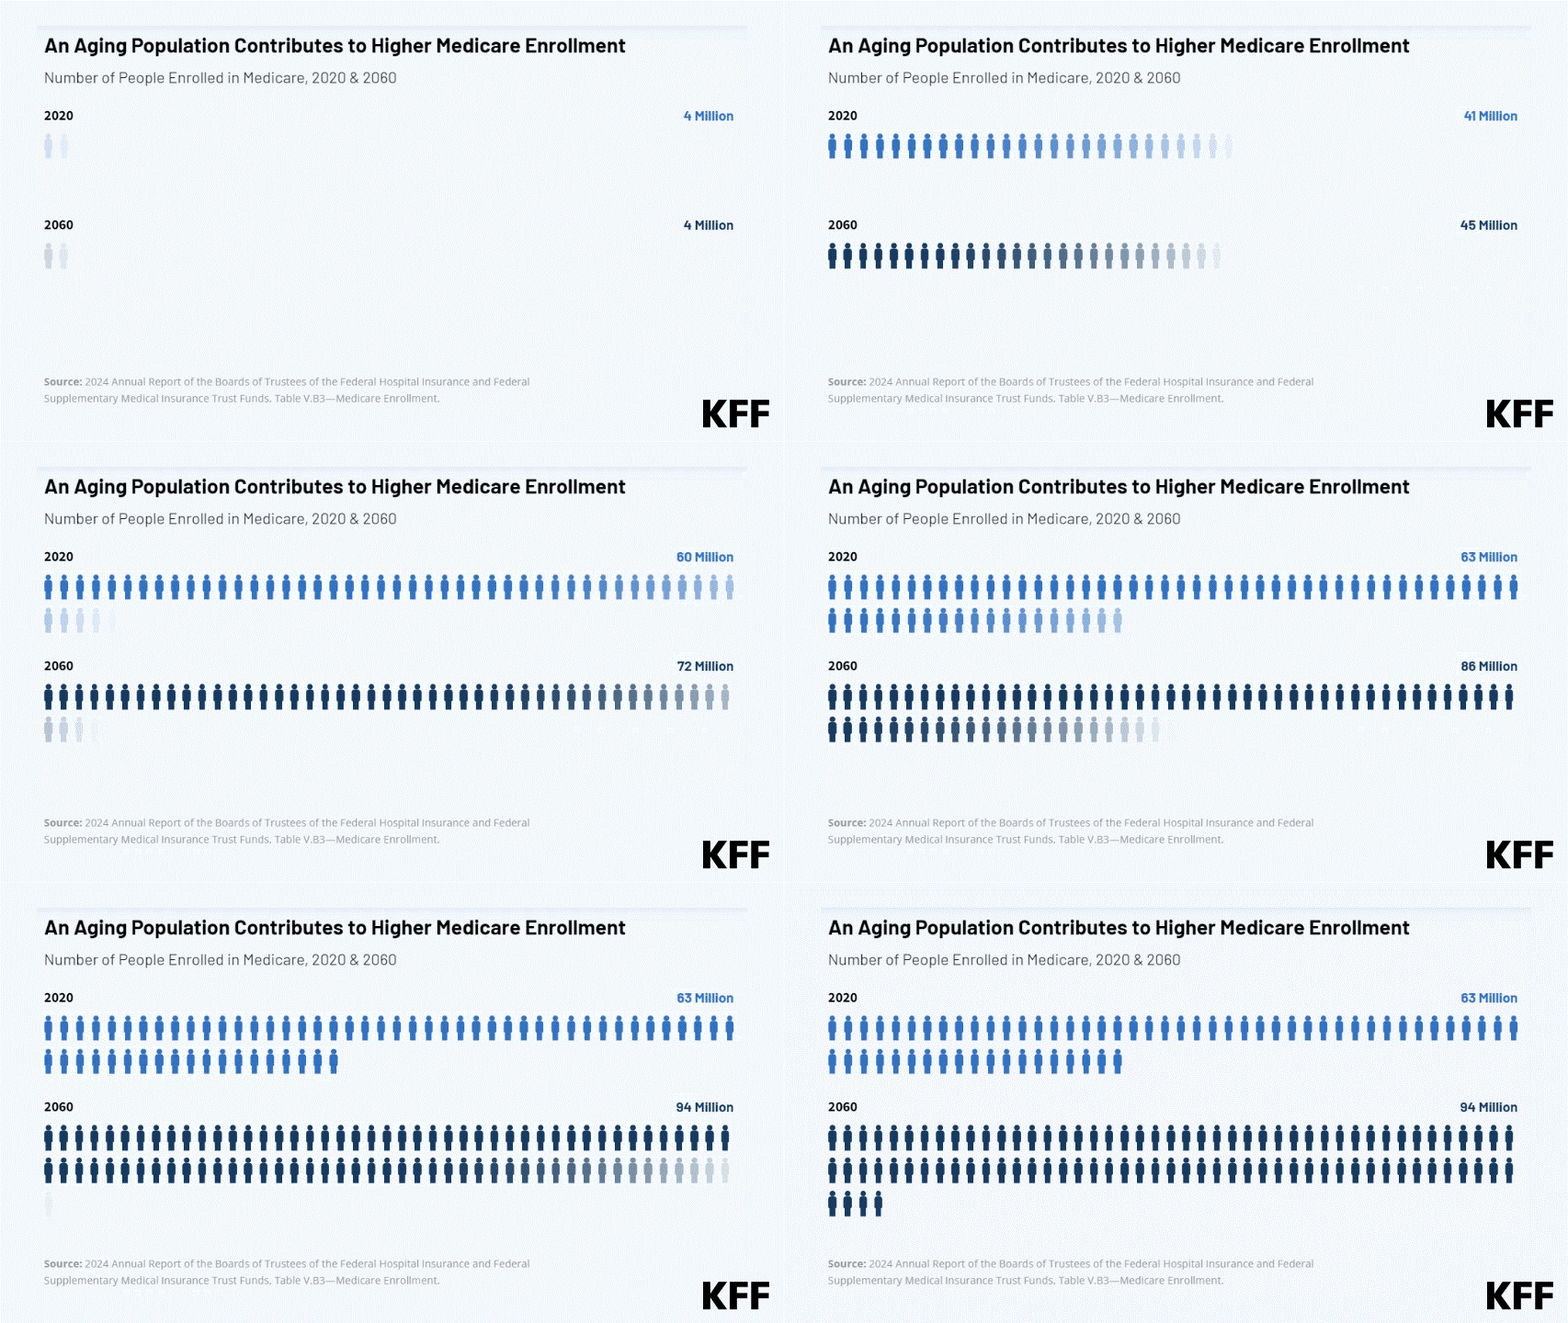
This interactive provides the facts on Medicare spending. Medicare, which serves 67 million people and accounts for 12 percent of the federal budget and 21 percent of national health spending, is often the focus of discussions about health expenditures, health care affordability and the sustainability of federal health programs.

Explore data on enrollment growth, Medicare spending trends overall and per person, growth in Medicare spending relative to private insurance, spending on benefits and Medicare Advantage, Part A trust fund solvency challenges, and growth in out-of-pocket spending by beneficiaries.

Related: FAQs on Medicare Financing and Trust Fund Solvency

Read More

Subscribe to KFF Emails

Choose which emails are best for you.
Sign up here

Filter

511 - 520 of 1,574 Results

  • How Could the Price of Remdesivir Impact Medicare Spending for COVID-19 Patients?

    Issue Brief

    This brief discusses how drugs provided in inpatient hospital settings are covered and reimbursed for beneficiaries in traditional Medicare under current law. This is relevant for Medicare spending on COVID-19 patients who receive Gilead’s new antiviral drug remdesivir. We discuss the implications for hospitals and the Medicare program of spending on remdesivir.

  • Insulin Costs and Coverage in Medicare Part D

    Issue Brief

    In light of heightened attention to insulin and the Trump Administration’s new Part D model to address out-of-pocket costs for insulin for Medicare beneficiaries, we analyzed out-of-pocket spending on insulin by beneficiaries enrolled in Part D drug plans, variation in Part D plan formulary coverage and tier placement of insulin products, and trends in prices for insulin.

  • KFF Analysis: Number of Coronavirus Cases, Distribution of $30B in CARES Act funding and Medicare Advantage Penetration by State

    Fact Sheet

    Number of Coronavirus Cases, Distribution of $30B in CARES Act funding and Medicare Advantage Penetration by StateStateNumber ofCOVID-19 Cases on April 21, 2020Percent of Total COVID-19 CasesFirst Distribution of CARES Act PaymentsPercent of Total Money DistributedPercent of Medicare Beneficiaries in Medicare Advantage, 2020New York253,400.0032.1%$1,859,574,4346.2%40%New Jersey88,806.0011.3%$919,426,8013.1%29%Massachusetts39,643.005.0%$841,425,1202.8%23%Pennsylvania34,005.004.3%$1,246,250,0764.2%41%California33,866.004.3%$2,920,960,7339.7%40%Michigan32,000.004.1%$936,700,1393.1%42%Illinois31,508.004.0%$1,204,103,1804.0%25%Florida27,058.003.4%$2,220,563,1377.4%43%Louisiana24,523.003.1%$474,891,7351.6%38%Connecticut19,815.002.5%$377,981,2571.3%41%Texas20,087.002.5%$2,089,066,4527.0%37%Georgia19,398.002.5%$792,069,1602.6%37%Maryland14,193.001.8%$742,225,3062.5%11%Ohio12,919.001.6%$989,773,4173.3%39%Washington12,486.001.6%$553,838,8061.8%33%Indiana11,688.001.5%$668,604,6142.2%32%Colorado10,112.001.3%$360,905,4821.2%38%Virginia9,097.001.2%$814,360,4672.7%21%Tennessee7,238.000.9%$739,723,3472.5%38%North Carolina6,979.000.9%$919,171,0873.1%36%Missouri5,963.000.8%$618,601,1672.1%35%Rhode Island5,090.000.6%$90,459,8340.3%39%Arizona5,068.000.6%$707,587,4822.4%39%Alabama5,092.000.6%$449,481,9451.5%41%Mississippi4,512.000.6%$374,847,7901.2%20%Wisconsin4,541.000.6%$471,681,0771.6%42%South Carolina4,439.000.6%$518,022,4631.7%28%Nevada3,830.000.5%$241,471,8410.8%36%Utah3,213.000.4%$185,292,4220.6%36%Iowa3,159.000.4%$297,929,1711.0%22%Kentucky3,050.000.4%$452,761,1711.5%34%District of Columbia3,098.000.4%$84,989,0990.3%20%Delaware2,745.000.3%$154,114,1180.5%17%Oklahoma2,680.000.3%$489,853,9981.6%22%Minnesota2,470.000.3%$472,206,1221.6%43%Kansas2,070.000.3%$325,135,9501.1%19%Oregon1,956.000.2%$291,029,0251.0%42%Arkansas1,990.000.3%$326,536,0431.1%26%New Mexico1,971.000.2%$169,486,1320.6%35%South Dakota1,685.000.2%$107,650,2010.4%19%Idaho1,736.000.2%$135,028,0560.5%33%Nebraska1,648.000.2%$225,027,9120.8%17%New Hampshire1,447.000.2%$164,580,3860.5%19%Puerto Rico1,298.000.2%$41,889,8220.1%70%West Virginia908.000.1%$246,574,8510.8%31%Maine875.000.1%$145,763,8120.5%36%Vermont816.000.1%$54,457,8700.