The Uninsured and the ACA: A Primer – Key Facts about Health Insurance and the Uninsured amidst Changes to the Affordable Care Act
Executive Summary
For more recent data on trends in coverage and the uninsured population, see our Key Facts About the Uninsured Population.
Executive Summary
In the past, gaps in the public insurance system and lack of access to affordable private coverage left millions without health insurance, and the number of uninsured Americans grew over time, particularly during economic downturns. By 2013, the year before the major coverage provisions of the Affordable Care Act (ACA) went into effect, more than 44 million nonelderly individuals lacked coverage.1
Under the ACA, as of 2014, Medicaid coverage expanded to nearly all adults with incomes at or below 138% of poverty in states that have adopted the expansion, and tax credits are available for people with incomes up to 400% of poverty who purchase coverage through a health insurance marketplace. Millions of people enrolled in ACA coverage, and the uninsured rate dropped to a historic low by 2016. Coverage gains were particularly large among low-income adults in states that expanded Medicaid.
Despite large gains in health coverage, some people continued to lack coverage, and the ACA remained the subject of political debate. Attempts to repeal and replace the ACA stalled in summer 2017, but there have been several changes to implementation of the ACA under the Trump Administration that affect coverage. In 2017, the number of uninsured rose for the first time since implementation of the ACA to 27.4 million.2 Those most at risk of being uninsured include low-income individuals, adults, and people of color. The cost of coverage continues to be the most commonly cited barrier to coverage.3
Health insurance makes a difference in whether and when people get necessary medical care, where they get their care, and ultimately, how healthy they are. Uninsured people are far more likely than those with insurance to postpone health care or forgo it altogether. The consequences can be severe, particularly when preventable conditions or chronic diseases go undetected. While the safety net of public hospitals, community clinics and health centers, and local providers provides a crucial health care source for uninsured people, it does not close the access gap for the uninsured.
For many uninsured people, the costs of health insurance and medical care are weighed against equally essential needs, like housing, food, and transportation to work, and many uninsured adults report financial stress beyond health care.4 When uninsured people use health care, they may be charged for the full cost of that care (versus insurers, who negotiate discounts) and often face difficulty paying medical bills. Providers absorb some of the cost of care for the uninsured, and while uncompensated care funds cover some of those costs, these funds do not fully offset the cost of care for the uninsured.
Under current law, nearly half (45%) of the remaining uninsured are outside the reach of the ACA either because their state did not expand Medicaid, they are subject to immigrant eligibility restrictions, or their income makes them ineligible for financial assistance.5 The remainder are eligible for assistance under the law but may still struggle with affordability and knowledge of options. Ongoing efforts to further alter the ACA or to make receipt of Medicaid more restrictive may further erode coverage gains seen under the ACA. On the other hand, state action to take up the ACA Medicaid expansion could make more people eligible for affordable coverage. The outcome of current debate over health coverage policy in the nation and the states has substantial implications for people’s coverage, access, and overall health and well-being.
Report: Introduction
The Affordable Care Act (ACA) led to historic gains in health insurance coverage. The ACA builds on the foundation of employer-based coverage and fills gaps in insurance availability and affordability by expanding Medicaid for adults with incomes at or below 138% of the federal poverty level ($16,753 per year for an individual in 2018)6 and providing premium tax credits to make private insurance in the individual market more affordable for many with incomes between 100-400% of poverty (between $12,140 and $48,560 per year for an individual in 2018). Most of the ACA’s major coverage provisions went into effect in 2014, and millions of people have gained coverage under the law. Despite historic coverage gains, millions of people continue to lack coverage, and the ACA remained the subject of political debate. Under the Trump Administration, several changes to ACA implementation have altered the availability of coverage or likelihood that people will sign up for coverage. In 2017, after years of decreasing uninsured rates, the US saw coverage gains stall or reverse for some groups. Lack of coverage reflects the fact that Medicaid eligibility for adults remains limited in states that have not adopted the expansion, some people remain ineligible for financial assistance for private coverage, and some still find coverage unaffordable even with financial assistance. Furthermore, ongoing efforts to alter the ACA or limit Medicaid coverage for some groups may have caused confusion or fear among some people and led them to drop or forgo coverage. These changes pose a challenge to further reducing the number of uninsured and may further threaten coverage gains seen in recent years.
The gaps in our health insurance system affect people of all ages, races and ethnicities; however, those with lower incomes face the greatest risk of being uninsured. Being uninsured affects people’s ability to access needed medical care and their financial security. As a result, uninsured people are less likely to receive preventive care and are more likely to be hospitalized for conditions that could have been prevented.7 The financial impact can also be severe. Uninsured families struggle financially to meet basic needs, and medical bills can quickly lead to medical debt.
The Uninsured and the ACA: A Primer provides information on how insurance has changed under the ACA, how many people remain uninsured, who they are, and why they lack health coverage. It also summarizes what we know about the impact that a lack of insurance can have on health outcomes and personal finances and the difference health insurance can make in people’s lives.
Report: How Have Health Insurance Coverage Options And Availability Changed Under The Aca?
In the past, gaps in the public insurance system and lack of access to affordable private coverage left millions without health insurance. The ACA filled in many of these gaps and provided new coverage options. Under the ACA, as of 2014, Medicaid coverage has been expanded to nearly all adults with incomes at or below 138% of poverty in states that have adopted the expansion, and tax credits are available for people with incomes up to 400% of poverty who purchase coverage through a health insurance marketplace. These new coverage options have increased access to health insurance and health care for millions, but recent actions may affect coverage options and people’s likelihood of signing up for or retaining ACA coverage.
ACA Coverage Provisions
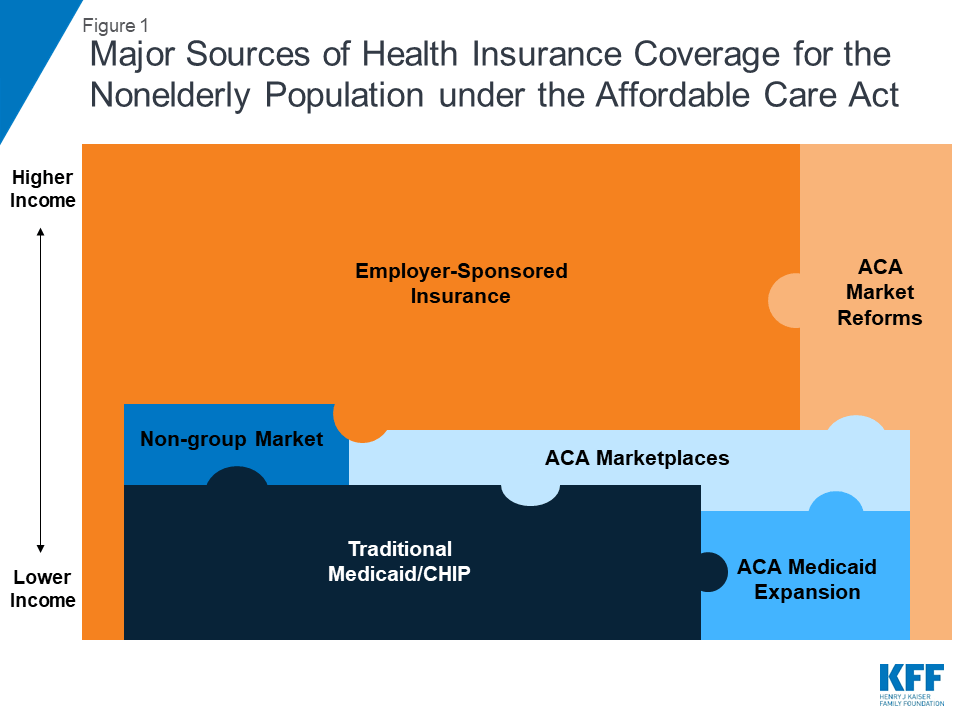
The ACA’s coverage provisions built on and attempted to fill gaps in a piecemeal insurance system that historically left many without affordable coverage. In the past, many people did not have access to affordable private coverage or were ineligible for public coverage. Poor and low-income adults were particularly likely to lack coverage, and the main reason that most people said they lacked coverage was inability to afford the cost.8 The ACA aimed to provide coverage options across the income spectrum by filling in gaps in eligibility for public coverage, access to employer coverage, and availability of affordable non-group coverage (Figure 1).9
The ACA expanded Medicaid eligibility to low-income adults, eliminating categorical restrictions on coverage in states that have expanded their programs. Medicaid and CHIP have long been important sources of coverage for low-income children and people with disabilities, but in the past, coverage for parents was limited to those with very low incomes (often below 50% of the poverty level), and adults without dependent children—regardless of how poor—were ineligible.10 The ACA expanded Medicaid eligibility to nearly all adults with income at or below 138% of poverty. The 2012 Supreme Court ruling effectively made the expansion a state option. As of January 2019, 37 states, including DC, had adopted Medicaid expansion under the ACA,11 and over 12 million people were covered through the ACA Medicaid expansion.12
The ACA established health insurance marketplaces where individuals and small employers can purchase non-group insurance, often with a subsidy. Very few people were covered by non-group health insurance policies prior to the ACA, as such policies could be prohibitively expensive or restrictive.13 Under the ACA, health insurance marketplaces where individuals can shop for health coverage operate in each state.14 To make coverage purchased in these new marketplaces affordable, the federal government provides tax credits for people with incomes between 100% and 400% of poverty. Tax credits are available on a sliding scale based on income and limit premium costs to a share of income. In addition, ACA allows for cost-sharing subsidies to reduce what people with incomes between 100% and 250% of poverty have to pay out-of-pocket to access health services. In 2018, more than 10 million people enrolled in marketplace plans, and the vast majority received financial assistance with their coverage.15 A small number of people still purchase non-group coverage outside the marketplace.16
The ACA includes provisions to promote employer-based coverage. The availability and affordability of employer-sponsored coverage has declined over time. From 2008 to 2013, the share of firms that offered workers health benefits declined from 63% to 57%, and health insurance premium increases outpaced growth in workers’ earnings and overall inflation.17 Under the ACA, large and medium-size employers (those with 50 or more full-time equivalent employees) are assessed a fee per full-time employee (up to $2,320 in 2018) if they do not offer affordable coverage and have at least one employee who receives a marketplace premium tax credit. To avoid penalties, employers must offer insurance that pays for at least 60% of covered health care expenses, and the employee’s share of the individual premium must not exceed a set share of family income (9.86% in 2019).18 , 19 In addition, the ACA established the Small Business Health Options Program (SHOP) marketplace to help small employers and their workers access affordable health coverage.20 Offer, eligibility, and take-up rates of employer-sponsored insurance have largely stabilized since 2013,21 and employer coverage remains the largest source of health coverage for the nonelderly (covering 153 million people in 2017).22
The ACA also extends dependent coverage in the private market. In the past, young adults (age 19-26) were at particularly high risk of being uninsured, largely due to their low incomes and difficulty affording coverage. As of 2010, young adults may remain on their parents’ private plans (including non-group and employer-based plans) until age 26. This provision led to drastic decline in the young adult uninsured rate from 32% in 2010 to 14% in 2017.23
The ACA included nationwide insurance regulations to improve access to coverage for those who may have been previously denied coverage and set new requirements for benefits and cost sharing in ACA plans. Prior to the ACA, in many states, premiums in the non-group market could vary by age or health status, and people with health problems or at risk for health problems could be charged high rates, offered only limited coverage, or denied coverage altogether. The ACA included new rules for insurers prevent them from denying coverage to people for any reason, including their health status, and from charging people who are sick more (though insurers can, within limits, still charge older people more for coverage). In addition, the ACA established a minimum “essential health benefits” package for marketplace plans, Medicaid expansion enrollees, and some employer plans.
Under the ACA, almost all people were required to have health insurance coverage or be subject to a tax penalty. This requirement was intended to encourage healthier individuals to purchase coverage through the marketplace. The requirement only applied to those with access to affordable coverage, defined as costing no more than 8% of an individual’s or family’s income (certain other exemptions to the mandate also were granted). The penalty from 2016 to 2018 was assessed as 2.5 percent of family income, with both a minimum and maximum.24
Coverage for immigrants remains limited under the ACA. Lawfully-present immigrants can receive coverage through the ACA marketplaces, but they continue to face eligibility restrictions in Medicaid that have been in place since prior to the ACA. Specifically, many lawfully present non-citizens who would otherwise be eligible for Medicaid remain subject to a five-year waiting period before they may enroll.25 Undocumented immigrants are ineligible for Medicaid and are prohibited from purchasing coverage through a marketplace or receiving tax credits.
Changes to the ACA under the Trump Administration
With the change in Administration in January 2017, there was renewed debate over the future of the ACA. Discussion of ACA repeal and public comments from President Trump declaring the law to be “dead” and “finished,”26 led some people to be confused about whether the law remained in effect.27 In addition, reduced funding for outreach and enrollment assistance programs led to reduction in these services.28 While attempts to repeal and replace the ACA stalled out in summer 2017, there have been several changes to implementation of the ACA that affect coverage options and people’s likelihood of signing up for or retaining ACA coverage.
In October 2017, the Trump Administration announced it would no longer make payments to insurers for cost-sharing reductions (CSRs). Regardless of whether the federal government reimburses insurers for CSR subsidies, insurers are still legally required under the ACA to offer reduced cost-sharing via silver-level plans to eligible consumers. Many built the loss of CSR payments into their premiums for silver plans for 2018 and again in 2019.29 ,30 Because premium tax credits on the exchanges are tied to the cost of silver premiums, the effect of the loss of CSR payments was cushioned for many enrollees purchasing insurance through the ACA marketplace.
The individual mandate is no longer in effect as of 2019. As part of tax reform legislation passed in December 2017, Congress reduced the individual mandate penalty to $0 effective in 2019. Repeal of the individual mandate is expected to deter healthier people from enrolling in coverage and thus lead to a sicker—and more expensive—risk pool in the marketplace. Analysis of insurer rate filings shows that plans increased marketplace premiums to account for the loss of the individual mandate.31 Because customers receiving marketplace subsidies will continue to pay sliding-scale premiums based largely on their incomes, these premium increases primarily affect unsubsidized customers and those purchasing individual coverage outside the ACA marketplace. In December 2018, a federal judge in Texas ruled that the change to the law’s individual mandate made the entire law itself unconstitutional, though that decision has no effect as the case works its way through the appeals process.
New, more loosely-regulated plans may now compete with ACA marketplace plans. In 2018, the Trump administration announced new rules that will allow more loosely regulated plans – both short-term limited duration (STLD) plans and association health plans (AHPs) – to proliferate on the individual market in competition with ACA-compliant coverage.32 These more loosely regulated plans will serve as a more affordable option for some people who are not eligible for the ACA’s premium tax credits. However, particularly in the case of short-term plans, this lower-cost coverage is generally unavailable to people with pre-existing conditions, and the plans often exclude coverage for certain services.33 These plans will attract disproportionately healthy individuals away from ACA-compliant coverage, thus having an upward effect on premiums in the ACA-compliant individual market.
In 2018, the Centers for Medicare and Medicaid Services (CMS) issued new guidance regarding Medicaid waivers and invited states to develop waivers, including some that restrict Medicaid eligibility and enrollment.34 Under the previous administration, CMS approved certain eligibility- and enrollment-related waiver provisions as part of ACA Medicaid expansion waivers. Under the Trump administration, states are seeking to apply these previously approved provisions as well as new restrictions to both expansion and traditional Medicaid populations. The Trump administration also has approved eligibility and enrollment restrictions that have never been approved before, such as conditioning eligibility on meeting work requirements; coverage lock-outs for failure to report changes affecting eligibility; and eliminating retroactive coverage for nearly all Medicaid enrollees, among others. In some states, these provisions apply to both expansion adults and traditional Medicaid populations.
New public charge rules could have a chilling effect on coverage among immigrants. In October 2018, the Trump Administration published a proposed rule that would make changes to “public charge” policies. Under longstanding policy, the federal government can deny an individual entry into the U.S. or adjustment to legal permanent resident (LPR) status (i.e., a green card) if he or she is determined likely to become a public charge. Under the proposed rule, officials would newly consider use of certain previously excluded programs, including Medicaid, in public charge determinations. The changes would likely lead to decreases in participation in Medicaid among legal immigrant families and their U.S.-born children beyond those directly affected by the changes.35
The effect of these policy changes on enrollment and coverage is currently playing out and will continue to develop. After growing for the first few years of ACA implementation, marketplace enrollment declined slightly in 2017 and 2018 then dropped substantially in 2019.36 In the one state that has implemented Medicaid work requirements to date, Arkansas, over 18,000 people lost Medicaid in 2018 for failing to meet work or reporting requirements;37 it is unclear whether these people gained other sources of coverage, but low offer rates of employer coverage among low-wage workers make it likely that many did not.38 In addition, recent research suggests that changes in immigration policy focused on restricting immigration and enhancing immigration enforcement are causing some immigrant families to turn away from public programs, including Medicaid and CHIP.39 As additional data on health coverage becomes available, it will be important to assess the effect of these changes, combined with other economic trends, on health coverage.
Report: How Many People Are Uninsured?
Before the ACA, the number of uninsured Americans grew over time, particularly during economic downturns. By 2013, the year before the major coverage provisions of the ACA went into effect, more than 44 million people lacked coverage.40 Under the ACA, millions of people have gained health coverage, and the uninsured rate dropped to a historic low in 2016. Coverage gains were particularly large among low-income people living in states that expanded Medicaid. However, for the first time since the implementation of the ACA, the number of people remaining without coverage increased by half a million in 2017, reaching 27.4 million.
Under the ACA, the uninsured rate and number of uninsured people declined to a historic low by 2016. The number of uninsured people and the share of the nonelderly population that was uninsured rose from 44.2 million (17.1%) to 46.5 million (17.8%) between 2008 and 2010 as the country faced an economic recession (Figure 2). As early provisions of the ACA went into effect in 2010, and as the economy improved, the number of uninsured and uninsured rate began to drop, hitting 44.4 million (16.8%) in 2013. When the major ACA coverage provisions went into effect in 2014, the number of uninsured and uninsured rate dropped dramatically and continued to fall through 2016 to 26.7 million (10.0%).41 Overall, nearly 20 million more people had coverage in 2016 than before the ACA was passed.

Coverage gains through 2016 were largest among low-income people, people of color, and adults—groups that had high uninsured rates prior to 2014—and were particularly large in states that expanded Medicaid. While uninsured rates decreased across all income groups from 2013 to 2016, they declined most sharply for poor and near-poor people, dropping by 9.7 percentage points and 11.4 percentage points, respectively (Figure 3). Among racial and ethnic groups, Hispanics, Blacks, and Asians had particularly large declines in uninsured rates, with each group seeing a drop of over 8 percentage points from 2013 to 2016 (Figure 3).42 Because the expansions are largely targeted to adults, who have historically had higher uninsured rates than children, nearly the entire decline in the number of uninsured people under the ACA has occurred among adults. Uninsured rates dropped nearly immediately in expansion states following implementation of the ACA’s coverage provisions, declining by 7.4 percentage points from 2013 to 2016, with even larger declines among adults (a 9.2 percentage point drop) widely attributed to gains in Medicaid coverage. Uninsured rates among the nonelderly population also dropped in non-expansion states following ACA implementation (down 5.9 percentage points), in part as a result of the availability of ACA subsidies for private insurance to those with incomes above poverty, increased participation among those eligible but not enrolled in Medicaid, and increased outreach and enrollment efforts surrounding the ACA in all states.43

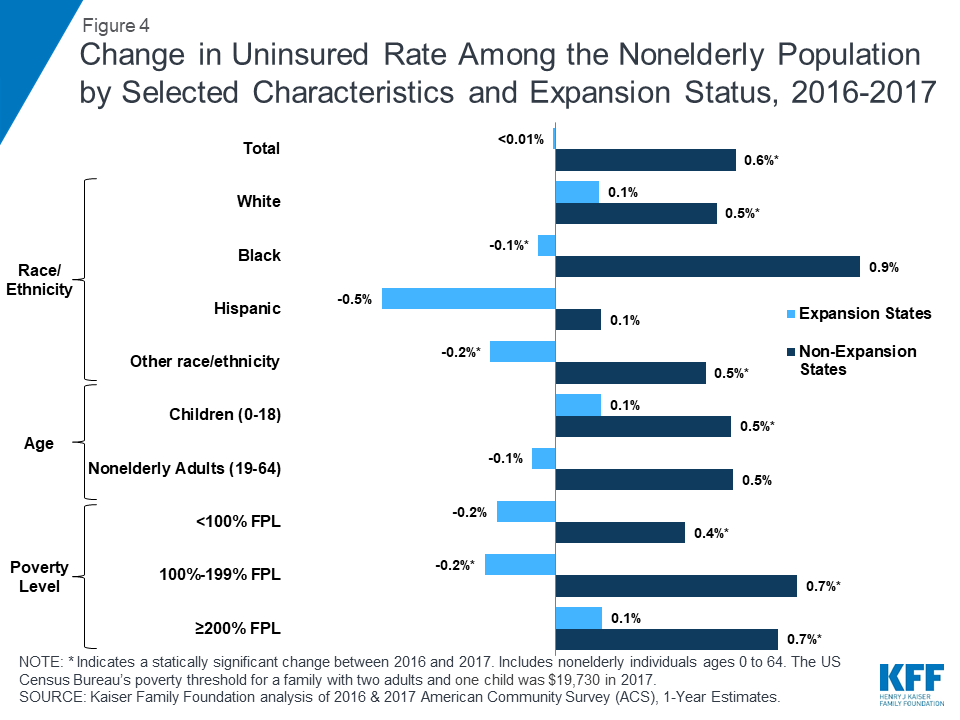
In 2017, the uninsured rate reversed course and, for the first time since the passage of the ACA, rose significantly to 10.2%. Groups that saw significant increases in their uninsured rate from 2016 to 2017 include Black, non-Hispanics, children, older adults (age 45-64), and middle-income families (above twice the poverty level) (Appendix Table 1). From 2016 to 2017, changes in the uninsured rate in the set of states that expanded Medicaid were essentially flat overall, declining by less than 0.1 percentage points, but patterns varied by states and by demographic group (Figure 4). In contrast, the uninsured rate in states that did not expand Medicaid increased both overall (rising by 0.6 percentage points) and for most groups. As with expansion states, changes in coverage from 2016-2017 varied within the set of states that have not expanded Medicaid.
Many remain uninsured are eligible for ACA assistance, but about half are outside the reach of the ACA. Of the remaining uninsured in 2017, more than half (15.0 million, or 55%) are eligible for financial assistance through either Medicaid or subsidized marketplace coverage. However, nearly half of uninsured people remain outside the reach of the ACA. Some (4.1 million, or 15%) are ineligible due to their immigration status or their state’s decision not to expand Medicaid. The remainder of the uninsured either has an offer of coverage through an employer or has income above the limit for marketplace tax credits (Figure 5). These patterns of eligibility vary by state.44
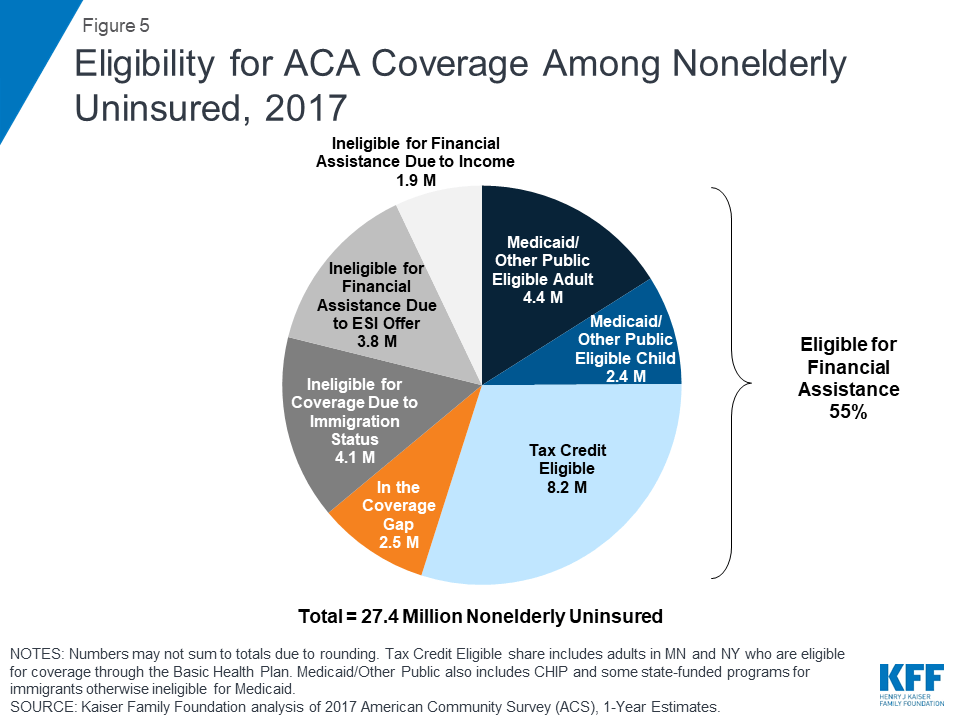
In the fourteen states that had not expanded Medicaid as of January 2019, 2.5 million poor adults fall into a “coverage gap.”45 These adults have incomes above Medicaid eligibility limits in their state but below the lower limit for marketplace premium tax credits, which begin at 100% of poverty. In non-expansion states, the median income eligibility level for parents is 43% of poverty and 0% for childless adults.46 People in the coverage gap are concentrated in Southern states, with the largest number of people in the coverage gap in Texas (759,000 people, or 31%) followed by Florida (445,000, or 18%), Georgia (267,000, or 11%), and North Carolina (215,000, or 9%).47
Report: Who Remains Uninsured After The Aca And Why Do They Lack Coverage?
Despite coverage gains, groups with historically high uninsured rates continue to be at highest risk of being uninsured, including low-income individuals, adults, and people of color. Although most remaining uninsured people are in working families, cost continues to pose a major barrier to coverage with nearly half (45%) of uninsured nonelderly adults in 2017 saying that they lacked coverage because it was too expensive.48
Though provisions in the ACA aim to make coverage more affordable for low and moderate-income families, these income groups still make up the vast majority of the uninsured. Low-income individuals are at the highest risk of being uninsured.49 Nearly half of the remaining uninsured population (47%) has family income below 200% of poverty ($19,730 for a family with two adults and one child in 2017)50 and another 35% has family income between 200 and 399% of poverty (Figure 6).

A majority of the remaining uninsured population is in a family with at least one worker, and many uninsured workers continue to lack access to coverage through their job. Not all workers have access to health coverage through their jobs or can afford the coverage offered to them. In 2017, more than three-quarters (77%) of the uninsured had at least one full-time worker in their family, and an additional 10% had a part-time worker in their family (Figure 6).51 As in the past, low-income workers and those who work in agriculture, construction, and service jobs are more likely than other workers to be uninsured.52 Moreover, not all workers have access to health coverage through their job. In 2017, 71% of nonelderly uninsured workers worked for an employer that did not offer health benefits to the worker.53
People of color are at higher risk of being uninsured than Whites. While a plurality (41%) of the uninsured are non-Hispanic Whites, people of color are disproportionately likely to be uninsured: they make up 42% of the overall nonelderly U.S. population but account for over half of the total nonelderly uninsured population (Figure 6). Hispanics and Blacks have significantly higher nonelderly uninsured rates (18.9% and 11.1%, respectively) than Whites (7.3%).54 Differences in coverage by race/ethnicity likely reflect a combination of factors, including language and immigration barriers, income and work status, and state of residence.
Adults are still more likely than children to be uninsured. Nonelderly adults were more than twice as likely as children (12% vs. 5%) to be uninsured in 2017.55 This disparity reflects ongoing differences in eligibility for public coverage. While the ACA has increased Medicaid eligibility levels for adults, states have expanded coverage for children even higher through CHIP, while adults without children are excluded from Medicaid in all but one non-expansion state.56
Uninsured rates for children are low, and most uninsured children are eligible for Medicaid or CHIP. Largely due to expanded eligibility for public coverage under Medicaid and CHIP, the uninsured rate for children is relatively low: in 2017, 5% of children nationwide were uninsured.57 Over three in five (64%) uninsured children are eligible for Medicaid, CHIP, or other public programs.58 Some of these children may be reached by covering their parents, as research has found that parent coverage in public programs is associated with higher enrollment of eligible children.59 ,60
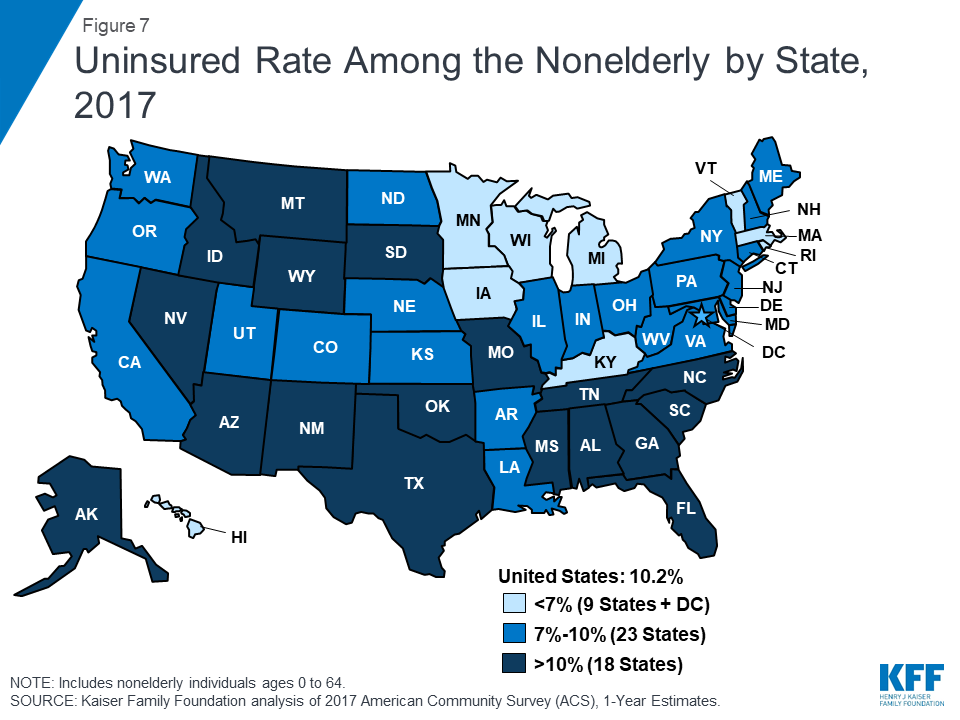
Insurance coverage continues to vary by state and region, with individuals living in non-expansion states being most likely to be uninsured (Figure 7). In 2017, thirteen out of the eighteen states with the highest uninsured rates were non-expansion states.61 Economic conditions, availability of employer-sponsored coverage, and demographics are other factors contributing to variation in uninsured rates across states.
While most of the uninsured are U.S. citizens, non-citizens continue to be at much higher risk of being uninsured. In 2017, three out of four (75%) uninsured nonelderly individuals were citizens. However, non-citizens (including those who are lawfully present and those who are undocumented) are more likely than citizens to be uninsured in 2017. Among citizens, 8% were uninsured in 2017, compared to 33% of non-citizens.62
Cost still poses a major barrier to coverage for the uninsured. Nearly half (45%) of uninsured adults in 2017 said that they lacked coverage was because of high cost.63 Though financial assistance is available to many of the remaining uninsured under the ACA,64 not everyone who is uninsured is eligible for free or subsidized coverage. In addition, some uninsured who are eligible for help may not be aware of coverage options or may face barriers to enrollment.65 Outreach and enrollment assistance was key to facilitating both initial and ongoing enrollment in ACA coverage, but these programs face challenges due to funding cuts and high demand.66 ,67
Access to health coverage changes as a person’s situation changes. In 2017, 22% of uninsured nonelderly adults said they were uninsured because the person who carried the health coverage in their family lost their job or changed employers.68 More than one in ten were uninsured because of a marital status change, the death of a spouse or parent, or loss of eligibility due to age or leaving school (11%), and some lost Medicaid because of a new job/increase in income or the plan stopping after pregnancy (11%).69
Most people who remained uninsured nonelderly adults in 2017 were uninsured for more than a year. Though the share of uninsured who lacked coverage for more than a year decreased from 81% in 2013 to 74% in 2017,70 the vast majority of uninsured people were still long-term uninsured. People who have been without coverage for long periods may be particularly hard to reach through outreach and enrollment efforts.
Report: How Does Lack Of Insurance Affect Access To Care?
Health insurance makes a difference in whether and when people get necessary medical care, where they get their care, and ultimately, how healthy they are. Uninsured people are far more likely than those with insurance to postpone health care or forgo it altogether. The consequences can be severe, particularly when preventable conditions or chronic diseases go undetected.
Compared to those who have health coverage, people without health insurance are more likely to skip preventive services and report that they do not have a regular source of health care. Adults who are uninsured are over three times more likely than insured adults to say they have not had a visit about their own health to a doctor or other health professional’s office or clinic in the past 12 months.71 They are also less likely to receive recommended screening tests such as blood pressure checks, cholesterol checks, blood sugar screening, pap smear or mammogram (among women), and colon cancer screening.72 Part of the reason for poor access among the uninsured is that half do not have a regular place to go when they are sick or need medical advice, while the majority of insured people do have a regular source of care (Figure 8).73

Uninsured people are more likely than those with insurance to report problems getting needed medical care. One in five (20%) uninsured adults say that they went without needed care in the past year because of cost compared to 3% of adults with private coverage and 8% of adults with public coverage.74 Many uninsured people do not obtain the treatments their health care providers recommend for them. In 2017, 19% of uninsured adults said they delayed or did not get a needed prescription drug due to cost, compared to 14% with public coverage and 6% with private coverage.75 And while insured and uninsured people who are injured or newly diagnosed with a chronic condition receive similar plans for follow-up care from their doctors, people without health coverage are less likely than those with coverage to obtain all the recommended services.76 ,77
Because uninsured people are less likely than those with insurance to have regular outpatient care, they are more likely to have negative health consequences. Because uninsured patients are also less likely to receive necessary follow-up screenings than their insured counterparts,78 they have an increased risk of being diagnosed at later stages of diseases, including cancer, and have higher mortality rates than those with insurance.79 ,80 ,81 In addition, when uninsured people are hospitalized, they receive fewer diagnostic and therapeutic services and also have higher mortality rates than those with insurance.82 ,83 ,84 ,85
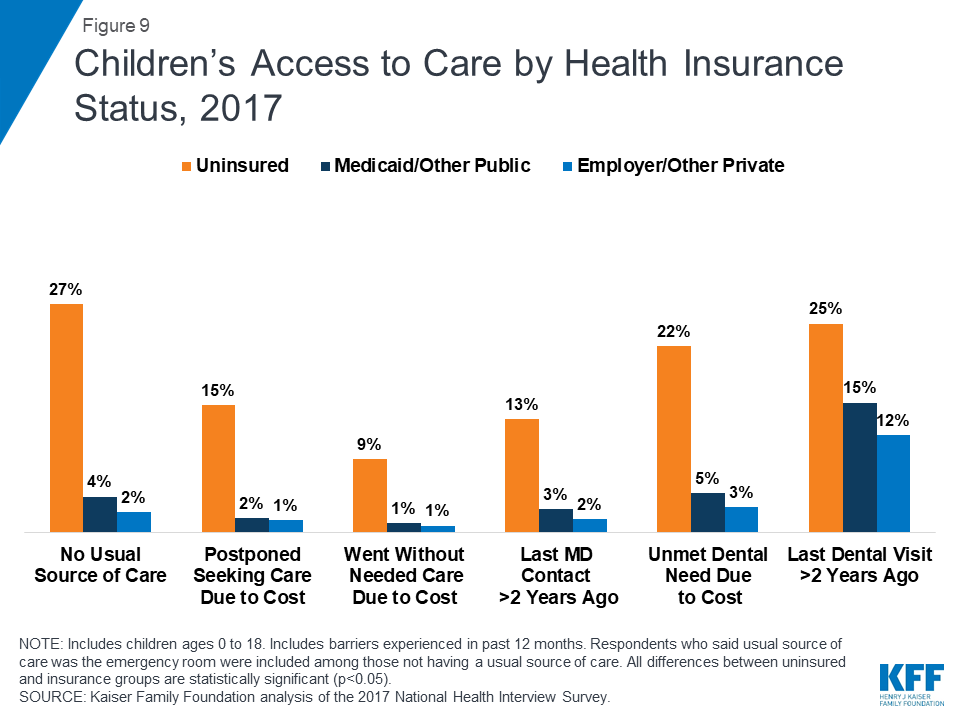
Uninsured children also face problems getting needed care. Uninsured children are more likely to lack a usual source of care, to delay care, or to have unmet medical needs than children with insurance (Figure 9).86 Further, uninsured children with common childhood illnesses and injuries do not receive the same level of care as others and are at higher risk for preventable hospitalizations and for missed diagnoses of serious health conditions.87 ,88 Among children with special health care needs, those without health insurance have worse access to care than those with insurance.89
Lack of health coverage, even for short periods of time, results in decreased access to care. Research has shown that adults who experience gaps in their health insurance coverage are less likely to have a regular source of care or to be up to date with blood pressure or cholesterol checks than those with continuous coverage.90 Research also indicates that children who are uninsured for part of the year have more access problems than those with full-year coverage.91 ,92 Similarly, adults who lack insurance for an entire year have poorer access to care than those who have coverage for at least part of the year, suggesting that even a short period of coverage can improve access to care.93
Research demonstrates that gaining health insurance improves access to health care considerably and diminishes the adverse effects of having been uninsured. A seminal study of a Medicaid expansion in Oregon found that uninsured adults who gained Medicaid coverage were more likely to have an outpatient visit or receive a prescription and less likely to have depression or stress in the short term than their counterparts who did not gain coverage.94 Findings two years out from the expansion showed significant improvements in access, utilization, and self-reported health among the adults who gained coverage.95 In addition, a large body of research on the impact of Medicaid expansion under the ACA demonstrates that gains in Medicaid coverage positively impact access to care and utilization of health care services.96 Research also shows that individuals who gained marketplace coverage in 2014 were far more likely than those who remained uninsured to obtain a usual source of care and receive preventive care services.97
Public hospitals, community clinics and health centers provide a crucial health care safety net for uninsured people; however, the safety net does not close the access gap for the uninsured. Safety net providers, including public and community hospitals, community health centers, rural health centers, and local health departments, provide care to many people without health coverage. In addition, nearly all other hospitals and some private physicians provide some charity care. However, safety net providers have limited resources and service capacity, and not all uninsured people have geographic access to a safety net provider.98 ,99 The ACA has led to significant growth in the number of health centers and their service capacity through both new grant funds and new patient revenues due to expanded coverage.100 However, this impact has been more limited in states not expanding Medicaid, where a much larger share of health center patients remains uninsured than in states that did expand.101 In addition, health centers in all states report that securing needed specialty care for their uninsured patients is a major challenge.102
Report: What Are The Financial Implications Of Lacking Insurance?
For many uninsured people, the costs of health insurance and medical care are weighed against equally essential needs, like housing, food, and transportation to work, and many uninsured adults report being very or moderately worried about paying basic monthly expenses such as rent or other housing costs and monthly bills.103 When uninsured people use health care, they may be charged for the full cost of that care (versus insurers, who negotiate discounts) and often face difficulty paying medical bills. Providers absorb some of the cost of care for the uninsured, and while uncompensated care funds cover some of those costs, these funds do not fully offset the cost of care for the uninsured.
Most uninsured people do not receive health services for free or at reduced charge. Hospitals frequently charge uninsured patients two to four times what health insurers and public programs actually pay for hospital services.104 , 105 In 2015, only 27% of uninsured adults reported receiving free or reduced cost care.106
Uninsured people often must pay “up front” before services will be rendered. When people without health coverage are unable to pay the full medical bill in cash at the time of service, they can sometimes negotiate a payment schedule with a provider, pay with credit cards (typically with high interest rates), or be turned away.107 ,108 Among uninsured adults in 2015, a third (33%) were asked to pay for the full cost of medical care before they could see a doctor.109
People without health insurance have lower medical expenditures than those with insurance, but they pay a much larger portion of their medical costs out-of-pocket. Nonelderly people without health coverage had an average of $1,719 in health spending in 2016, less than half of average annual spending for people with any private coverage ($4,846) and less than a third of average annual spending for people with only public coverage ($6,421).110 Despite lower overall medical spending, people without insurance who use services pay a greater percentage of their expenses out-of-pocket than those with insurance. As a result, in 2014, those without insurance who used medical services paid an average of $752 out of pocket, compared to $658 for those with any private coverage and just $236 for those with public coverage.111
Providers incur billions in the cost of uncompensated care for the uninsured, not all of which is offset by funding to defray these costs. In 2013, before the ACA was fully implemented, the uncompensated costs of care for the uninsured amounted to about $85 billion, and funding from a number of sources helped providers defray these costs. Most of these funds came from the federal government through a variety of programs including Medicaid and Medicare disproportionate share hospital (DSH) payments, the Veterans Health Administration, the Indian Health Service, the Community Health Centers block grant, and the Ryan White CARE Act, though states and localities provided billions and the private sector provided a small share. Given the high cost of hospital-based care, the majority of the cost of uncompensated care is incurred in hospitals. While substantial, these payments to providers for uncompensated care amount to a small slice of total health care spending in the U.S.112
With the expansion of coverage under the ACA, providers in states that expanded Medicaid are seeing reductions in uncompensated care costs. For example, between 2013 and 2015, total uncompensated care costs for hospitals (including charity care costs and bad debt) dropped from $37.3 billion to $28.7 billion, a $8.6 billion or 23% drop.113 States that expanded Medicaid saw greater declines in uncompensated care than states that have not expanded.114 Anticipating fewer uninsured and lower levels of uncompensated care, the ACA called for a reduction in federal Medicaid DSH payments; these cuts have been postponed and are now scheduled to begin in 2020.115
Being uninsured leaves individuals at an increased risk of financial strain due to medical bills. In 2017, nonelderly uninsured adults were over twice as likely as those with insurance to have problems paying medical bills (29% vs. 14%; Figure 10) with nearly two thirds of uninsured who had medical bill problems unable to pay their medical bills at all (65%).116 Uninsured adults are also more likely to face negative consequences due to medical bills, such as using up savings, having difficulty paying for necessities, borrowing money, or having medical bills sent to collection.117
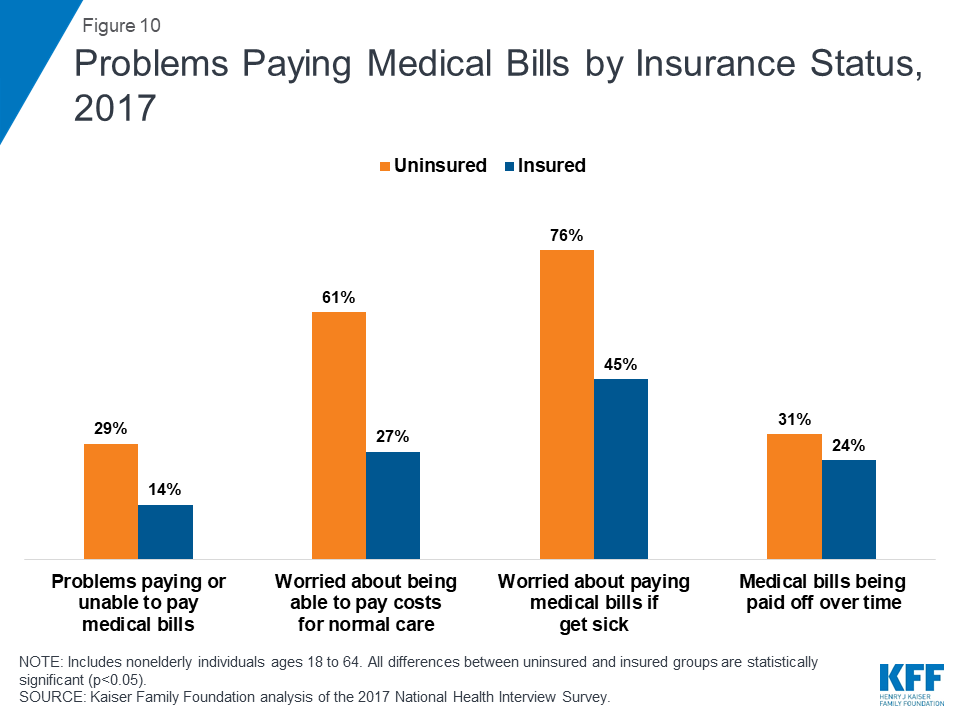
Most uninsured people have few, if any, savings or assets they can easily use to pay health care costs. Uninsured people typically have limited access to funds to finance care. Only 40 and 50 percent of single- and multi-person households with an uninsured person, respectively, had liquid assets in excess of $1,000 in 2016, and less than a fifth (18 percent) in both household types had liquid assets above $5,000.118 Uninsured nonelderly adults are over twice as likely as insured adults to worry about being able to pay costs for normal health care (61% vs. 27%; Figure 10). Furthermore, over three quarters of uninsured nonelderly adults (76%) say they are very or somewhat worried about paying medical bills if they get sick or have an accident, compared to 45% of insured adults.119
Uninsured people are at risk of medical debt. Like any bill, when medical bills are not paid or are paid off too slowly, they are turned over to a collection agency. Nearly three in five consumers (59%) reported being contacted regarding a collection for medical bills in the United States.120 In 2017, uninsured adults were more likely than insured adults to say they have medical bills that are being paid off over time (31% vs. 24%).121 More than half (53%) of uninsured people said they had problems paying household medical bills in the past year.122
Conclusion
The ACA led to historic drops in the uninsured rate, with millions of previously uninsured Americans gaining insurance and access to health services and protection from catastrophic health costs. Prior to the ACA, the options for the uninsured population were limited in the individual market, as coverage was often expensive and insurers could deny coverage based on health status. Medicaid and CHIP have provided coverage to many families, but pre-2014 eligibility levels were low for parents and few states provided coverage to adults without dependent children. The ACA filled in many of these gaps by expanding Medicaid to low-income adults and providing subsidized coverage to people with incomes from 100 to 400% of poverty in the marketplaces.
Nonetheless, even with the ACA, the nation’s system of health insurance continues to have many gaps that currently leave millions of people without coverage, and recent actions to alter the ACA under the Trump Administration may limit availability of coverage. For the first time since passage of the law, the number of uninsured people increased in 2017, and 27.4 million remain uninsured. Nearly half (45%) of the remaining uninsured are outside the reach of the ACA either because their state did not expand Medicaid, they are subject to immigrant eligibility restrictions, or their income makes them ineligible for financial assistance. The remainder are eligible for assistance under the law but may still struggle with affordability and knowledge of options and require targeted outreach to help them gain coverage. Going without coverage can have serious health consequences for the uninsured because they receive less preventive care, and delayed care often results in serious illness or other health problems. Being uninsured can also have serious financial consequences, with many unable to pay their medical bills, resulting in medical debt.
Ongoing debate about altering the ACA or limiting Medicaid to populations traditionally served by the program could lead to further loss of coverage and place more people in jeopardy of facing access barriers or financial strain due to being uninsured. On the other hand, if additional states opt to expand Medicaid as allowed under the ACA, there may be additional coverage gains as low-income individuals gain access to affordable coverage. The outcome of current debate over health coverage policy in the nation and the states has substantial implications for people’s coverage, access, and overall health and well-being.
Rachel Garfield and Kendal Orgera are with the Kaiser Family Foundation. Anthony Damico is an independent consultant to the Kaiser Family Foundation.
Appendix
| Appendix Table 1: Uninsured Rate Among the Nonelderly, 2013-2017 | |||||
|
| 2013Uninsured Rate | 2016Uninsured Rate | 2017Uninsured Rate | Change in Uninsured Rate2013-2017 | Change in Uninsured Rate2016-2017 |
| Total – Nonelderlya | 16.8% | 10.0% | 10.2% | -6.6%* | 0.2%* |
| Age | |||||
| Children – Total | 7.5% | 4.7% | 5.0% | -2.6%* | 0.3%* |
| Adults – Total | 20.6% | 12.1% | 12.3% | -8.2%* | 0.2%* |
| Adults 19-25 | 26.8% | 14.6% | 14.8% | -11.9%* | 0.2% |
| Adults 26-34 | 26.3% | 15.6% | 15.6% | -10.7%* | 0.0% |
| Adults 35-44 | 21.2% | 13.6% | 13.6% | -7.6%* | 0.0% |
| Adults 45-54 | 17.4% | 10.4% | 10.7% | -6.7%* | 0.3%* |
| Adults 55-64 | 13.4% | 7.5% | 7.9% | -5.5%* | 0.4%* |
| Annual Family Income | |||||
| <$20,000 | 28.0% | 17.1% | 17.2% | -10.8%* | 0.0% |
| $20,000 – $39,999 | 27.4% | 16.8% | 17.3% | -10.1%* | 0.5%* |
| $40,000 + | 11.4% | 7.1% | 7.5% | -3.9%* | 0.4%* |
| Family Poverty Levelb | |||||
| <100% | 26.2% | 16.5% | 16.6% | -9.6%* | 0.1% |
| 100-199% | 28.4% | 17.0% | 17.2% | -11.2%* | 0.3% |
| 200-399% | 17.7% | 11.3% | 11.7% | -5.9%* | 0.4%* |
| 400%+ | 6.8% | 4.1% | 4.5% | -2.3%* | 0.3%* |
| Household Type | |||||
| 1 Parent with childrenc | 11.5% | 6.8% | 7.1% | -4.4%* | 0.3% |
| 2 Parents with childrenc | 10.8% | 6.9% | 7.2% | -3.6%* | 0.3%* |
| Multigenerationald | 20.5% | 11.8% | 11.6% | -8.9%* | -0.2% |
| Adults living alone or with other adults | 20.1% | 11.6% | 11.8% | -8.3%* | 0.3%* |
| Other | 22.5% | 13.5% | 13.6% | -8.8%* | 0.1% |
| Family Work Status | |||||
| 2+ Full-time | 13.4% | 8.2% | 8.5% | -5.0%* | 0.3%* |
| 1 Full-time | 16.5% | 10.2% | 10.4% | -6.1%* | 0.2%* |
| Only Part-timee | 26.2% | 14.4% | 14.6% | -11.6%* | 0.2% |
| Non-Workers | 21.2% | 12.7% | 13.0% | -8.2%* | 0.3%* |
| Race/Ethnicity | |||||
| White only (non-Hispanic) | 12.3% | 7.1% | 7.3% | -5.0%* | 0.3%* |
| Black only (non-Hispanic) | 18.8% | 10.7% | 11.1% | -7.7%* | 0.5%* |
| Hispanic | 30.0% | 19.1% | 18.9% | -11.1%* | -0.2% |
| Asian/Native Hawaiian and Pacific Islander | 15.8% | 7.2% | 7.2% | -8.6%* | 0.0% |
| Am. Indian/Alaska Native | 30.4% | 22.0% | 22.0% | -8.4%* | 0.1% |
| Two or more racesf | 13.5% | 7.7% | 7.9% | -5.6%* | 0.2% |
| Citizenship | |||||
| U.S. citizen – native | 13.8% | 7.9% | 8.2% | -5.6%* | 0.3%* |
| U.S. citizen – naturalized | 20.3% | 9.8% | 10.0% | -10.3%* | 0.2% |
| Non-U.S. citizen, resident for < 5 years | 38.5% | 26.4% | 27.2% | -11.3%* | 0.8% |
| Non-U.S. citizen, resident for 5+ years | 51.4% | 37.0% | 36.0% | -15.4%* | -1.0%* |
| * Indicates a statistically significant difference from 2017 at the p < 0.05 level. a Nonelderly includes all individuals under age 65. b The U.S. Census Bureau’s poverty threshold for a family with two adults and one child was $19,730 in 2017. c Parent includes any person with a dependent child. d Multigenerational families with children include families with at least three generations in a household. Other families include those with adults are caring for children other than their own (e.g., a niece living with her aunt). e Part-time workers are defined as working < 35 hours per week. f Respondents can identify as more than one racial or ethnic group. The hierarchy we use for determining racial/ethnic categories places all respondents who self-identify as mixed race who do not also identify as Hispanic into the “Two or More Races” category. All individuals who identify with Hispanic ethnicity fall into the Hispanic category regardless of selected race. SOURCE: Kaiser Family Foundation analysis of the 2013-2017 American Community Survey (ACS). | |||||
Endnotes
- Kaiser Family Foundation analysis of 2013 American Community Survey (ACS), 1-Year Estimates. ↩︎
- Kaiser Family Foundation analysis of the 2017 American Community Survey (ACS), 1-Year Estimates. ↩︎
- Kaiser Family Foundation analysis of the 2017 National Health Interview Survey. ↩︎
- Ibid. ↩︎
- Kaiser Family Foundation State Health Facts, “Distribution of Eligibility for ACA Health Coverage Among those Remaining Uninsured as of 2017,” accessed January 2019, https://modern.kff.org/health-reform/state-indicator/distribution-of-eligibility-for-aca-coverage-among-the-remaining-uninsured/. ↩︎
- U.S. Department of Health and Human Services, Office of The Assistant Secretary for Planning and Evaluation, 2018 Poverty Guidelines. Available at: https://aspe.hhs.gov/poverty-guidelines. ↩︎
- Samuel L Dickman, David Himmelstein, and Steffie Woolhandler, Inequality and the health-care system in the USA (London, England: The Lancet, April 8, 2017), https://doi.org/10.1016/S0140-6736(17)30398-7. ↩︎
- Kaiser Family Foundation analysis of the 2013 Kaiser Survey of Low-Income Americans and the ACA, 2014. ↩︎
- Jennifer Tolbert, The Coverage Provisions in the Affordable Care Act: An Update (Washington, DC: Kaiser Family Foundation, March 2015), https://modern.kff.org/report-section/the-coverage-provisions-in-the-affordable-care-act-an-update-health-insurance-market-reforms/. ↩︎
- Tricia Brooks, Karina Wagnerman, Samantha Artiga, and Elizabeth Cornachione, Medicaid and CHIP Eligibility, Enrollment, Renewal, and Cost Sharing Policies as of January 2018: Findings from a 50-State Survey (Washington, DC: Kaiser Family Foundation, March 2018), https://modern.kff.org/medicaid/report/medicaid-and-chip-eligibility-enrollment-renewal-and-cost-sharing-policies-as-of-january-2018-findings-from-a-50-state-survey/. ↩︎
- Kaiser Family Foundation State Health Facts, “Status of State Action on the Medicaid Expansion Decision,” accessed January 2019, https://modern.kff.org/health-reform/state-indicator/state-activity-around-expanding-medicaid-under-the-affordable-care-act/. ↩︎
- Kaiser Family Foundation State Health Facts, “Medicaid Expansion Enrollment,” accessed January 2019, https://modern.kff.org/health-reform/state-indicator/medicaid-expansion-enrollment/. ↩︎
- Linda J Blumberg, John Holahan, and Erik Wengle, Are Nongroup Marketplace Premiums Really High? Not in Comparison with Employer Insurance, (Washington, DC: Urban Institute, February 2017), https://www.urban.org/research/publication/are-nongroup-marketplace-premiums-really-high-not-comparison-employer-insurance. ↩︎
- Some states run their own marketplace, and other state marketplaces are run by the federal government. Kaiser Family Foundation State Health Facts, “State Health Insurance Marketplace Types, 2018,” accessed January 2019, https://modern.kff.org/health-reform/state-indicator/state-health-insurance-marketplace-types/. ↩︎
- Kaiser Family Foundation, Web Briefing for Journalists: Key Issues Ahead of Marketplace Open Enrollment, October 2018, https://modern.kff.org/health-costs/event/web-briefing-for-journalists-key-issues-ahead-of-marketplace-open-enrollment/. ↩︎
- Ibid. ↩︎
- Kaiser Family Foundation. 2018 Employer Health Benefits Survey (Washington, DC: Kaiser Family Foundation, October 2018), https://modern.kff.org/health-costs/report/2018-employer-health-benefits-survey/. ↩︎
- U.S. Department of the Treasury, Internal Revenue Service, Form Rev. Proc. 2017-36, (Washington, DC: 2017), https://www.irs.gov/pub/irs-drop/rp-17-36.pdf. ↩︎
- U.S. Department of the Treasury, Internal Revenue Service, Form Rev. Proc. 2018-34, (Washington, DC: 2018), https://www.irs.gov/pub/irs-drop/rp-18-34.pdf. ↩︎
- Under the SHOP, employers with no more than 50 full-time equivalent (FTE) employees can purchase coverage and employers with no more than 25 FTE employees and annual wages below a limit ($53,000 for tax year 2017) may be eligible for tax credits for up to two years to reduce the cost of SHOP coverage. Beginning in January 2016, states had the option to expand the SHOP to include employers with 100 or fewer FTEs. For tax years beginning in 2014 or later, employers could receive a tax credit of up to 50% of the employer’s contribution to the premium, calculated on a sliding scale basis tied to average wages and number of employees. For small businesses with tax-exempt status meeting the requirements above, the tax credit is 35% of the employer contribution. In order to qualify, a business must pay premiums on behalf of employees enrolled in a qualified health plan offered through the SHOP marketplace or qualify for an exemption to this requirement. “Small Business Health Care Tax Credit and the SHOP Marketplace,” Internal Revenue Service, accessed December 2018, https://www.irs.gov/affordable-care-act/employers/small-business-health-care-tax-credit-and-the-shop-marketplace. Centers for Medicare and Medicaid Services, Health Insurance Marketplace, Who Can Use the SHOP Marketplace (Baltimore, MD: CMS, Health Insurance Marketplace, October 2014), https://marketplace.cms.gov/outreach-and-education/who-can-use-shop.pdf. ↩︎
- Kaiser Family Foundation, 2018 Employer Health Benefits Survey, (Washington, DC: Kaiser Family Foundation, October 2018), https://modern.kff.org/report-section/2018-employer-health-benefits-survey-summary-of-findings/. ↩︎
- Kaiser Family Foundation State Health Facts, “Health Insurance Coverage of Nonelderly 0-64,” accessed January 2019, https://modern.kff.org/other/state-indicator/nonelderly-0-64/. ↩︎
- Kaiser Family Foundation analysis of the 2010 and 2017 National Health Interview Survey. ↩︎
- “Individual Share Responsibility Provision – Reporting and Calculating the Payment.” ACA Individual Shared Responsibility Provision Calculating the Payment | Internal Revenue Service. February 2018. https://www.irs.gov/affordable-care-act/individuals-and-families/aca-individual-shared-responsibility-provision-calculating-the-payment. ↩︎
- Lawfully present immigrants who would be eligible for Medicaid but are in a five-year waiting period are eligible for tax credits for marketplace coverage. Samantha Artiga and Anthony Damico, Health Coverage and Care for Immigrants (Washington, DC: Kaiser Family Foundation, July 2017), http://modern.kff.org/disparities-policy/issue-brief/health-coverage-and-care-for-immigrants/. ↩︎
- R. Savransky, The Hill, Trump: There is no such thing as Obamacare anymore, October 2017, http://thehill.com/policy/healthcare/355658-trump-there-is-no-such-thing-as-obamacare-anymore. ↩︎
- Ashley Kirzinger, Liz Hamel, Biana DiJulio, Cailey Muñana, and Mollyann Brodie. Kaiser Health Tracking Poll – November 2017: The Politics of Health Insurance Coverage, ACA Open Enrollment, (San Francisco, CA: Kaiser Family Foundation, November 2017), https://modern.kff.org/health-reform/poll-finding/kaiser-health-tracking-poll-november-2017-the-politics-of-health-insurance-coverage-aca-open-enrollment/. ↩︎
- Karen Pollitz, Jennifer Tolbert, and Maria Diaz. Data Note: Changes in 2017 Federal Navigator Funding, (Washington, D.C.: Kaiser Family Foundation, October 2017), https://modern.kff.org/health-reform/issue-brief/data-note-changes-in-2017-federal-navigator-funding/. ↩︎
- Rabah Kamal, Ashley Semanskee, Michelle Long, Gary Claxton, and Larry Levitt, How the Loss of Cost-Sharing Subsidy Payments is Affecting 2018 Premiums, (San Francisco, CA: Kaiser Family Foundation, October 2017), https://modern.kff.org/health-reform/issue-brief/how-the-loss-of-cost-sharing-subsidy-payments-is-affecting-2018-premiums/. ↩︎
- Rabah Kamal, Cynthia Cox, Care Shoaibi, Brian Kaplun, Ashley Semanskee, and Larry Levitt, An Early Look at 2018 Premium Changes and Insurer Participation on ACA Exchanges (San Francisco, CA: Kaiser Family Foundation, August 2017), https://modern.kff.org/health-reform/issue-brief/an-early-look-at-2018-premium-changes-and-insurer-participation-on-aca-exchanges/. ↩︎
- Rabah Kamal, Cynthia Cox, Rachel Fehr, Marco Ramirez, Katherine Horstman, and Larry Levitt, How Repeat of the Individual Mandate and Expansion of Loosely Regulated Plans are Affecting 2019 Premiums, (San Francisco, CA: Kaiser Family Foundation, October 2018), https://modern.kff.org/health-costs/issue-brief/how-repeal-of-the-individual-mandate-and-expansion-of-loosely-regulated-plans-are-affecting-2019-premiums/. ↩︎
- Karen Pollitz and Gary Claxton, Proposals for Insurance Options That Don’t Comply with ACA Rules: Trade-offs in Cost and Regulation, (Washington, DC: Kaiser Family Foundation, April 2018), https://modern.kff.org/health-reform/issue-brief/proposals-for-insurance-options-that-dont-comply-with-aca-rules-trade-offs-in-cost-and-regulation/. ↩︎
- Karen Pollitz, Michelle Long, Ashley Semanskee, and Rabah Kamal, Understanding Short-Term Limited Duration Health Insurance (Washington, DC: Kaiser Family Foundation, April 2018), https://modern.kff.org/health-reform/issue-brief/understanding-short-term-limited-duration-health-insurance/. ↩︎
- MaryBeth Musumeci, Robin Rudowitz, Elizabeth Hinton, Larisa Antonisse, and Cornelia Hall, Section 1115 Medicaid Demonstration Waivers: The Current Landscape of Approved and Pending Waivers, (Washington, DC: Kaiser Family Foundation, September 2018), https://modern.kff.org/report-section/section-1115-medicaid-demonstration-waivers-the-current-landscape-of-approved-and-pending-waivers-issue-brief/. ↩︎
- Kaiser Family Foundation, Proposed Changes to “Public Charge” Policies for Immigrants: Implications for Health Coverage, (Washington, DC: Kaiser Family Foundation, September 2018), https://modern.kff.org/disparities-policy/fact-sheet/proposed-changes-to-public-charge-policies-for-immigrants-implications-for-health-coverage/. ↩︎
- Kaiser Family Foundation State Health Facts, “Marketplace Enrollment, 2014-2019,” Trend Graph: United States 2014-2019, accessed January 2019, https://modern.kff.org/health-reform/state-indicator/marketplace-enrollment. ↩︎
- Robin Rudowitz, MaryBeth Musumeci, and Cornelia Hall, Year End Review: December State Data for Medicaid Work Requirements in Arkansas (Washington, DC: Kaiser Family Foundation, January 2019), https://modern.kff.org/medicaid/issue-brief/state-data-for-medicaid-work-requirements-in-arkansas/. ↩︎
- MaryBeth Musumeci, Robin Rudowitz, and Barbara Lyons, Medicaid Work Requirements in Arkansas: Experience and Perspectives of Enrollees (Washington, DC: Kaiser Family Foundation, December 2018), https://modern.kff.org/medicaid/issue-brief/medicaid-work-requirements-in-arkansas-experience-and-perspectives-of-enrollees/. ↩︎
- Kaiser Family Foundation, In Focus: Immigrant Families, including Immigrants Lawfully in the U.S. and Those Who Are Undocumented, Report Rising Fear and Anxiety Affecting Their Daily Lives and Health (Washington, DC, December 13, 2017), https://modern.kff.org/disparities-policy/press-release/in-focus-immigrant-families-including-immigrants-lawfully-in-the-u-s-and-those-who-are-undocumented-report-rising-fear-and-anxiety-affecting-their-daily-lives-and-health/. ↩︎
- Kaiser Family Foundation analysis of 2013 American Community Survey (ACS), 1-Year Estimates. ↩︎
- Kaiser Family Foundation analysis of the 2017 American Community Survey (ACS), 1-Year Estimates. ↩︎
- Ibid. ↩︎
- Kaiser Family Foundation analysis of the 2017 American Community Survey (ACS), 1-Year Estimates. ↩︎
- Kaiser Family Foundation State Health Facts, “Distribution of Eligibility for ACA Health Coverage Among those Remaining Uninsured as of 2017,” accessed January 2019, https://modern.kff.org/health-reform/state-indicator/distribution-of-eligibility-for-aca-coverage-among-the-remaining-uninsured/. ↩︎
- Kaiser Family Foundation analysis based on 2017 Medicaid eligibility levels and March 2017 Current Population Survey, Annual Social and Economic Supplement. ↩︎
- Tricia Brooks, Karina Wagnerman, Samantha Artiga, and Elizabeth Cornachione, Medicaid and CHIP Eligibility, Enrollment, Renewal, and Cost-Sharing Policies as of January 2018: Findings from a 50-State Survey (Washington, DC: Kaiser Family Foundation, March 2018), https://modern.kff.org/medicaid/report/medicaid-and-chip-eligibility-enrollment-renewal-and-cost-sharing-policies-as-of-january-2018-findings-from-a-50-state-survey/. ↩︎
- Kaiser Family Foundation analysis of the 2017 American Community Survey (ACS), 1-Year Estimates. ↩︎
- Kaiser Family Foundation analysis of the 2017 National Health Interview Survey. ↩︎
- Kaiser Family Foundation analysis of the March 2017 Current Population Survey, Annual Social and Economic Supplement. ↩︎
- “Poverty Thresholds,” U.S. Census Bureau, accessed October 2018, http://www.census.gov/data/tables/time-series/demo/income-poverty/historical-poverty-thresholds.html. ↩︎
- Kaiser Family Foundation analysis of the 2017 American Community Survey (ACS), 1-Year Estimates. ↩︎
- See Supplemental Tables, Table 8. ↩︎
- Kaiser Family Foundation analysis of the March 2018 Current Population Survey, Annual Social and Economic Supplement. ↩︎
- Kaiser Family Foundation analysis of the 2017 American Community Survey (ACS), 1-Year Estimates. ↩︎
- Ibid. ↩︎
- Tricia Brooks, Karina Wagnerman, Samantha Artiga, and Elizabeth Cornachione, Medicaid and CHIP Eligibility, Enrollment, Renewal, and Cost-Sharing Policies as of January 2018: Findings from a 50-State Survey (Washington, DC: Kaiser Family Foundation, March 2018), https://modern.kff.org/medicaid/report/medicaid-and-chip-eligibility-enrollment-renewal-and-cost-sharing-policies-as-of-january-2018-findings-from-a-50-state-survey/. ↩︎
- Kaiser Family Foundation analysis of the 2017 American Community Survey (ACS), 1-Year Estimates. ↩︎
- Other public programs include some state-funded programs for immigrants otherwise ineligible for Medicaid. Kaiser Family Foundation analysis based on 2018 Medicaid eligibility levels and 2017 American Community Survey, 1-Year Estimates. ↩︎
- Julie L. Hudson and Asako S. Moriya, “Medicaid Expansion for Adults Had Measureable ‘Welcome Mat’ Effects on Their Children,” Health Affairs 36, no.9 (September 2017): 1643-51. ↩︎
- Elisabeth W. Burak, Health Coverage for Parents and Caregivers Helps Children (Washington, DC: Georgetown University Center for Children and Families, March 2017), https://ccf.georgetown.edu/wp-content/uploads/2017/03/Covering-Parents-v2.pdf. ↩︎
- Kaiser Family Foundation analysis of the 2017 American Community Survey (ACS), 1-Year Estimates. ↩︎
- Ibid. ↩︎
- Kaiser Family Foundation analysis of the 2017 National Health Interview Survey. ↩︎
- Rachel Garfield, Anthony Damico, Kendal Orgera, Gary Claxton, and Larry Levitt, Estimates of Eligibility for ACA Coverage among the Uninsured in 2016 (Washington, DC: Kaiser Family Foundation, June 2018), https://modern.kff.org/uninsured/issue-brief/estimates-of-eligibility-for-aca-coverage-among-the-uninsured-in-2016/. ↩︎
- Ashley Kirzinger, Liz Hamel, Cailey Muñana, and Mollyann Brodie. Kaiser Health Tracking Poll – March 2018: Non-Group Enrollees, (San Francisco, CA: Kaiser Family Foundation, April 2018), https://modern.kff.org/health-reform/poll-finding/kaiser-health-tracking-poll-march-2018-non-group-enrollees/. ↩︎
- Karen Pollitz, Jennifer Tolbert, and Ashley Semanskee. 2016 Survey of Health Insurance Marketplace Assister Programs and Brokers (Washington, DC: Kaiser Family Foundation, June 2016), http://modern.kff.org/health-reform/report/2016-survey-of-health-insurance-marketplace-assister-programs-and-brokers/. ↩︎
- Karen Pollitz, Jennifer Tolbert, and Maria Diaz. Data Note: Further Reductions in Navigator Funding for Federal Marketplace States, (Washington, D.C.: Kaiser Family Foundation, September 2018), https://modern.kff.org/health-reform/issue-brief/data-note-further-reductions-in-navigator-funding-for-federal-marketplace-states/. ↩︎
- Kaiser Family Foundation analysis of the 2016 National Health Interview Survey. ↩︎
- Ibid. ↩︎
- Ibid. ↩︎
- Kaiser Family Foundation analysis of the 2017 National Health Interview Survey. ↩︎
- Ibid. ↩︎
- Ibid. ↩︎
- Ibid. ↩︎
- Ibid. ↩︎
- Jack Hadley, “Insurance Coverage, Medical Care Use, and Short-term Health Changes Following an Unintentional Injury or the Onset of a Chronic Condition,” JAMA 297, no. 10 (March 2007): 1073-84. ↩︎
- Broadwater-Hollifield et al. “Predictors of Patient Adherence to Follow-Up Recommendations after an ED Visit,” The American Journal of Emergency Medicine 33, no.10 (October 2015): 1368-73. ↩︎
- Silvia Tejada et al., “Patient Barriers to Follow-Up Care for Breast and Cervical Cancer Abnormalities.” Journal of Women’s Health 22, no. 6 (June 2013): 507-517. ↩︎
- Steffie Woolhandler, et al., “The Relationship of Health Insurance and Mortality: Is Lack of Insurance Deadly?” Annals of Internal Medicine 167 (June 2017): 424-431. ↩︎
- Andrea S. Christopher, et al., “Access to Care and Chronic Disease Outcomes Among Medicaid-Insured Persons Versus the Uninsured,” American Journal of Public Health 106, no. 1 (January 2016): 63-69. ↩︎
- Institute of Medicine, America’s Uninsured Crisis: Consequences for Health and Health Care (Washington, DC: Institute of Medicine, February 2009), http://iom.nationalacademies.org/~/media/Files/Report%20Files/2009/Americas-Uninsured-Crisis-Consequences-for-Health-and-Health-Care/Americas%20Uninsured%20Crisis%202009%20Report%20Brief.pdf. ↩︎
- Fizan Abdullah et al., “Analysis of 23 Million US Hospitalizations: Uninsured Children Have Higher All-Cause In-Hospital Mortality,” Journal of Public Health 32, no. 2 (June 2010): 236-44. ↩︎
- Steffie Woolhandler, et al., “The Relationship of Health Insurance and Mortality: Is Lack of Insurance Deadly?” Annals of Internal Medicine 167 (June 2017): 424-431. ↩︎
- Destini A Smith, et al., “The effect of health insurance coverage and the doctor-patient relationship on health care utilization in high poverty neighborhoods.” Preventive Medicine Reports 7 (2017): 158-161. ↩︎
- Andrea S. Christopher, et al., “Access to Care and Chronic Disease Outcomes Among Medicaid-Insured Persons Versus the Uninsured,” American Journal of Public Health 106, no. 1 (January 2016): 63-69. ↩︎
- Kaiser Family Foundation analysis of the 2017 National Health Interview Survey. ↩︎
- Institute of Medicine, America’s Uninsured Crisis: Consequences for Health and Health Care (Washington, DC: Institute of Medicine, February 2009), http://iom.nationalacademies.org/~/media/Files/Report%20Files/2009/Americas-Uninsured-Crisis-Consequences-for-Health-and-Health-Care/Americas%20Uninsured%20Crisis%202009%20Report%20Brief.pdf. ↩︎
- Amanda Haboush-Deloye, Spencer Hensley, Masaru Teramoto, Tara Phebus, Denise Tanata-Ashby, “The Impacts of Health Insurance Coverage on Access to Healthcare in Children Entering Kindergarten,” Maternal and Child Health Journal 18, no.7 (Sep 2014): 1753-64. ↩︎
- MaryBeth Musumeci, Medicaid Restructuring and Children with Special Health Care Needs (Washington, DC: Kaiser Family Foundation, July 2017), https://modern.kff.org/report-section/medicaid-restructuring-and-children-with-special-health-care-needs-issue-brief/. ↩︎
- Sara Collins et al., Gaps in Health Insurance: Why So Many Americans Experience Breaks in Coverage and How the Affordable Care Act Will Help (The Commonwealth Fund, April 2012), http://www.commonwealthfund.org/~/media/Files/Publications/Issue%20Brief/2012/Apr/1594_collins_gaps_in_hlt_ins_tracking_brief_v2.pdf. ↩︎
- Amy Cassedy, Gerry Fairbrother, and Paul Newacheck, “The Impact of Insurance Instability on Children’s Access, Utilization, and Satisfaction with Health Care,” Ambulatory Pediatrics 8, no. 5 (October 2008): 321-8. ↩︎
- Thomas Buchmueller, Sean Orzol, and Lara Shore-Sheppard, “Stability of Children’s Insurance Coverage and Implications for Access to Care: Evidence from the Survey of Income and Program Participation”, International Journal of Health Care Finance and Economics 14, no.2 (Jun 2014). ↩︎
- Salam Abdus, “Part-Year Coverage and Access to Care for Nonelderly Adults,” Medical Care 52, no. 8 (August 2014): 709-14. ↩︎
- Amy Finkelstein et al., “The Oregon Health Insurance Experiment: Evidence from the First Year” (National Bureau of Economic Research, July 2011), http://www.nber.org/papers/w17190. ↩︎
- Katherine Baicker et al., “The Oregon Experiment — Effects of Medicaid on Clinical Outcomes,” New England Journal of Medicine 368 (May 2013): 1713-1722. ↩︎
- Larisa Antonisse, Rachel Garfield, Robin Rudowitz, and Samantha Artiga, The Effects of Medicaid Expansion on the ACA: Updated Findings From a Literature Review (Washington, D.C.: Kaiser Family Foundation, March 2018), https://modern.kff.org/medicaid/issue-brief/the-effects-of-medicaid-expansion-under-the-aca-updated-findings-from-a-literature-review-march-2018/. ↩︎
- James B Kirby and Jessica P. Vistnes,“Access to Care Improved for People Who Gained Medicaid or Marketplace Coverage in 2014” Health Affairs,35, no.10 (Oct 2016): 1830-1834. ↩︎
- Sara Rosenbaum, Jennifer Tolbert, Jessica Sharac, Peter Shin, Rachel Gunsalus, and Julia Zur, Community Health Centers: Growing Important in a Changing Health Care System, (Washington, DC: Kaiser Family Foundation, March 2018), https://modern.kff.org/medicaid/issue-brief/community-health-centers-growing-importance-in-a-changing-health-care-system/. ↩︎
- Allen Dobson, Joan DaVanzo, Randy Haught, and Phap-Hoa Luu, Comparing the Affordable Care Act’s Financial Impact on Safety-Net Hospitals in States That Expanded Medicaid and Those That Did Not, (New York, NY: The Commonweath Fund, November 2017), https://www.commonwealthfund.org/publications/issue-briefs/2017/nov/comparing-affordable-care-acts-financial-impact-safety-net. ↩︎
- Peter Shin et al., Health Center Patient Trends, Enrollment Activities, and Service Capacity: Recent Experience in Medicaid Expansion and Non-Expansion States, (Washington, DC: Kaiser Commission for Medicaid and the Uninsured, Dec 2015), https://modern.kff.org/medicaid/issue-brief/health-center-patient-trends-enrollment-activities-and-service-capacity-recent-experience-in-medicaid-expansion-and-non-expansion-states. ↩︎
- Julia Paradise, Sara Rosenbaum, Anne Markus, Jessica Sharac, Chi Tran, David Reynolds, and Peter Shin, Community Health Centers: Recent Growth and the Role of the ACA (Washington, DC: Kaiser Family Foundation, January 2017), https://modern.kff.org/medicaid/issue-brief/community-health-centers-recent-growth-and-the-role-of-the-aca/. ↩︎
- Ibid. ↩︎
- Kaiser Family Foundation analysis of the 2017 National Health Interview Survey. ↩︎
- Gerard Anderson , “From ‘Soak The Rich’ To ‘Soak The Poor’: Recent Trends In Hospital Pricing” Health Affairs 26, no. 4 (May 2007): 780-789. ↩︎
- Stacie Dusetzina, Ethan Basch, and Nancy Keating, “For Uninsured Cancer Patients, Outpatient Charges Can Be Costly, Putting Treatments out of Reach,” Health Affairs 34, no. 4 (April 2015): 584-591. ↩︎
- Kaiser Family Foundation analysis of the 2015 Kaiser Family Foundation/New York Times Medical Bills Survey. ↩︎
- Brent Asplin et al., “Insurance Status and Access to Urgent Ambulatory Care Follow-up Appointments,” JAMA 294, no. 10 (September 2005): 1248-54. ↩︎
- Brendan Saloner, et al., “Most Uninsured Adults Could Schedule Primary Care Appointments Before The ACA, But Average Price Was $160,” Health Affairs 34, no. 5 (May 2015), https://doi.org/10.1377/hlthaff.2014.1258. ↩︎
- Kaiser Family Foundation analysis of the 2015 Kaiser Family Foundation/New York Times Medical Bills Survey. ↩︎
- MEPS Summary Tables. Use, expenditures, and population. Available at: https://meps.ahrq.gov/mepstrends/hc_use/. ↩︎
- Roemer, M. I. Out-of-Pocket Health Care Expenses by Insurance Coverage, 2000-2014. Statistical Brief #500. February 2017. Agency for Healthcare Research and Quality, Rockville, MD. http://meps.ahrq.gov/mepsweb/data_files/publications/st500/stat500.pdf ↩︎
- Ibid. ↩︎
- Medicaid and CHIP Payment and Access Commission (MACPAC), Report to Congress on Medicaid and CHIP, Chapter 3: Annual Analysis of Disproportionate Share Hospital Allotments to States, (MACPAC, March 2018), https://www.macpac.gov/wp-content/uploads/2018/03/Annual-Analysis-of-Disproportionate-Share-Hospital-Allotments-to-States.pdf. ↩︎
- Ibid. ↩︎
- 42 U.S.C. § 1396r-4 (f)(7)(A). ↩︎
- Kaiser Family Foundation analysis of the 2017 National Health Interview Survey. ↩︎
- Liz Hamel, Mira Norton, Karen Pollitz, Larry Levitt, Gary Claxton, and Mollyann Brodie, The Burden of Medical Debt: Results from the Kaiser Family Foundation/New York Times Medical Bills Survey (Washington, DC: Kaiser Family Foundation, January 2016), http://modern.kff.org/health-costs/report/the-burden-of-medical-debt-results-from-the-kaiser-family-foundationnew-york-times-medical-bills-survey/. ↩︎
- Matthew Rae, Gary Claxton, and Larry Levitt, Do Health Plan Enrollees have Enough Money to Pay Cost Sharing? (Washington, DC: Kaiser Family Foundation, November 2017), https://modern.kff.org/health-costs/issue-brief/do-health-plan-enrollees-have-enough-money-to-pay-cost-sharing/. ↩︎
- Kaiser Family Foundation analysis of the 2017 National Health Interview Survey. ↩︎
- Consumer Financial Protection Bureau, “Consumer Experiences with Debt Collection: Findings from the CFPB’s Survey of Consumer Views on Debt.” (Consumer Financial Protection Bureau: January 2017), https://www.consumerfinance.gov/data-research/research-reports/consumer-experiences-debt-collection-findings-cfpbs-survey-consumer-views-debt/. ↩︎
- Ibid. ↩︎
- Liz Hamel, Mira Norton, Karen Pollitz, Larry Levitt, Gary Claxton, and Mollyann Brodie, The Burden of Medical Debt: Results from the Kaiser Family Foundation/New York Times Medical Bills Survey (Washington, D.C.: Kaiser Family Foundation, January 2016), https://modern.kff.org/report-section/the-burden-of-medical-debt-section-1-who-has-medical-bill-problems-and-what-are-the-contributing-factors/. ↩︎