
Survey of Non-Group Health Insurance Enrollees
Executive Summary
January 1, 2014 marked the beginning of several provisions of the Affordable Care Act (ACA) making significant changes to the non-group insurance market, including new rules for insurers regarding who they must cover and what they can charge, along with the opening of new Health Insurance Marketplaces (also known as “Exchanges”) and the availability of premium and cost-sharing subsidies for individuals with low to moderate incomes. Data from the Department of Health and Human Services and others provide some insight into how many people purchased insurance using the new Marketplaces and the types of plans they picked, but much remains unknown about changes to the non-group market as a whole. The Kaiser Family Foundation Survey of Non-Group Health Insurance Enrollees is the first in a series of surveys taking a closer look at the entire non-group market. This first survey was conducted from early April to early May 2014, after the close of the first ACA open enrollment period. It reports the views and experience of all non-group enrollees, including those with coverage obtained both inside and outside the Exchanges, and those who were uninsured prior to the ACA as well as those who had a previous source of coverage (non-group or otherwise).
The ACA motivated many non-group enrollees to get coverage, and nearly six in ten Exchange enrollees were previously uninsured
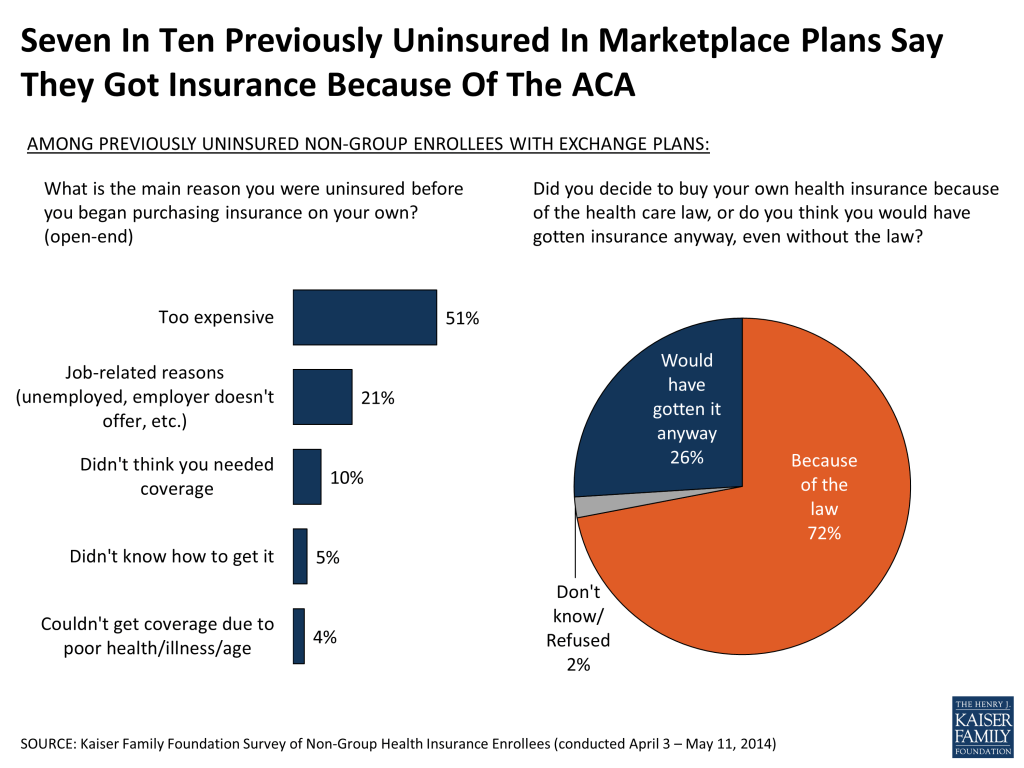
The survey finds that roughly two-thirds of those with non-group coverage are now in ACA-compliant plans, while three in ten have coverage they purchased before the ACA rules went into effect (referred to as “non-compliant plans” throughout this report). About half of all non-group enrollees now have coverage purchased from a Health Insurance Exchange, and nearly six in ten (57 percent) of those with Exchange coverage were uninsured prior to purchasing their current plan. Most of this previously uninsured group reports having gone without coverage for two years or more, and for many the ACA was a motivator in seeking coverage; seven in ten of those who were uninsured prior to purchasing a Marketplace plan say they decided to buy insurance because of the law, while just over a quarter say they would have gotten it anyway.
Enrollees in ACA-compliant plans report somewhat worse health than those in pre-ACA plans
While government data have provided some basic demographic information about Exchange plan enrollees, there has been no reliable information to date about the demographics of those enrolling in non-Exchange plans, or about the health status of either of these groups. The survey finds that the age and gender distribution is similar for those in ACA-compliant plans purchased inside and outside the Marketplace; overall, a third (34 percent) of adults with compliant plans are under age 35 and half (47 percent) are male. The survey does, however, find a difference in self-reported health status that may have implications for insurance market risk pools: those in compliant plans are more likely than those in non-compliant plans to report being in fair or poor health (17 percent versus 6 percent). This difference is largely driven by those with Exchange coverage, among whom 20 percent rate their health as fair or poor.
Majority gives positive ratings to their new insurance plans and says they are a good value, though four in ten find it difficult to afford their monthly premium
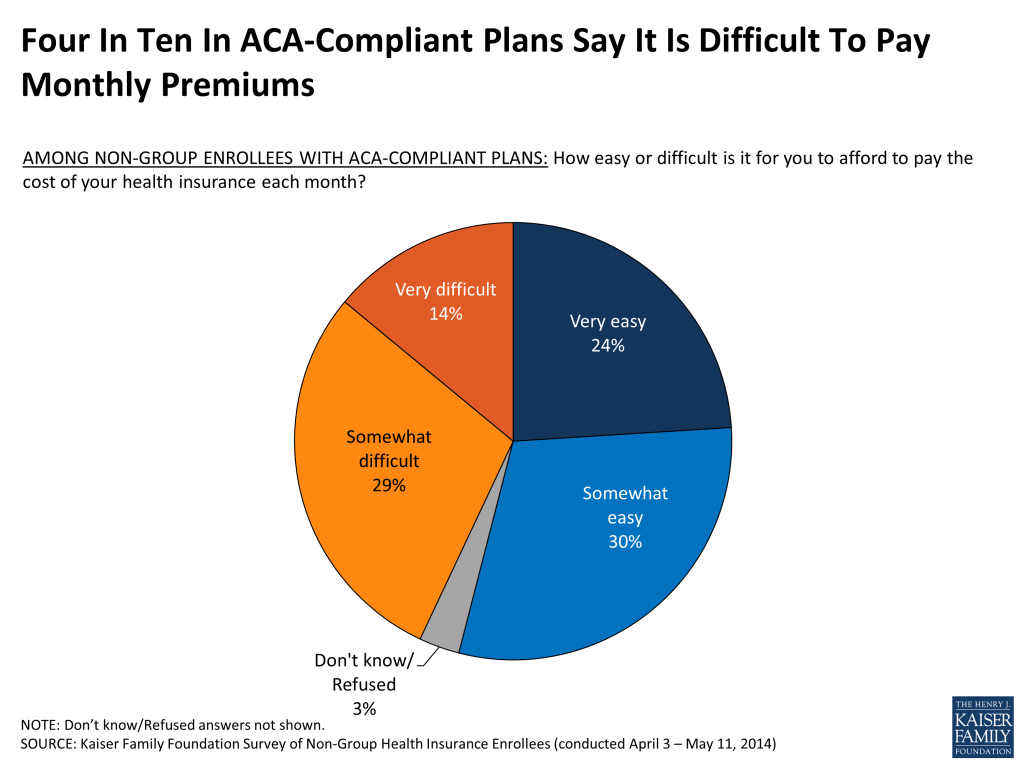
Overall, the majority of non-group enrollees rate their coverage as excellent or good, believe it is a good value for what they pay for it, and say they are satisfied with various aspects of their plans. Satisfaction is highest for choice of providers but somewhat lower for plan costs, and among those in compliant plans, about a third say they are not satisfied with their premiums and deductibles. Most feel well-protected by their plans and express confidence in their ability to pay for their usual medical costs, but some evidence of financial strain remains. Nearly half of those in ACA-compliant plans say they’re not confident they would be able to afford to pay for a major illness or injury, over four in ten say it is difficult to afford their monthly premiums, and over six in ten say they are worried that their premiums will become unaffordable in the future.
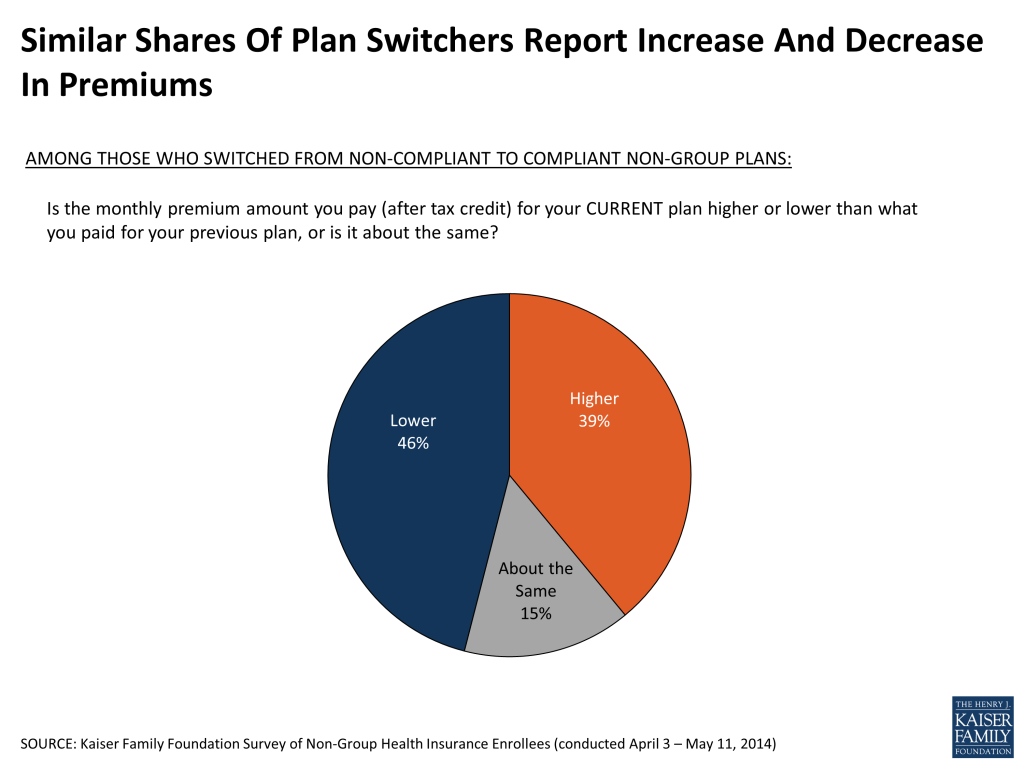
Among plan switchers, as many report paying less as paying more for their new plans, but survey shows some signs of a trend toward narrower provider networks
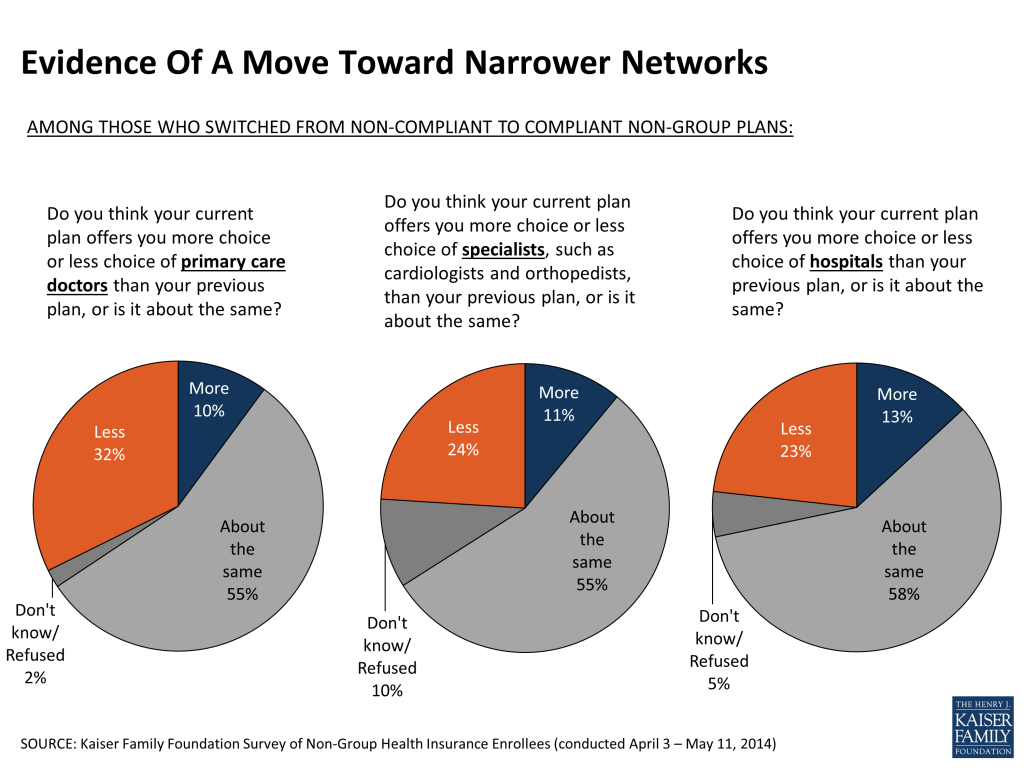
Among those who previously bought non-group insurance and have switched to a new, ACA-compliant plan (referred to as “plan switchers” throughout this report), nearly half (46 percent) say their current premium – taking into account government subsidies – is lower than it was under their previous plan, while four in ten (39 percent) say it is higher. This group’s responses to other survey questions suggest that the coverage they are getting is, on average, similar to what they had before. There is, however, some evidence of a trend toward plans with narrower provider networks. While over half of plan switchers say their choice of providers is “about the same” under their new plan as under their old plan, those who report a change in the amount of choice available are more likely to say they have less choice than more choice when it comes to primary care doctors (32 percent versus 10 percent) and specialists (24 percent versus 11 percent).
Plan switchers are less likely to be satisfied with plan costs, maybe because half of them report having their previous plan cancelled
Despite the fact that plan switchers are just as likely to say their premiums went down as went up under their new plan, this group stands out as being less satisfied with their plan costs and less likely to perceive their coverage as a good value compared to those in compliant plans who were previously uninsured. This may be related to the fact that about half of plan switchers report having received a cancellation notice from their previous insurer.
Half got help with enrollment; most say the shopping process was easy, but a third say it was difficult to set up a Marketplace account
Early problems with Healthcare.gov and many Exchange websites were widely reported in the media, and the survey finds that the Internet was the most commonly reported method of shopping and enrollment. However, it was not the only method; about a third of those with Exchange coverage and over half of those with compliant coverage purchased off-Exchange say they spent no part of the shopping and enrollment process on the Internet, and substantial shares report completing at least part of the enrollment process on the telephone or in person with someone helping them out. Overall, half of those in ACA-compliant plans say they got help with the enrollment process. Despite media reports of website and enrollment problems, most people in ACA-compliant plans purchased both on and off the Exchanges say it was at least somewhat easy to compare costs and coverage when shopping for plans. Still, 35 percent of Exchange enrollees in states using Healthcare.gov and 30 percent of those in states with their own Exchange websites say it was at least somewhat difficult to set up an account with the marketplace.
In the non-group market, those most likely to feel they have benefited from the ACA are people getting subsidies, those most likely to feel negatively impacted are those who had their plans cancelled
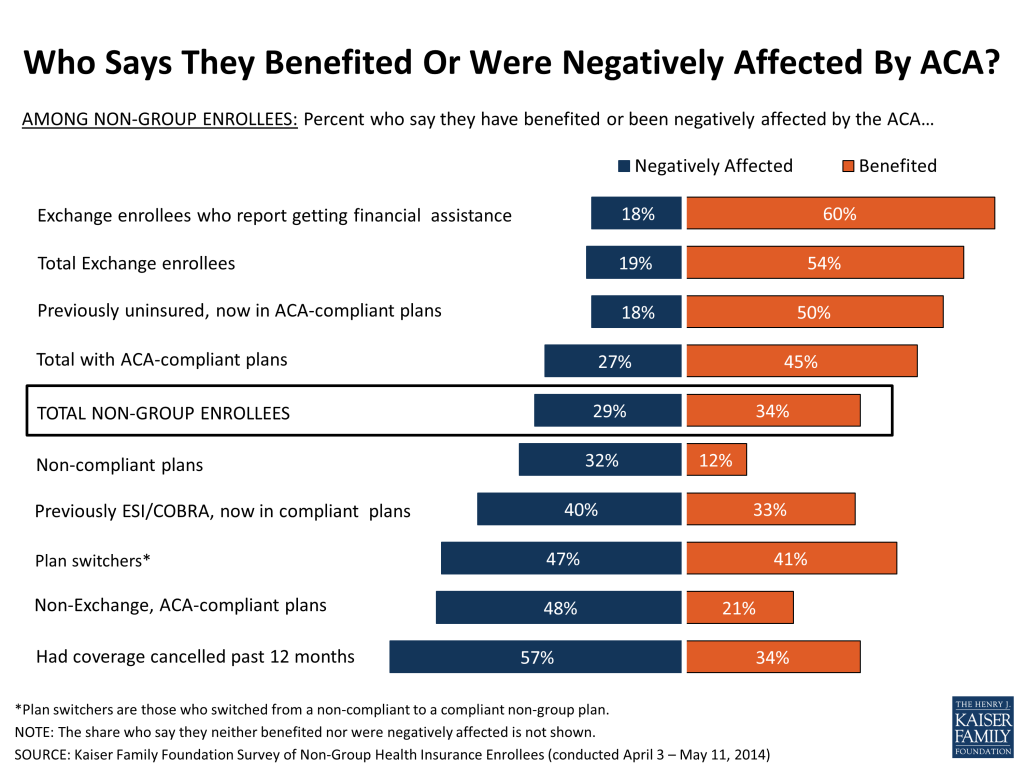
As a whole, non-group enrollees are more likely than the public overall to have a favorable view of the ACA – they are roughly evenly split between positive and negative views (47 percent favorable, 43 percent unfavorable), while views among 18-64 year-olds nationally are more negative than positive (38 percent favorable, 46 percent unfavorable1. Like it is nationally, opinion of the ACA among non-group enrollees is strongly divided along party lines. About equal shares of non-group enrollees feel their families have benefited (34 percent) and been negatively affected (29 percent) by the ACA. However, these averages mask substantial differences within the non-group market. Those who are most likely to feel they have benefited from the law are people receiving government financial assistance for Exchange plan premiums (60 percent benefited), while those most likely to feel they have been negatively affected by the law are people who experienced a plan cancellation in the past year (57 percent negatively affected). Read more here.
1. Kaiser Health Tracking Poll: May 2014. https://www.kff.org/health-reform/poll-finding/kaiser-health-tracking-poll-may-2014/
Executive Summary
January 1, 2014 marked the beginning of several provisions of the Affordable Care Act (ACA) making significant changes to the non-group insurance market, including new rules for insurers regarding who they must cover and what they can charge, along with the opening of new Health Insurance Marketplaces (also known as “Exchanges”) and the availability of premium and cost-sharing subsidies for individuals with low to moderate incomes. Data from the Department of Health and Human Services and others provide some insight into how many people purchased insurance using the new Marketplaces and the types of plans they picked, but much remains unknown about changes to the non-group market as a whole.
The Kaiser Family Foundation Survey of Non-Group Health Insurance Enrollees is the first in a series of surveys taking a closer look at the entire non-group market. This first survey was conducted from early April to early May 2014, after the close of the first ACA open enrollment period. It reports the views and experience of all non-group enrollees, including those with coverage obtained both inside and outside the Exchanges, and those who were uninsured prior to the ACA as well as those who had a previous source of coverage (non-group or otherwise).
The ACA motivated many non-group enrollees to get coverage, and nearly six in ten Exchange enrollees were previously uninsured
The survey finds that roughly two-thirds of those with non-group coverage are now in ACA-compliant plans, while three in ten have coverage they purchased before the ACA rules went into effect (referred to as “non-compliant plans” throughout this report). About half of all non-group enrollees now have coverage purchased from a Health Insurance Exchange, and nearly six in ten (57 percent) of those with Exchange coverage were uninsured prior to purchasing their current plan. Most of this previously uninsured group reports having gone without coverage for two years or more, and for many the ACA was a motivator in seeking coverage; seven in ten of those who were uninsured prior to purchasing a Marketplace plan say they decided to buy insurance because of the law, while just over a quarter say they would have gotten it anyway.
Enrollees in ACA-compliant plans report somewhat worse health than those in pre-ACA plans
While government data have provided some basic demographic information about Exchange plan enrollees, there has been no reliable information to date about the demographics of those enrolling in non-Exchange plans, or about the health status of either of these groups. The survey finds that the age and gender distribution is similar for those in ACA-compliant plans purchased inside and outside the Marketplace; overall, a third (34 percent) of adults with compliant plans are under age 35 and half (47 percent) are male. The survey does, however, find a difference in self-reported health status that may have implications for insurance market risk pools: those in compliant plans are more likely than those in non-compliant plans to report being in fair or poor health (17 percent versus 6 percent). This difference is largely driven by those with Exchange coverage, among whom 20 percent rate their health as fair or poor.
Majority gives positive ratings to their new insurance plans and says they are a good value, though four in ten find it difficult to afford their monthly premium
Overall, the majority of non-group enrollees rate their coverage as excellent or good, believe it is a good value for what they pay for it, and say they are satisfied with various aspects of their plans. Satisfaction is highest for choice of providers but somewhat lower for plan costs, and among those in compliant plans, about a third say they are not satisfied with their premiums and deductibles. Most feel well-protected by their plans and express confidence in their ability to pay for their usual medical costs, but some evidence of financial strain remains. Nearly half of those in ACA-compliant plans say they’re not confident they would be able to afford to pay for a major illness or injury, over four in ten say it is difficult to afford their monthly premiums, and over six in ten say they are worried that their premiums will become unaffordable in the future.
Among plan switchers, as many report paying less as paying more for their new plans, but survey shows some signs of a trend toward narrower provider networks
Among those who previously bought non-group insurance and have switched to a new, ACA-compliant plan (referred to as “plan switchers” throughout this report), nearly half (46 percent) say their current premium – taking into account government subsidies – is lower than it was under their previous plan, while four in ten (39 percent) say it is higher. This group’s responses to other survey questions suggest that the coverage they are getting is, on average, similar to what they had before. There is, however, some evidence of a trend toward plans with narrower provider networks. While over half of plan switchers say their choice of providers is “about the same” under their new plan as under their old plan, those who report a change in the amount of choice available are more likely to say they have less choice than more choice when it comes to primary care doctors (32 percent versus 10 percent) and specialists (24 percent versus 11 percent).
Plan switchers are less likely to be satisfied with plan costs, maybe because half of them report having their previous plan cancelled
Despite the fact that plan switchers are just as likely to say their premiums went down as went up under their new plan, this group stands out as being less satisfied with their plan costs and less likely to perceive their coverage as a good value compared to those in compliant plans who were previously uninsured. This may be related to the fact that about half of plan switchers report having received a cancellation notice from their previous insurer.
Half got help with enrollment; most say the shopping process was easy, but a third say it was difficult to set up a Marketplace account
Early problems with Healthcare.gov and many Exchange websites were widely reported in the media, and the survey finds that the Internet was the most commonly reported method of shopping and enrollment. However, it was not the only method; about a third of those with Exchange coverage and over half of those with compliant coverage purchased off-Exchange say they spent no part of the shopping and enrollment process on the Internet, and substantial shares report completing at least part of the enrollment process on the telephone or in person with someone helping them out. Overall, half of those in ACA-compliant plans say they got help with the enrollment process. Despite media reports of website and enrollment problems, most people in ACA-compliant plans purchased both on and off the Exchanges say it was at least somewhat easy to compare costs and coverage when shopping for plans. Still, 35 percent of Exchange enrollees in states using Healthcare.gov and 30 percent of those in states with their own Exchange websites say it was at least somewhat difficult to set up an account with the marketplace.
In the non-group market, those most likely to feel they have benefited from the ACA are people getting subsidies, those most likely to feel negatively impacted are those who had their plans cancelled
As a whole, non-group enrollees are more likely than the public overall to have a favorable view of the ACA – they are roughly evenly split between positive and negative views (47 percent favorable, 43 percent unfavorable), while views among 18-64 year-olds nationally are more negative than positive (38 percent favorable, 46 percent unfavorable1 ). Like it is nationally, opinion of the ACA among non-group enrollees is strongly divided along party lines. About equal shares of non-group enrollees feel their families have benefited (34 percent) and been negatively affected (29 percent) by the ACA. However, these averages mask substantial differences within the non-group market. Those who are most likely to feel they have benefited from the law are people receiving government financial assistance for Exchange plan premiums (60 percent benefited), while those most likely to feel they have been negatively affected by the law are people who experienced a plan cancellation in the past year (57 percent negatively affected).
Key Findings:
About The Groups Described In This Report
This survey reports on the views and experiences of all people purchasing health insurance coverage in the non-group market. However, because of the complexities of the market and the changes brought about by the ACA, much of this report breaks out responses by different subgroups based on how they obtained their coverage and their previous insurance status. The ACA made major changes to the non-group insurance market, including new rules that standardize coverage, guarantee access to those with pre-existing conditions, and provide subsidies based on income for those buying coverage through new Health Insurance Exchanges (also known as Marketplaces; these terms are used interchangeably throughout this report).
Those rules took effect for coverage beginning on or after January 1, 2014. People were able to purchase this “ACA-compliant” coverage either through an Exchange or directly from an insurance company during an open enrollment period that began October 1, 2013 and ended March 31, 2014 (with some opportunities for special enrollment periods after that). This survey includes individuals who purchased these new ACA-compliant plans, as well as people who are currently enrolled in “non-compliant” plans, including those who were grandfathered under the ACA because they were purchased before the law went into effect, those who renewed policies last year or bought coverage that began before January 1, and those who have been able to keep their old policies for a period of time under a federal transition policy at the discretion of states.
A more detailed breakdown of the main groups described in this report is provided below.
Total non-group market: All individuals ages 18-64 whose primary source of health insurance coverage is a plan they purchased themselves, either directly from an insurance company or through a state or federal Health Insurance Marketplace, regardless of plan start date (see Survey Methodology for more details on inclusion criteria).
ACA-compliant plans (68% of total non-group market2 ): Allplans that took effect on or after January 1, 2014, including those purchased through a state or federal Marketplace and those purchased directly from an insurance company.
Exchange plans (48% of total non-group market): Plans that were purchased from a state or federal Health Insurance Exchange, including Exchange plans purchased through a health insurance agent or broker.
Compliant, non-Exchange plans (16% of total non-group market): Plans that took effect on or after January 1, 2014 that were purchased directly from an insurance company, including non-Exchange plans purchased through a health insurance agent or broker.
ACA-compliant plans by prior insurance status3 :
Previously uninsured, now in ACA-compliant plan (34% of total non-group market): Those with ACA-compliant plans who say they were uninsured immediately prior to purchasing their current plan.
Plan switchers (those who switched from a non-compliant to a compliant plan, 13% of total non-group market): Those with ACA-compliant plans who say they were covered by a different non-group plan (presumably, a non-compliant plan) immediately prior to purchasing their current plan, including those who chose to switch and those who had their prior plans cancelled.
Previously employer-sponsored insurance/COBRA (12% of total non-group market): Those with ACA-compliant plans who say they were covered by an employer-sponsored plan or COBRA immediately prior to purchasing their current plan.
Non-compliant plans (31% of total non-group market): Plans purchased outside the Health Insurance Exchange that took effect before January 1, 2014.
Key Findings:
Section 1: Basic Demographics Of The Non-Group Market
Among the entire non-group market, about half of individuals (48 percent) report having coverage obtained from a state or federal Health Insurance Exchange, 16 percent have ACA-compliant coverage purchased outside of the Exchanges, and three in ten (31 percent) have non-ACA-compliant plans (those that have been in effect since before January 1, 2014).
| Figure 1: Share Of Non-Group Market By Plan Type | |
| Plan type | Share of non-group market |
| ACA-Compliant (Net) | 68% |
| Exchange | 48 |
| Non-Exchange | 16 |
| Unknown (purchased through broker) | 3 |
| Non-ACA-Compliant | 31 |
| Unknown if ACA-Compliant | 1 |
One of the questions that has yet to be answered by state and federal data is what share of enrollees in ACA-compliant plans were previously uninsured. The survey finds that half of all those with compliant plans report being uninsured just prior to purchasing their current plan, while about one in five each say they were previously covered by another non-group plan (19 percent) or had employer coverage or COBRA (18 percent), and 9 percent previously had Medicaid or other public coverage. Exchange enrollees are more likely to say they were previously uninsured (57 percent), while those buying ACA-compliant plans outside the government marketplace are more likely to report having previous employer coverage (30 percent) or other non-group coverage (27 percent).

Among those who were previously uninsured and enrolled in a Marketplace plan, most say the reason they previously lacked coverage was because they couldn’t afford it or had no access to employer-sponsored insurance. Most of this group had been uninsured for a long time – seven in ten (71 percent) say that before buying their current plan they had been uninsured for two years or more, including 45 percent who say they were uninsured for at least five years. Seven in ten (72 percent) of the previously uninsured in Exchange plans say they decided to buy their own health insurance because of the ACA, while just over a quarter (26 percent) say they would have gotten insurance anyway, even without the law. These shares are similar when based on all those in ACA-compliant who were uninsured prior to purchasing their current plan.
Data from the Department of Health and Human Services provide some basic demographics, including the age and gender distribution, for individuals who signed up for Exchange plans.4 However, so far there has been no reliable information about the demographics of those enrolling in non-Exchange plans as well, or about the health status of either of these groups. The survey finds that the age and gender distribution is similar for those in ACA-compliant plans purchased inside and outside the Marketplace; overall, a third (34 percent) of adults with compliant plans are under age 35 and slightly fewer than half (47 percent) are male. By comparison, those with non-compliant plans are somewhat younger (44 percent under age 35) and more likely to be male (56 percent). Nearly two-thirds (64 percent) of those with ACA-compliant plans report having individual coverage, while those with non-compliant plans are more evenly split between individual (47 percent) and family coverage (53 percent). (See Appendix Table 1 for more details.)
The health status of enrollees has particular significance because it has implications for whether premiums this year will be adequate to cover the health expenses of enrollees and how much insurers may increase premiums for next year. Since people are now guaranteed coverage regardless of their health, there has been an expectation that some people with pre-existing conditions who were previously denied access to insurance will enroll. However, there has been substantial uncertainty about whether healthier people will enroll as well, motivated by premium subsidies and the ACA’s requirement that people have coverage or pay a penalty.
While the majority of individuals in non-group plans report being in good health, the survey finds that those with ACA-compliant plans – which insurers rate as a single risk pool – are more likely than those with non-compliant plans to report their health as “only fair” or “poor” (17 percent versus 6 percent). This suggests that people in new, ACA-compliant plans are somewhat sicker than those in the non-group market previously, some of whom have been able to retain their non-compliant coverage under transition policies. What this might mean for premiums in the non-group market is still uncertain, however, since many insurers anticipated a sicker-than-average mix of enrollees when they set their premiums for this year.
| Figure 4: Self-Reported Health Status Of Those In Non-Group Market | ||||
| Percent who say in general, their health is… | Total in ACA-compliant plans | Exchange plans | Compliant planspurchased off-Exchange | Non-compliantplans |
| Excellent | 22% | 21% | 28% | 28% |
| Very good | 29 | 27 | 37 | 37 |
| Good | 31 | 31 | 26 | 28 |
| Fair | 13 | 16 | 7 | 6 |
| Poor | 4 | 4 | 2 | <1 |
Key Findings:
Section 2: How Do People In Different Groups Feel About Their Coverage?
The large majority of those with ACA-compliant plans purchased both inside and outside the Exchanges rate their coverage as excellent or good (72 percent of those with Exchange plans and 70 percent of those with non-Exchange plans). Those in non-compliant plans are even more likely to give high marks to their plans (85 percent), though this is offset by a larger share of those in compliant plans saying they don’t know how to rate their plans rather than a larger share giving their coverage poor marks, likely a reflection of the fact that most of those in compliant plans had only recently purchased coverage when the survey was conducted. Responses to this question are also similar to those given by people with employer-sponsored insurance in a separate national survey conducted in May.5 (See Appendix Table 2 for more details.)

More than half of those in compliant plans say their insurance is an excellent or good value for what they pay for it, though roughly four in ten rate the value as “only fair” or “poor,” similar to the shares among those with non-compliant plans. By comparison, those with employer-sponsored coverage interviewed in a separate national survey were more likely to rate their plan as an excellent or good value, likely reflecting the fact that for most of them, the employer pays a large portion of the premium.6

Majorities of those with ACA-compliant coverage report being satisfied with various aspects of their plans, including their choice of providers and plan costs such as premiums, deductibles, and copays. Satisfaction with choice of doctors and hospitals is higher than with plan costs, and among those in compliant plans, about a third report being unsatisfied with their premiums (33 percent) and deductibles (34 percent). While the large majority of those in compliant plans say they are satisfied with their choice of providers, about one in five say they are unsatisfied with their choice of specialists (20 percent), primary care doctors (19 percent), and hospitals (15 percent). Dissatisfaction with provider choice is somewhat higher among those in ACA-compliant plans than among those in non-compliant plans or among people with employer-sponsored coverage interviewed as part of a separate national survey (in the range of 5-7 percent for each of these measures, see Appendix Table 3 for more details).

More specifically when it comes to premiums, the survey finds that among those who previously bought non-group insurance and have switched to a new, ACA-compliant plan (referred to here as “plan switchers”), nearly half (46 percent) say their premium is lower under their current plan than it was under their previous plan, and about four in ten (39 percent) say it is higher.
Survey responses for plan switchers also indicate that their deductibles and level of coverage are, on average, similar to what they had in their previous plans. Roughly a third each of this group says their current deductible is higher, lower, and about the same as under their previous non-group plan. Similarly, when asked about the range of covered services and level of financial protection offered under their new plans, about four in ten plan switchers say these things are about the same, while roughly equal shares say they are better and worse.

Responses among plan switchers do offer some evidence of a trend toward plans with narrower networks. While over half say their choice of providers is “about the same” under their new plan as under their old plan, those reporting a change in the degree of choice are more likely to say they have less choice versus more choice when it comes to primary care doctors (32 percent versus 10 percent) and specialists (24 percent versus 11 percent).
Despite the fact that most plan switchers report paying similar premiums and getting similar coverage compared to their previous plans, this group stands out as being less satisfied with their plan costs and less likely to perceive their coverage as a good value compared to those in compliant plans who were previously uninsured. For example, 51 percent of plan switchers say the value of their coverage for what they pay for it is “only fair” or “poor”, compared with 32 percent of those who were previously uninsured. Similarly, plan switchers are twice as likely to say they are not satisfied with their premium compared with those who were previously uninsured (51 percent versus 25 percent). These differences may be related to the fact that about half of plan switchers report having received a cancellation notice from an insurer in the past year, compared with very small shares of those who were uninsured or had employer coverage before purchasing their current plan (see Appendix Tables 2 & 3 for more details).

What People Know And Don’t Know About Their Coverage
Health insurance is complicated, and many previous studies have documented gaps in health insurance literacy among consumers. The survey finds evidence of this among those who purchase their own coverage, with many respondents unable to answer some basic questions about their plans. For example, nearly one in five non-group enrollees (18 percent) say they don’t know the amount of their monthly premium and almost four in ten (37 percent) don’t know the amount of their annual deductible. Among those with ACA-compliant plans, three in ten (30 percent) say they don’t know the metal level of their plan (platinum, gold, silver or bronze)7 , and among those who report getting a government subsidy to defray their premium cost, nearly half (47 percent) couldn’t say what the amount of the subsidy is.
Some groups are more knowledgeable than others, including college graduates, those with higher incomes, and small business owners. Plan switchers, who likely have more experience buying coverage in the non-group market, are also more likely than those who were previously uninsured to be able to report the metal level of their plan and their premium and deductible amounts.
In addition to knowledge gaps about their own plans, a third (33 percent) of those with non-group coverage are unaware that the ACA provides financial assistance to help low- and moderate-income Americans purchase coverage. Those in compliant plans purchased outside the Exchanges (53 percent) are the least likely to know that the ACA provides these subsidies, while awareness is somewhat higher among those in non-compliant plans (66 percent) and highest among those with Exchange coverage (76 percent).
Despite these gaps in knowledge, most people with non-group coverage feel they have a pretty good idea of what their plan covers (75 percent say they understand this “very” or “somewhat” well) and what they will have to pay out-of-pocket when they use services (83 percent). This is true even among those who were uninsured before purchasing their current plan (See Appendix Table 4).
Key Findings:
Section 3: Affordability And Financial Protection
Health insurance brings with it a measure of financial security. Among those with ACA-compliant coverage, more than half (56 percent) say they feel well-protected by their health plans, including 59 percent of those who were previously uninsured. Still, this leaves over a third saying they feel vulnerable to high medical bills, rising to 51 percent in the “plan switchers” group. Those with non-compliant plans are more likely to say they feel well-protected, with the difference between the compliant and non-compliant groups largely driven by the “plan switchers” (see Appendix Table 5 for more details). By comparison, people with employer-sponsored coverage interviewed as part of a separate national survey are also more likely than those in compliant plans to say they feel well-protected (again, not surprising due to the fact that employer plans tend to have lower patient cost-sharing than non-group coverage and employers generally cover a portion of the premium).

Feelings of vulnerability may stem more from worries about unexpected medical costs rather than concerns about paying for routine care. Nearly two-thirds (63 percent) of those with compliant plans say they feel confident about paying for “usual” medical costs, but a somewhat smaller share (52 percent) say they feel confident about paying for a serious illness. This leaves nearly half (46 percent) feeling “not too confident” or “not at all confident” that they would have enough money or insurance to pay for a major illness or injury. Those with non-compliant plans are more likely to feel confident about paying for both types of costs, perhaps related to the fact that they report their previous year’s income as higher than those with compliant plans. Health status may also play a role; enrollees in non-compliant plans are more likely to report they are in excellent or good health status compared to those in compliant plans. Looking at the non-group market as a whole (including those in compliant and non-compliant plans), those in fair or poor health are less likely to say they are confident about paying for routine care than their healthier counterparts (55 percent versus 71 percent). (See Appendix Table 6 for more details.)

Despite the fact that most people report being satisfied with their premiums, cost pressures remain. Overall, forty-three percent of those with ACA-compliant plans say it is “very” or “somewhat” difficult for them to afford to pay their premium each month.
The ACA’s premium tax credits were designed to help alleviate affordability concerns for people with low and moderate incomes. The survey finds that nearly half (46 percent) of Exchange enrollees say they are getting financial help from the government to help pay their monthly premium, which is substantially lower than official data (according to the Department of Health and Human Services, 85 percent of those selecting a plan in the Marketplace qualified for a premium tax credit).8 Multiple factors may be contributing to this apparent under-reporting on the survey, but it is likely that at least some individuals receiving government financial help may be unaware that the government is paying a portion of their premium. As noted in the section above on health literacy, insurance concepts are complicated and many people have trouble reporting detailed information about their plans. During the enrollment process, some people may have been focused on the bottom line question of “What do I pay?” and less focused on whether that amount was subsidized or not. Still, the vast majority (85 percent) of those who do report getting assistance – representing 39 percent of all Exchange enrollees – say they would not have been able to afford insurance without this financial help.
Most people with non-group insurance also express at least some level of worry about their future ability to afford and access care and insurance. For example, about six in ten (62 percent) say they are “very” or “somewhat” worried that their insurance company will raise their premium so much that they will no longer be able to afford insurance. Among those who report receiving government subsidies, over half (54 percent) say they are worried that their income will change and they will no longer be eligible for this financial help.

Key Findings:
Section 4: The Process Of Shopping For And Obtaining Coverage
Early problems with Healthcare.gov and many state Exchange websites were widely reported in the media, and the survey finds that about two-thirds of Exchange enrollees and nearly half (47 percent) of those with compliant coverage purchased outside the Exchanges spent at least some part of the shopping and enrollment process on the Internet. Other methods of shopping and enrollment were also common, however. Roughly half of Exchange enrollees and about four in ten non-Exchange purchasers report spending at least part of the process on the phone, while just over a quarter (27 percent) of those with Exchange plans and more than four in ten (43 percent) of those with non-Exchange plans say they spent time in person with someone helping them sign up for coverage. Internet enrollment required the biggest time investment for the largest share of people, with 18 percent of Exchange enrollees and 16 percent of non-Exchange purchasers saying they spent at least 5 hours shopping and enrolling on the web.

Overall, half of those in ACA-compliant plans say they got outside help with the enrollment process, while the other half say they completed the process on their own. The most common source of help for people with Exchange coverage was an Exchange representative (24 percent), while the most common source of help for those with coverage obtained outside the Exchanges was a health insurance broker or agent (24 percent).
| Figure 17: Share In ACA-Compliant Plans Who Report Getting Help With Enrollment Process | |||
| Did someone help you enroll in health insurance or did you complete the enrollment process on your own? (If got help: Who was that person? Was it…) | Total in ACA-compliant plans | Exchange plans | Compliant plans purchased off-Exchange |
| Got help with enrollment process (NET) | 50% | 49% | 52% |
| From an Exchange representative | 18 | 24 | 4 |
| From a health insurance broker or agent | 13 | 8 | 24 |
| From a family member or friend | 8 | 7 | 16 |
| From a community or county health worker | 6 | 5 | 6 |
| Completed the enrollment process on your own | 49 | 51 | 48 |
Perhaps surprisingly given the extent to which Exchange website problems were reported in the media, most people in ACA-compliant plans purchased on and off the Exchanges say it was at least somewhat easy to compare costs and coverage when shopping for plans.9 Still, 35 percent of Exchange enrollees in states using Healthcare.gov and 30 percent of those in states with their own Exchange websites say it was at least somewhat difficult to set up an account with the marketplace, and roughly three in ten say it was difficult to figure out if their income qualified them for financial assistance.

When it comes to choosing their current plan, those with compliant coverage report considering a variety of factors as important to their health plan choice, with costs rising to the top of the list. Among those who considered multiple plans, eight in ten (80 percent) say the monthly premium was a “very” or “extremely” important factor in choosing their current plan over other choices available, and seven in ten (72 percent) say the same about the plan’s copay and deductible. Somewhat fewer – though still sizeable shares – report placing a lot of importance on provider choice and covered benefits (63 percent each), while far fewer say recommendations from friends or family were an important factor (24 percent).

Key Findings:
Section 5: How Do Non-Group Enrollees Feel About The ACA?
Overall, those with non-group insurance coverage are more likely to have a favorable view of the ACA than the public at large. Views among non-group enrollees are roughly evenly split between favorable (47 percent) and unfavorable (43 percent), while among adults nationwide in the same age range, more have an unfavorable view of the law (46 percent) than a favorable one (38 percent).10

However, the average above masks some differences within the non-group market. Majorities have a favorable view of the ACA among those with Exchange plans (58 percent) and those who were previously uninsured (53 percent). On the other side, majorities of those in non-compliant plans and those who switched from a non-compliant to a compliant one (the “plan switchers”) express an unfavorable view of the law (52 percent and 53 percent, respectively).
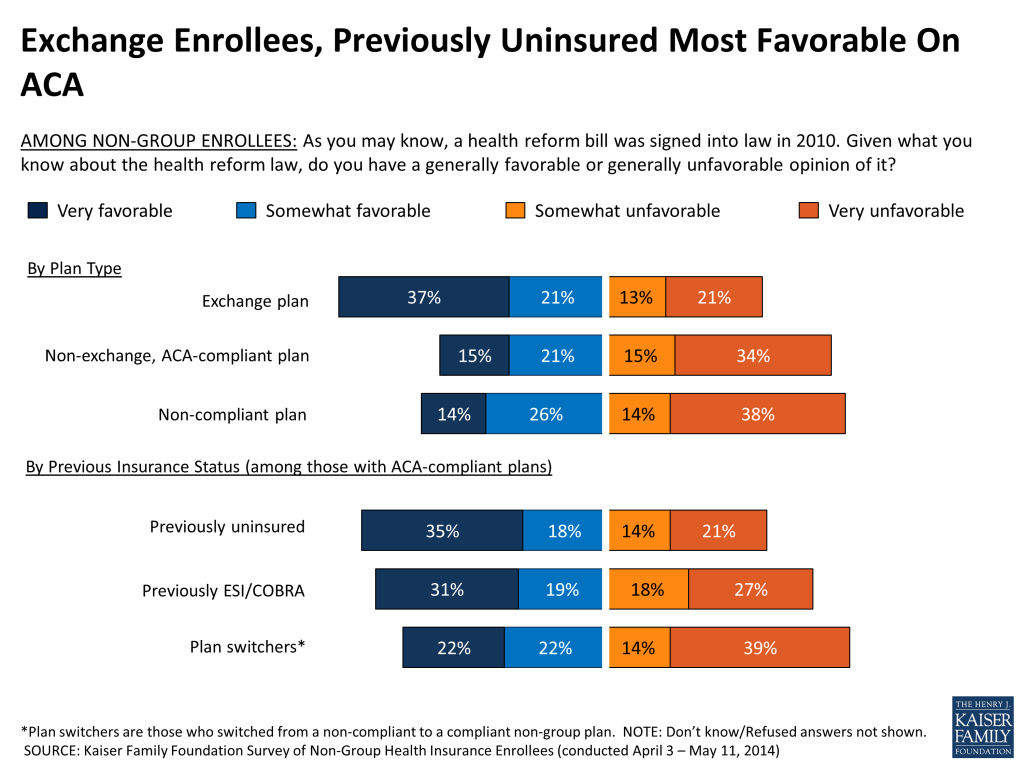
As has been the case nationally since the passage of the ACA, partisanship plays a major role in people’s views of the ACA among those in the non-group market as well, with a large majority of Republicans (78 percent) expressing an unfavorable view of the law, a large majority of Democrats (69 percent) expressing a favorable view, and independents almost evenly split (44 percent favorable, 48 percent unfavorable).

On balance, those with ACA-compliant plans are about twice as likely to say the law has made it easier rather than harder for them to shop and compare health plans (41 percent easier, 19 percent harder) and to find affordable coverage (44 percent easier, 20 percent harder). Similarly, about twice as many say the law has increased (38 percent) rather than decreased (19 percent) the health plan choices available to them. In each of these areas, those with Exchange coverage and those who were uninsured prior to purchasing their current plan are more likely to say the law has made things easier, while those with non-Exchange coverage are more likely to say the law hasn’t made a difference and plan switchers are more mixed as to the law’s impact.


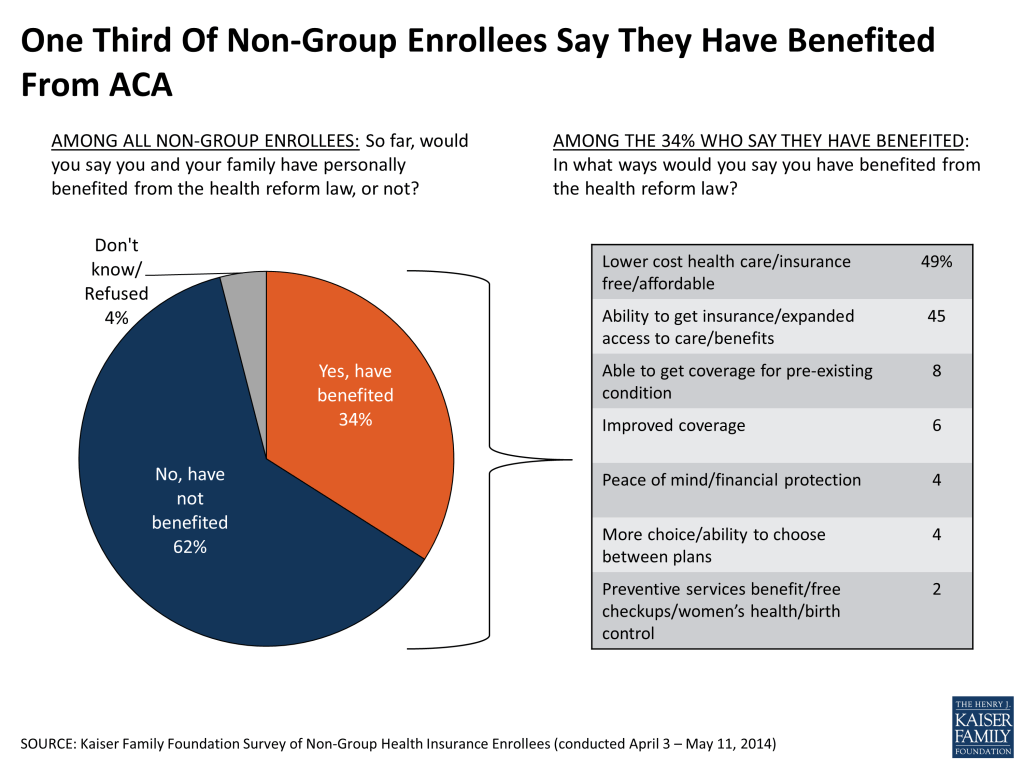
When asked about the overall impact of the ACA on their own families, similar shares of non-group enrollees report that they’ve benefited (34 percent) and been negatively affected (29 percent) by the law. Among the 34 percent who report benefiting, the main ways in which they feel the law has helped them are lower costs and expanded access to care and insurance. The 29 percent who feel they’ve been negatively affected are most likely to cite increased costs, followed far behind by a range of concerns like opposition to the individual mandate, cuts to benefits or choices, and policy cancellations.

Again, these averages mask some important differences within the non-group market. Those most likely to feel their families have benefited from the law include those with Exchange plans who report receiving government subsidies (60 percent), Exchange enrollees overall (54 percent), and the previously uninsured (50 percent). Those most likely to say the law has had a negative impact on their families include those who report experiencing a coverage cancellation in the past 12 months (57 percent), those who purchased ACA-compliant plans outside the Exchanges (48 percent), and the “plan switchers” who previously had other non-group coverage and are now in a compliant plan (47 percent).
Conclusion and Implications
The Affordable Care Act changes the non-group health insurance market substantially, requiring insurers to accept all applicants regardless of their health, standardizing coverage, creating new health insurance Exchanges to facilitate shopping for insurance, and providing income-based premium and cost-sharing subsidies. The Exchanges, along with expanded eligibility in Medicaid, are the primary mechanism for reducing the number of uninsured Americans under the ACA.
Currently, about two-thirds of non-group enrollees are in plans that meet all of the new rules (“ACA-compliant plans”), most of whom have purchased coverage through an Exchange. Three in ten remain in non-compliant plans, which includes those who were grandfathered under the ACA because they were purchased before the law went into effect, those who renewed policies last year or bought coverage that began before January 1, and those who have been able to keep their old policies for a period of time under a federal transition policy at the discretion of states. Over time, fewer people will remain in non-compliant plans as they lose or drop their coverage, and the only new plans available in the marketplace are those that comply with the ACA’s rules.
The new rules in the non-group market not only create new coverage opportunities for those who were previously uninsured, but they also mean changes for people who were buying their own coverage before the ACA took effect, in some cases creating disruption and in others better coverage at lower cost. The survey findings illustrate some of the real and perceived impacts of these changes on different groups.
For example, the survey finds that nearly six in ten of those now covered by Exchange plans were uninsured prior to signing up. The previously uninsured are one of the groups most likely to believe they have benefited from the ACA, and seven in ten of them say they would not have gotten coverage without the law. On the other side, people who were previously covered by non-group insurance and switched to an ACA-compliant plan (including those whose previous policies were cancelled because they didn’t meet the requirements of the health law and those who switched for other reasons) are one group that is more likely to feel they have been negatively affected by the law. However, in spite of reports last year about some people having plans cancelled and facing higher premiums, the survey finds that plan switchers are about as likely to report paying less for their new plan than their old one as to say they are paying more. This is likely due in part to the availability of tax credits for low- and moderate-income people who buy Marketplace coverage.
The survey also provides the first look at the health status of enrollees in ACA-compliant plans, which has implications for whether premiums this year will be adequate to cover the health expenses of enrollees and how much insurers may increase premiums for next year. While the majority of individuals in non-group plans report being in good health, those with ACA-compliant plans – which insurers rate as a single risk pool regardless of whether coverage was purchased on or off the Exchange – are more likely than those with non-compliant plans to report their health as “only fair” or “poor.” This suggests that people in new, ACA-compliant plans are somewhat sicker than those in the non-group market previously, some of whom have been able to retain their non-compliant coverage under transition policies. What this might mean for premiums in the non-group market is still uncertain, however, since many insurers anticipated a sicker-than-average mix of enrollees when they set their premiums for this year.
The survey’s findings about shopping and enrollment also have implications for future enrollment periods. While most of those who enrolled in coverage found it easy to compare plans, many spent significant time on the shopping process and half sought help with enrollment. This survey only looked at the experiences of those who successfully enrolled, and it’s likely that those who attempted to enroll but were unsuccessful encountered more problems with the process.
The non-group market will continue to undergo significant changes as people shift from non-compliant plans and more people enter the market in the years ahead. Though non-group enrollees represent a relatively modest share of the population, their experiences in the market have significant implications for whether the ACA is perceived as a success or not. This survey is the first in a series that the Foundation plans to conduct tracking the views and experiences of this important group.
Survey Methodology
The Kaiser Family Foundation (KFF) Survey of Non-Group Health Insurance Enrollees is the first in a series of surveys examining the views and experiences of people who purchase their own health insurance, either directly from an insurance company or through a state or federal Health Insurance Exchange created by the Affordable Care Act (ACA). The survey was designed and analyzed by researchers at KFF. Social Science Research Solutions (SSRS) collaborated with KFF researchers on sample design and weighting, and supervised the fieldwork.
The survey was conducted by telephone from April 3 through May 11, 2014 among a nationally representative random sample of 742 adults who purchase their own insurance. Computer-assisted telephone interviews conducted by landline (333) and cell phone (409, including 219 who had no landline telephone) were carried out in English and Spanish by SSRS. Respondents were considered eligible for the survey if they met the following criteria:
- Between the ages of 18-64
- Currently covered by health insurance that they purchase themselves
- Not covered by health insurance through an employer, COBRA, Medicare, Medicaid, or the U.S. military or VA
- If purchase insurance from a college or university, the insurance covers health services received both within and outside the university setting
- If a small business owner, the health insurance they purchase is only for themselves and/or their family, and does not cover non-related employees of their business
- If purchase from a trade association, respondent pays the entire premium themselves
- Respondent was able to answer a question about whether insurance was purchased directly from an insurance company, from a state or federal health insurance marketplace, or through a health insurance agent or broker (Q35 in questionnaire)
Because the study targeted a low-incidence population, the sample was designed to increase efficiency in reaching this group, and consisted of three parts: (1) respondents reached through RDD landline and cell phone dialing to previously uncalled (“fresh”) sample (N=179); (2) respondents reached by re-contacting those who indicated in a previous RDD survey that they either purchased their own insurance or were uninsured (N=186); (3) respondents reached as part of the SSRS Omnibus survey (N=377), a weekly, nationally representative RDD landline and cell phone survey. All RDD landline and cell phone samples were generated by Marketing Systems Group. The “fresh” sample was designed to oversample areas with a lower-income population in order to complete more interviews with respondents who were uninsured prior to the ACA open enrollment period (since being uninsured is negatively correlated with income).
A multi-stage weighting process was applied to ensure an accurate representation of the national population of non-group enrollees ages 18-64. The first stage of weighting involved corrections for sample design, including accounting for the low-income oversample used in the “fresh” sample, the likelihood of non-response for the re-contact sample, number of eligible household members for those reached via landline, and a correction to account for the fact that respondents with both a landline and cell phone have a higher probability of selection. In the second weighting stage, demographic adjustments were applied to account for systematic non-response along known population parameters. No reliable administrative data were available for creating demographic weighting parameters for this group, since the most recent Census figures could not account for the changing demographics of non-group insurance enrollees brought about by the ACA this year. Therefore, demographic benchmarks were derived by compiling a sample of all respondents ages 18-64 interviewed on the SSRS Omnibus survey during the field period (N=4,312) and weighting this sample to match the national 18-64 year-old population based on the 2013 U.S. Census Current Population Survey March Supplement parameters for age, gender, education, race/ethnicity, region, population density, marital status, and phone use. This sample was then filtered to include respondents qualifying for the current survey, and the weighted demographics of this group were used as post-stratification weighting parameters for the “fresh” sample (including gender, age, education, race/ethnicity, marital status, income, and population density). A final adjustment was made to the full sample to adjust for previous insurance status (estimated based on the combined “fresh” and omnibus samples), to address the possibility that the criteria used in selecting the prescreened sample could affect the estimates for previous insurance status.
Weighting adjustments had a minor impact on the overall demographic distribution of the sample, with the biggest adjustments being made based on age (this is common in all telephone surveys, as younger respondents are the most difficult to reach and convince to participate). Weighted and unweighted demographics of the final sample are shown in the table below.
| Unweighted % of total | Weighted % of total | ||
| Age | 18-25 | 13% | 20% |
| 26-34 | 13 | 17 | |
| 35-44 | 13 | 17 | |
| 45-54 | 21 | 19 | |
| 55-64 | 37 | 25 | |
| Refused | 2 | 2 | |
| Gender | Male | 47 | 50 |
| Female | 53 | 50 | |
| Education | Less than high school graduate | 5 | 8 |
| High school graduate | 31 | 32 | |
| Some college | 23 | 25 | |
| Graduated college | 24 | 20 | |
| Graduate school or more | 14 | 11 | |
| Technical school/other | 3 | 3 | |
| Refused | 1 | 1 | |
| Race/Ethnicity | White, non-Hispanic | 69 | 63 |
| Black, non-Hispanic | 13 | 13 | |
| Hispanic | 10 | 13 | |
| Other/Mixed | 6 | 10 | |
| Refused | 2 | 2 | |
| Self-reported health status | Excellent | 24 | 24 |
| Very good | 33 | 31 | |
| Good | 28 | 30 | |
| Fair | 11 | 11 | |
| Poor | 4 | 3 | |
| Don’t know/refused | * | 1 | |
| Plan Type | Exchange plans | 46 | 48 |
| ACA-compliant, non-Exchange plans | 17 | 16 | |
| Compliant, unknown if Exchange | 3 | 3 | |
| Non-compliant plans | 33 | 31 | |
| Unknown if compliant | 1 | 1 |
All statistical tests of significance account for the effect of weighting. The sample size and margin of sampling error (MOSE) for key subgroups are shown in the table below.
| Group | N (unweighted) | MOSE |
| Total | 742 | +/-4 percentage points |
| Compliant plans | 488 | +/-5 percentage points |
| Exchange plans | 340 | +/-6 percentage points |
| Compliant, non-Exchange plans | 127 | +/-11 percentage points |
| Non-compliant plans | 247 | +/-7 percentage points |
| Compliant, previously uninsured | 223 | +/-8 percentage points |
| Compliant, previously ESI/COBRA | 100 | +/-11 percentage points |
| Plan switchers | 114 | +/-11 percentage points |
Endnotes
- Kaiser Health Tracking Poll: May 2014. https://modern.kff.org/health-reform/poll-finding/kaiser-health-tracking-poll-may-2014/ ↩︎
- Three percent of non-group enrollees overall are in ACA-compliant plans that were purchased through a broker but were unsure if their plan was purchased through an Exchange or not. These respondents are not included in either the “Exchange” or “Compliant, non-Exchange” groups. ↩︎
- Nine percent of non-group enrollees overall are in ACA-compliant plans and either say they were covered by some other type of insurance (including Medicaid) before purchasing their current plan or did not answer the question about previous insurance status. These respondents are not included in any of the breakout groups of ACA-compliant plans by prior insurance status. ↩︎
- DHHS Office of the Assistant Secretary for Planning and Evaluation Issue Brief, “Health Insurance Marketplace: Summary Enrollment Report For The Initial Annual Open Enrollment Period,” May 1, 2014. http://aspe.hhs.gov/health/reports/2014/MarketPlaceEnrollment/Apr2014/ib_2014Apr_enrollment.pdf ↩︎
- Kaiser Health Tracking Poll: May 2014. https://modern.kff.org/health-reform/poll-finding/kaiser-health-tracking-poll-may-2014/ ↩︎
- Kaiser Health Tracking Poll: May 2014. https://modern.kff.org/health-reform/poll-finding/kaiser-health-tracking-poll-may-2014/ ↩︎
- Among those in Marketplace plans who report a metal level, the distribution of self-reported responses in the survey looks somewhat different from administrative data released by the Department of Health and Human Services (http://aspe.hhs.gov/health/reports/2014/MarketPlaceEnrollment/Apr2014/ib_2014Apr_enrollment.pdf). Silver is the most common metal tier in both data sources, but the survey finds a somewhat lower share reporting Silver plans (48 percent versus 65 percent) and a somewhat higher share reporting Bronze plans (30 percent versus 20 percent) compared with HHS. Differences between self-reported data from surveys and administrative data are not uncommon, particularly when it comes to a complicated topic like details about one’s health insurance plan. ↩︎
- DHHS Office of the Assistant Secretary for Planning and Evaluation Issue Brief, “Health Insurance Marketplace: Summary Enrollment Report For The Initial Annual Open Enrollment Period,” May 1, 2014. http://aspe.hhs.gov/health/reports/2014/MarketPlaceEnrollment/Apr2014/ib_2014Apr_enrollment.pdf ↩︎
- Since this is a survey of people who are enrolled in health plans, it only includes those who successfully completed the enrollment process and may not fully represent the ease or difficulty of the process for all those who tried to enroll. ↩︎
- Kaiser Health Tracking Poll: May 2014. https://modern.kff.org/health-reform/poll-finding/kaiser-health-tracking-poll-may-2014/ ↩︎