2020 Employer Health Benefits Survey
Abstract
This annual survey of employers provides a detailed look at trends in employer-sponsored health coverage, including premiums, employee contributions, cost-sharing provisions, offer rates, wellness programs, and employer practices. The 2020 survey included 1,765 interviews with non-federal public and private firms.
Annual premiums for employer-sponsored family health coverage reached $21,342 this year, up 4% from last year, with workers on average paying $5,588 toward the cost of their coverage. The average deductible among covered workers in a plan with a general annual deductible is $1,644 for single coverage. Fifty-five percent of small firms and 99% of large firms offer health benefits to at least some of their workers, with an overall offer rate of 56%.
Survey results are released in several formats, including a full report with downloadable tables on a variety of topics, a summary of findings, and an article published in the journal Health Affairs.
NEWS RELEASE
- A news release announcing the publication of the 2020 Employer Health Benefits Survey is available.
SUMMARY OF FINDINGS
- The Summary of Findings provides an overview of the 2020 survey results and is available under the Summary of Findings.
FULL REPORT
- The complete Employer Health Benefits Survey report includes over 200 exhibits and is available under the Report. The “Report” contains 13 separate sections. Users can view each section separately or download the section exhibits from the right side of the respective section page.
HEALTH AFFAIRS
- The peer-reviewed journal Health Affairs has published an article with key findings from the 2020 survey: Health Benefits In 2020: Premiums Inch Higher, Employers Respond to Federal Policy.
INTERACTIVE GRAPHIC
- This graphing tool allows users to look at changes in premiums and worker contributions for covered workers at different types of firms over time: Premiums and Worker Contributions Among Workers Covered by Employer-Sponsored Coverage, 1999-2020.
KEY EXHIBITS-CHARTPACK
- More than 20 overview slides from the 2020 Employer Health Benefits Survey are available as a slideshow.
2020 TABLES BY SECTION
ADDITIONAL RESOURCES
- Standard errors for selected estimates are available in the Technical Supplement here.
- Employer Health Benefits Surveys from 1998–2019 are available here. Please note that historic survey reports have not been revised with methodological changes.
- Researchers may request a public use dataset by going to Contact Us and choosing “TOPIC: Health Costs.”
Summary of Findings
Employer-sponsored insurance covers approximately 157 million people.1 To provide current information about employer-sponsored health benefits, the Kaiser Family Foundation (KFF) conducts an annual survey of private and non-federal public employers with three or more workers. This is the twenty-second Employer Health Benefits Survey (EHBS) and reflects employer-sponsored health benefits in 2020.
The social and economic upheavals resulting from the coronavirus pandemic have certainly impacted employers, workers and employee benefits. The EHBS was fielded between January and late July, which means that a portion of the interviews were conducted before the full impact of the pandemic became apparent, and other interviews were conducted as the implications unfolded; including during the period of significant job loss that occurred during and after March. Many of the metrics we look at, such as premiums, contributions, cost sharing and plan offerings, are determined before plan year begins, so it is likely that responses for those items were largely unaffected by the pandemic. Responses for other items, such as incentives for health screenings or inclusion of coverage for telehealth visits, may have changed during the course of the pandemic: employers for example, may have suspended certain incentives to accommodate employee reluctance to visit provider offices. As such we cannot determine how the pandemic has affected employer responses. Because of the timing of the survey, we were unable to include any direct questions about how employers reacted to the pandemic.
HEALTH INSURANCE PREMIUMS AND WORKER CONTRIBUTIONS
In 2020, the average annual premiums for employer-sponsored health insurance are $7,470 for single coverage and $21,342 for family coverage [Figure A]. The average single premium increased 4% and the average family premium increased 4% over the past year. Workers’ wages increased 3.4% and inflation increased 2.1%.2
The average premium for family coverage has increased 22% over the last five years and 55% over the last ten years [Figure A].
For covered workers in small firms, the average premium is similar to the average premium in large firms for single coverage ($7,483 vs. $7,466) but is lower than the average premium in large firms for family coverage ($20,438 vs. $21,691). The average premiums for covered workers in HDHP/SOs is lower for single coverage ($6,890) but similar for family coverage ($20,359) to the overall average premiums [Figure B]. Covered workers enrolled in PPOs have higher average premiums for single ($7,880) and family coverage ($22,248) than the overall average premiums. The average premium for family coverage for covered workers in firms with a relatively large share of lower-wage workers (where at least 35% of the workers earn $26,000 annually or less) is lower than the average premium for covered workers in firms with a smaller share of lower-wage workers ($19,332 vs. $21,486).
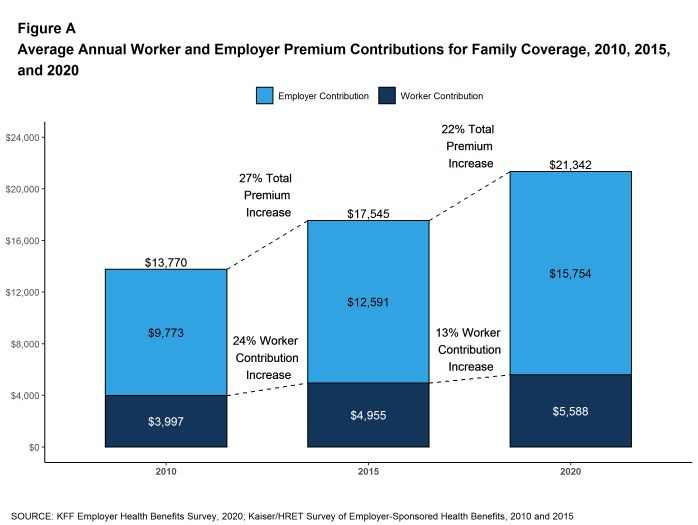
Figure A: Average Annual Worker and Employer Premium Contributions for Family Coverage, 2010, 2015, and 2020
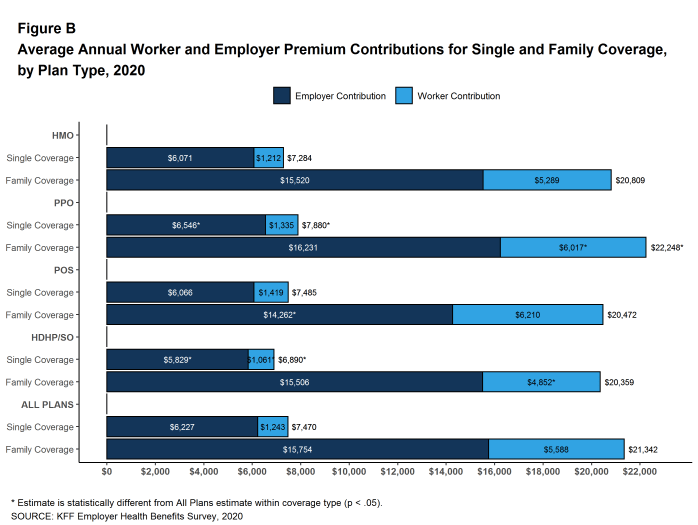
Figure B: Average Annual Worker and Employer Premium Contributions for Single and Family Coverage, by Plan Type, 2020
Most covered workers make a contribution toward the cost of the premium for their coverage. On average, covered workers contribute 17% of the premium for single coverage and 27% of the premium for family coverage. Compared to covered workers in large firms, covered workers in small firms on average contribute a higher percentage of the premium for family coverage (35% vs. 24%). Covered workers in firms with a relatively large share of lower-wage workers have higher average contribution rates for family coverage (38% vs. 26%) than those in firms with a smaller share of lower-wage workers.3 Covered workers at private for-profit firms on average contribute a higher percentage of the premium for both single and family coverage than covered workers at other firms for both single and family coverage.
Twenty-seven percent of covered workers in small firms are in a plan where the employer pays the entire premium for single coverage, compared to only 4% of covered workers in large firms. In contrast, 28% of covered workers in small firms are in a plan where they must contribute more than one-half of the premium for family coverage, compared to 4% of covered workers in large firms [Figure C].
The average annual dollar amounts contributed by covered workers for 2020 are $1,243 for single coverage and $5,588 for family coverage, similar to the amounts last year. The average dollar contribution for family coverage has increased 13% since 2015 and 40% since 2010 [Figure A]. Average contribution amounts for covered workers in HDHP/SOs are lower than the average overall worker contribution amounts for both single and family coverage [Figure B]. Six percent of covered workers, including 17% of covered workers in small firms, are in a plan with a worker contribution of $12,000 or more for family coverage.

Figure C: Distribution of Percentage of Premium Paid by Covered Workers for Single and Family Coverage, by Firm Size, 2020
PLAN ENROLLMENT
PPOs are the most common plan type, enrolling 47% of covered workers in 2020. Thirty-one percent of covered workers are enrolled in a high-deductible plan with a savings option (HDHP/SO), 13% in an HMO, 8% in a POS plan, and 1% in a conventional (also known as an indemnity) plan [Figure D]. The percentage of covered workers enrolled in HMOs is significantly lower than the percentage last year (13% vs. 19%). This percentage has risen and fallen over the last four years so it is unclear if this trend will continue.
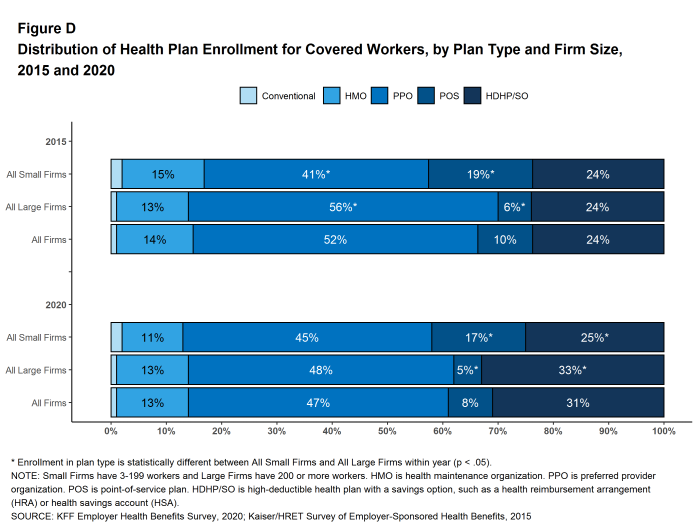
Figure D: Distribution of Health Plan Enrollment for Covered Workers, by Plan Type and Firm Size, 2015 and 2020
Self-Funding. Sixty-seven percent of covered workers, including 23% of covered workers in small firms and 84% in large firms, are enrolled in plans that are self-funded. The percentage of firms offering health benefits that are self funded in 2020 is higher than the percentage (61%) last year.
Thirteen percent of small firms report that they have a level-funded plan, similar to the percentage last year. These arrangements combine a relatively small self-funded component with stoploss insurance with low attachment points that may transfer a substantial share of the risk to insurers. These arrangements are complex and some small employers may not be entirely certain about the funding status of their plans. Among covered workers in small firms, 31% are in a plan that is either self-funded or told us that their plan was level-funded, higher than the percentage (24%) last year.
EMPLOYEE COST SHARING
Most covered workers must pay a share of the cost when they use health care services. Eighty-three percent of covered workers have a general annual deductible for single coverage that must be met before most services are paid for by the plan.
Among covered workers with a general annual deductible, the average deductible amount for single coverage is $1,644, similar to the average deductible last year. The average deductible for covered workers is higher in small firms than large firms ($2,295 vs. $1,418). The average single coverage annual deductible among covered workers with a deductible has increased 25% over the last five years and 79% over the last ten years.
Deductibles have increased in recent years due to higher deductibles within plan types and higher enrollment in HDHP/SOs. While growing deductibles in PPOs and other plan types generally increase enrollee out-of-pocket liability, the shift to enrollment in HDHP/SOs does not necessarily do so if HDHP/SO enrollees receive an offsetting account contribution from their employers. Ten percent of covered workers in an HDHP with a Health Reimbursement Arrangement (HRA), and 3% of covered workers in a Health Savings Account (HSA)-qualified HDHP receive an account contribution for single coverage at least equal to their deductible, while another 41% of covered workers in an HDHP with an HRA and 19% of covered workers in an HSA-qualified HDHP receive account contributions that, if applied to their deductible, would reduce their actual liability to less than $1,000.
We can look at the increase in the average deductible as well as the growing share of covered workers who have a deductible together by calculating an average deductible among all covered workers (assigning a zero to those without a deductible). The 2020 value of $1,364 is 27% higher than the average general annual deductible for single coverage of $1,077 in 2015 and 111% higher than the average general annual deductible of $646 in 2010.
Another way to look at deductibles is the percentage of all covered workers who are in a plan with a deductible that exceeds certain thresholds. Over the past five years, the percentage of covered workers with a general annual deductible of $2,000 or more for single coverage has grown from 19% to 26% [Figure E].
Whether or not a deductible applies, a large share of covered workers also pay a portion of the cost when they visit an in-network physician. Most covered workers face a copayment (a fixed dollar amount) when they visit a doctor, although some workers face coinsurance requirements (a percentage of the covered amount). The average copayments are $26 for primary care and $42 for specialty care. The average coinsurance rates are 18% for primary care and 19% for specialty care. These amounts are similar to those in 2019.
Most workers also face additional cost sharing for a hospital admission or outpatient surgery. Sixty-five percent of covered workers have coinsurance and 13% have a copayment for hospital admissions. The average coinsurance rate for a hospital admission is 20% and the average copayment is $311 per hospital admission. The cost-sharing provisions for outpatient surgery follow a similar pattern to those for hospital admissions.
Virtually all covered workers are in plans with a limit on in-network cost sharing (called an out-of-pocket maximum) for single coverage, though the limits vary significantly. Among covered workers in plans with an out-of-pocket maximum for single coverage, 11% are in a plan with an out-of-pocket maximum of less than $2,000, while 18% are in a plan with an out-of-pocket maximum of $6,000 or more.
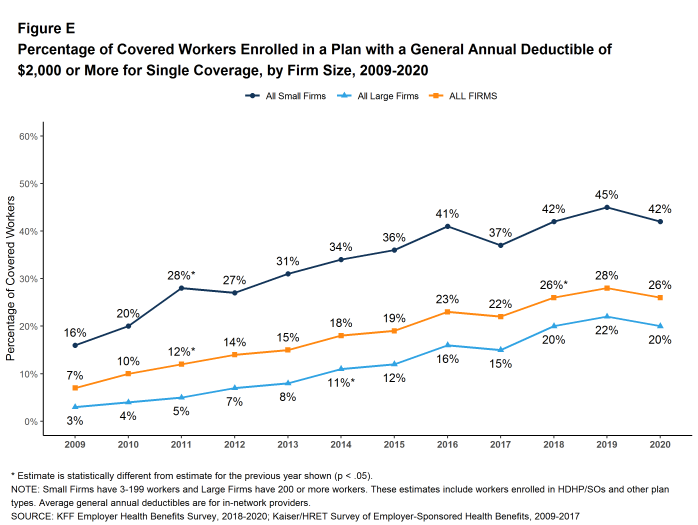
Figure E: Percentage of Covered Workers Enrolled in a Plan With a General Annual Deductible of $2,000 or More for Single Coverage, by Firm Size, 2009-2020
AVAILABILITY OF EMPLOYER-SPONSORED COVERAGE
Fifty-six percent of firms offer health benefits to at least some of their workers, similar to the percentage last year [Figure F]. The likelihood of offering health benefits differs significantly by firm size; only 48% of firms with 3 to 9 workers offer coverage, while virtually all firms with 1,000 or more workers offer coverage.
While the vast majority of firms are small, most workers work for large firms that offer coverage. In 2020, 89% of workers are employed by a firm that offers health benefits to at least some of its workers [Figure F].
Although the vast majority of workers are employed by firms that offer health benefits, many workers are not covered at their job. Some are not eligible to enroll (e.g., waiting periods or part-time or temporary work status) and others who are eligible choose not to enroll (e.g., they feel the coverage is too expensive or they are covered through another source). In firms that offer coverage, 82% of workers are eligible for the health benefits offered, and of those eligible, 78% take up the firm’s offer, resulting in 64% of workers in offering firms enrolling in coverage through their employer. All of these percentages are similar to 2019.
Looking at workers in both firms that offer and firms that do not offer health benefits, 57% of workers are covered by health plans offered by their employer, similar to the percentage last year.
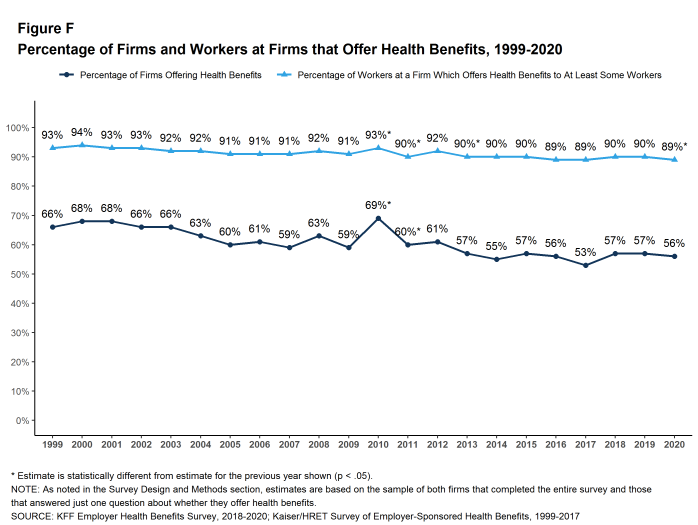
Figure F: Percentage of Firms and Workers at Firms That Offer Health Benefits, 1999-2020
HEALTH AND WELLNESS PROGRAMS
Most large firms and many small firms have programs that help workers identify health issues and manage chronic conditions, including health risk assessments, biometric screenings, and health promotion programs.
Health Risk Assessments. Among firms offering health benefits, 42% of small firms and 60% of large firms provide workers the opportunity to complete a health risk assessment [Figure G]. A health risk assessment includes questions about a person’s medical history, health status, and lifestyle. Fifty-two percent of large firms with a health risk assessment program offer an incentive to encourage workers to complete the assessment. Incentives may include: gift cards, merchandise or similar rewards; lower premium contributions or cost sharing; and financial rewards, such as cash, contributions to health-related savings accounts, or avoiding a payroll fee.
Biometric Screenings. Among firms offering health benefits, 33% of small firms and 50% of large firms provide workers the opportunity to complete a biometric screening. A biometric screening is an in-person health examination that measures a person’s risk factors, such as body mass index (BMI), cholesterol, blood pressure, stress, and nutrition. Sixty-five percent of large firms with biometric screening programs offer workers an incentive to complete the screening.
Additionally, among large firms with biometric screening programs, 18% reward or penalize workers based on achieving specified biometric outcomes (such as meeting a target BMI). The size of these incentives varies considerably: among large firms offering a reward or penalty for meeting biometric outcomes, the maximum reward is valued at $150 or less in 12% of firms and more than $1,000 in 32% of firms.
Effectiveness of Incentives. This year we asked large firms with an incentive to participate in a health promotion or health screening program, how effective they believed these incentives were at increasing employee participation. 30% believed incentives were ‘very effective’ and 47% believed they were ‘moderately effective’.
Health and Wellness Promotion Programs. Most firms offering health benefits offer programs to help workers identify and address health risks and unhealthy behaviors. Fifty-three percent of small firms and 81% of large firms offer a program in at least one of these areas: smoking cessation, weight management, and behavioral or lifestyle coaching. Among large firms offering at least one of these programs, 44% offer workers an incentive to participate in or complete the program [Figure G].
As health screenings and wellness programs have become more complex, incentives have become more sophisticated and may involve participating in or meeting goals in different programs. We asked firms that had incentives for any of these programs to estimate the maximum incentive for a worker across all of their screening and promotion programs combined. Among large firms with any type of incentive, 20% have a maximum incentive of $150 or less, while 20% have a maximum incentive of more than $1,000.
Effectiveness of Programs. Firms may have a variety of objectives for offering health screening and health promotion programs, including improving the health and wellbeing of enrollees, reducing absences from work, and reducing costs. Firms generally responded that their programs were effective to some degree in meeting certain specified objectives, although there were many who responded that they did not know [Figure H].
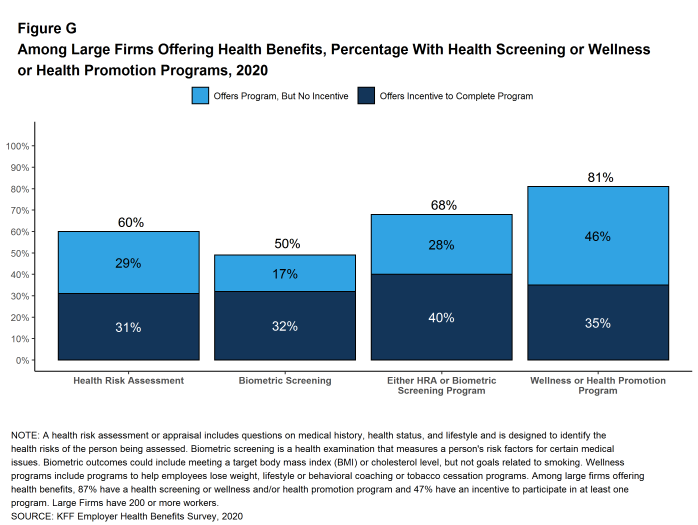
Figure G: Among Large Firms Offering Health Benefits, Percentage With Health Screening or Wellness or Health Promotion Programs, 2020
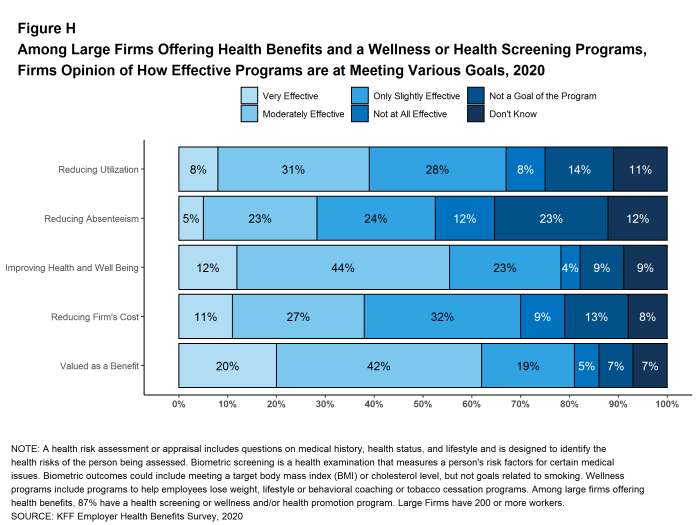
Figure H: Among Large Firms Offering Health Benefits and a Wellness or Health Screening Programs, Firms Opinion of How Effective Programs Are at Meeting Various Goals, 2020
SITES OF CARE
Telemedicine. Telemedicine is the delivery of health care services through telecommunications to a patient from a provider who is at a remote location, including video chat and remote monitoring. In 2020, 85% of firms with 50 or more workers offering health benefits cover the provision of health care services through telemedicine in their largest health plan, higher than the percentage last year. Offering firms with 5,000 or more workers are more likely to cover services provided through telemedicine than smaller firms.
Over the past year, there was a significant increase in the percentage of firms, particularly smaller firms (50-199 workers), reporting that they cover some services through telemedicine. While telemedicine has grown in recent years, it is possible that some of the growth this year reflects changes in response to the coronavirus pandemic as well as to an increased awareness. It will be important to watch if this heightened focus on access to care through telemedicine continues or abates as concerns about the coronavirus recede.
Retail Health Clinics. Seventy-six percent of large firms offering health benefits cover health care services received in retail clinics, such as those located in pharmacies, supermarkets and retail stores, in their largest health plan. These clinics are often staffed by nurse practitioners or physician assistants and treat minor illnesses and provide preventive services.
PROVIDER NETWORKS
Firms and health plans can structure their networks of providers and their cost sharing to encourage enrollees to use providers who charge lower costs and/or who provide better care. This involves assuring that there are a sufficient number of providers to assure reasonable access while also limiting the network to those that deliver good quality and cost-effective care.
Satisfaction with Network Choices. Among employers offering health benefits, 45% of firms report being ‘very satisfied’ and 38% report being ‘satisfied’ by the choice of provider networks available to them [Figure I]. They are somewhat less satisfied with the cost of the provider networks available to them. Only 22% of these firms report being ‘very satisfied’ while 39% report being ‘satisfied’ with the cost of provider networks available. Small firms are more likely than large firms to be ‘very dissatisfied’ with the cost of the provider networks available.
Breadth of Provider Networks. Employers offering health benefits were asked to characterize the breadth of the provider network in their plan with the largest enrollment. Fifty-one percent of firms say that the network in the plan with the largest enrollment is ‘very broad’, 42% say it is ‘somewhat broad’, and 6% say it is ‘somewhat narrow’.
Seven percent of firms offering health benefits report that they offer at least one plan that they considered to be a narrow network plan, similar to the percentage last year. Firms with 5,000 or more workers were more likely to offer a narrow network plan than smaller firms.
Breadth of Provider Networks for Mental Health. Employers offering health benefits were also asked to characterize the breadth of the network for mental health and substance abuse providers in their plan with the largest enrollment. Thirty-five percent of firms say that the network for mental health and substance abuse in the plan with the largest enrollment is ‘very broad’, 46% say it is ‘somewhat broad’, 15% say it is ‘somewhat narrow’, and 4% say it is ‘very narrow’.
Only about one-in-five (22%) employers offering health benefits report being very satisfied with the availability of mental health providers in their provider networks. Among employers offering health benefits, 15% of employers with 1,000 to 4,999 employees and 23% of employers with 5,000 or more employees asked their insurer or third party administrator to increase access to in-network mental health and substance abuse providers.
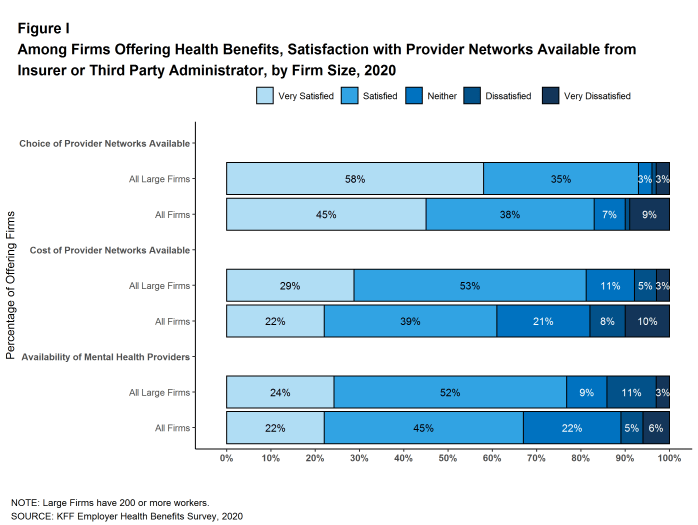
Figure I: Among Firms Offering Health Benefits, Satisfaction With Provider Networks Available From Insurer or Third Party Administrator, by Firm Size, 2020
COST SHARING FOR PEOPLE WITH CHRONIC CONDITIONS
Among employers with 200 or more employees offering health benefits, 21% say that their health plan with the largest enrollment waives cost-sharing for some medications or supplies to encourage employees with chronic illnesses to follow their treatment. This likelihood increases with firm size.
Recent changes in federal rules expanded the number and types of items and services that may be considered preventive by HSA-qualified health plans, allowing plan sponsors to pay for part or all of these services before enrollees meet the plan deductibles. Among employers with 200 or more employees offering an HSA-qualified health plan, 29% say that they changed the services or products that individuals with chronic conditions could receive without first meeting their deductibles. Firms with 5,000 or more employees (48%) are more likely to say they changed the services or products available before the deductible is met.
DISCUSSION
Looking at the metrics we usually consider, such as premiums, contributions, cost sharing, offer and coverage rates, we would conclude that the marketplace for employer-based health coverage had another stable year in 2020. Premium increases were modest and consistent with recent years, contributions and cost sharing largely did not change, nor did the shares of workers offered coverage or covered at their jobs. There is a meaningful increase in the share of workers in self-funded plans, which will be important to understand if the higher level persists. We will include additional questions in the 2021 survey to explore why employers are taking this option.
Of course the economic and social changes caused by the coronavirus pandemic have dramatically changed the employment landscape across the nation. Unprecedented job loss combined with shelter-at-home requirements and continuing delays in reopening of workplaces and schools are challenging employers and workers in many ways, including health benefits. There are questions, for example, about the continued availability of coverage for furloughed workers, the share of laid-off workers who are electing COBRA continuation coverage, and changes being made to employee assistance programs and health benefit plans to support workers with the emotional, social and financial stresses. As noted above, however, because the survey was fielded as the pandemic unfolded, we are not yet in a position to address how employers responded to the pandemic. Most of the metrics discussed above are fixed at the beginning of the plan year and may not reflect current circumstances. Some other responses may have been affected by the unfolding of the pandemic.
While we observed a relatively modest change in premiums in 2020, this does not capture the pandemic’s turbulent impacts on health care costs this year. During the spring, employers and plans saw lower health care utilization and correspondingly lower spending. With enrollees skipping some care, insurers reported lower than predicted cost through the first half of the year. As stay-at-home orders have lifted, health care utilization has again started picking up. Spending in 2021 remains uncertain as employers and insurers continue to adapt to an evolving situation. We do not know how the reduced use of care earlier this year will affect future costs and premiums: in some cases the need for care will have passed but in others the care will just have been deferred. Missed preventive and diagnostic care may also lead to worsening health and higher costs in the future. Beyond any potential pent-up demand, employer-based plans may face higher costs due to new COVID-19 tests, treatments and vaccines. Conversely, we have witnessed a dramatic economic slowdown which may lead to reduced utilization, offsetting some cost on plans.
For a year that started with historically low levels of unemployment, 2020 saw a stark increase in the unemployment rate. A less competitive job market and the economic slowdown may reduce pressure on employers to offer competitive benefit packages in the coming year. We largely reported similar average cost-sharing amounts to 2019 but some employers may be considering reducing plan generosity depending on how the economic crisis unfolds.
The challenge for the 2021 survey will be to understand how employers are responding to the pandemic and accompanying economic fallout while still maintaining the core questions and purpose of the survey. We do not know how long the pandemic will last nor what the longer term economic consequences will be, but we can ask employers about how this uncertainty affected their benefit plan decisions, what types of benefits they added and/or changed, whether they saw changes in how employees used their benefits, and whether they expect any changes to be more permanent. We also expect to ask how the disruption and uncertainty caused by the pandemic affected employer decisions about changing their plans or shopping for new vendors. The pandemic has already affected many employer benefits, and will continue to shape their decision-making as they anticipate new workplace accommodations, changes in premiums and the direct cost of the pandemic.
METHODOLOGY
The Kaiser Family Foundation 2020 Employer Health Benefits Survey reports findings from a telephone survey of 1,765 randomly selected non-federal public and private employers with three or more workers. Researchers at NORC at the University of Chicago and the Kaiser Family Foundation designed and analyzed the survey. Davis Research, LLC conducted the fieldwork between January and July 2020. In 2020, the overall response rate is 22%, which includes firms that offer and do not offer health benefits. Among firms participating in the past two years, the survey’s response rate is 51%. Unless otherwise noted, differences referred to in the text and figures use the 0.05 confidence level as the threshold for significance. Small firms have 3-199 workers. Values below 3% are not shown on graphical figures to improve the readability of those graphs. Some distributions may not sum due to rounding. For the first time since 1999, we contracted with a new data collection firm to conduct the survey. For more information on potential ‘house effects’ resulting from this change, as well as information on changes to our weighting methodology and measurements of workers’ wage and inflation see the Survey Design and Methods section.
For more information on the survey methodology, please visit the Survey Design and Methods section at http://ehbs.kff.org/.
Filling the need for trusted information on national health issues, the Kaiser Family Foundation is a nonprofit organization based in San Francisco, California.
- Kaiser Family Foundation. Health Insurance Coverage of the Total Population [Internet]. KFF (Kaiser Family Foundation). 2019 [cited 2020 Aug 10]. Available from: https://www.kff.org/other/state-indicator/total-population/ Coverage is based on calculations from the 2018 American Community Survey. During the winter and spring of 2020, there was a steep increase in the unemployment rate, potentially decreasing the number of people covered by employer coverage.↩︎
- Bureau of Labor Statistics. Consumer Price Index historical tables for, U.S. City Average of Annual Inflation [Internet]. Washington (DC): BLS; [cited 2020 Aug 10]. Available from: https://www.bls.gov/regions/mid-atlantic/data/consumerpriceindexhistorical1967base_us_table.htm AND Bureau of Labor Statistics. Current Employment Statistics—CES (National) [Internet]. Washington (DC): BLS; [cited 2020 Aug 10]. Available from: https://www.bls.gov/ces/publications/highlights/highlights-archive.htm↩︎
- This threshold is based on the twenty-fifth percentile of workers’ earnings ($26,000 in 2020). Bureau of Labor Statistics. May 2018 National Occupational Employment and Wage Estimates: United States. Washington (DC): BLS. Available from: http://www.bls.gov/oes/current/oes_nat.htm↩︎
Cost of Health Insurance
In 2020, the average annual premiums are $7,470 for single coverage and $21,342 for family coverage. The average premium for single coverage increased by 4% since 2019 and the average premium for family coverage increased by 4%. The average family premium has increased 55% since 2010 and 22% since 2015.
This graphing tool allows users to look at changes in premiums and worker contributions for covered workers at different types of firms over time: https://www.kff.org/interactive/premiums-and-worker-contributions/
PREMIUMS FOR SINGLE AND FAMILY COVERAGE
- The average premium for single coverage in 2020 is $7,470 per year. The average premium for family coverage is $21,342 per year [Figure 1.1].
- The average annual premium for single coverage for covered workers in small firms ($7,483) is similar to the average premium for covered workers in large firms ($7,466). The average annual premium for family coverage for covered workers in small firms ($20,438) is lower than the average premium for covered workers in large firms ($21,691). [Figure 1.2].
- The average annual premiums for covered workers in HDHP/SOs is lower for single coverage ($6,890) but similar for family coverage ($20,359) to the overall average premiums. The average premiums for covered workers enrolled in PPOs are higher for single ($7,880) and family coverage ($22,248) than the overall average premiums [Figure 1.1].
- The average premiums for covered workers with single coverage are relatively high in the Northeast and relatively low in the South. The average premiums for covered workers with family coverage are relatively high in the Northeast and relatively low in the South and West [Figure 1.3].
- The average premium for single coverage varies across industries. Compared to the average single premiums for covered workers in other industries, the average premiums for covered workers in the Manufacturing, Retail, and Agriculture/Mining/Construction categories are relatively low and the average premium for Health Care workers is relatively high [Figure 1.4].
- The average premium for family coverage for covered workers in firms with a relatively large share of lower-wage workers (where at least 35% of the workers earn $26,000 annually or less) is lower than the average premium for covered workers in firms with a smaller share of lower-wage workers ($19,332 vs. $21,486) [Figure 1.6].
- The average premium for single coverage for covered workers in firms with a relatively large share of older workers (where at least 35% of the workers are age 50 or older) is higher than the average premium for covered workers in firms with a smaller share of older workers ($7,665 vs. $7,288) [Figure 1.6].
- The average premium for family coverage for covered workers in firms with a relatively large share of younger workers (where at least 35% of the workers are age 26 or younger) is lower than the average premium for covered workers in firms with a smaller share of younger workers ($19,893 vs. $21,441) [Figure 1.6].
- Covered workers at private for-profit firms have lower average annual premiums than covered workers at public firms or private not-for-profit firms for single coverage [Figure 1.6].
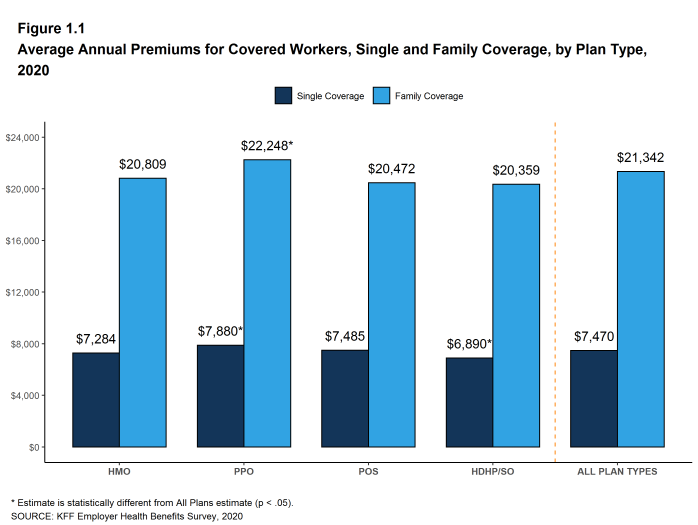
Figure 1.1: Average Annual Premiums for Covered Workers, Single and Family Coverage, by Plan Type, 2020
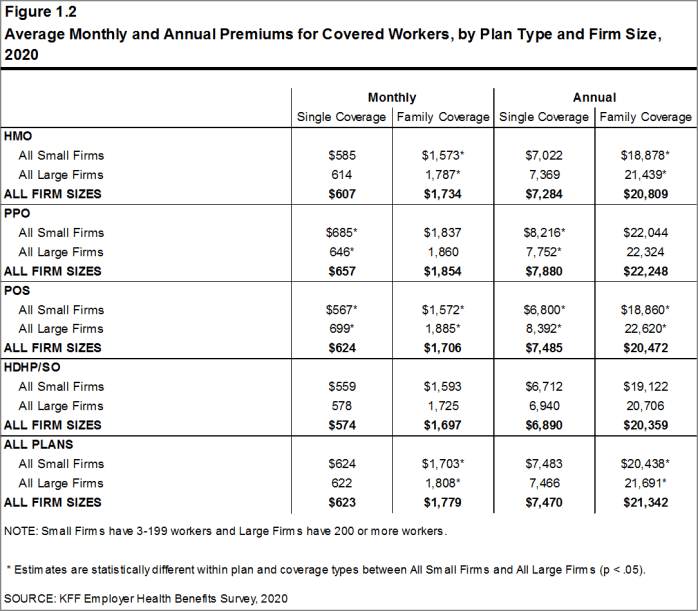
Figure 1.2: Average Monthly and Annual Premiums for Covered Workers, by Plan Type and Firm Size, 2020
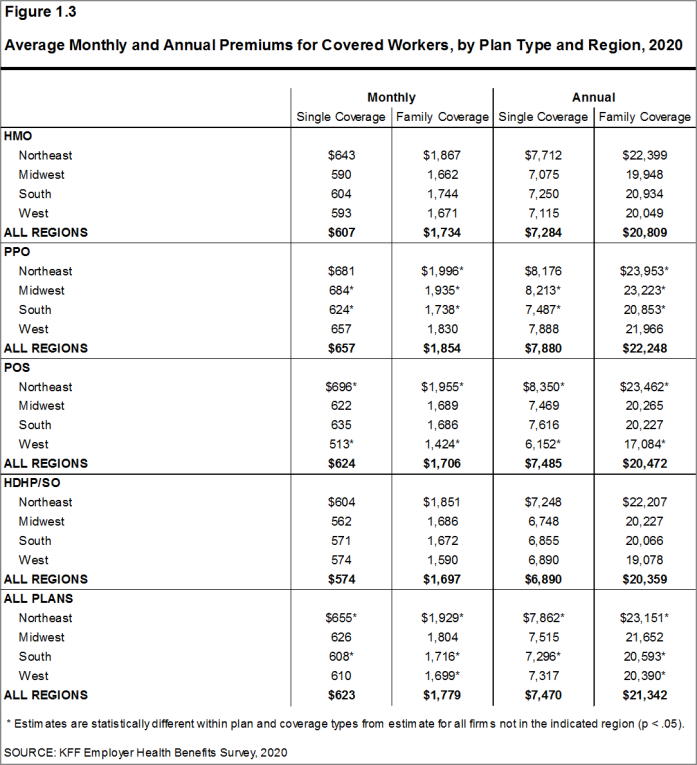
Figure 1.3: Average Monthly and Annual Premiums for Covered Workers, by Plan Type and Region, 2020
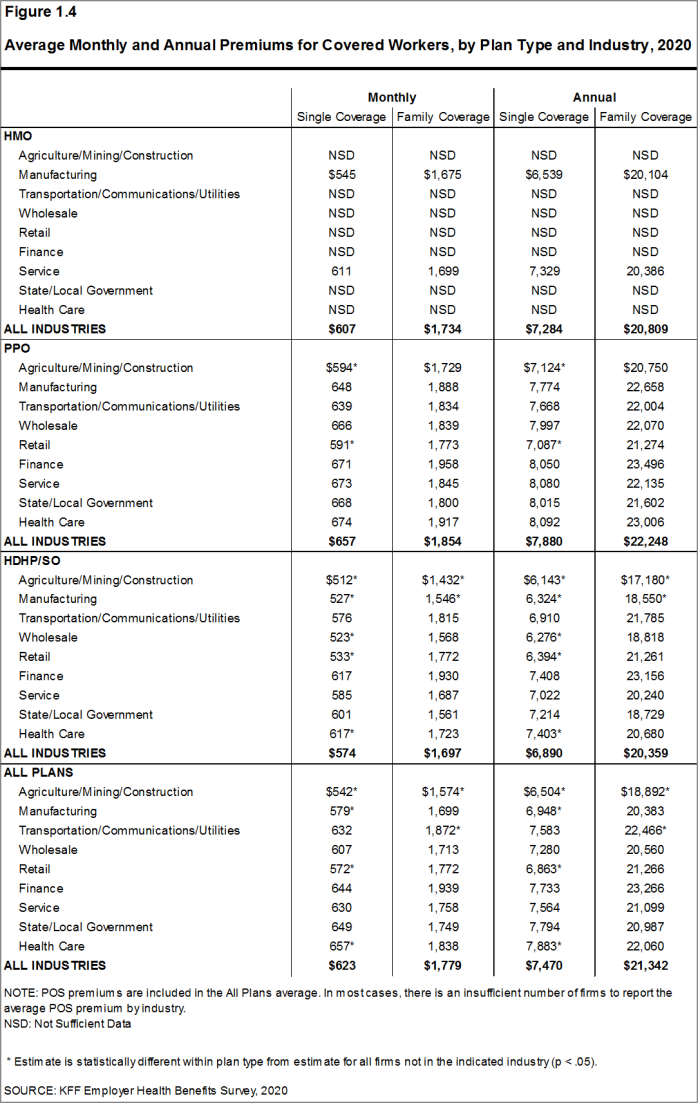
Figure 1.4: Average Monthly and Annual Premiums for Covered Workers, by Plan Type and Industry, 2020
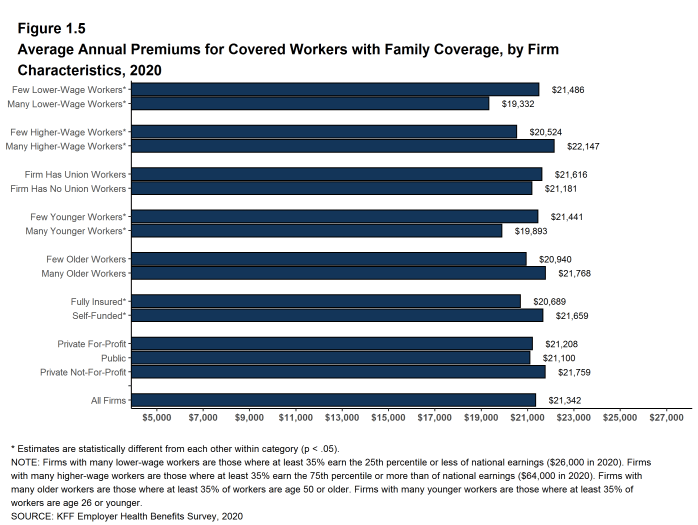
Figure 1.5: Average Annual Premiums for Covered Workers With Family Coverage, by Firm Characteristics, 2020
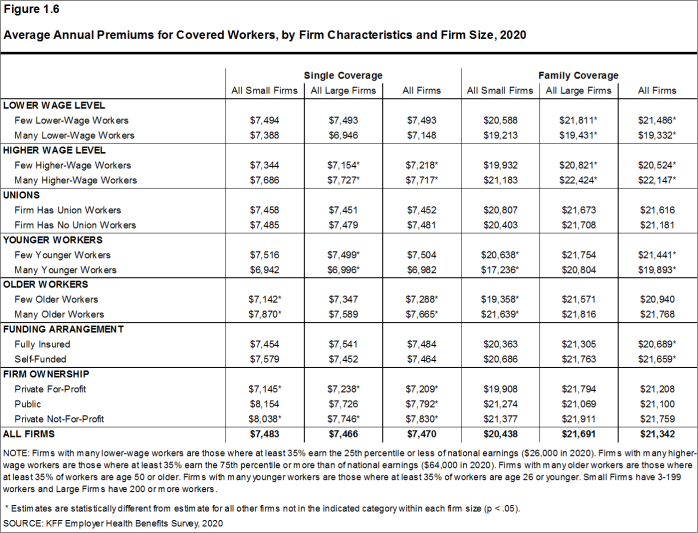
Figure 1.6: Average Annual Premiums for Covered Workers, by Firm Characteristics and Firm Size, 2020
PREMIUM DISTRIBUTION
- There remains considerable variation in premiums for both single and family coverage.
- Eighteen percent of covered workers are employed in a firm with a single premium at least 20% higher than the average single premium, while 17% of covered workers are in firms with a single premium less than 80% of the average single premium [Figure 1.7].
- For family coverage, 18% of covered workers are employed in a firm with a family premium at least 20% higher than the average family premium, while 20% of covered workers are in firms with a family premium less than 80% of the average family premium [Figure 1.7].
- Nine percent of covered workers are in a firm with an average annual premium of at least $10,000 for single coverage [Figure 1.8]. Ten percent of covered workers are in a firm with an average annual premium of at least $28,000 for family coverage [Figure 1.9].
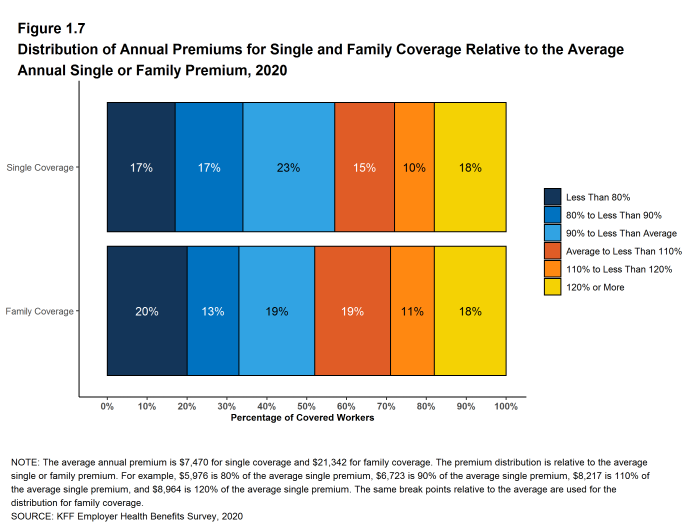
Figure 1.7: Distribution of Annual Premiums for Single and Family Coverage Relative to the Average Annual Single or Family Premium, 2020
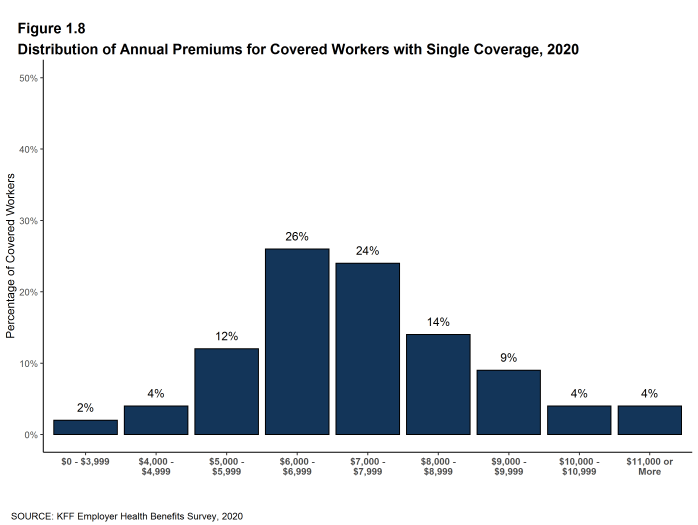
Figure 1.8: Distribution of Annual Premiums for Covered Workers With Single Coverage, 2020
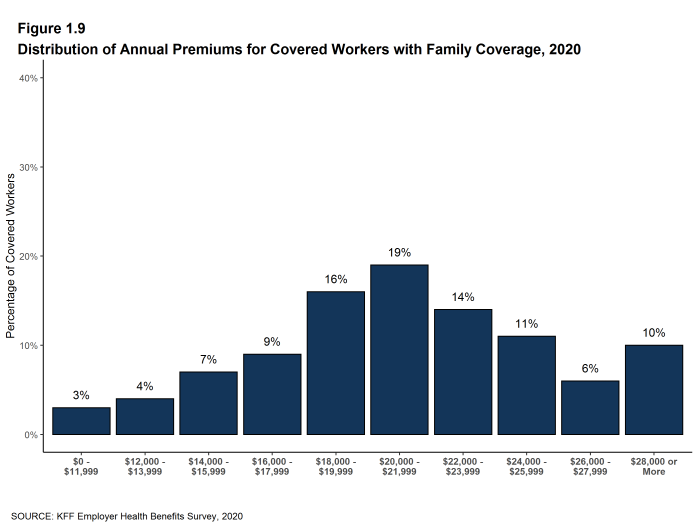
Figure 1.9: Distribution of Annual Premiums for Covered Workers With Family Coverage, 2020
PREMIUM CHANGES OVER TIME
- The average premium for single coverage is 4% higher than the single premium last year, and the average premium for family coverage is 4% higher than the average family premium last year [Figure 1.10].
- The average premium for single coverage has grown 20% since 2015, similar to the growth in the average premium for family coverage (22%) over the same period [Figure 1.10].
- The average family premiums for both small and large firms have increased at similar rates since 2015 (23% for small firms and 21% for large firms). For small firms, the average family premium rose from $16,625 in 2015 to $20,438 in 2020. For large firms, the average family premium rose from $17,938 in 2015 to $21,691 in 2020 [Figures 1.11 and 1.12].
- The $21,342 average family premium in 2020 is 22% higher than the average family premium in 2015 and 55% higher than the average family premium in 2010. The 22% family premium growth in the past five years is slower than the 27% growth between 2010 and 2015 [Figure 1.14].
- The average family premiums for both small and large firms have increased at similar rates since 2010 (54% for small firms and 55% for large firms). For small firms, the average family premium rose from $13,250 in 2010 to $20,438 in 2020. For large firms, the average family premium rose from $14,038 in 2010 to $21,691 in 2020 [Figures 1.11 and 1.12].
- For covered workers in large firms, over the past five years, the average family premium in firms that are fully insured has grown at a similar rate to the average family premium for covered workers in fully or partially self-funded firms (19% for fully insured plans and 21% for self-funded firms) [Figure 1.13].
- Over the last five years, the average premium for family coverage has risen 22% percent, more than inflation (10%).
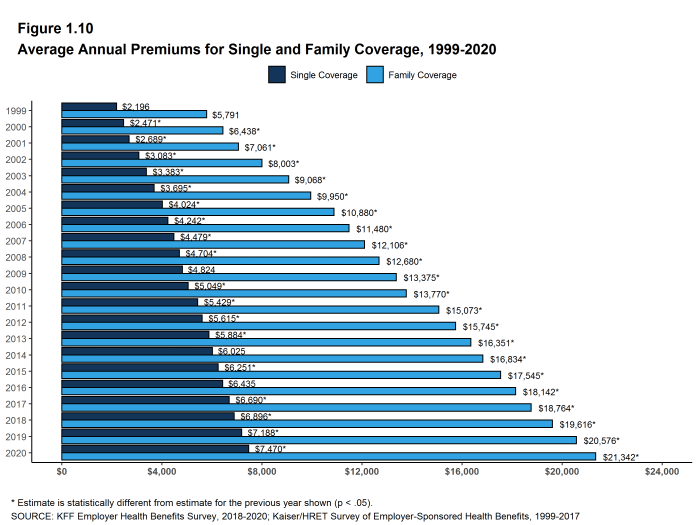
Figure 1.10: Average Annual Premiums for Single and Family Coverage, 1999-2020
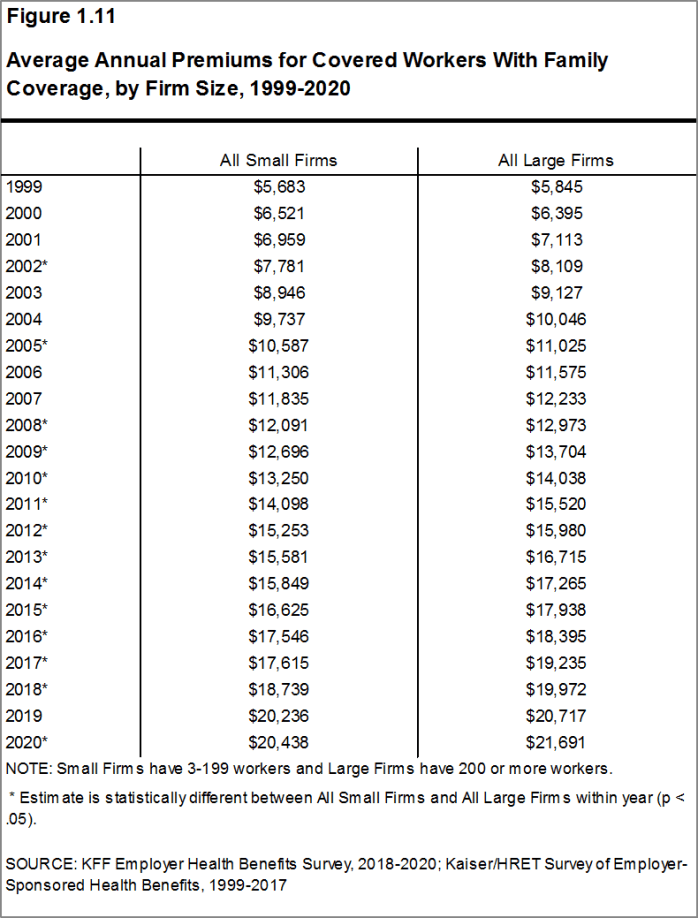
Figure 1.11: Average Annual Premiums for Covered Workers With Family Coverage, by Firm Size, 1999-2020
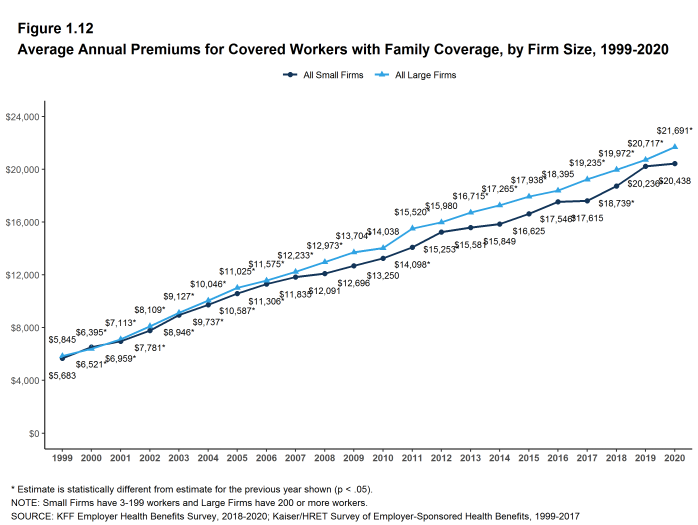
Figure 1.12: Average Annual Premiums for Covered Workers With Family Coverage, by Firm Size, 1999-2020
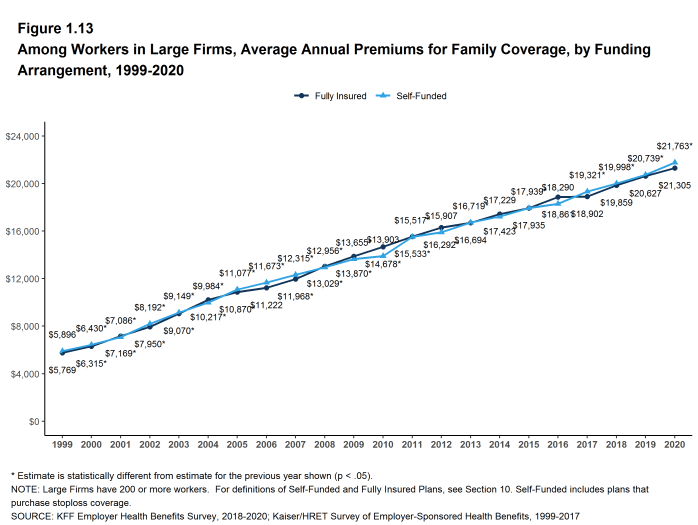
Figure 1.13: Among Workers in Large Firms, Average Annual Premiums for Family Coverage, by Funding Arrangement, 1999-2020
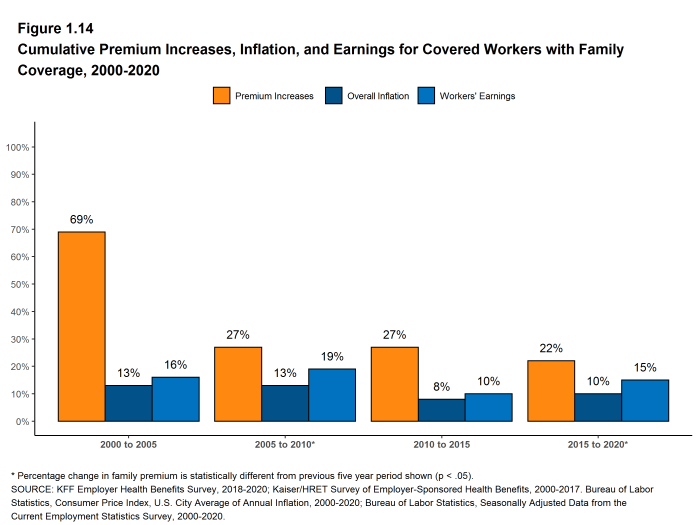
Figure 1.14: Cumulative Premium Increases, Inflation, and Earnings for Covered Workers With Family Coverage, 2000-2020
Health Benefits Offer Rates
While nearly all large firms (200 or more workers) offer health benefits to at least some workers, small firms (3-199 workers) are significantly less likely to do so. The percentage of all firms offering health benefits in 2020 (56%) is similar to the percentages of firms offering health benefits last year (57%) and five years ago (57%).
Firms not offering health benefits continue to cite cost as the most important reason they do not do so. Almost all firms that offer coverage offer benefits to dependents such as children and the spouses of eligible employees.
FIRM OFFER RATES
- In 2020, 56% of firms offer health benefits, similar to the percentage last year [Figure 2.1].
- The overall percentage of firms offering health benefits in 2020 is similar to the percentages offering health benefits in 2015 (57%). The percentage of offering firms in 2010 was an aberration so we are not making a 10-year comparison [Figure 2.1].
- Ninety-nine percent of large firms offer health benefits to at least some of their workers. In contrast, only 55% of small firms offer health benefits [Figure 2.2] and [Figure 2.3]. The percentages of both small and large firms offering health benefits to at least some of their workers in 2020 are similar to those last year [Figure 2.2].
- The smallest-sized firms are least likely to offer health insurance: 48% of firms with 3-9 workers offer coverage, compared to 59% of firms with 10-24 workers, 70% of firms with 25-49 workers, and 92% of firms with 50-199 workers [Figure 2.3]. Since most firms in the country are small, variation in the overall offer rate is driven largely by changes in the percentages of the smallest firms (3-9 workers) offering health benefits. For more information on the distribution of firms in the country, see the Survey Design and Methods Section and [Figure M.6].
- Only 53% of firms with 3-49 workers offer health benefits to at least some of their workers, compared to 94% of firms with 50 or more workers [Figure 2.4].
- Because most workers are employed by larger firms, most workers work at a firm that offers health benefits to at least some of its employees. Eighty-nine percent of all workers are employed by a firm that offers health benefits to at least some of its workers [Figure 2.6].
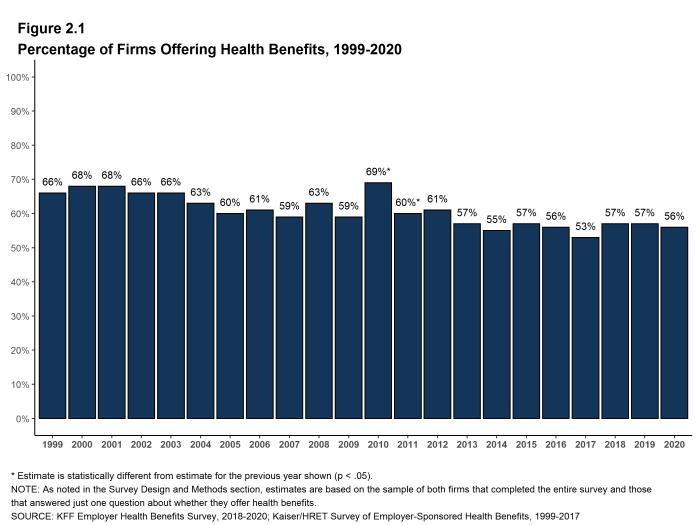
Figure 2.1: Percentage of Firms Offering Health Benefits, 1999-2020
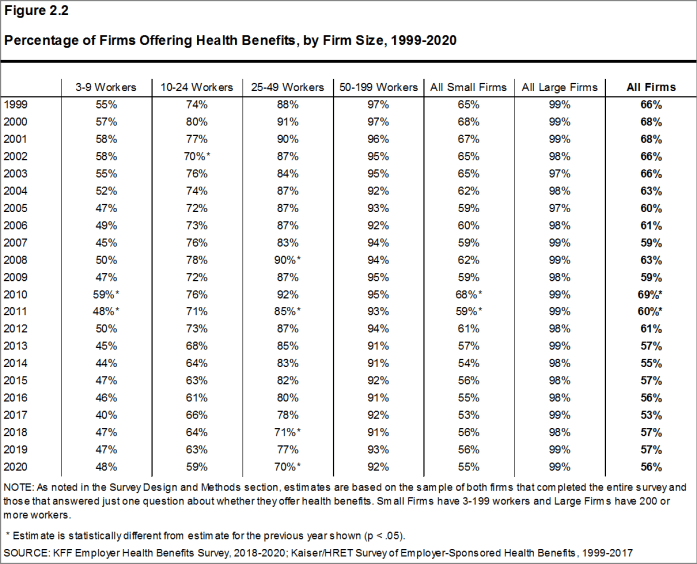
Figure 2.2: Percentage of Firms Offering Health Benefits, by Firm Size, 1999-2020
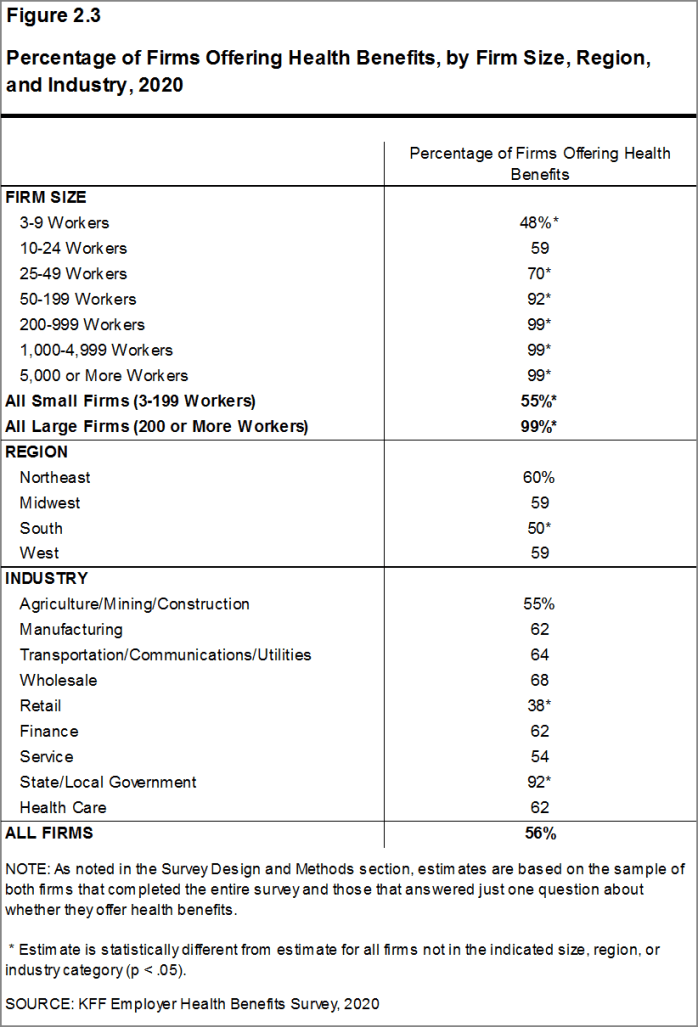
Figure 2.3: Percentage of Firms Offering Health Benefits, by Firm Size, Region, and Industry, 2020
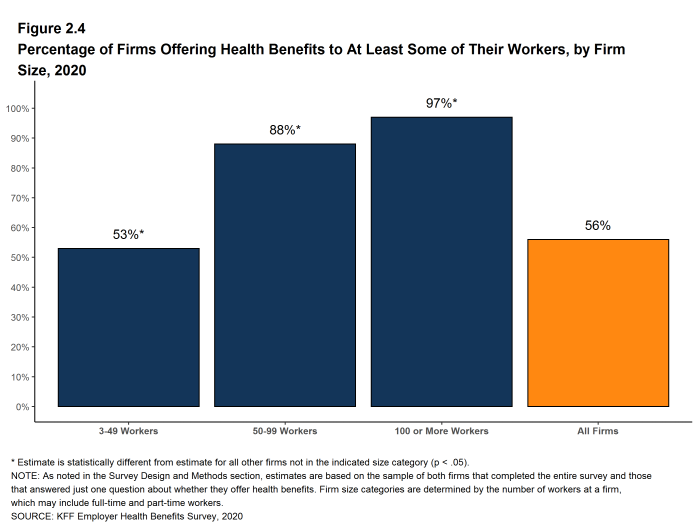
Figure 2.4: Percentage of Firms Offering Health Benefits to at Least Some of Their Workers, by Firm Size, 2020
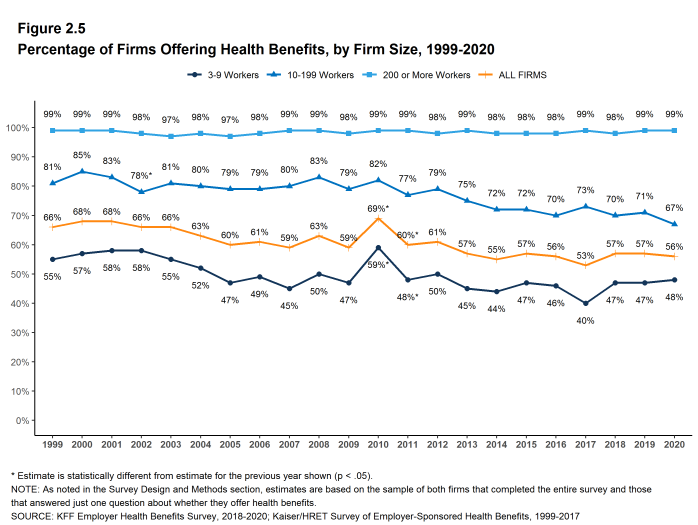
Figure 2.5: Percentage of Firms Offering Health Benefits, by Firm Size, 1999-2020
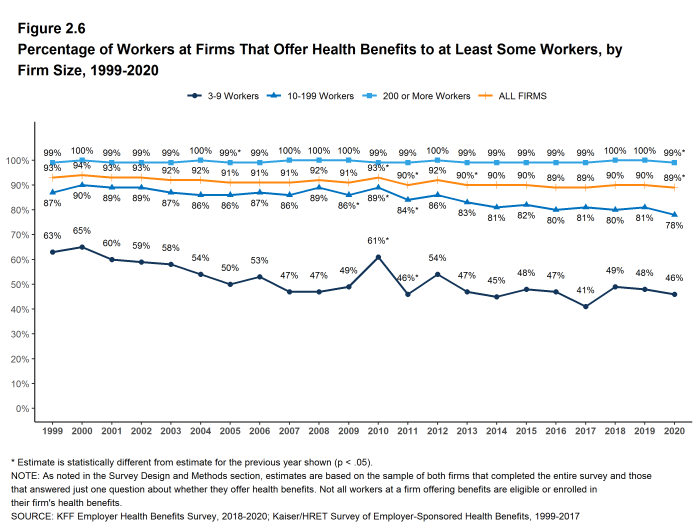
Figure 2.6: Percentage of Workers at Firms That Offer Health Benefits to at Least Some Workers, by Firm Size, 1999-2020
PART-TIME WORKERS
- Among firms offering health benefits, relatively few offer benefits to their part-time workers.
- The Affordable Care Act (ACA) defines full-time workers as those who on average work at least 30 hours per week, and part-time workers as those who on average work fewer than 30 hours per week. The employer shared responsibility provision of the ACA requires that firms with at least 50 full-time equivalent employees offer most full-time employees coverage that meets minimum standards or be assessed a penalty.13
Beginning in 2015, we modified the survey to explicitly ask employers whether they offered benefits to employees working fewer than 30 hours. Our previous question did not include a definition of “part-time”. For this reason, historical data on part-time offer rates are shown, but we did not test whether the differences between 2014 and 2015 were significant. Many employers may work with multiple definitions of part-time; one for their compliance with legal requirements and another for internal policies and programs.
- Thirty-four percent of large firms offer health benefits in 2020 offer health benefits to part-time workers, similar to the percentage in 2019. The share of large firms offering health benefits to part-time workers increases with firm size [Figure 2.7].
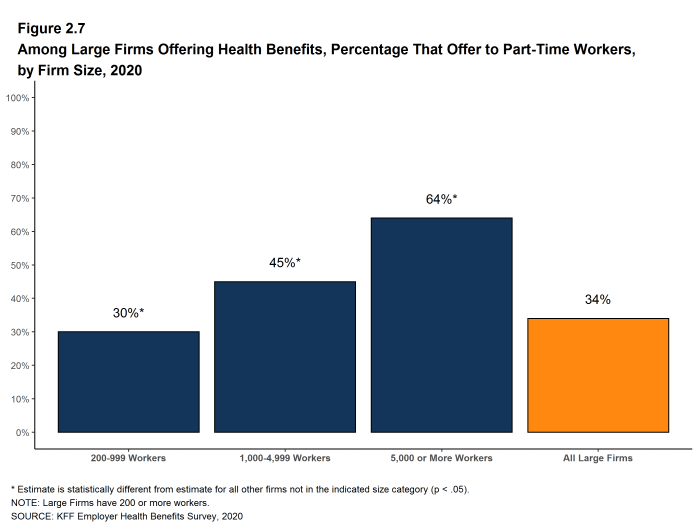
Figure 2.7: Among Large Firms Offering Health Benefits, Percentage That Offer to Part-Time Workers, by Firm Size, 2020
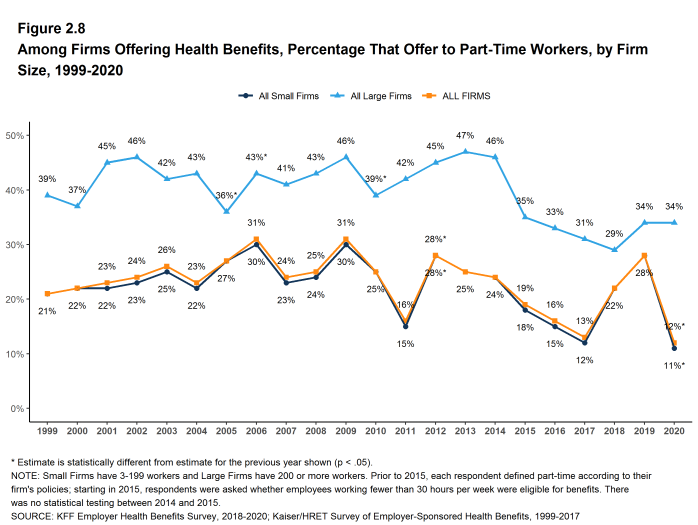
Figure 2.8: Among Firms Offering Health Benefits, Percentage That Offer to Part-Time Workers, by Firm Size, 1999-2020
SPOUSES AND DEPENDENTS
- The vast majority of firms offering health benefits offer to spouses and dependents, such as children.
- In 2020, 95% of firms offering health benefits offer coverage to spouses, similar to the percentage last year [Figure 2.9].
- Ninety-six percent of firms offering health benefits cover dependents other than spouses, such as children, similar to the percentages last year [Figure 2.9].
- Four percent of small firms offering health benefits offer only single coverage to their workers, similar to the percentage last year [Figure 2.9].
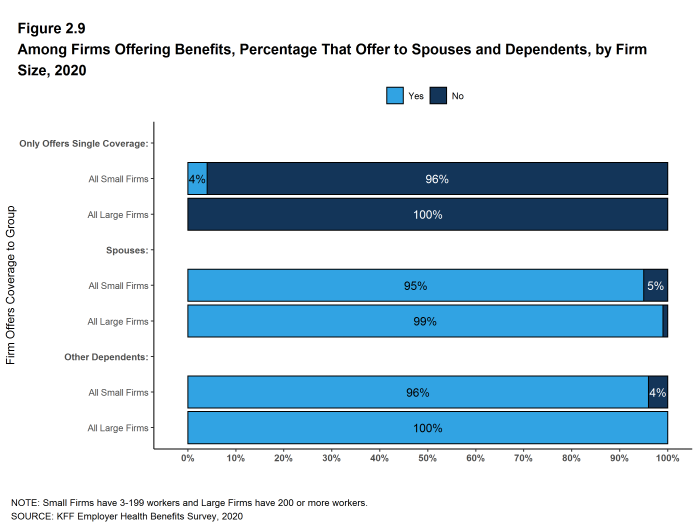
Figure 2.9: Among Firms Offering Benefits, Percentage That Offer to Spouses and Dependents, by Firm Size, 2020
SPOUSAL SURCHARGES
Some employers place conditions on the ability of dependent spouses to enroll in a health plan if the spouse is offered health insurance from another source, such as his or her own place of work.
- Among firms offering health benefits to spouses, 86% say that an employee’s spouse is able to enroll in the employee’s health plan even if the spouse is offered coverage from another source, 4% say the spouse can enroll subject to some conditions (for example, the type of coverage offered), and 10% say that the spouse is not eligible to enroll [Figure 2.10].
- Among large firms that say that spouses are eligible to enroll in an employee’s health plan even if the spouse has access to coverage from another source, 13% require the spouse to pay more to enroll than other spouses, such as a higher premium contribution or cost sharing [Figure 2.12].
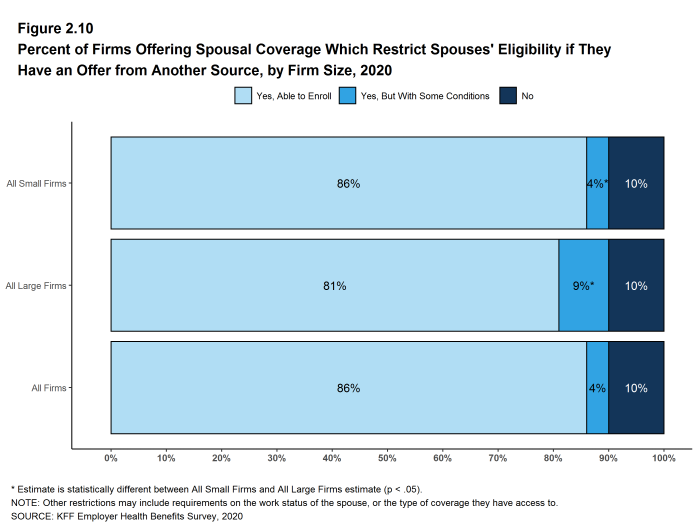
Figure 2.10: Percent of Firms Offering Spousal Coverage Which Restrict Spouses’ Eligibility If They Have an Offer From Another Source, by Firm Size, 2020
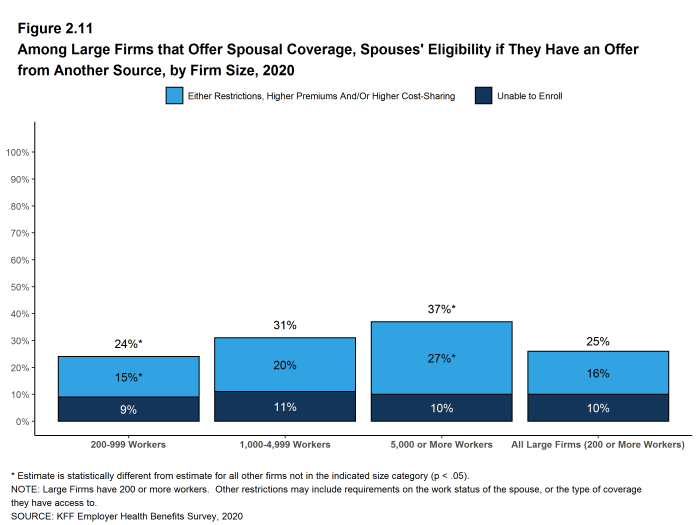
Figure 2.11: Among Large Firms That Offer Spousal Coverage, Spouses’ Eligibility If They Have an Offer From Another Source, by Firm Size, 2020
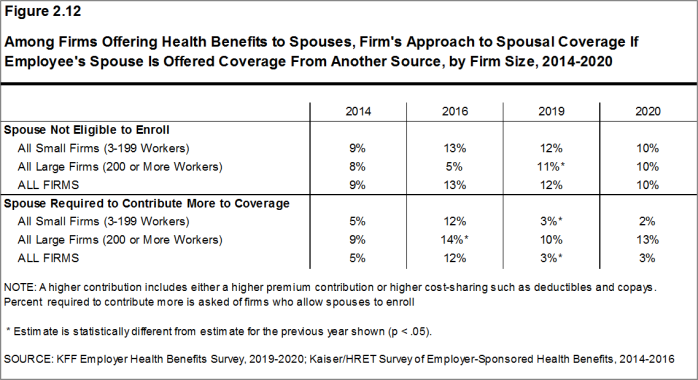
Figure 2.12: Among Firms Offering Health Benefits to Spouses, Firm’s Approach to Spousal Coverage If Employee’s Spouse Is Offered Coverage From Another Source, by Firm Size, 2014-2020
FIRMS NOT OFFERING HEALTH BENEFITS
- The survey asks firms that do not offer health benefits several questions, including whether they have offered insurance or shopped for insurance in the recent past, their most important reasons for not offering coverage, and their opinion on whether their employees would prefer an increase in wages or health insurance if additional funds were available to increase their compensation. Because such a small percentage of large firms report not offering health benefits, we present responses for small non-offering firms only.
- The cost of health insurance remains the primary reason cited by firms for not offering health benefits. Among small firms not offering health benefits, 37% cite high cost as “the most important reason” for not doing so. Other factors include “the firm is too small” (20%), employees are covered by another health plan (including a spouse’s plan) (17%) and “most employees are part-time or temporary workers” (11%). Few small firms indicate that they do not offer because they believe employees will get a better deal on the health insurance exchanges (4%) [Figure 2.13].
- Some small non-offering firms have either offered health insurance in the past five years or shopped for health insurance in the past year.
- Seven percent of small non-offering firms have offered health benefits in the past five years, lower than the percentage reported last year or in recent years [Figure 2.14]. We will monitor this percentage to determine if this is a single-year change or a new and different level.
- Seventeen percent of small non-offering firms have shopped for coverage in the past year, similar to the percentage last year (14%) [Figure 2.14].
- Among small non-offering firms that report they stopped offering coverage within the past five years, 30% stopped offering coverage within the past year.
- Eight percent of small firms not offering health benefits report that they provide funds for employees to purchase insurance on their own in the individual market or through a health insurance exchange, similar to the percentage in 2019 [Figure 2.15].
- Sixty-nine percent of small firms not offering health benefits believed that their employees would prefer a two dollar per hour increase in wages rather than health insurance. [Figure 2.16].
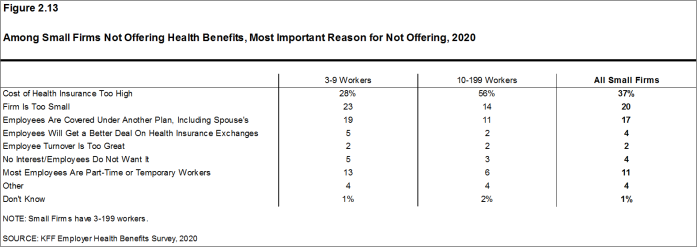
Figure 2.13: Among Small Firms Not Offering Health Benefits, Most Important Reason for Not Offering, 2020
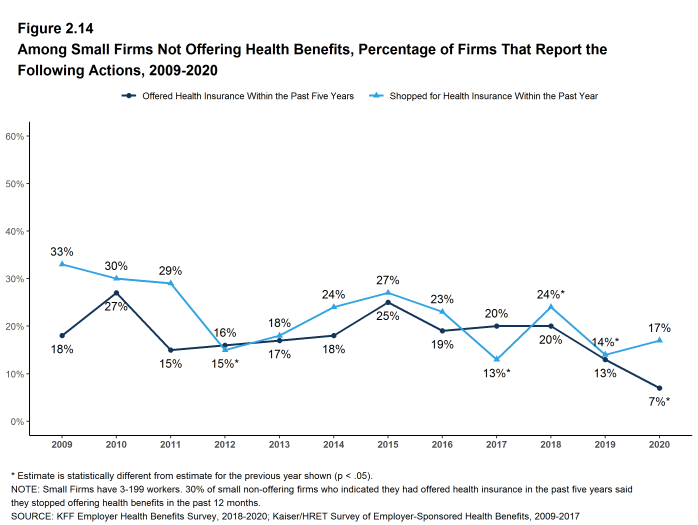
Figure 2.14: Among Small Firms Not Offering Health Benefits, Percentage of Firms That Report the Following Actions, 2009-2020
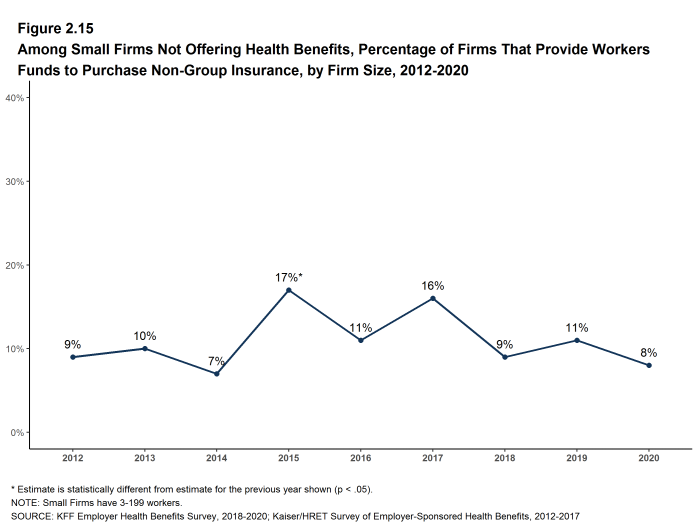
Figure 2.15: Among Small Firms Not Offering Health Benefits, Percentage of Firms That Provide Workers Funds to Purchase Non-Group Insurance, by Firm Size, 2012-2020
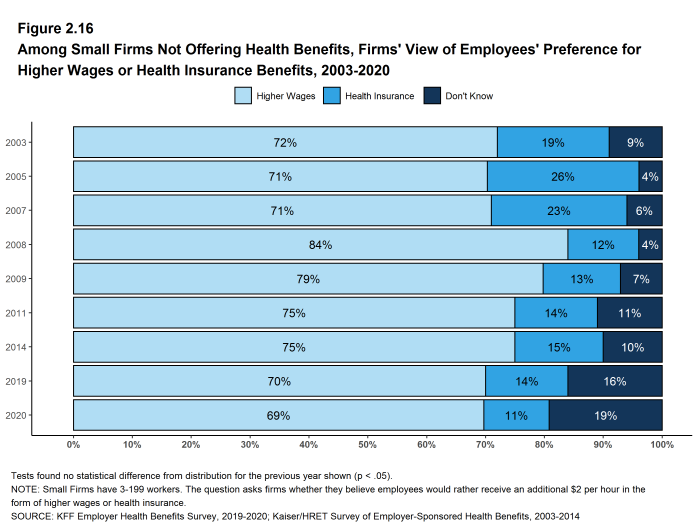
Figure 2.16: Among Small Firms Not Offering Health Benefits, Firms’ View of Employees’ Preference for Higher Wages or Health Insurance Benefits, 2003-2020
- Internal Revenue Code. 26 U.S. Code § 4980H – Shared responsibility for employers regarding health coverage. 2011. https://www.gpo.gov/fdsys/pkg/USCODE-2011-title26/pdf/USCODE-2011-title26-subtitleD-chap43-sec4980H.pdf↩︎
Employee Coverage, Eligibility, and Participation
Employers are the principal source of health insurance in the United States, providing health benefits for about 157 million people.14 Most workers are offered health coverage at work, and most of the workers who are offered coverage take it. Workers may not be covered by their own employer for several reasons: their employer may not offer coverage, they may not be eligible for the benefits offered by their firm, they may elect to receive coverage through their spouse’s employer, or they may refuse coverage from their firm. In 2020, 64% of workers in firms offering health benefits are covered by their own firm, similar to the percentages last year, five years ago and ten years ago.
Before eligible workers may enroll in benefits at their firm, 68% of covered workers face a waiting period.
ELIGIBILITY
- Even in firms that offer health benefits, some workers may not be eligible to participate.15 Many firms, for example, do not offer coverage to part-time or temporary workers. Among workers in firms offering health benefits in 2020, 82% are eligible to enroll in the benefits offered by their firm, similar to the percentages last year, five years ago, and 10 years ago, for both small and large firms [Figure 3.1].
- The percentage of workers eligible to enroll in health benefits at their firm is relatively higher in firms with 3-24 workers (86%) [Figure 3.3].
- Eligibility varies considerably by firm wage level. Workers in firms with a relatively large share of lower-wage workers (where at least 35% of workers earn $26,000 a year or less) have a lower average eligibility rate than workers in firms with a smaller share of lower-wage workers (72% vs. 82%) [Figure 3.6].
- Workers in firms with a relatively large share of higher-wage workers (where at least 35% earn $64,000 or more annually) have a higher average eligibility rate than workers in firms with a smaller share of higher-wage workers (88% vs. 77%) [Figure 3.6].
- Eligibility also varies by the age of the workforce. Those in firms with a relatively small share of younger workers (where fewer than 35% of the workers are age 26 or younger) have a higher average eligibility rate than those in firms with a larger share of younger workers (84% vs. 62%) [Figure 3.6].
- Eligibility rates vary considerably for workers in different industries. The average eligibility rate remains particularly low for workers in retail firms (54%) [Figure 3.3].
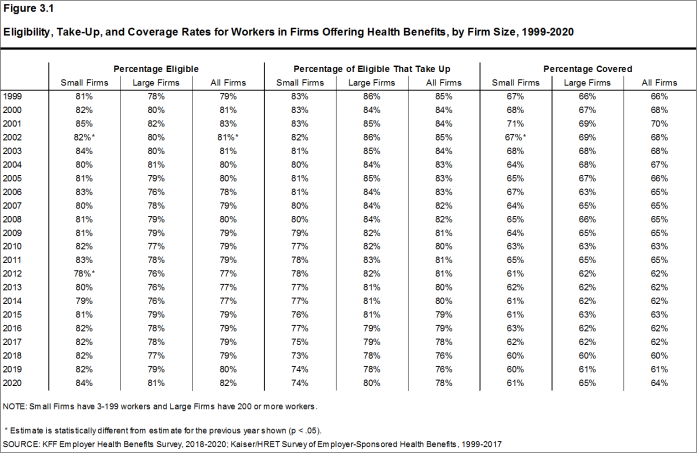
Figure 3.1: Eligibility, Take-Up, and Coverage Rates for Workers in Firms Offering Health Benefits, by Firm Size, 1999-2020
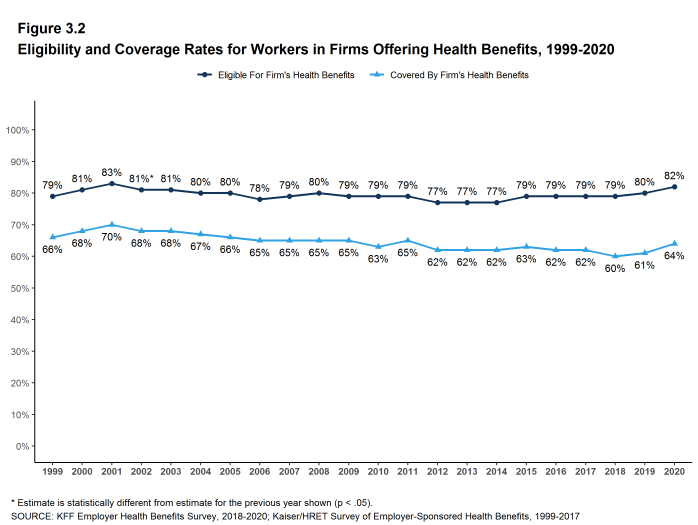
Figure 3.2: Eligibility and Coverage Rates for Workers in Firms Offering Health Benefits, 1999-2020
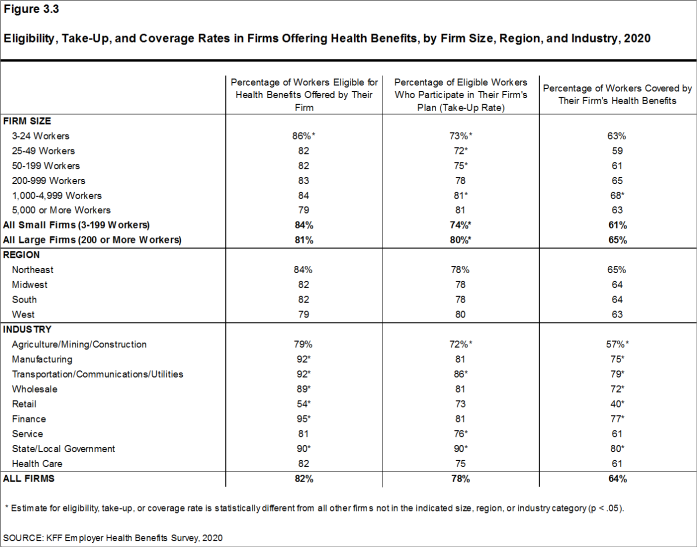
Figure 3.3: Eligibility, Take-Up, and Coverage Rates in Firms Offering Health Benefits, by Firm Size, Region, and Industry, 2020
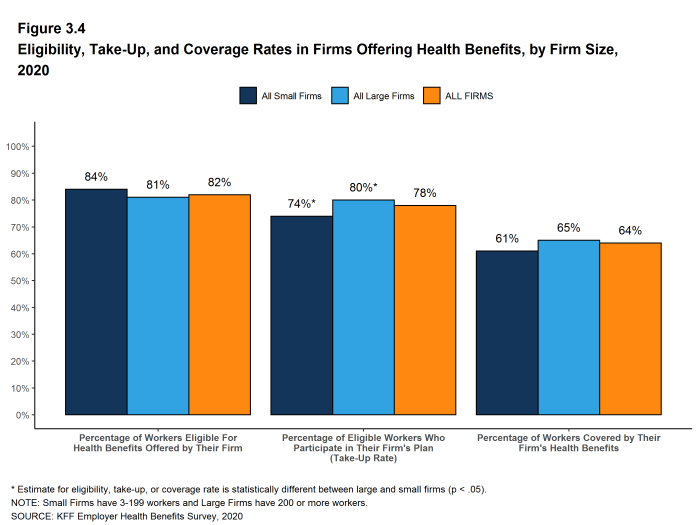
Figure 3.4: Eligibility, Take-Up, and Coverage Rates in Firms Offering Health Benefits, by Firm Size, 2020
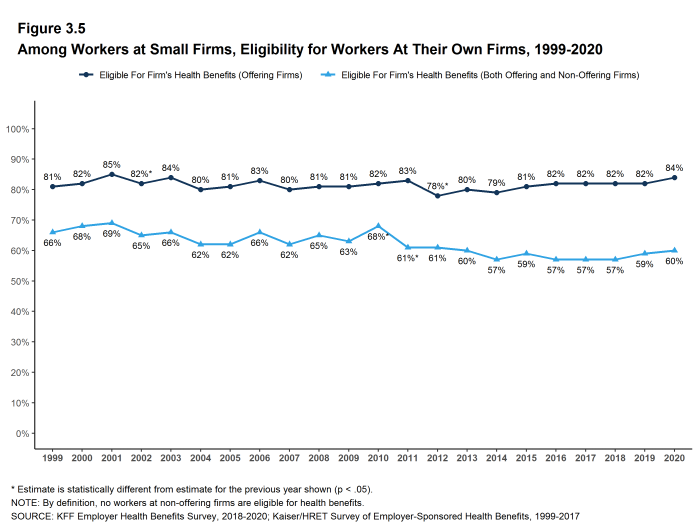
Figure 3.5: Among Workers at Small Firms, Eligibility for Workers at Their Own Firms, 1999-2020
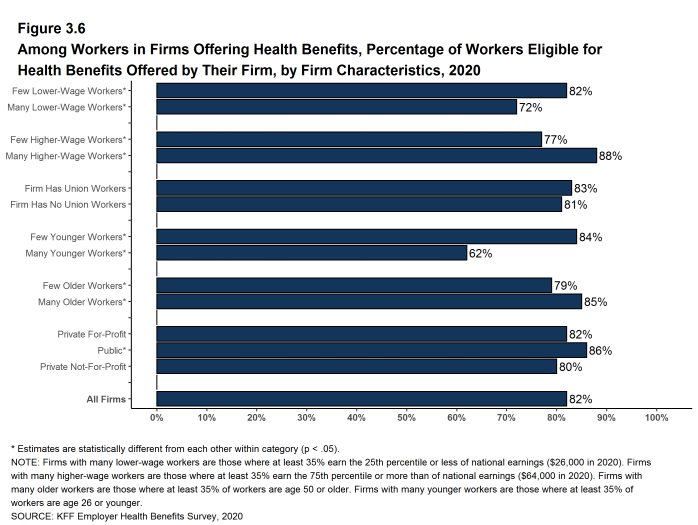
Figure 3.6: Among Workers in Firms Offering Health Benefits, Percentage of Workers Eligible for Health Benefits Offered by Their Firm, by Firm Characteristics, 2020
TAKE-UP RATE
- Seventy-eight percent of eligible workers take up coverage when it is offered to them, similar to the percentage last year. The share of eligible workers taking up coverage in large firms is higher than the share in small firms [Figure 3.1].16
- The likelihood of a worker accepting a firm’s offer of coverage varies by firm wage level. Eligible workers in firms with a relatively large share of lower-wage workers have a lower average take up rate than eligible workers in firms with a smaller share of lower-wage workers (65% vs. 79%) [Figure 3.7].
- Eligible workers in firms with a relatively large share of higher-wage workers have a higher average take up rate than those in firms with a smaller share of higher-wage workers (82% vs. 75%) [Figure 3.7].
- The likelihood of a worker accepting a firm’s offer of coverage also varies with the age distribution of the workforce. Eligible workers in firms with a relatively large share of younger workers have a lower average take up rate than those in firms with a smaller share of younger workers (65% vs. 79%) [Figure 3.7].
- Eligible workers in private, for-profit firms have a lower average take up rate (76%) and eligible workers in public firms have a higher average take up rate (89%) than workers in other firm types [Figure 3.7].
- Eligible workers in firms with some union workers have a higher average takeup rate than those in firms with no union workers (82% vs. 76%) [Figure 3.7].
- The average percentages of eligible workers taking up benefits in offering firms also varies across industries [Figure 3.3].
- The share of eligible workers taking up benefits in offering firms (78%) is similar to the shares in 2015 (79%) and in 2010 (80%) [Figure 3.1].
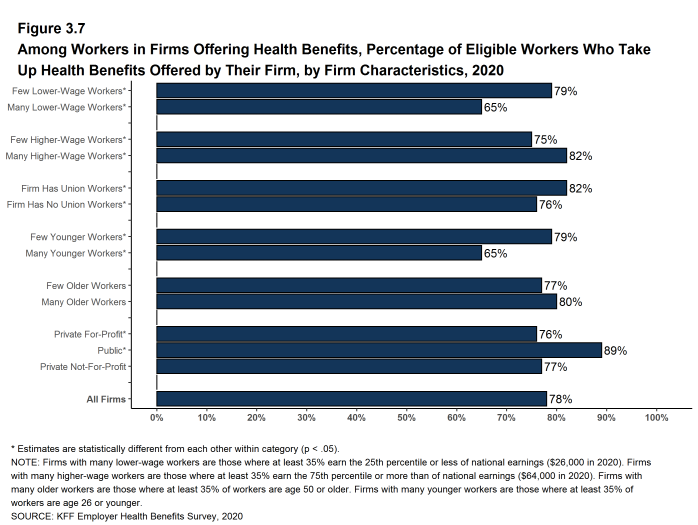
Figure 3.7: Among Workers in Firms Offering Health Benefits, Percentage of Eligible Workers Who Take Up Health Benefits Offered by Their Firm, by Firm Characteristics, 2020
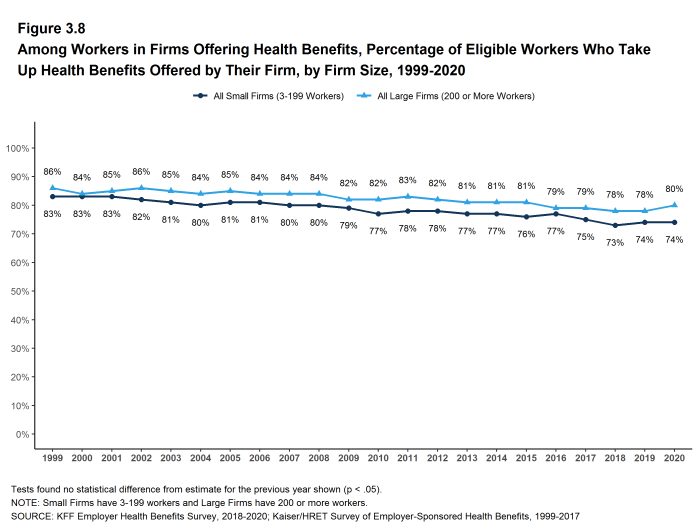
Figure 3.8: Among Workers in Firms Offering Health Benefits, Percentage of Eligible Workers Who Take Up Health Benefits Offered by Their Firm, by Firm Size, 1999-2020
COVERAGE
- In 2020, the percentage of workers at firms offering health benefits covered by their firm’s health plan is 64%, similar to the percentage last year [Figure 3.1] and [Figure 3.2].
- The coverage rate at firms offering health benefits is similar for small firms and large firms in 2020. These rates are similar to the rates last year for both small firms and large firms [Figure 3.1] and [Figure 3.3].
- There is significant variation by industry in the coverage rate among workers in firms offering health benefits. The average coverage rate is particularly low in the retail industry (40%) [Figure 3.3].
- There also is variation by firm wage levels. Among workers in firms offering health benefits, those in firms with a relatively large share of lower-wage workers are less likely to be covered by their own firm than workers in firms with a smaller share of lower-wage workers (47% vs. 65%). A similar pattern exists in firms with a relatively large share of higher-wage workers, with workers in these firms being more likely to be covered by their employer’s health benefits than those in firms with a smaller share of higher-wage workers (72% vs. 57%) [Figure 3.9].
- The age distribution of workers is also related to variation in coverage rates. Among workers in firms offering health benefits, those in firms with a relatively small share of younger workers are more likely to be covered by their own firm than those in firms with a larger share of younger workers (66% vs. 40%). Similarly, workers in offering firms with a relatively large share of older workers are more likely to be covered by their own firm than those in firms with a smaller share of older workers (67% vs. 61%) [Figure 3.9].
- Among workers in firms offering health benefits, those working in public firms are more likely than workers in other firm types to be covered by their own firm [Figure 3.9].
- Among workers in all firms, including those that offer and those that do not offer health benefits, 57% are covered by health benefits offered by their employer, similar to the percentages last year and five years ago [Figure 3.10]. The offer rate estimate for 2010 was an aberration so we are not making a coverage rate comparison to ten years ago.
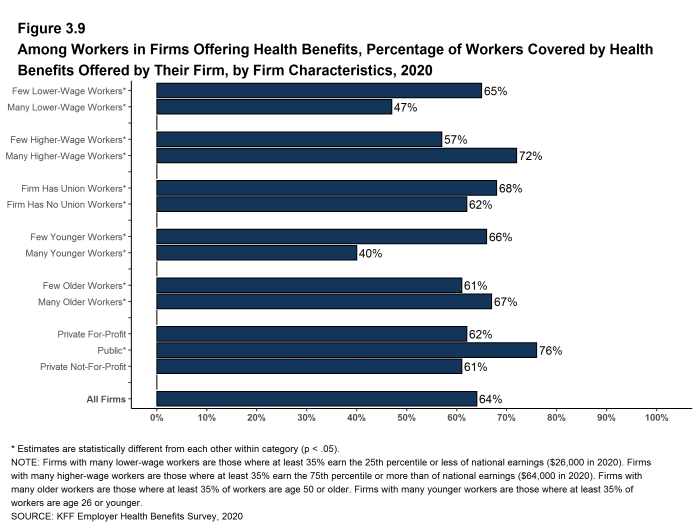
Figure 3.9: Among Workers in Firms Offering Health Benefits, Percentage of Workers Covered by Health Benefits Offered by Their Firm, by Firm Characteristics, 2020
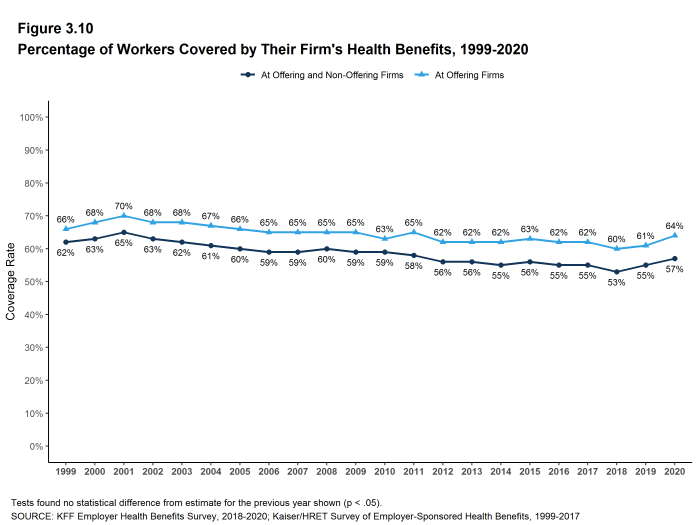
Figure 3.10: Percentage of Workers Covered by Their Firm’s Health Benefits, 1999-2020
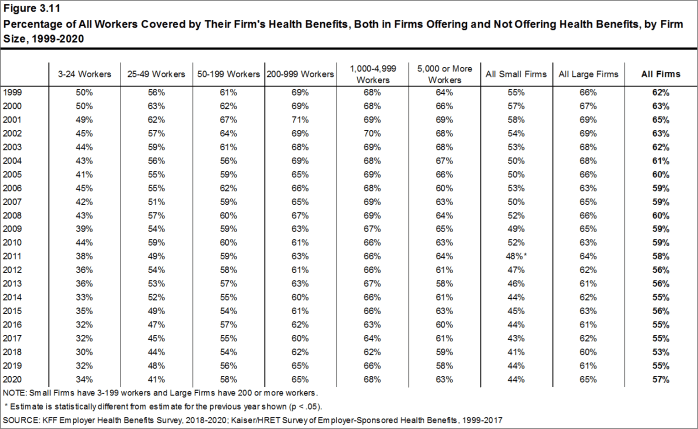
Figure 3.11: Percentage of All Workers Covered by Their Firm’s Health Benefits, Both in Firms Offering and Not Offering Health Benefits, by Firm Size, 1999-2020
WAITING PERIODS
- Waiting periods are a specified length of time after beginning employment before a worker is eligible to enroll in health benefits. With some exceptions, the Affordable Care Act (ACA) requires that waiting periods cannot exceed 90 days. For example, employers are permitted to have orientation periods before the waiting period begins which, in effect, means a worker is not eligible for coverage three months after being hired. If a worker is eligible to enroll on the 1st of the month after three months of employment, this survey rounds up and considers the firm’s waiting period four months. For these reasons, some employers still have waiting periods exceeding the 90-day maximum.
- Sixty-eight percent of covered workers face a waiting period before coverage is available, similar to two years ago [Figure 3.12]. Covered workers in small firms are more likely than those in large firms to have a waiting period (78% vs. 64%) [Figure 3.12].
- The average waiting period among covered workers who face a waiting period is 1.9 months [Figure 3.12]. A small percentage (5%) of covered workers with a waiting period have a waiting period of more than 3 months.
- Respondents with waiting periods greater than 4 months generally indicated that employees had training, orientation, or measurement periods in which they were employees but were not eligible for health benefits. Some employers have measurement periods to determine whether variable hour employees will meet the requirements for the firm’s health benefits.
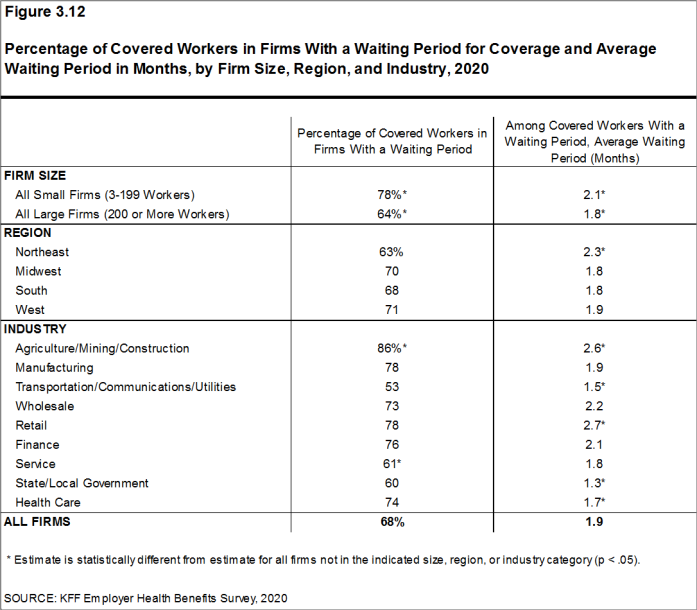
Figure 3.12: Percentage of Covered Workers in Firms With a Waiting Period for Coverage and Average Waiting Period in Months, by Firm Size, Region, and Industry, 2020
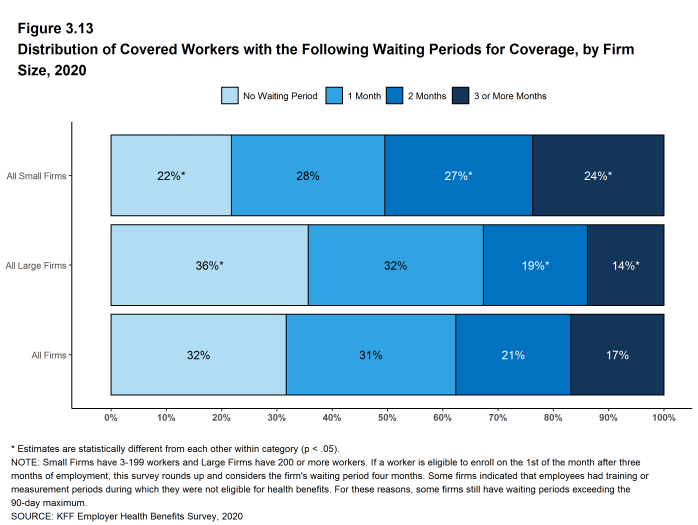
Figure 3.13: Distribution of Covered Workers With the Following Waiting Periods for Coverage, by Firm Size, 2020
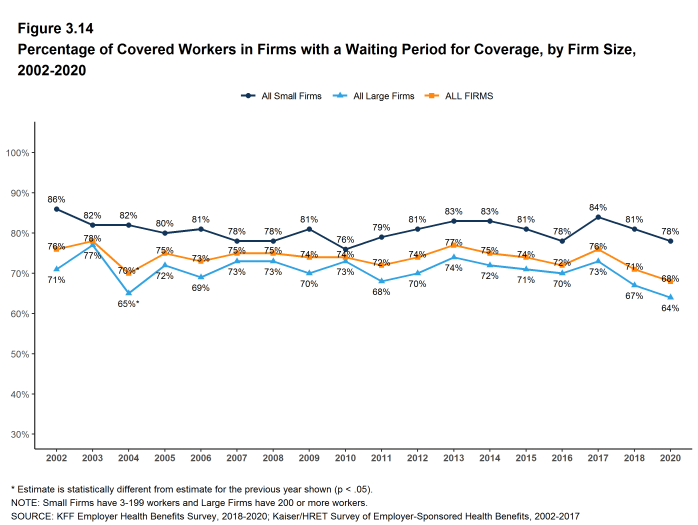
Figure 3.14: Percentage of Covered Workers in Firms With a Waiting Period for Coverage, by Firm Size, 2002-2020
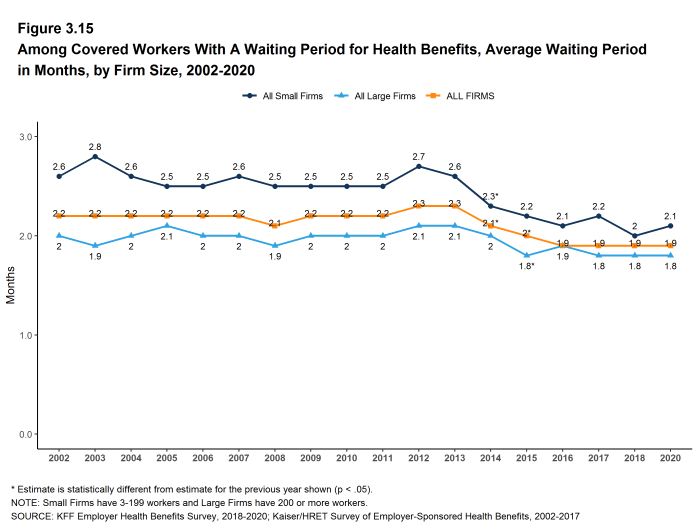
Figure 3.15: Among Covered Workers With a Waiting Period for Health Benefits, Average Waiting Period in Months, by Firm Size, 2002-2020
- Kaiser Family Foundation. Health Insurance Coverage of the Total Population [Internet]. KFF (Kaiser Family Foundation). 2019 [cited 2020 Aug 10]. Available from: https://www.kff.org/other/state-indicator/total-population/ Coverage is based on calculations from the 2018 American Community Survey. During the winter and spring of 2020, there was a steep increase in the unemployment rate, potentially decreasing the number of people covered by employer coverage.↩︎
- See Section 2 for part-time and temporary worker offer rates.↩︎
- In 2009, we began weighting the percentage of workers that take up coverage by the number of workers eligible for coverage. The historical take-up estimates have also been updated. See the Survey Design and Methods section for more information.↩︎
Types of Plans Offered
Most firms that offer health benefits offer only one type of health plan (74%). Large firms (200 or more workers) are more likely than small firms (3-199 workers) to offer more than one type of health plan. Firms are most likely to offer their workers a PPO plan and are least likely to offer a conventional plan (sometimes known as indemnity insurance).
NUMBER OF PLAN TYPES OFFERED
- In 2020, 74% of firms offering health benefits offer only one type of health plan. Large firms are more likely than small firms to offer more than one plan type (58% vs. 25%) [Figure 4.1].
- Sixty-four percent of covered workers are employed in a firm that offers more than one type of health plan. Seventy-four percent of covered workers in large firms are employed by a firm that offers more than one plan type, compared to 37% in small firms [Figure 4.2].
- Seventy-eight percent of covered workers in firms offering health benefits work in firms that offer one or more PPOs; 62% work in firms that offer one or more HDHP/SOs; 30% work in firms that offer one or more HMOs; 15% work in firms that offer one or more POS plans; and 3% work in firms that offer one or more conventional plans [Figure 4.4].
- Among covered workers in firms offering only one type of health plan, 56% are in firms that only offer one or more PPOs and 24% are in firms that only offer one or more HDHP/SOs [Figure 4.5].
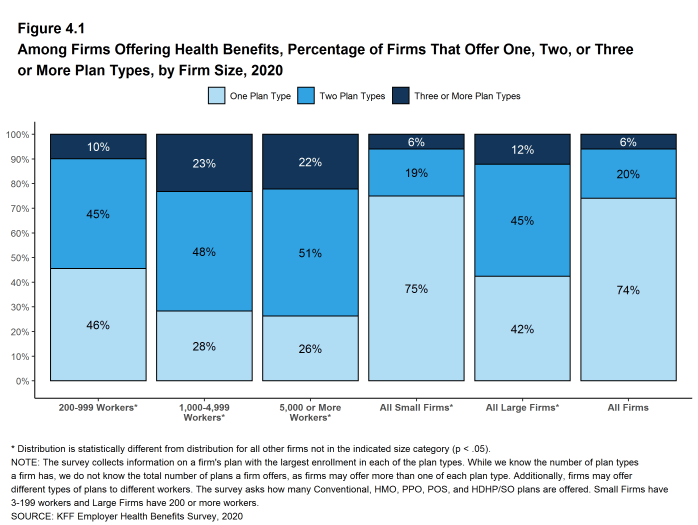
Figure 4.1: Among Firms Offering Health Benefits, Percentage of Firms That Offer One, Two, or Three or More Plan Types, by Firm Size, 2020
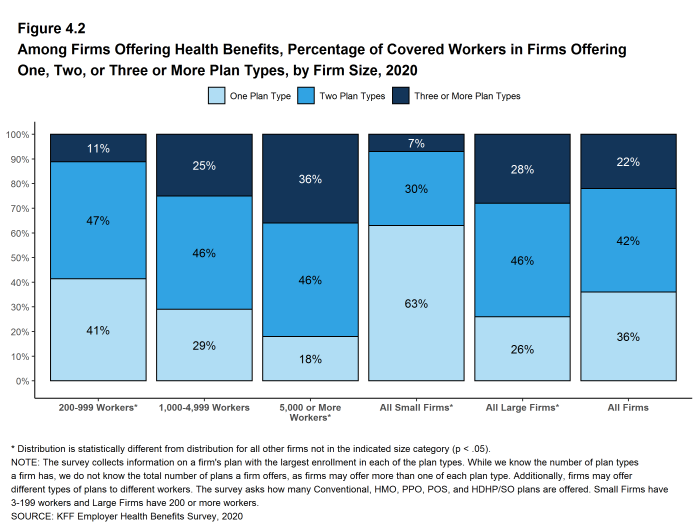
Figure 4.2: Among Firms Offering Health Benefits, Percentage of Covered Workers in Firms Offering One, Two, or Three or More Plan Types, by Firm Size, 2020
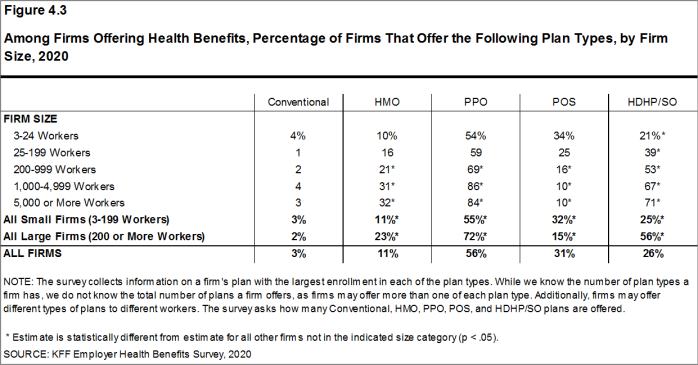
Figure 4.3: Among Firms Offering Health Benefits, Percentage of Firms That Offer the Following Plan Types, by Firm Size, 2020
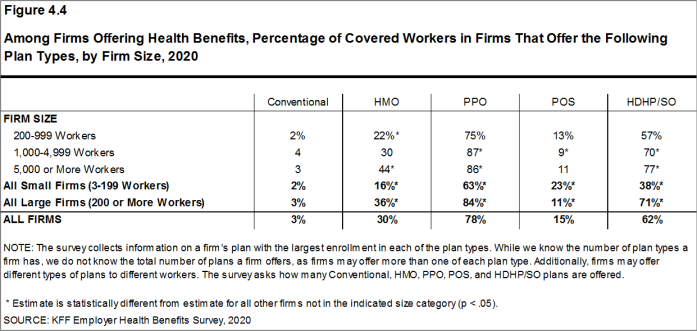
Figure 4.4: Among Firms Offering Health Benefits, Percentage of Covered Workers in Firms That Offer the Following Plan Types, by Firm Size, 2020
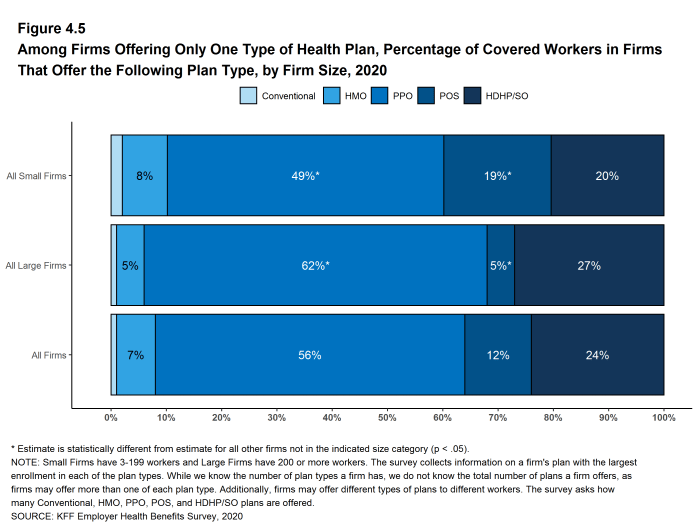
Figure 4.5: Among Firms Offering Only One Type of Health Plan, Percentage of Covered Workers in Firms That Offer the Following Plan Type, by Firm Size, 2020
CHOICE OF HDHP/SO PLANS
- Some firms only offer workers an HDHP/SO, or do not make other plan choices available to some workers. At 68% of firms that offer an HDHP/SO, at least some workers can only choose an HDHP/SO, while 32% of firms that offer an HDHP/SO allow workers to choose between an HDHP/SO and other plan types [Figure 4.6].
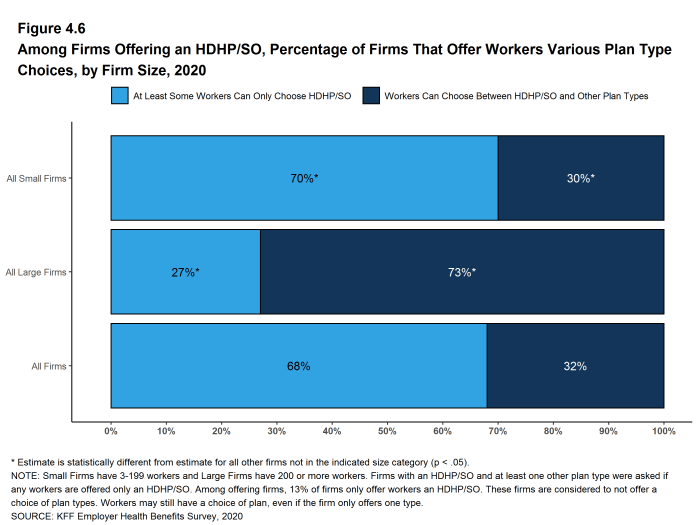
Figure 4.6: Among Firms Offering an HDHP/SO, Percentage of Firms That Offer Workers Various Plan Type Choices, by Firm Size, 2020
The survey collects information on a firm’s plan with the largest enrollment in each of the plan types. While we know the number of plan types a firm has, we do not know the total number of plans a firm offers workers. In addition, firms may offer different types of plans to different workers. For example, some workers might be offered one type of plan at one location, while workers at another location are offered a different type of plan.
Market Shares of Health Plans
PPOs are the most common plan type, covering 47% of covered workers, followed by HDHP/SOs, HMOs, POS plans, and conventional plans. The drop in the share of covered workers in PPOs in 2019 was not statistically significant.
- Forty-seven percent of covered workers are enrolled in PPOs, followed by HDHP/SOs (31%), HMOs (13%), POS plans (8%), and conventional plans (1%) [Figure 5.1].
- The percentage of covered workers enrolled in HDHP/SOs is similar to last year, but has increased over the past decade. The percentage of covered workers enrolled in PPOs decreased by 11% over the past decade.
- The percentage of covered workers enrolled in HMOs (13%) is significantly lower than the percentage last year (19%) but not different from 2015 (14%). This percentage has moved over the last few years and we are unsure as to why. As noted above, we employed a new survey firm in 2020 and the change could represent a difference in interpretation of plan characteristics by new interviewers. There also may be measurement error in any of they years. We will continue to watch this topic.
- A larger share of covered workers are enrolled in HDHP/SOs than in HMOs in small and large firms.
- Covered workers in large firms are more likely to be enrolled in HDHP/SOs than covered workers in small firms (33% vs. 25%)[Figure 5.2]. Covered workers in small firms are much more likely than covered workers in large firms to be enrolled in POS plans (17% vs. 5%) [Figure 5.2].
- Plan enrollment patterns also differ across regions.
- HMO enrollment is significantly higher in the West (22%), and significantly lower in the Midwest (7%) [Figure 5.3].
- Covered workers in the Midwest (39%) are more likely to be enrolled in HDHP/SOs than workers in other regions, while covered workers in the West (24%) are less likely to be enrolled in HDHP/SOs [Figure 5.3].
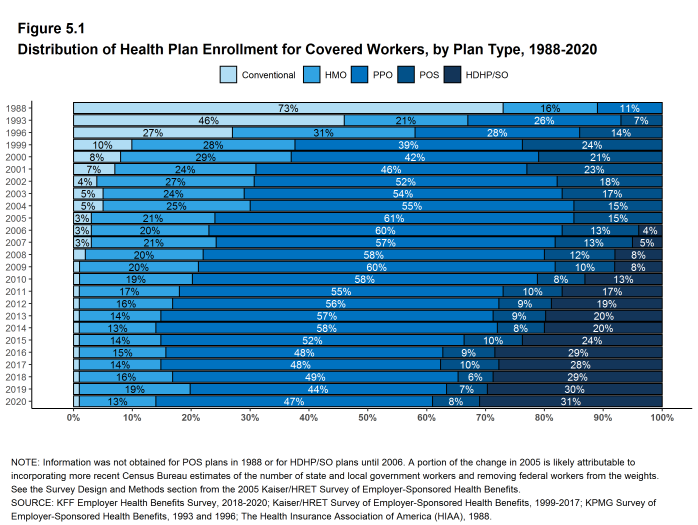
Figure 5.1: Distribution of Health Plan Enrollment for Covered Workers, by Plan Type, 1988-2020
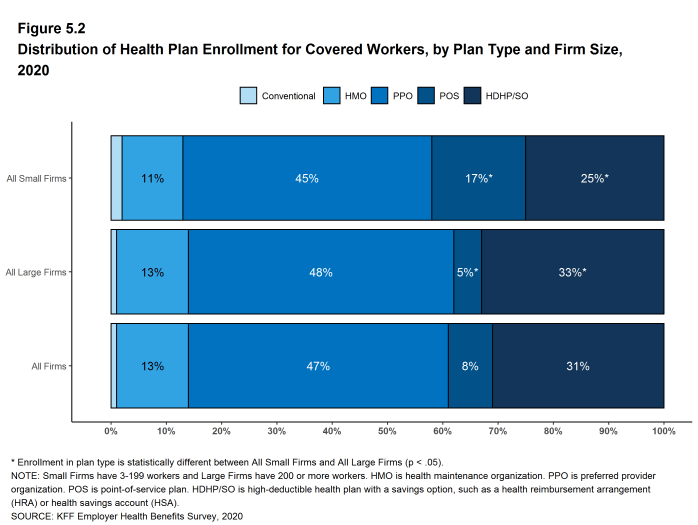
Figure 5.2: Distribution of Health Plan Enrollment for Covered Workers, by Plan Type and Firm Size, 2020
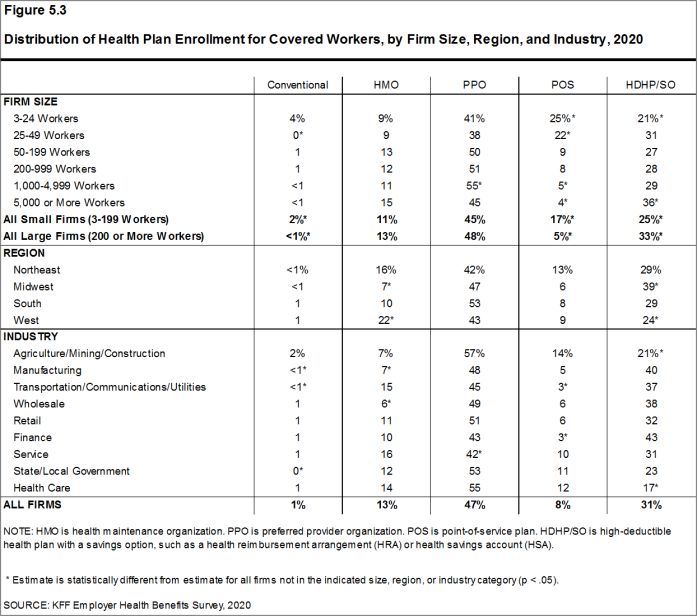
Figure 5.3: Distribution of Health Plan Enrollment for Covered Workers, by Firm Size, Region, and Industry, 2020
Worker and Employer Contributions For Premiums
In 2020, covered workers on average contribute 17% of the premium for single coverage and 27% of the premium for family coverage.17 The average monthly worker contributions are $104 for single coverage ($1,243 annually) and $466 for family coverage ($5,588 annually). The average contribution amount for family coverage is higher for covered workers in small firms (3-199 workers) than for covered workers in large firms (200 or more workers) ($6,820 vs. $5,112).
- In 2020, covered workers on average contribute 17% of the premium for single coverage and 27% of the premium for family coverage. The average percentage contributed for single coverage has remained stable in recent years. The average percentage contributed for family coverage is lower in 2020 than the percentage (30%) last year [Figure 6.1].18
- Covered workers in small firms on average contribute a much higher percentage of the premium for family coverage (35% vs. 24%) than covered workers in large firms [Figure 6.2].
- Workers with single coverage have an average contribution of $104 per month ($1,243 annually), and workers with family coverage have an average contribution of $466 per month ($5,588 annually) toward their health insurance premiums [Figure 6.3], [Figure 6.4], and [Figure 6.5].
- The average worker contributions in HDHP/SOs are lower than the overall average worker contribution for single coverage ($1,061 vs. $1,243) and family coverage ($4,852 vs. $5,588). The average worker contributions in PPOs are higher than the overall average worker contribution for family coverage ($6,017 vs. $5,588) [Figure 6.6].
- Worker contributions also differ by firm size.
- Covered workers in small firms on average contribute significantly more annually for family coverage than covered workers in large firms ($6,820 vs. $5,112). The average contributions amounts for covered workers in small and large firms are similar for single coverage [Figure 6.7].
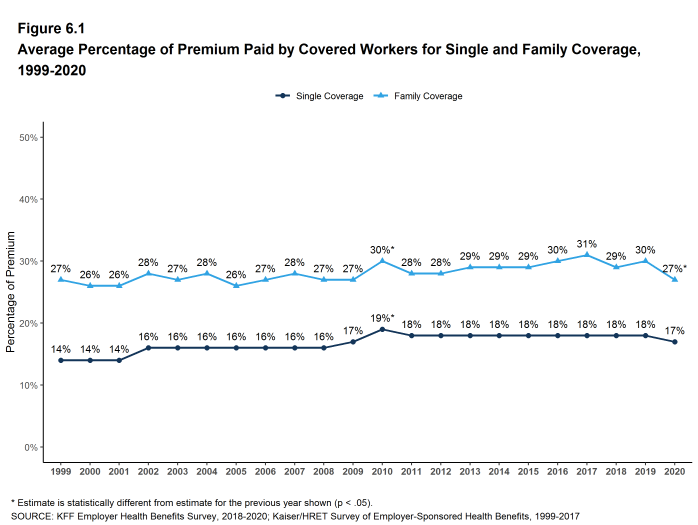
Figure 6.1: Average Percentage of Premium Paid by Covered Workers for Single and Family Coverage, 1999-2020
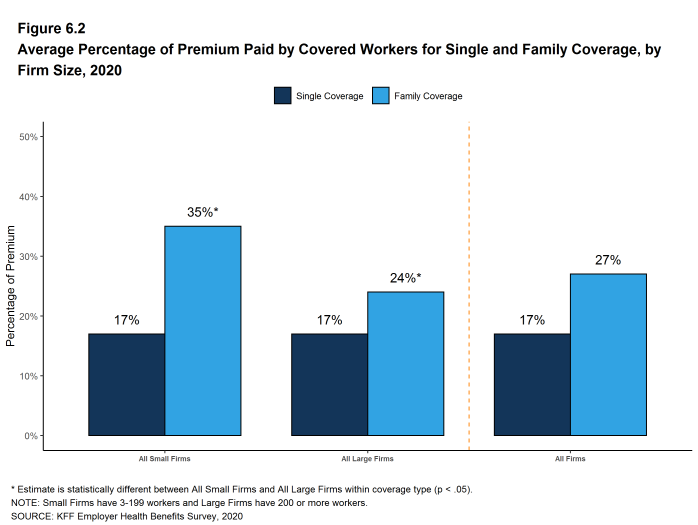
Figure 6.2: Average Percentage of Premium Paid by Covered Workers for Single and Family Coverage, by Firm Size, 2020
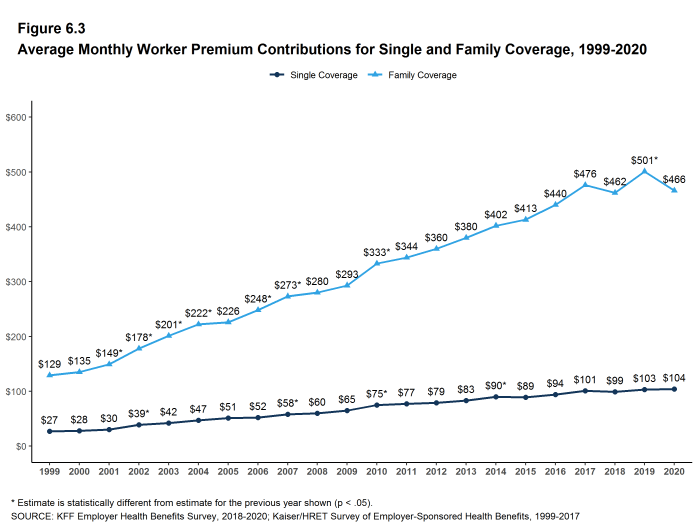
Figure 6.3: Average Monthly Worker Premium Contributions for Single and Family Coverage, 1999-2020
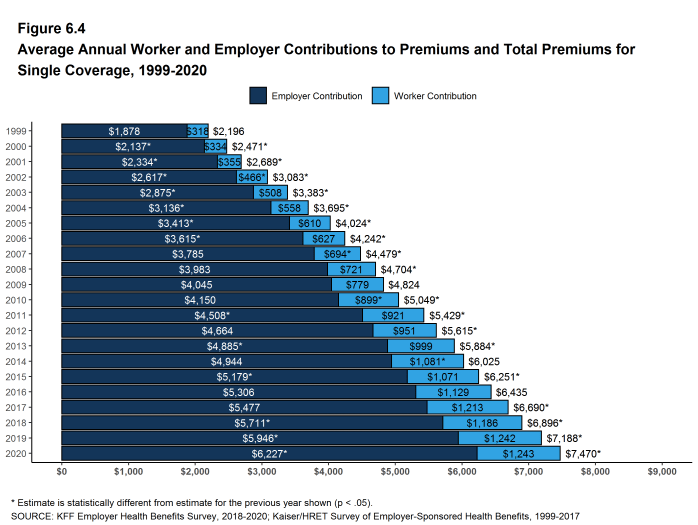
Figure 6.4: Average Annual Worker and Employer Contributions to Premiums and Total Premiums for Single Coverage, 1999-2020
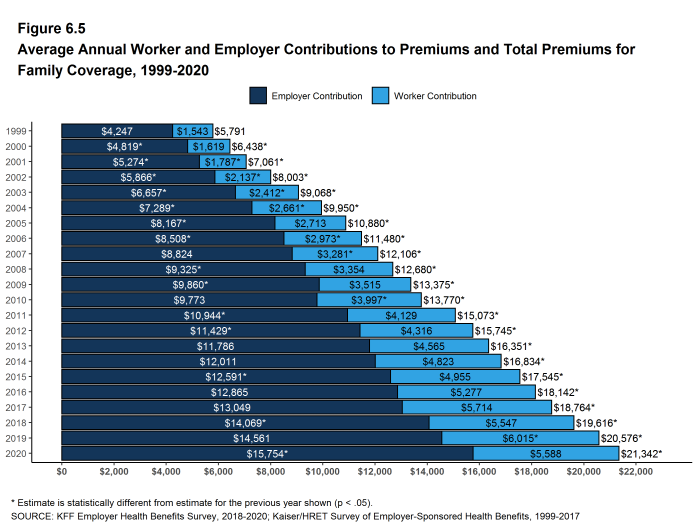
Figure 6.5: Average Annual Worker and Employer Contributions to Premiums and Total Premiums for Family Coverage, 1999-2020
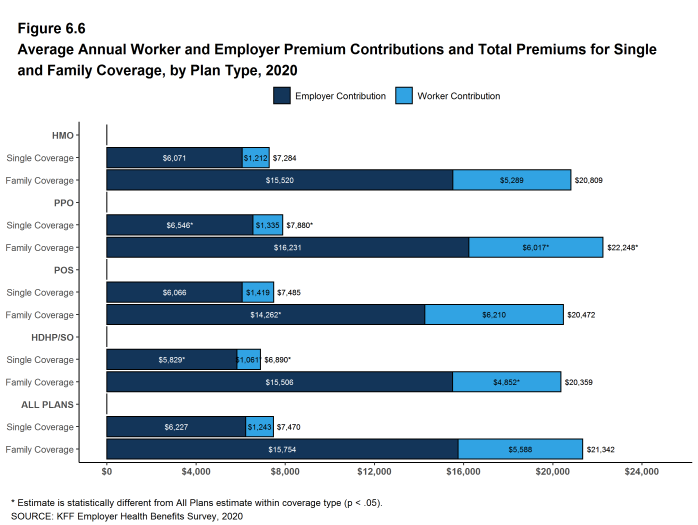
Figure 6.6: Average Annual Worker and Employer Premium Contributions and Total Premiums for Single and Family Coverage, by Plan Type, 2020
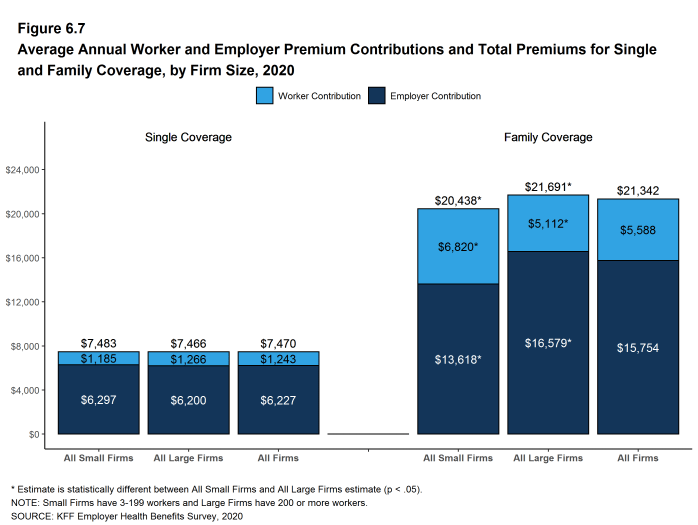
Figure 6.7: Average Annual Worker and Employer Premium Contributions and Total Premiums for Single and Family Coverage, by Firm Size, 2020
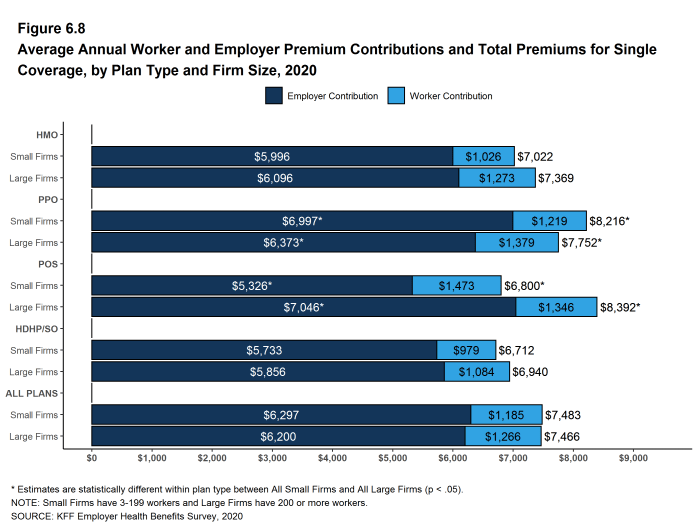
Figure 6.8: Average Annual Worker and Employer Premium Contributions and Total Premiums for Single Coverage, by Plan Type and Firm Size, 2020
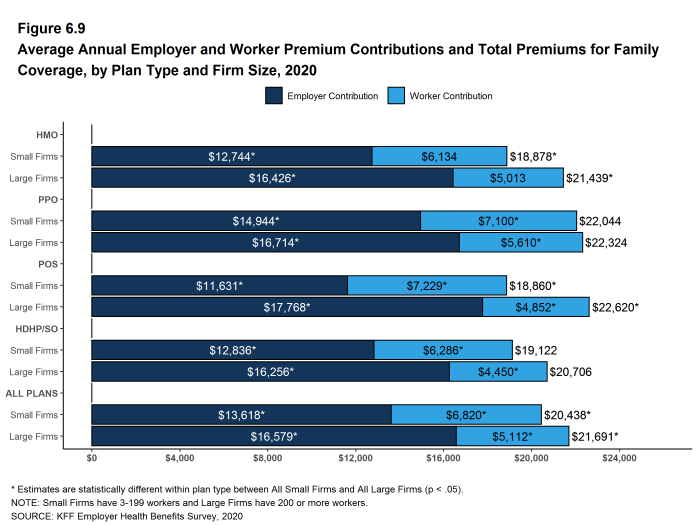
Figure 6.9: Average Annual Employer and Worker Premium Contributions and Total Premiums for Family Coverage, by Plan Type and Firm Size, 2020
DISTRIBUTIONS OF WORKER CONTRIBUTIONS TO THE PREMIUM
- About nine-tenths of covered workers are in a plan where the employer contributes at least half of the premium for both single and family coverage.
- Eleven percent of covered workers are in a plan where the employer pays the entire premium for single coverage, while only 4% of covered workers are in a plan where the employer pays the entire premium for family coverage [Figure 6.10].
- Covered workers in small firms are much more likely than covered workers in large firms to be in a plan where the employer pays the entire premium.
- Twenty-seven percent of covered workers in small firms have an employer that pays the full premium for single coverage, compared to 4% of covered workers in large firms [Figure 6.10].
- For family coverage, 10% of covered workers in small firms have an employer that pays the full premium, compared to 1% of covered workers in large firms [Figure 6.10].
- Eleven percent of covered workers are in a plan with a worker contribution of more than half of the premium for family coverage [Figure 6.10].
- Twenty-eight percent of covered workers in small firms work in a firm where the worker contribution for family coverage is more than 50% of the premium, a much higher percentage than the 4% of covered workers in large firms [Figure 6.10].
- Small shares of covered workers in small firms (3%) and large firms (1%) must pay more than 50% of the premium for single coverage [Figure 6.10].
- There is substantial variation among workers in both small and large firms in the dollar amounts they must contribute.
- Among covered workers in small firms, 39% have a contribution for single coverage of less than $500, while 21% have a contribution of $2,000 or more. For family coverage, 15% have a contribution of less than $1,500, while 22% have a contribution of $10,500 or more [Figure 6.13] and [Figure 6.14].
- Among covered workers in large firms, 13% have a contribution for single coverage of less than $500, while 12% have a contribution of $2,000 or more. For family coverage, 6% have a contribution of less than $1,500, while only 4% have a contribution of $10,500 or more [Figure 6.13] and [Figure 6.14].
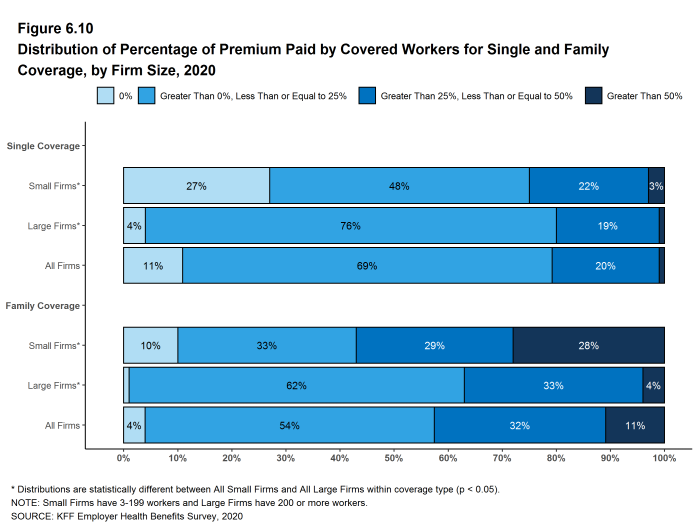
Figure 6.10: Distribution of Percentage of Premium Paid by Covered Workers for Single and Family Coverage, by Firm Size, 2020
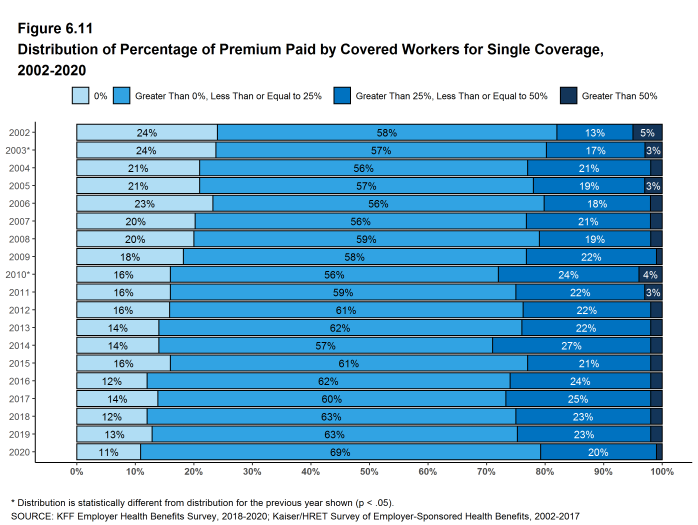
Figure 6.11: Distribution of Percentage of Premium Paid by Covered Workers for Single Coverage, 2002-2020
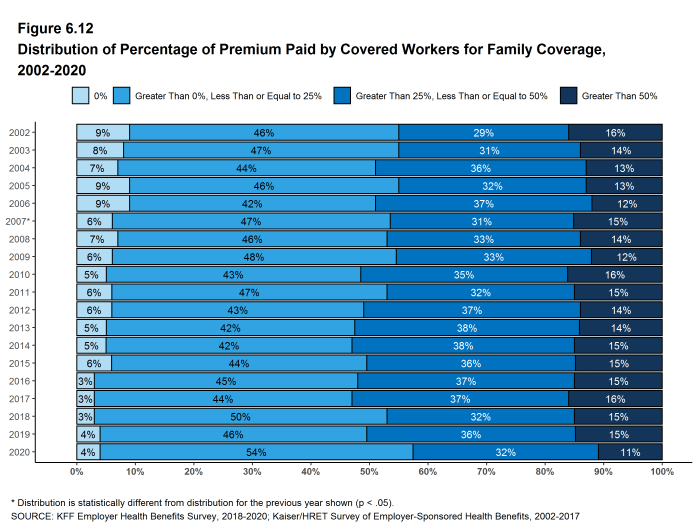
Figure 6.12: Distribution of Percentage of Premium Paid by Covered Workers for Family Coverage, 2002-2020
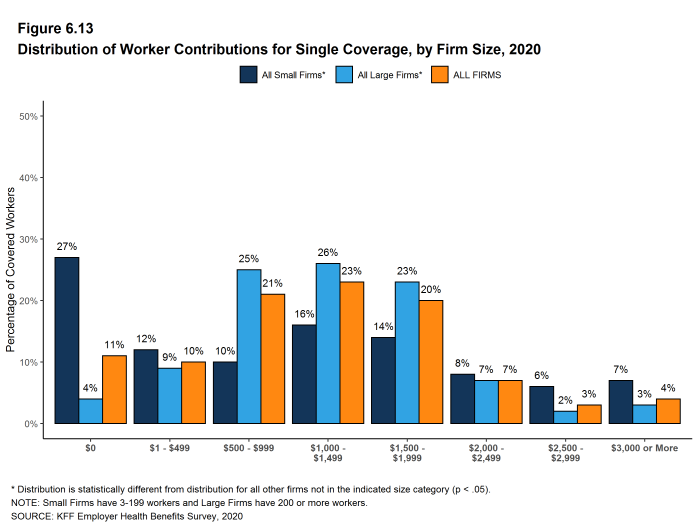
Figure 6.13: Distribution of Worker Contributions for Single Coverage, by Firm Size, 2020
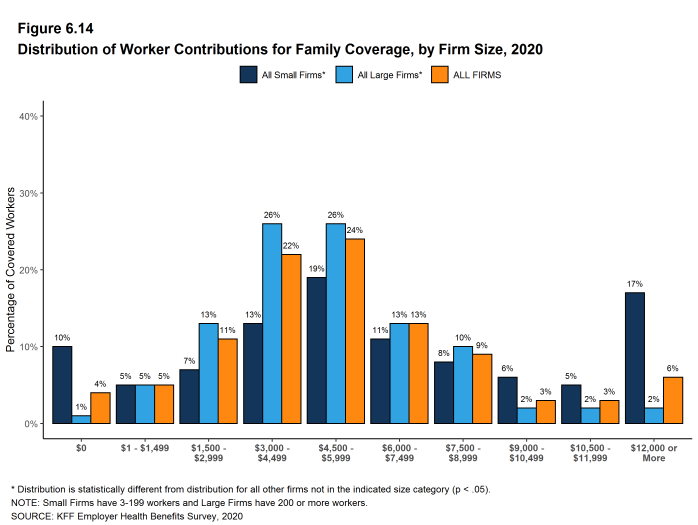
Figure 6.14: Distribution of Worker Contributions for Family Coverage, by Firm Size, 2020
DIFFERENCES BY FIRM CHARACTERISTICS
- The percentage of the premium paid by covered workers also varies by firm characteristics.
- Covered workers in private, for-profit firms have relatively high premium contributions for single ($1,381) and family ($5,988) coverage. Covered workers in public firms have relatively low premium contributions for single ($865) and family ($4,724) coverage [Figure 6.17] .
- Covered workers in firms with a relatively large share of lower-wage workers (where at least 35% of workers earn $26,000 a year or less) have a higher average contribution rate for family coverage (38% vs. 26%) than those in firms with a smaller share of lower-wage workers [Figure 6.17].
- Covered workers in firms with a relatively large share of higher-wage workers (where at least 35% earn $64,000 or more annually) have lower average contribution rates for single coverage (16% vs. 18%) and for family coverage (23% vs. 31%) than those in firms with a smaller share of higher-wage workers [Figure 6.17].
- Covered workers in firms that have at least some union workers have lower average contribution rates for single coverage (15% vs. 18%) for family coverage (20% vs. 31%) than those in firms without any union workers [Figure 6.17].
- Covered workers in firms that are partially or completely self-funded on average have a lower average contribution rate for family coverage than workers in firms that are fully-insured (24% vs. 33%) [Figure 6.17].19
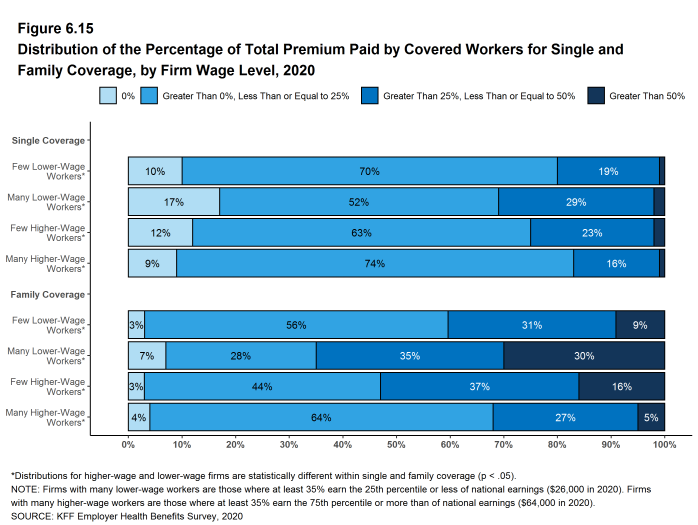
Figure 6.15: Distribution of the Percentage of Total Premium Paid by Covered Workers for Single and Family Coverage, by Firm Wage Level, 2020

Figure 6.16: Average Annual Worker and Employer Contributions to Premiums and Total Premiums for Single and Family Coverage, by Firm Wage Level, 2020
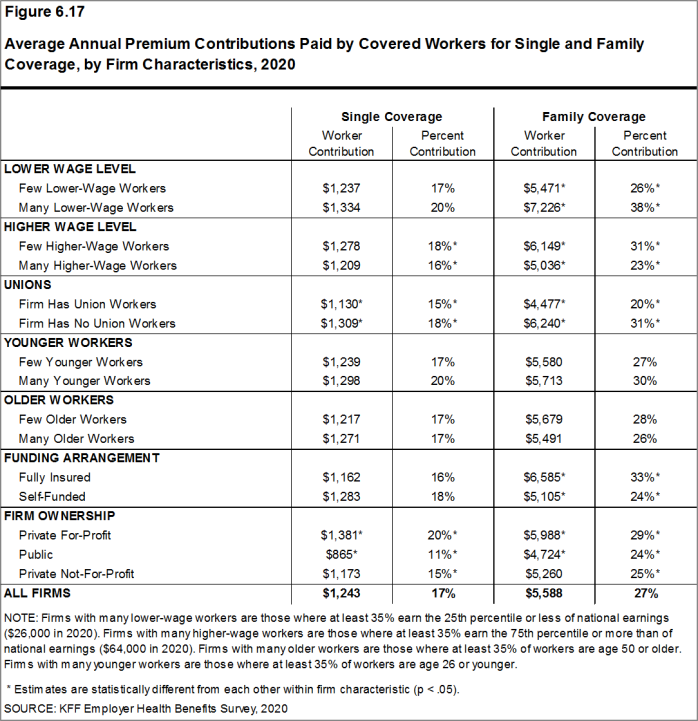
Figure 6.17: Average Annual Premium Contributions Paid by Covered Workers for Single and Family Coverage, by Firm Characteristics, 2020
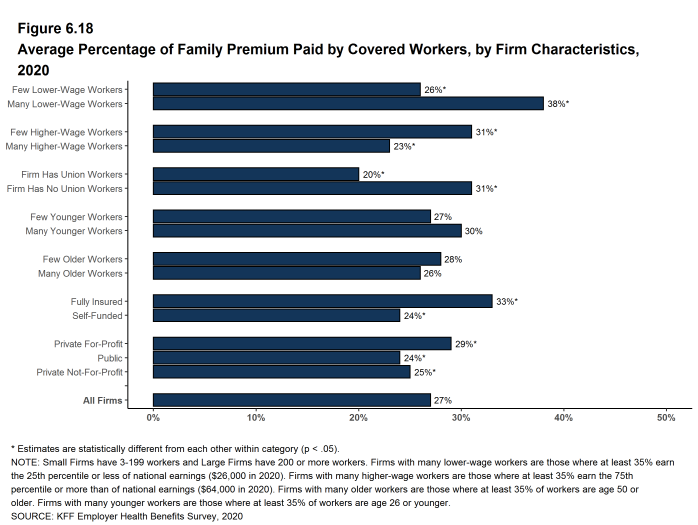
Figure 6.18: Average Percentage of Family Premium Paid by Covered Workers, by Firm Characteristics, 2020
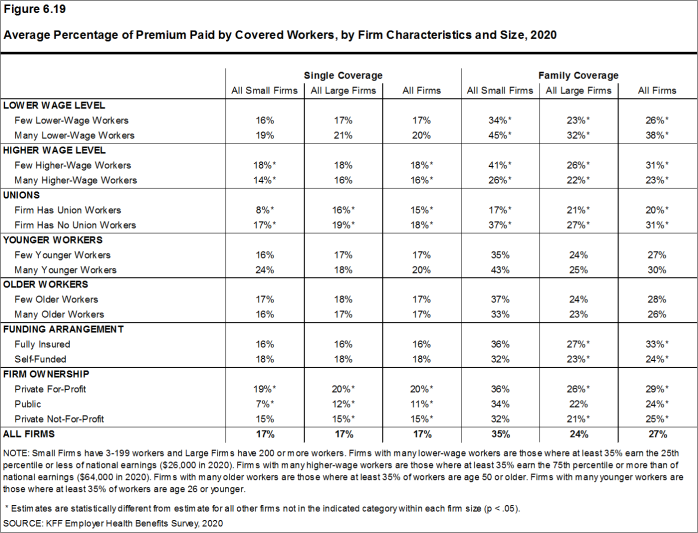
Figure 6.19: Average Percentage of Premium Paid by Covered Workers, by Firm Characteristics and Size, 2020
DIFFERENCES BY REGION AND INDUSTRY
- The average worker contribution rate for single coverage is lower in the West (14%) than in other regions [Figure 6.20].
- The average worker contribution rate for family coverage is lower in the Northeast (23%) and higher in the South (31%) than in other regions [Figure 6.20].
- There is considerable variation in average worker contribution rates across industries for both single and family coverage [Figure 6.21].
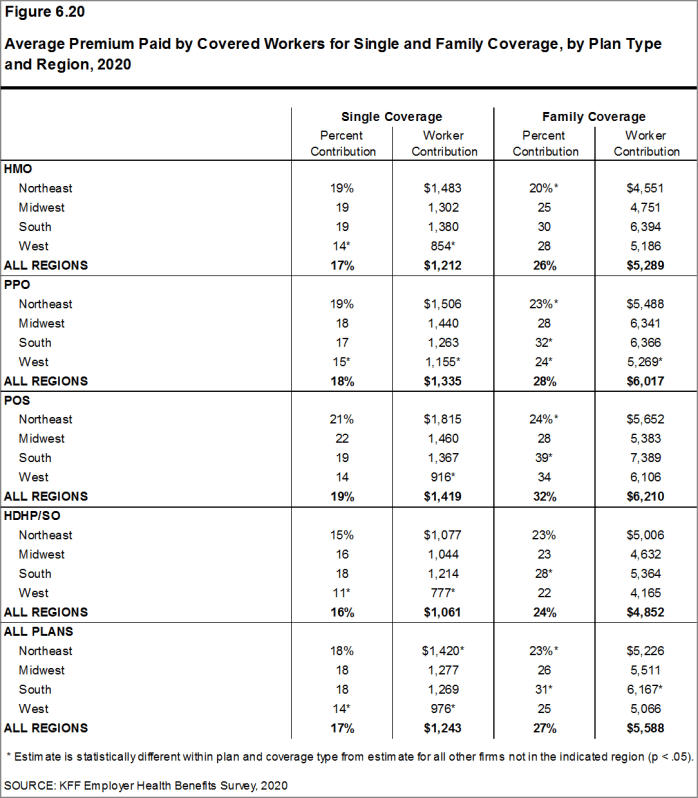
Figure 6.20: Average Premium Paid by Covered Workers for Single and Family Coverage, by Plan Type and Region, 2020
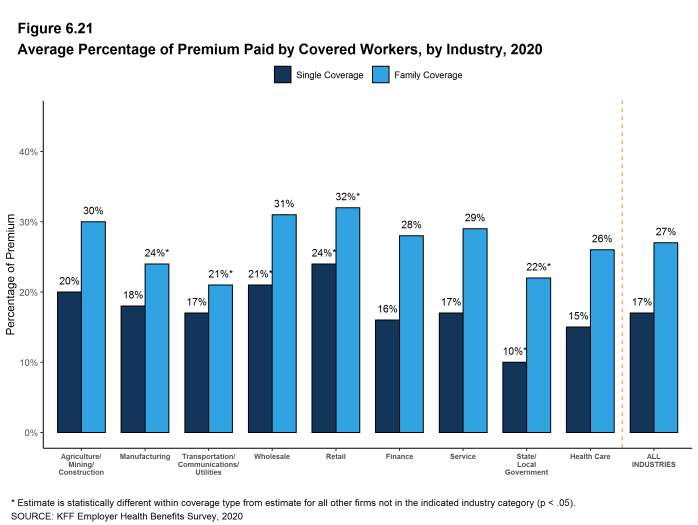
Figure 6.21: Average Percentage of Premium Paid by Covered Workers, by Industry, 2020
CHANGES OVER TIME
- The average worker contribution for single coverage ($1,243 in 2020) is similar to the amount last year. The average worker contribution for family coverage ($5,588 in 2020) appears lower than the average contribution for family coverage last year ($6,015), but the difference is not statistically significant [Figure 6.4] and [Figure 6.5].
- The average worker contributions for single and family coverage have increased over the last five years (16% and 13%, respectively) and over the last 10 years (38% and 40%, respectively).
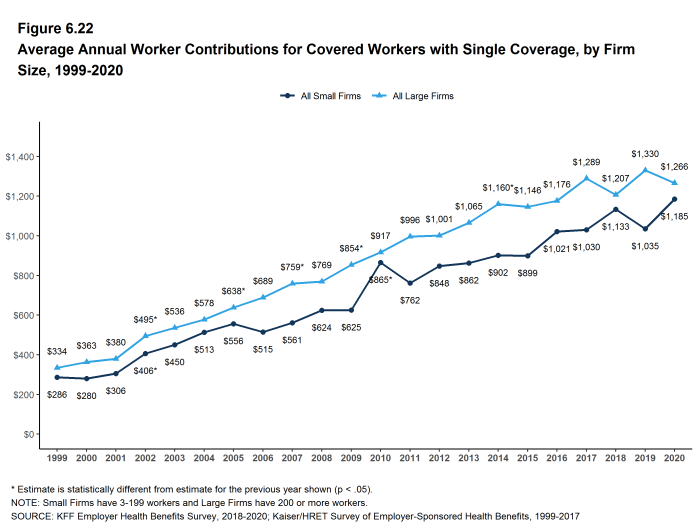
Figure 6.22: Average Annual Worker Contributions for Covered Workers With Single Coverage, by Firm Size, 1999-2020
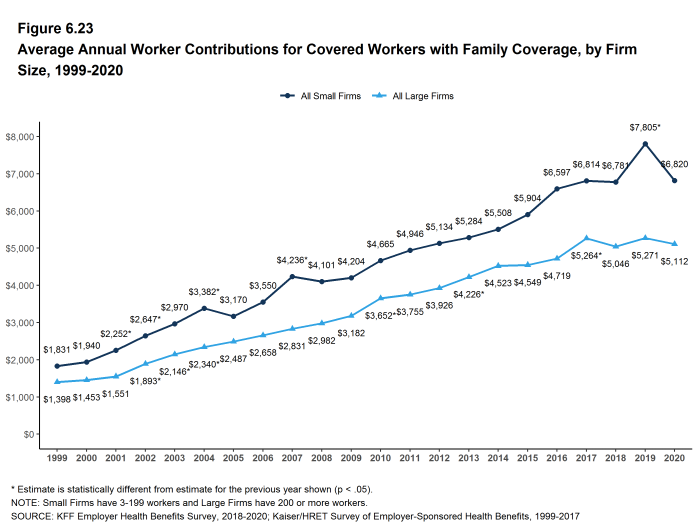
Figure 6.23: Average Annual Worker Contributions for Covered Workers With Family Coverage, by Firm Size, 1999-2020

/bookdown/figures/Figure-6-24.png
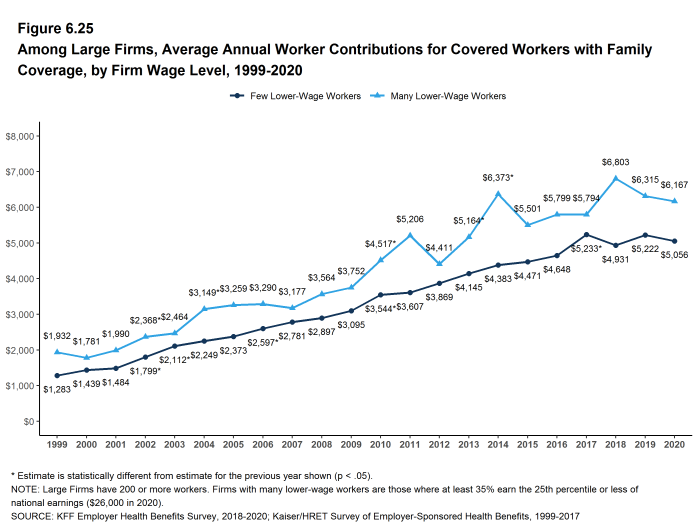
Figure 6.25: Among Large Firms, Average Annual Worker Contributions for Covered Workers With Family Coverage, by Firm Wage Level, 1999-2020
- Estimates for premiums, worker contributions to premiums, and employer contributions to premiums presented in Section 6 do not include contributions made by the employer to Health Savings Accounts (HSAs) or Health Reimbursement Arrangements (HRAs). See Section 8 for estimates of employer contributions to HSAs and HRAs.↩︎
- The average percentage contribution is calculated as a weighted average of all a firm’s plan types and may not necessarily equal the average worker contribution divided by the average premium.↩︎
- For definitions of self-funded and fully-insured plans, see the introduction to Section 10.↩︎
Employee Cost Sharing
In addition to any required premium contributions, most covered workers must pay a share of the cost for the medical services they use. The most common forms of cost sharing are: deductibles (an amount that must be paid before most services are covered by the plan), copayments (fixed dollar amounts), and coinsurance (a percentage of the charge for services). Sometimes cost sharing forms are mixed, such as assessing coinsurance for a service up to a maximum amount, or assessing coinsurance or copayment for a service, whichever is higher. The type and level of cost sharing often vary by the type of plan in which the worker is enrolled. Cost sharing may also vary by the type of service, such as office visits, hospitalizations, or prescription drugs.
The cost-sharing amounts reported here are for covered workers using in-network services. Plan enrollees receiving services from providers that do not participate in plan networks often face higher cost sharing and may be responsible for charges that exceed the plan’s allowable amounts. The framework of this survey does not allow us to capture all of the complex cost-sharing requirements in modern plans, particularly for ancillary services (such as durable medical equipment or physical therapy) or cost-sharing arrangements that vary across different settings (such as tiered networks). Therefore, we do not collect information on all plan provisions and limits that affect enrollee out-of-pocket liability.
GENERAL ANNUAL DEDUCTIBLES FOR WORKERS IN PLANS WITH DEDUCTIBLES
- We consider a general annual deductible to be an amount that must be paid by enrollees before most services are covered by their health plan. Non-grandfathered health plans are required to cover some services, such as preventive care, without cost sharing. Some plans require enrollees to meet a service-specific deductible, such as for prescription drugs or hospital admissions, in lieu of or in addition to a general annual deductible. As discussed below, some plans with a general annual deductible for most services exclude specified classes of care from the deductible, such as prescriptions or physician office visits.
- In 2020, 83% of covered workers are enrolled in a plan with a general annual deductible for single coverage, similar to the percentage last year (82%) and much higher than the percentage ten years ago (70%) [Figure 7.2].
- The percentages of covered workers enrolled in a plan with a general annual deductible for single coverage are similar for small firms (3-199 workers) (79%) and large firms (200 or more workers) (84%) [Figure 7.2].
- The likelihood of being in a plan with a general annual deductible varies by plan type. Fifty-one percent of covered workers in HMOs do not have a general annual deductible for single coverage, compared to 24% of workers in POS plans and 18% of workers in PPOs [Figure 7.1].
- For covered workers in a plan with a general annual deductible, the average annual deductible for single coverage is $1,644, similar to the average deductible ($1,655) last year [Figure 7.3] and [Figure 7.8].
- For covered workers in plans with a general annual deductible, the average deductibles for single coverage are $1,201 in HMOs, $1,204 in PPOs, $1,714 in POS plans, and $2,303 in HDHP/SOs [Figure 7.6].
- The average deductibles for single coverage are higher for most plan types for covered workers in small firms than for covered workers in large firms. For covered workers in PPOs, the most common plan type, the average deductible for single coverage in small firms is considerably higher than the average deductible in large firms ($1,888 vs. $960) [Figure 7.6]. Overall, for covered workers in plans with a general annual deductible, the average deductible for single coverage in small firms ($2,295) is higher than the average deductible in large firms ($1,418) [Figure 7.3].
- The average general annual deductible for single coverage for covered workers in plans with a general annual deductible has increased 25% over the past five years, from $1,318 in 2015 to $1,644 in 2020 [Figure 7.8].
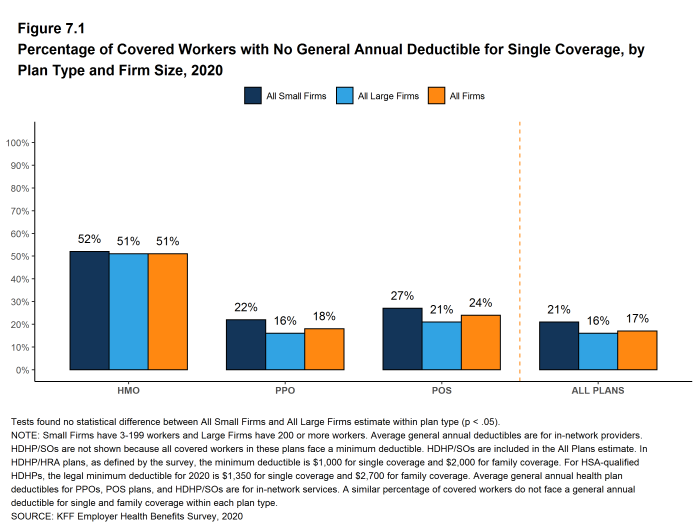
Figure 7.1: Percentage of Covered Workers With No General Annual Deductible for Single Coverage, by Plan Type and Firm Size, 2020
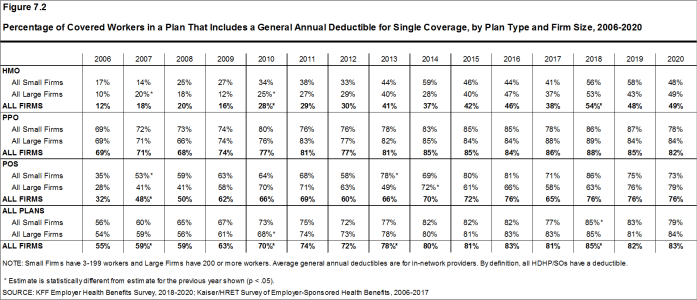
Figure 7.2: Percentage of Covered Workers in a Plan That Includes a General Annual Deductible for Single Coverage, by Plan Type and Firm Size, 2006-2020
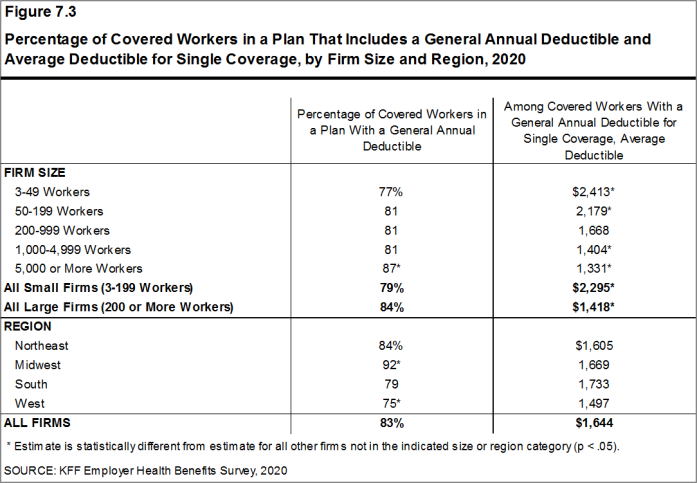
Figure 7.3: Percentage of Covered Workers in a Plan That Includes a General Annual Deductible and Average Deductible for Single Coverage, by Firm Size and Region, 2020
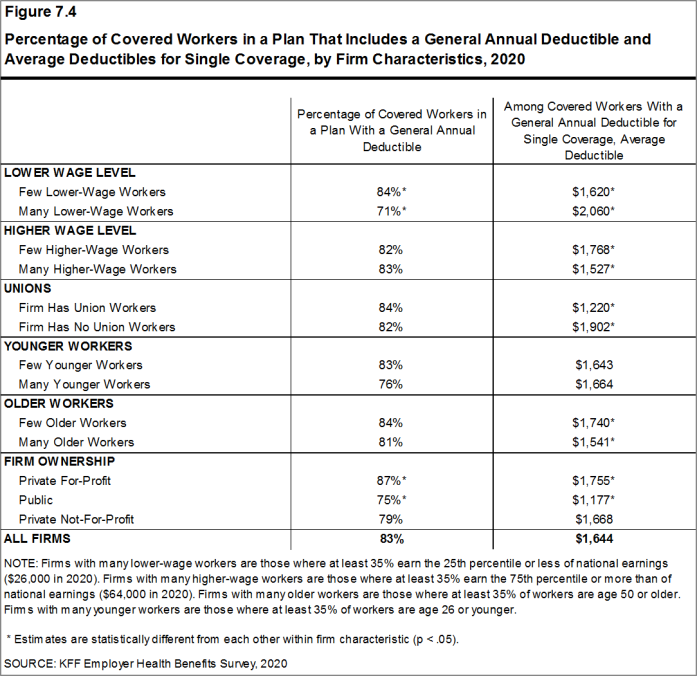
Figure 7.4: Percentage of Covered Workers in a Plan That Includes a General Annual Deductible and Average Deductibles for Single Coverage, by Firm Characteristics, 2020
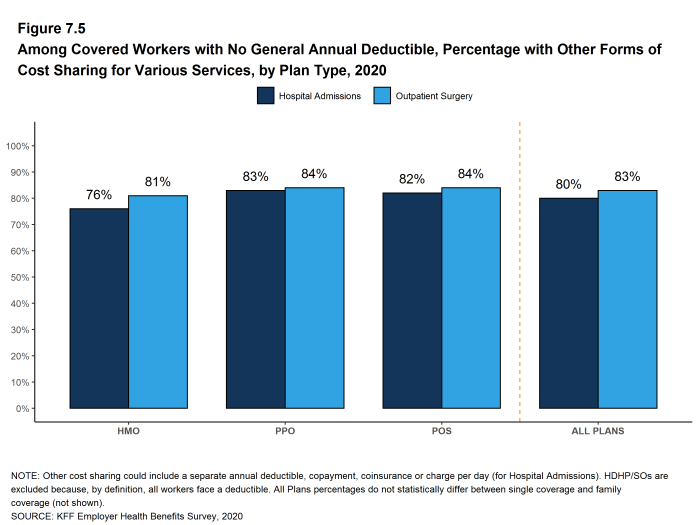
Figure 7.5: Among Covered Workers With No General Annual Deductible, Percentage With Other Forms of Cost Sharing for Various Services, by Plan Type, 2020
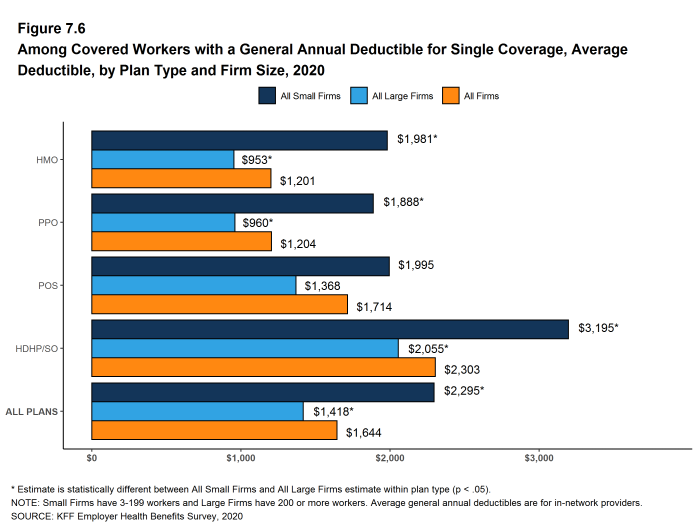
Figure 7.6: Among Covered Workers With a General Annual Deductible for Single Coverage, Average Deductible, by Plan Type and Firm Size, 2020
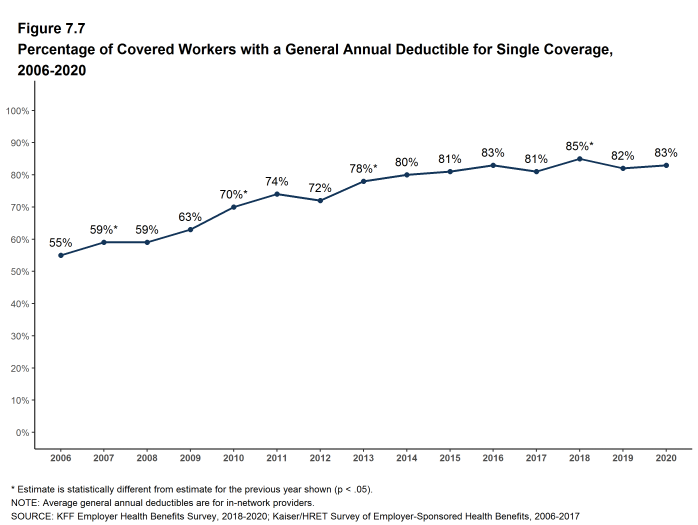
Figure 7.7: Percentage of Covered Workers With a General Annual Deductible for Single Coverage, 2006-2020
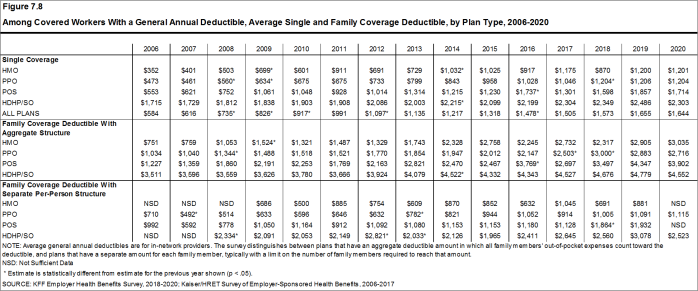
Figure 7.8: Among Covered Workers With a General Annual Deductible, Average Single and Family Coverage Deductible, by Plan Type, 2006-2020
GENERAL ANNUAL DEDUCTIBLES AMONG ALL COVERED WORKERS
- As discussed above, the share of covered workers in plans with a general annual deductible has increased significantly over time, from 70% in 2010 to 83% in 2020 [Figure 7.9]. The average deductible amounts for covered workers in plans with a deductible have also increased, over the period, from $917 in 2010 to $1,644 in 2020 [Figure 7.10]. Neither trend by itself, however, captures the full impact of changes in deductibles on covered workers. We can look at the average impact of both trends together on covered workers by assigning a zero deductible value to covered workers in plans with no deductible and looking at how the resulting averages change over time. These average deductible amounts are lower in any given year but the changes over time reflect both the higher deductibles in plans with a deductible and the fact that more workers face them.
- Using this approach, the average general annual deductible for single coverage for all covered workers in 2020 is $1,364, similar to the amount last year ($1,396) [Figure 7.10].
- The 2020 value is 27% higher than the average general annual deductible of $1,077 in 2015 and 111% higher than the average general annual deductible of $646 in 2010 [Figure 7.10].
- Another way to look at deductibles is the percentage of all covered workers who are in a plan with a deductible that exceeds certain thresholds. Fifty-seven percent of covered workers are in plans with a general annual deductible of $1,000 or more for single coverage, similar to the percentage last year [Figure 7.13].
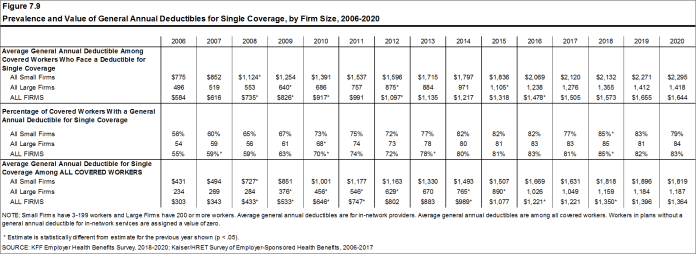
Figure 7.9: Prevalence and Value of General Annual Deductibles for Single Coverage, by Firm Size, 2006-2020
- Over the past five years, the percentage of covered workers with a general annual deductible of $1,000 or more for single coverage has grown 23%, from 46% to 57% [Figure 7.13].
- Workers in small firms are considerably more likely to have a general annual deductible of $1,000 or more for single coverage than workers in large firms (64% vs. 54%) [Figure 7.12].
- In 2020, 26% of covered workers are enrolled in a plan with a deductible of $2,000 or more, similar to the percentage last year (28%) [Figure 7.15]. This percentage is much higher for covered workers in small firms than large firms (42% vs. 20%) [Figure 7.12].
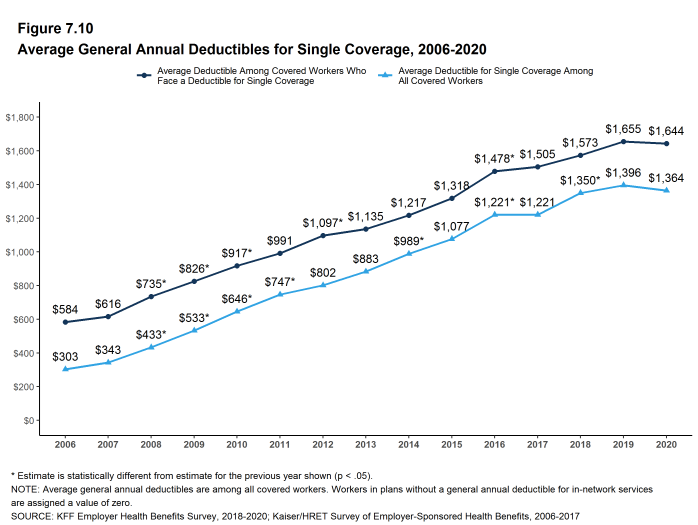
Figure 7.10: Average General Annual Deductibles for Single Coverage, 2006-2020
GENERAL ANNUAL DEDUCTIBLES AND ACCOUNT CONTRIBUTIONS
- One of the reasons for the growth in general annual deductibles has been the growth in enrollment in HDHP/SOs, which have higher deductibles than other plans. While growing deductibles in other plan types generally increases enrollee out-of-pocket liability, the shift in enrollment to HDHP/SOs does not necessarily do so because many HDHP/SO enrollees receive an account contribution from their employers, which in essence reduces the high cost sharing in these plans.
- Ten percent of covered workers in an HDHP with an HRA and 3% of covered workers in an HSA-qualified HDHP receive an account contribution from their employer for single coverage at least equal to their deductible, while another 41% of covered workers in an HDHP with an HRA and 19% of covered workers in an HSA-qualified HDHP receive account contributions that, if applied to their deductible, would reduce the deductible to $1,000 or less [Figure 7.17].
- If we reduce the general annual deductibles by employer account contributions, the percentage of covered workers with a deductible of $1,000 or more would be reduced from 57% to 47% [Figure 7.13] and [Figure 7.14].
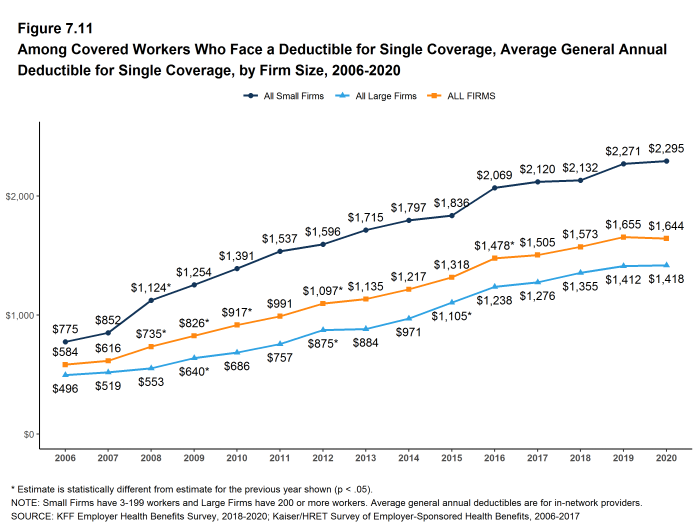
Figure 7.11: Among Covered Workers Who Face a Deductible for Single Coverage, Average General Annual Deductible for Single Coverage, by Firm Size, 2006-2020
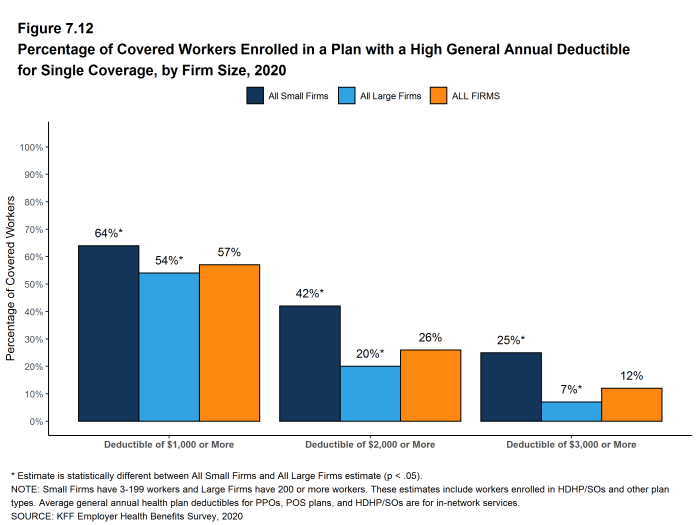
Figure 7.12: Percentage of Covered Workers Enrolled in a Plan With a High General Annual Deductible for Single Coverage, by Firm Size, 2020
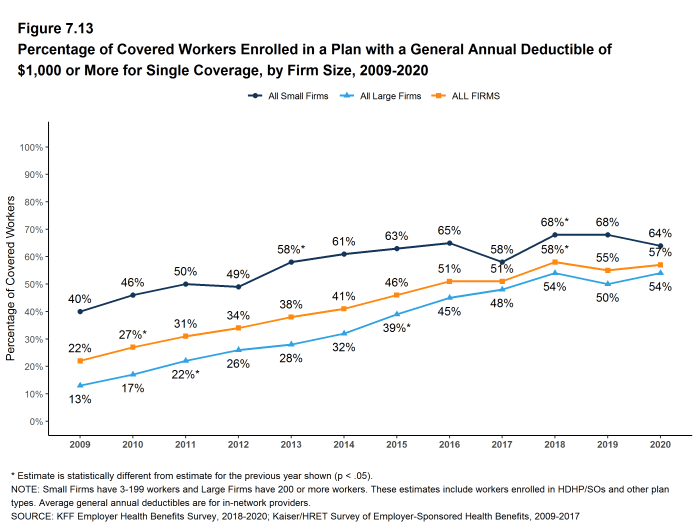
Figure 7.13: Percentage of Covered Workers Enrolled in a Plan With a General Annual Deductible of $1,000 or More for Single Coverage, by Firm Size, 2009-2020
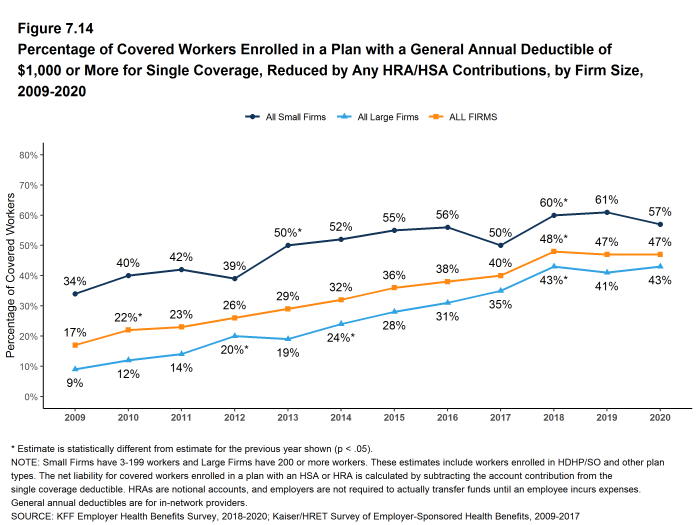
Figure 7.14: Percentage of Covered Workers Enrolled in a Plan With a General Annual Deductible of $1,000 or More for Single Coverage, Reduced by Any HRA/HSA Contributions, by Firm Size, 2009-2020

Figure 7.15: Percentage of Covered Workers Enrolled in a Plan With a General Annual Deductible of $2,000 or More for Single Coverage, by Firm Size, 2009-2020
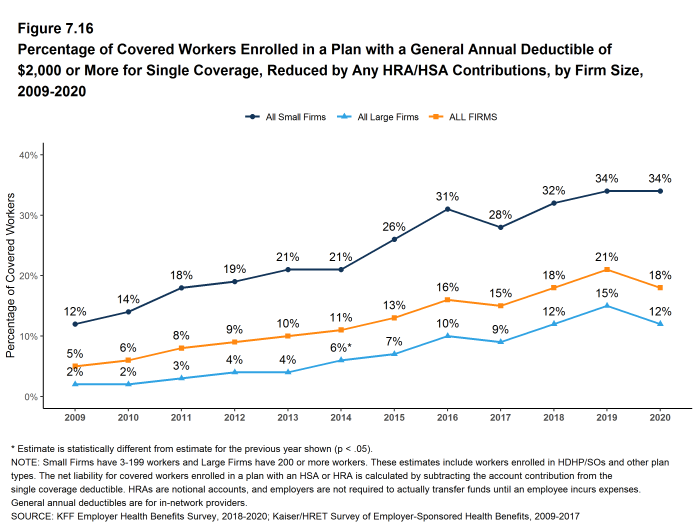
Figure 7.16: Percentage of Covered Workers Enrolled in a Plan With a General Annual Deductible of $2,000 or More for Single Coverage, Reduced by Any HRA/HSA Contributions, by Firm Size, 2009-2020
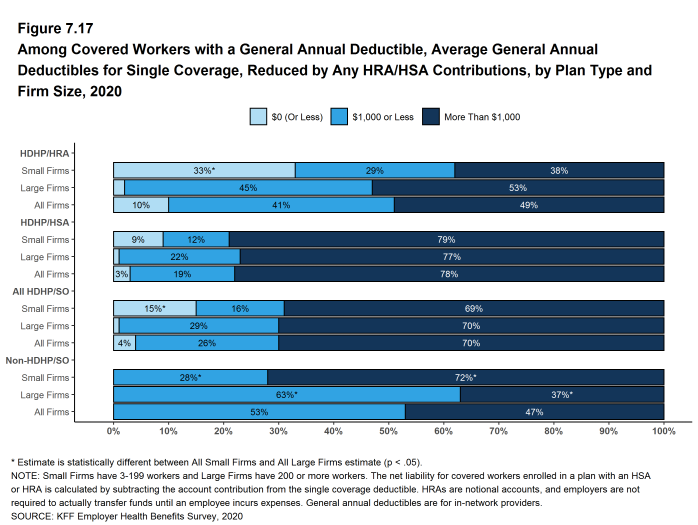
Figure 7.17: Among Covered Workers With a General Annual Deductible, Average General Annual Deductibles for Single Coverage, Reduced by Any HRA/HSA Contributions, by Plan Type and Firm Size, 2020
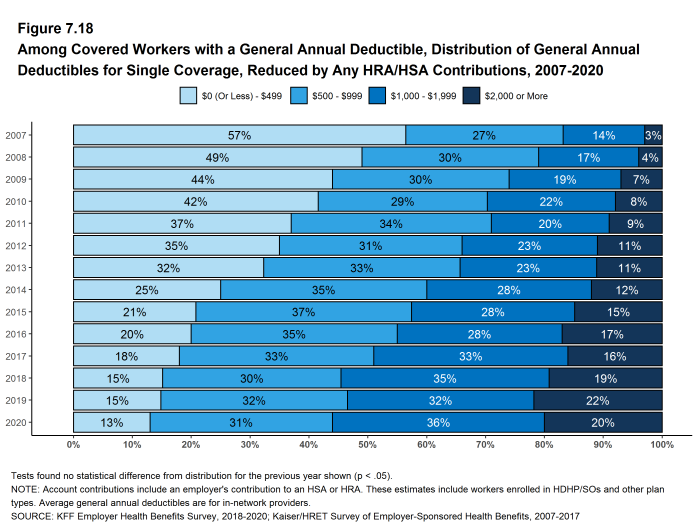
Figure 7.18: Among Covered Workers With a General Annual Deductible, Distribution of General Annual Deductibles for Single Coverage, Reduced by Any HRA/HSA Contributions, 2007-2020
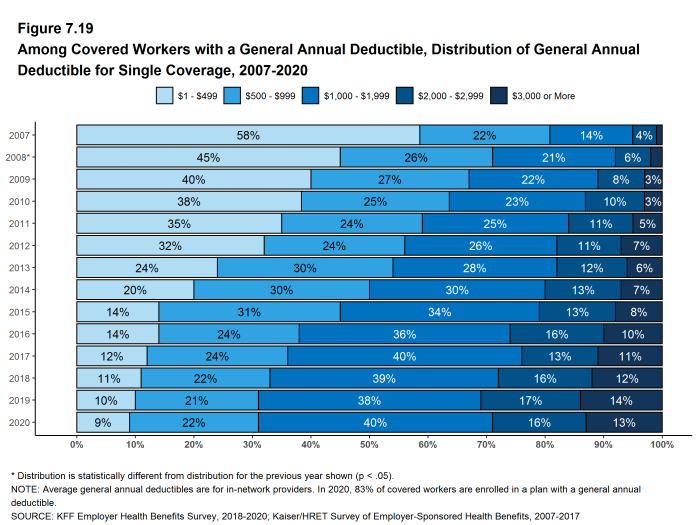
Figure 7.19: Among Covered Workers With a General Annual Deductible, Distribution of General Annual Deductible for Single Coverage, 2007-2020
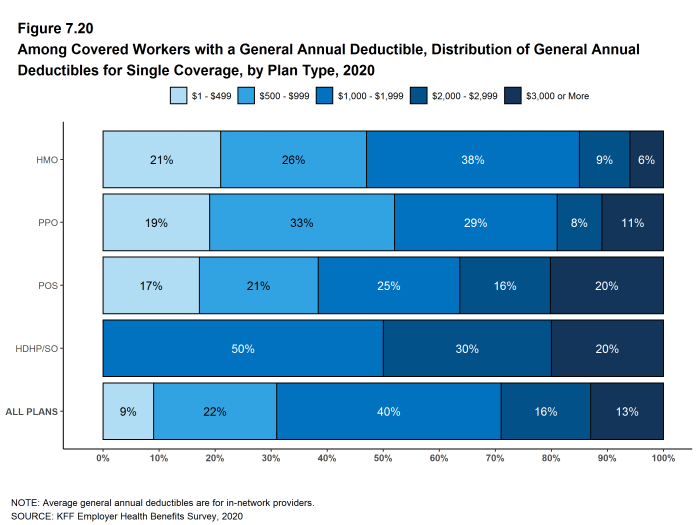
Figure 7.20: Among Covered Workers With a General Annual Deductible, Distribution of General Annual Deductibles for Single Coverage, by Plan Type, 2020
GENERAL ANNUAL DEDUCTIBLES FOR WORKERS ENROLLED IN FAMILY COVERGE
General annual deductibles for family coverage are structured in two primary ways: (1) with an aggregate family deductible, the out-of-pocket expenses of all family members count against a specified family deductible amount, and the deductible is considered met when the combined family expenses exceed the deductible amount; (2) with a separate per-person family deductible, each family member is subject to a specified deductible amount before the plan covers expenses for that member, although many plans consider the deductible for all family members met once a specified number (typically two or three) of family members meet their specified deductible amount.20
- About one-half (52%) of covered workers in HMOs are in plans without a general annual deductible for family coverage; the percentages in plans without family dedictibles are lower for workers in PPOs (18%) and POS plans (24%). As defined, all covered workers in HDHP/SOs have a general annual deductible for family coverage [Figure 7.21].
- Among covered workers enrolled in family coverage, the percentages of covered workers in a plan with an aggregate general annual deductible are 32% for workers in HMOs; 57% for workers in PPOs; 64% for workers in POS plans; and 83% for workers in HDHP/SOs [Figure 7.21].
- The average deductible amounts for covered workers in plans with an aggregate annual deductible for family coverage are $3,035 for HMOs; $2,716 for PPOs; $3,902 for POS plans; and $4,552 for HDHP/SOs [Figure 7.22]. Deductible amounts for aggregate family deductibles are similar to last year for each plan type.
- For covered workers in plans with an aggregate deductible for family coverage, the average annual family deductibles in small firms are higher than the average annual family deductibles in large firms for covered workers in HMOs, PPOs and HDHP/SOs [Figure 7.22].
- Among covered workers enrolled in family coverage, the percentages of covered workers in plans with a separate per-person annual deductible for family coverage are 17% for workers in HMOs; 25% for workers in PPOs; 12% for workers in POS plans; and 17% for workers in HDHP/SOs [Figure 7.21].
- The average deductible amounts for covered workers in plans with separate per-person annual deductibles for family coverage are $1,115 for PPOs and $2,523 for HDHP/SOs [Figure 7.22].
- Forty percent covered workers in plans with a separate per-person annual deductible for family coverage have a limit for the number of family members required to meet the separate deductible amounts [Figure 7.25]. Among those covered workers in plans with a limit on the number of family members, the most frequent number of family members required to meet the separate per-person deductible is two [Figure 7.26].
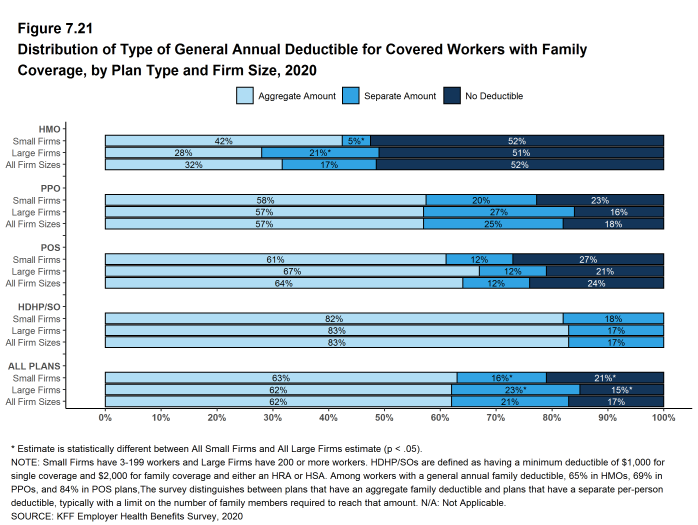
Figure 7.21: Distribution of Type of General Annual Deductible for Covered Workers With Family Coverage, by Plan Type and Firm Size, 2020
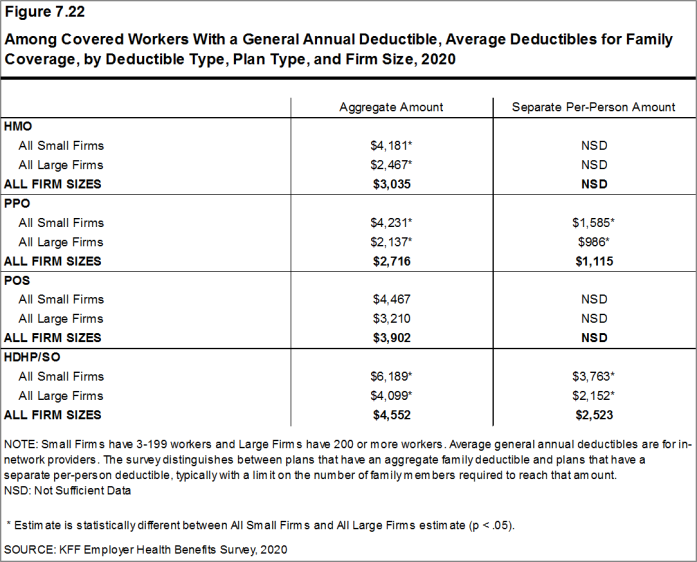
Figure 7.22: Among Covered Workers With a General Annual Deductible, Average Deductibles for Family Coverage, by Deductible Type, Plan Type, and Firm Size, 2020
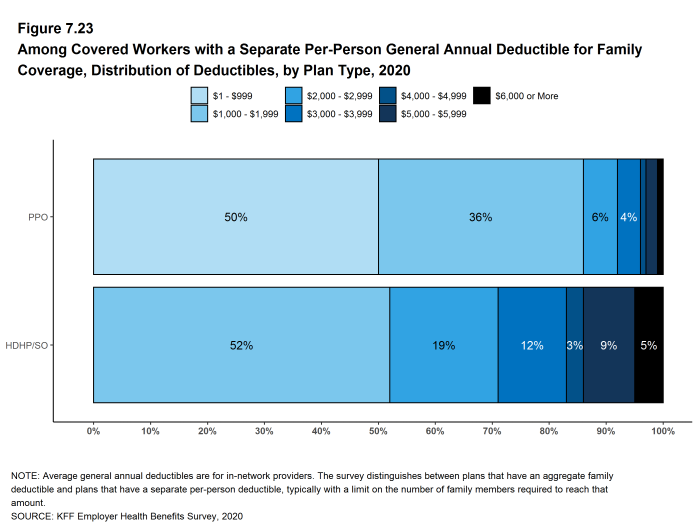
Figure 7.23: Among Covered Workers With a Separate Per-Person General Annual Deductible for Family Coverage, Distribution of Deductibles, by Plan Type, 2020
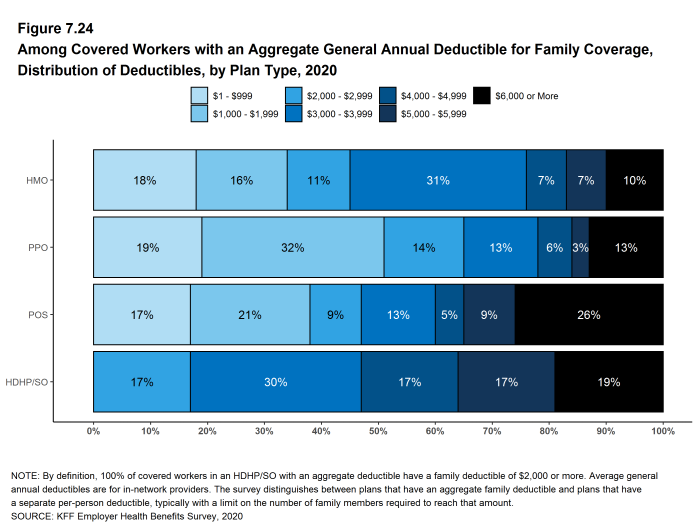
Figure 7.24: Among Covered Workers With an Aggregate General Annual Deductible for Family Coverage, Distribution of Deductibles, by Plan Type, 2020
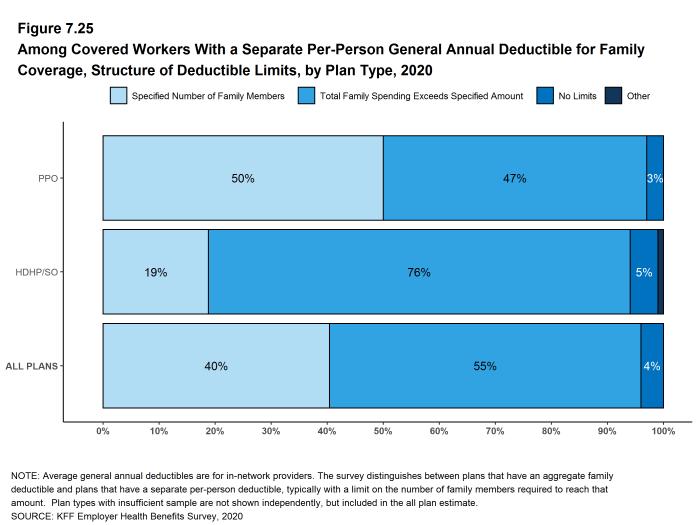
Figure 7.25: Among Covered Workers With a Separate Per-Person General Annual Deductible for Family Coverage, Structure of Deductible Limits, by Plan Type, 2020
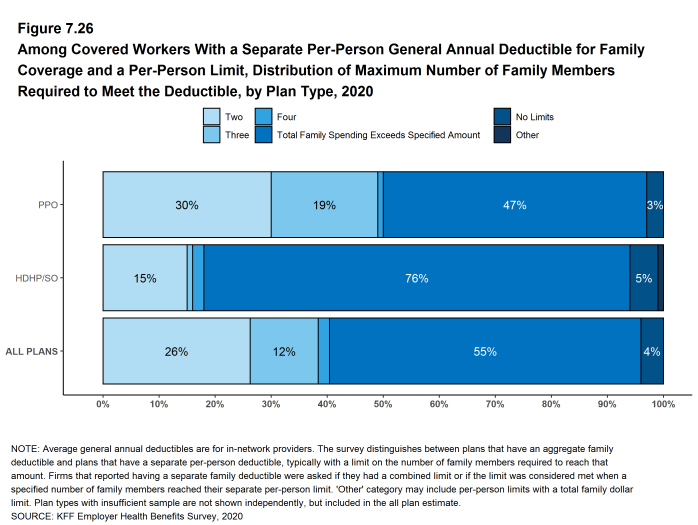
Figure 7.26: Among Covered Workers With a Separate Per-Person General Annual Deductible for Family Coverage and a Per-Person Limit, Distribution of Maximum Number of Family Members Required to Meet the Deductible, by Plan Type, 2020
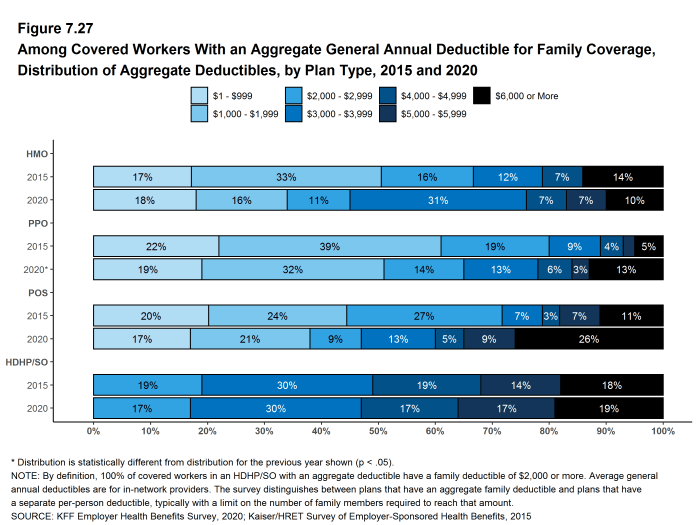
Figure 7.27: Among Covered Workers With an Aggregate General Annual Deductible for Family Coverage, Distribution of Aggregate Deductibles, by Plan Type, 2015 and 2020
CHARACTERISTICS OF GENERAL ANNUAL DEDUCTIBLES
- The majority of covered workers with a general annual deductible are in plans where the deductible does not have to be met before certain services, such as physician office visits or prescription drugs, are covered.
- Majorities of covered workers (84% in HMOs, 72% in PPOs, 66% in POS plans, and 58% in HDHP/HRAs) who are enrolled in plans with general annual deductibles are in plans where the deductible does not have to be met before physician office visits for primary care are covered [Figure 7.28].
- Similarly, among workers with a general annual deductible, large shares of covered workers in HMOs (87%), PPOs (86%), POS plans (85%), and HDHP/HRAs (82%) are enrolled in plans where the general annual deductible does not have to be met before prescription drugs are covered [Figure 7.28].
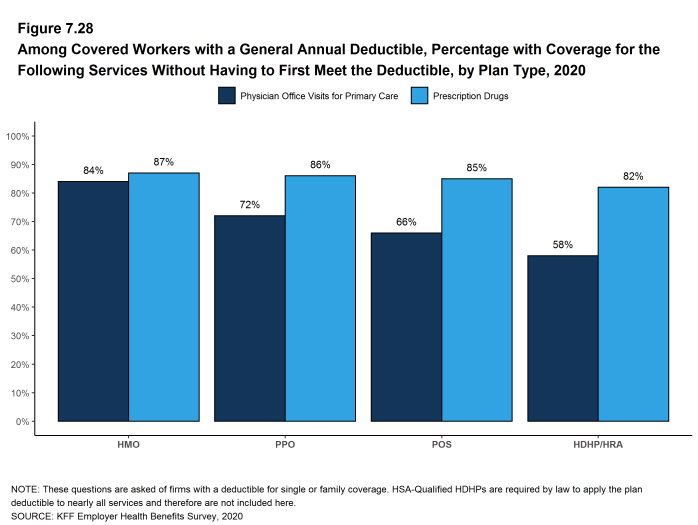
Figure 7.28: Among Covered Workers With a General Annual Deductible, Percentage With Coverage for the Following Services Without Having to First Meet the Deductible, by Plan Type, 2020
HOSPITAL ADMISSIONS AND OUTPATIENT SURGERY
- Whether or not a worker has a general annual deductible, most workers face additional types of cost sharing (such as a copayment, coinsurance, or a per diem charge) when admitted to a hospital or having outpatient surgery. The distribution of workers with cost sharing for hospital admissions or outpatient surgery does not equal 100%, as workers may face a complex combination of types of cost sharing. For this reason, the average copayment and coinsurance rates include workers who may have a combination of these types of cost sharing.
- Beginning in 2017, to reduce the burden on respondents, we revised the survey to ask about cost sharing for hospital admissions and outpatient surgery only for their largest health plan type; previously, we asked for this information for each of the plan types that they offered.
- In addition to any general annual deductible that may apply, 65% of covered workers have coinsurance and 13% have a copayment that apply to inpatient hospital admissions. Lower percentages of workers have per day (per diem) payments (7%), a separate hospital deductible (1%), or both a copayment and coinsurance (8%), while 16% have no additional cost sharing for hospital admissions after any general annual deductible has been met [Figure 7.29].
- For covered workers in HMOs, copayments are more common (33%) and coinsurance (43%) is less common than the average for all covered workers [Figure 7.29].
- HDHP/SOs, on average, have a different cost-sharing structure than other plan types for hospital admissions. Only 3% of covered workers in HDHP/SOs have a copayment for hospital admissions, lower than the average for all covered workers [Figure 7.29].
- The average coinsurance rate for a hospital admission is 20%, the average copayment is $311 per hospital admission, and the average per diem charge is $313 [Figure 7.32]. Sixty-six percent of workers enrolled in a plan with a per diem for hospital admissions have a limit on the number of days a worker must pay the amount [Figure 7.33].
- The cost-sharing provisions for outpatient surgery are similar to those for hospital admissions, as most workers have coinsurance or copayments. In 2020, 15% of covered workers have a copayment and 68% have coinsurance for outpatient surgery. In addition, 6% have both a copayment and coinsurance, while 16% have no additional cost sharing after any general annual deductible has been met [Figure 7.30] and [Figure 7.31].
- For covered workers with cost sharing for outpatient surgery, the average coinsurance rate is 20% and the average copayment is $188 [Figure 7.32].
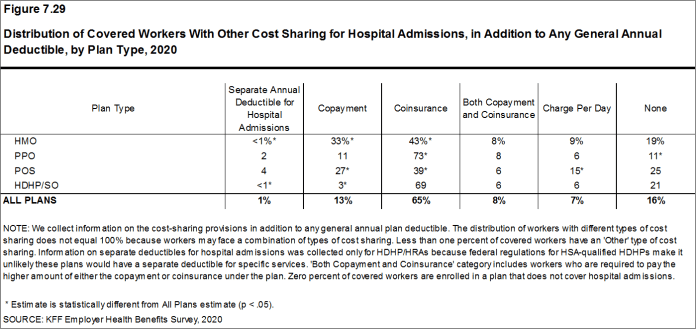
Figure 7.29: Distribution of Covered Workers With Other Cost Sharing for Hospital Admissions, in Addition to Any General Annual Deductible, by Plan Type, 2020

Figure 7.30: Distribution of Covered Workers With Other Cost Sharing for Outpatient Surgery, in Addition to Any General Annual Deductible, by Plan Type, 2020

Figure 7.31: Percentage of Covered Workers With the Following Types of Cost Sharing for Hospital Admissions and Outpatient Surgery, in Addition to Any General Annual Deductible, 2020
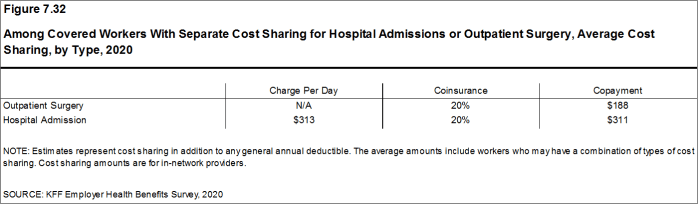
Figure 7.32: Among Covered Workers With Separate Cost Sharing for Hospital Admissions or Outpatient Surgery, Average Cost Sharing, by Type, 2020
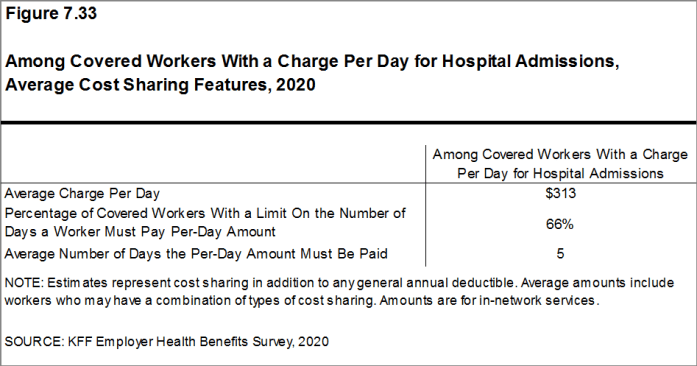
Figure 7.33: Among Covered Workers With a Charge Per Day for Hospital Admissions, Average Cost Sharing Features, 2020
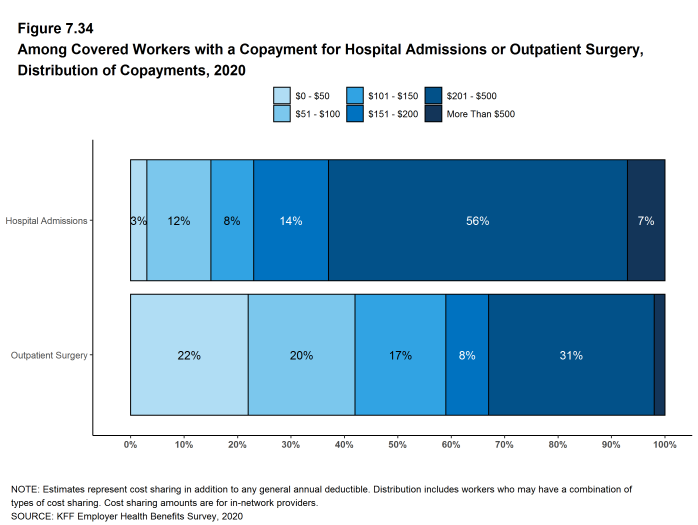
Figure 7.34: Among Covered Workers With a Copayment for Hospital Admissions or Outpatient Surgery, Distribution of Copayments, 2020
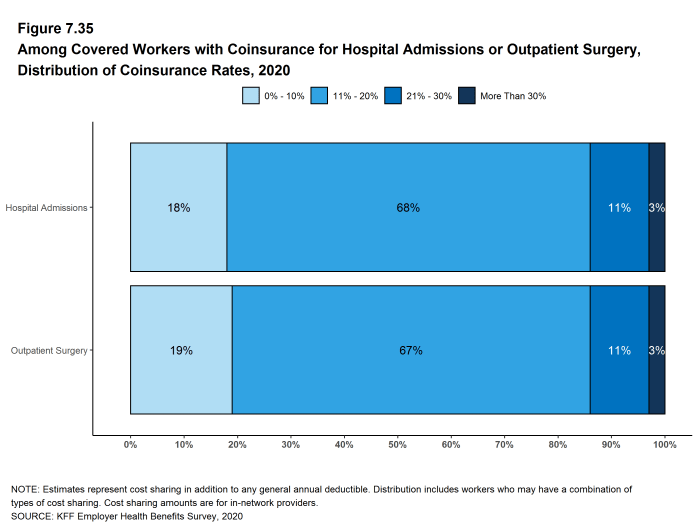
Figure 7.35: Among Covered Workers With Coinsurance for Hospital Admissions or Outpatient Surgery, Distribution of Coinsurance Rates, 2020
COST SHARING FOR PHYSICIAN OFFICE VISITS
- The majority of covered workers are enrolled in health plans that require cost sharing for an in-network physician office visit, in addition to any general annual deductible.21
- The most common form of physician office visit cost sharing for in-network services is a copayment. Sixty-six percent of covered workers have a copayment for a primary care physician office visit and 23% have coinsurance. For office visits with a specialty physician, 63% of covered workers have a copayment and 27% have coinsurance [Figure 7.36].
- Covered workers in HMOs, PPOs, and POS plans are much more likely to have copayments for both primary care and specialty care physician office visits than workers in HDHP/SOs. For primary care physician office visits, 16% of covered workers in HDHP/SOs have a copayment, 62% have coinsurance, and 15% have no cost sharing after the general annual plan deductible is met [Figure 7.36].
- Among covered workers with a copayment for in-network physician office visits, the average copayment is $26 for primary care and $42 for specialty physician office visits [Figure 7.37], similar to the amounts last year.
- Among covered workers with coinsurance for in-network physician office visits, the average coinsurance rates are 18% for a visit with a primary care physician and 19% for a visit with a specialist [Figure 7.37], similar to the rates last year.
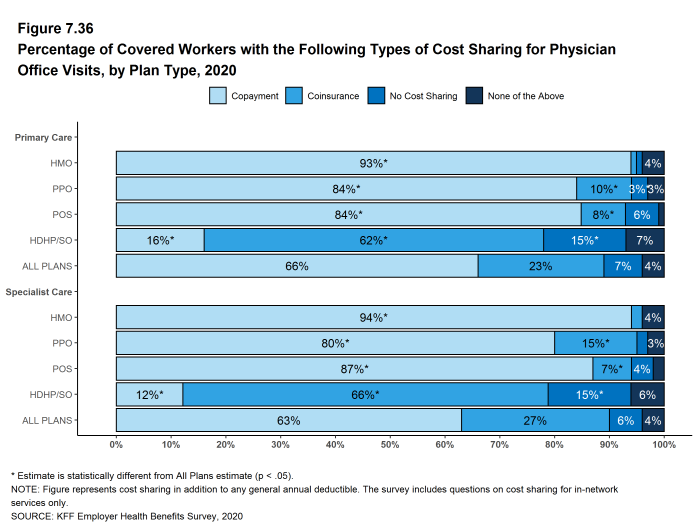
Figure 7.36: Percentage of Covered Workers With the Following Types of Cost Sharing for Physician Office Visits, by Plan Type, 2020
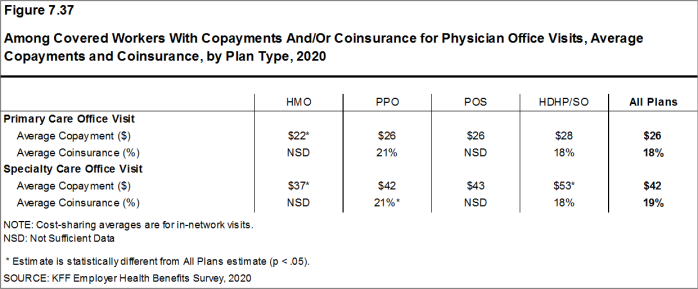
Figure 7.37: Among Covered Workers With Copayments And/Or Coinsurance for Physician Office Visits, Average Copayments and Coinsurance, by Plan Type, 2020
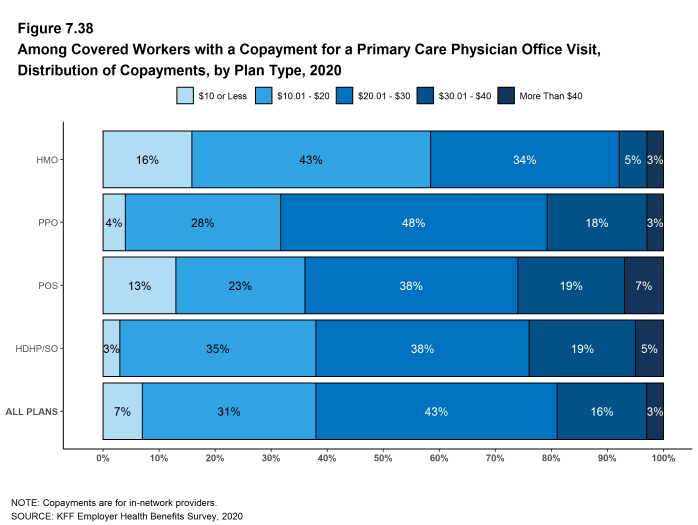
Figure 7.38: Among Covered Workers With a Copayment for a Primary Care Physician Office Visit, Distribution of Copayments, by Plan Type, 2020
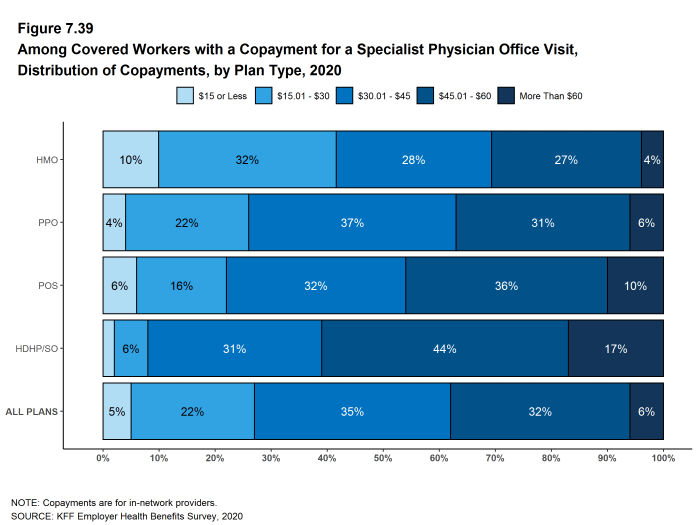
Figure 7.39: Among Covered Workers With a Copayment for a Specialist Physician Office Visit, Distribution of Copayments, by Plan Type, 2020
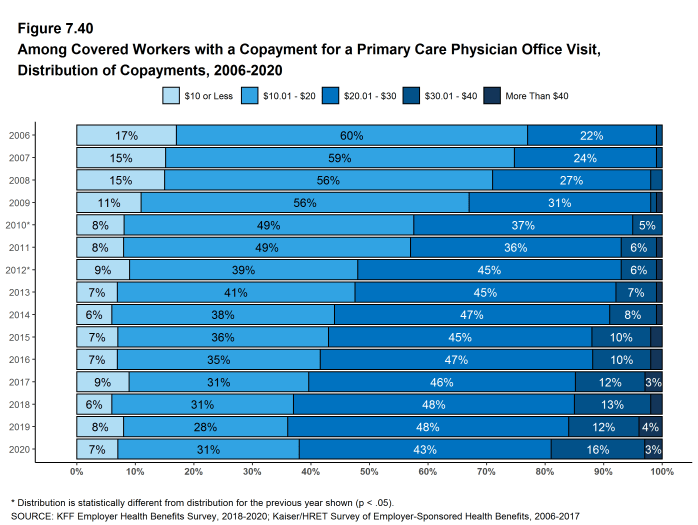
Figure 7.40: Among Covered Workers With a Copayment for a Primary Care Physician Office Visit, Distribution of Copayments, 2006-2020
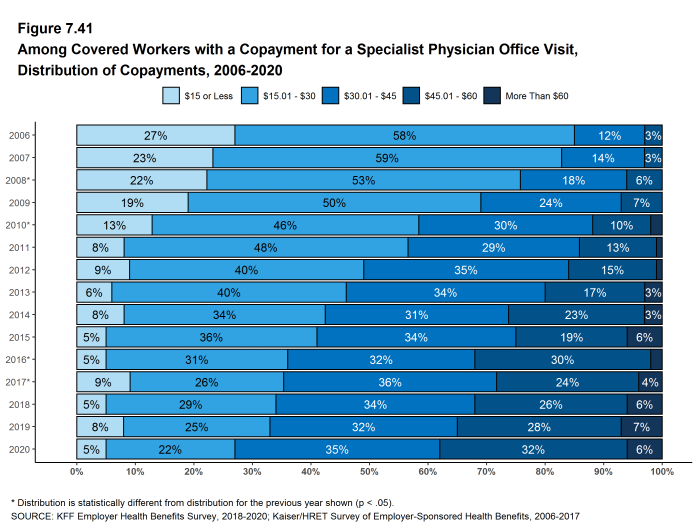
Figure 7.41: Among Covered Workers With a Copayment for a Specialist Physician Office Visit, Distribution of Copayments, 2006-2020
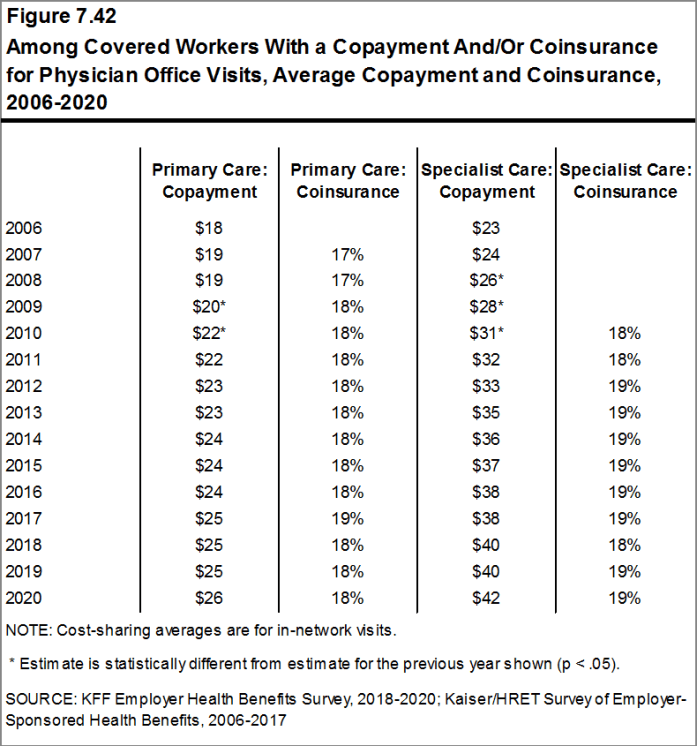
Figure 7.42: Among Covered Workers With a Copayment And/Or Coinsurance for Physician Office Visits, Average Copayment and Coinsurance, 2006-2020
OUT-OF-POCKET MAXIMUMS
- Most covered workers are in a plan that partially or totally limits the cost sharing that an enrollee must pay in a year. This limit is generally referred to as an out-of-pocket maximum. The Affordable Care Act (ACA) requires that non-grandfathered health plans have an out-of-pocket maximum of no more than $8,150 for single coverage and $16,300 for family coverage in 2020. Out-of-pocket limits in HSA qualified HDHP/SOs are required to be somewhat lower.22 Many plans have complex out-of-pocket structures, which makes it difficult to accurately collect information on this element of plan design.
- In 2020, 100% of covered workers are in a plan with an out-of-pocket maximum for single coverage. This is a significant increase from 98% in 2015 [Figure 7.43].
- For covered workers in plans with an out-of-pocket maximum for single coverage, there is wide variation in spending limits.
- Eleven percent of covered workers in plans with an out-of-pocket maximum for single coverage have an out-of-pocket maximum of less than $2,000, while 18% have an out-of-pocket maximum of $6,000 or more [Figure 7.45].
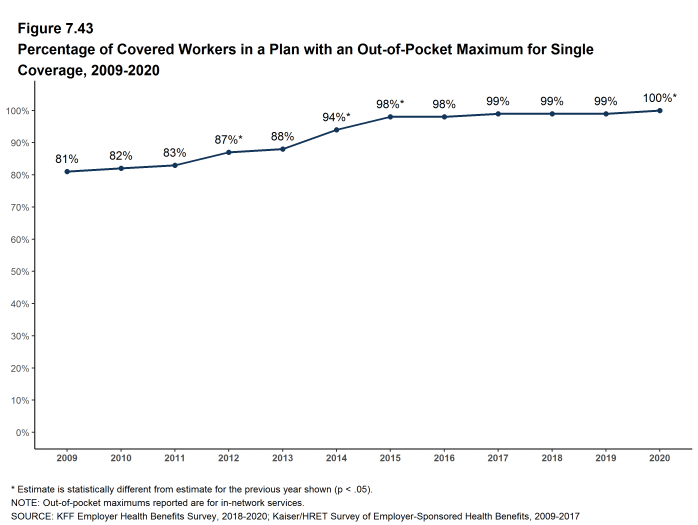
Figure 7.43: Percentage of Covered Workers in a Plan With an Out-Of-Pocket Maximum for Single Coverage, 2009-2020
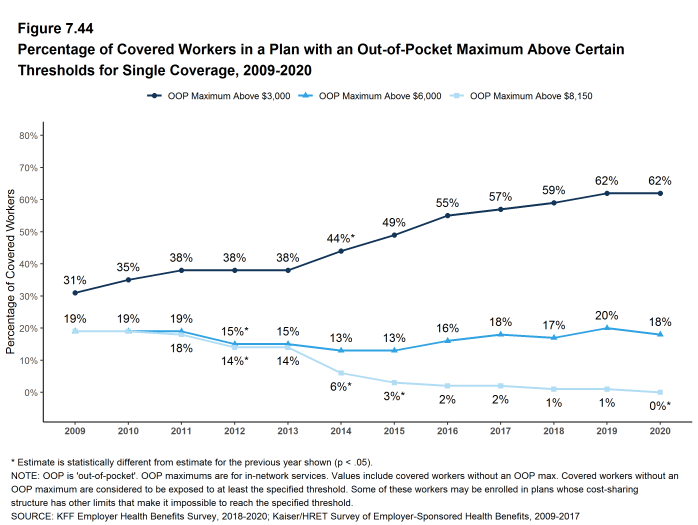
Figure 7.44: Percentage of Covered Workers in a Plan With an Out-Of-Pocket Maximum Above Certain Thresholds for Single Coverage, 2009-2020
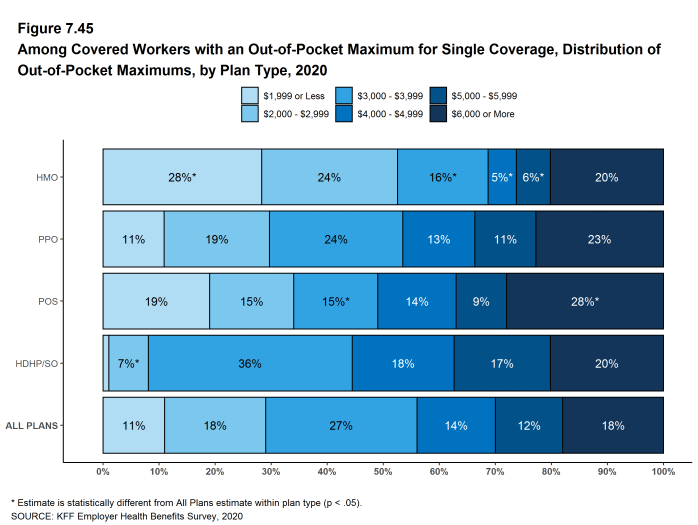
Figure 7.45: Among Covered Workers With an Out-Of-Pocket Maximum for Single Coverage, Distribution of Out-Of-Pocket Maximums, by Plan Type, 2020
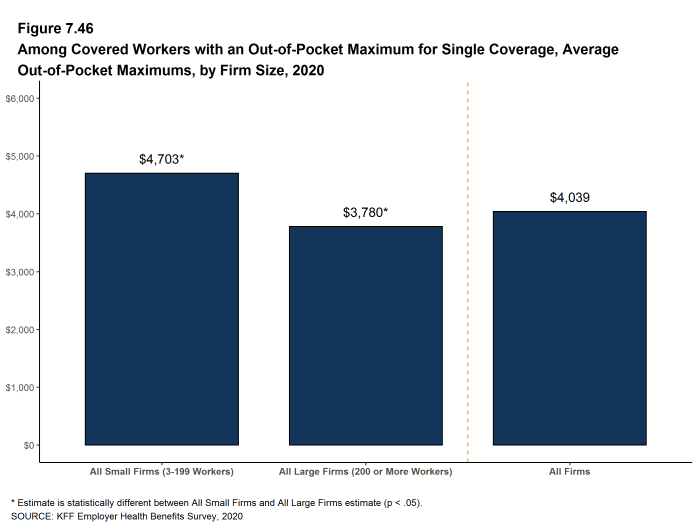
Figure 7.46: Among Covered Workers With an Out-Of-Pocket Maximum for Single Coverage, Average Out-Of-Pocket Maximums, by Firm Size, 2020
- Some workers with separate per-person deductibles or out-of-pocket maximums for family coverage do not have a specific number of family members that are required to meet the deductible amount and instead have another type of limit, such as a per-person amount with a total dollar amount limit. These responses are included in the averages and distributions for separate family deductibles and out-of-pocket maximums.↩︎
- For those enrolled in an HDHP/HSA, the out-of-pocket maximum may be no more than $6,900 for an individual plan and $13,800 for a family plan in 2020. See https://www.irs.gov/irb/2019-22_IRB#REV-PROC-2019-25↩︎
- Starting in 2010, the survey asked about the prevalence and cost of physician office visits separately for primary care and specialty care. Prior to the 2010 survey, if the respondent indicated the plan had a copayment for office visits, we assumed the plan had a copayment for both primary and specialty care visits. The survey did not allow for a respondent to report that a plan had a copayment for primary care visits and coinsurance for visits with a specialist physician. The changes made in 2010 allow for variations in the type of cost sharing for primary care and specialty care visits. The survey includes cost sharing for in-network services only.↩︎
High-deductible Health Plans with Savings Option
To help cover out-of-pocket expenses not covered by a health plan, some firms offer high-deductible plans that are paired with an account that allows enrollees to use tax-preferred funds to pay plan cost sharing and other out-of-pocket medical expenses. The two most common types are health reimbursement arrangements (HRAs) and health savings accounts (HSAs). HRAs and HSAs are financial accounts that workers or their family members can use to pay for health care services. These savings arrangements are often (or, in the case of HSAs, always) paired with health plans with high deductibles. The survey treats high-deductible plans paired with a savings option as a distinct plan type – High-Deductible Health Plan with Savings Option (HDHP/SO) – even if the plan would otherwise be considered a PPO, HMO, POS plan, or conventional health plan. Specifically for the survey, HDHP/SOs are defined as (1) health plans with a deductible of at least $1,000 for single coverage and $2,000 for family coverage23 offered with an HRA (referred to as HDHP/HRAs); or (2) high-deductible health plans that meet the federal legal requirements to permit an enrollee to establish and contribute to an HSA (referred to as HSA-qualified HDHPs).24
PERCENTAGE OF FIRMS OFFERING HDHP/HRAS AND HSA-QUALIFIED HDHPS
- Twenty-six percent of firms offering health benefits offer an HDHP/HRA, an HSA-qualified HDHP, or both. Among firms offering health benefits, 8% offer an HDHP/HRA and 20% offer an HSA-qualified HDHP [Figure 8.1]. The percentage of firms offering an HDHP/SO is similar to last year.
- Large firms (200 or more workers) are more much likely than small firms (3-199 workers) to offer an HDHP/SO (56% vs. 25%) [Figure 8.3].
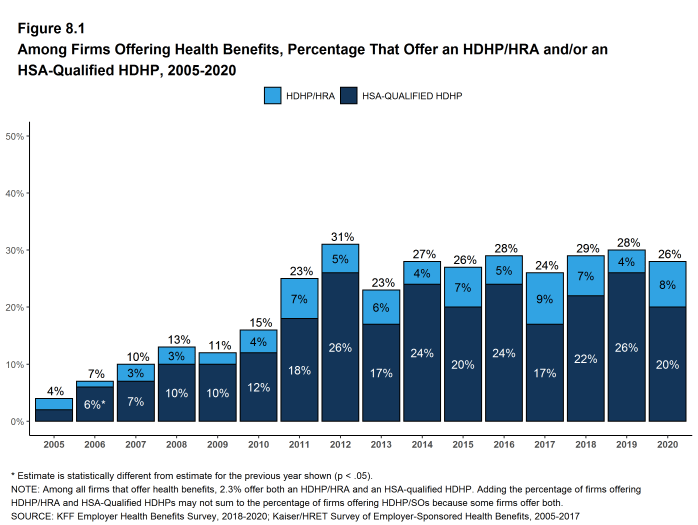
Figure 8.1: Among Firms Offering Health Benefits, Percentage That Offer an HDHP/HRA And/Or an HSA-Qualified HDHP, 2005-2020
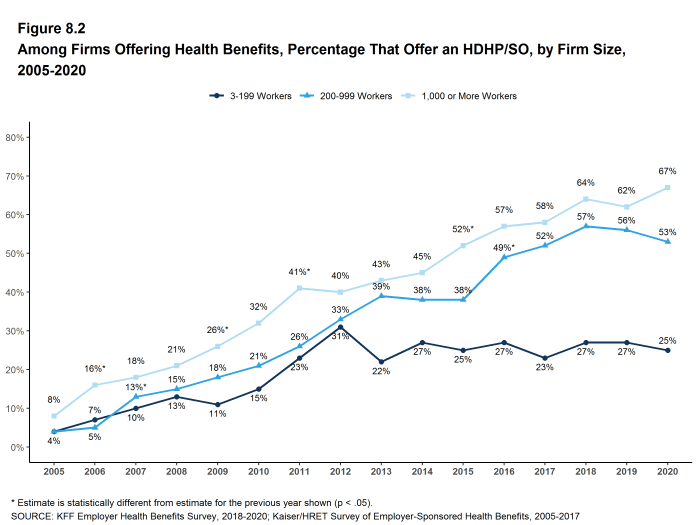
Figure 8.2: Among Firms Offering Health Benefits, Percentage That Offer an HDHP/SO, by Firm Size, 2005-2020
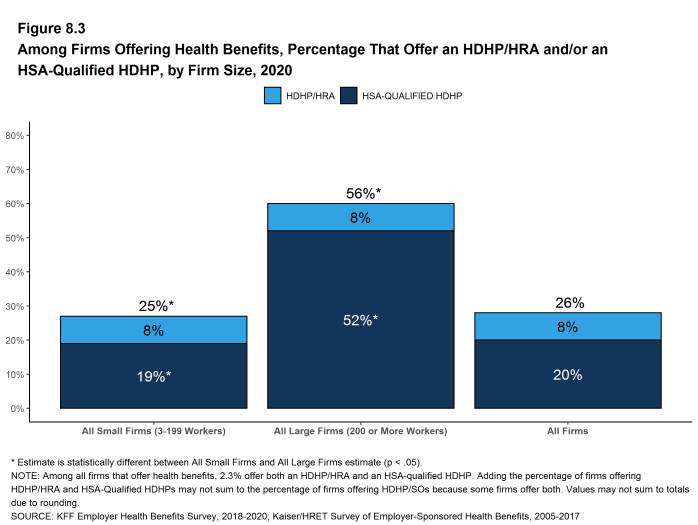
Figure 8.3: Among Firms Offering Health Benefits, Percentage That Offer an HDHP/HRA And/Or an HSA-Qualified HDHP, by Firm Size, 2020
ENROLLMENT IN HDHP/HRAS AND HSA-QUALIFIED HDHPS
- Thirty-one percent of covered workers are enrolled in an HDHP/SO in 2020, similar to the percentage last year (30%) [Figure 8.5].
- Enrollment in HDHP/SOs has increased over the past five years, from 24% of covered workers in 2015 to 31% in 2020 [Figure 8.5].
- Seven percent of covered workers are enrolled in HDHP/HRAs and 24% of covered workers are enrolled in HSA-qualified HDHPs in 2020. These percentages are similar to the percentages last year [Figure 8.5].
- The percentage of covered workers enrolled in HDHP/SOs is higher in large firms (33%) than in small firms (25%) [Figure 8.6].
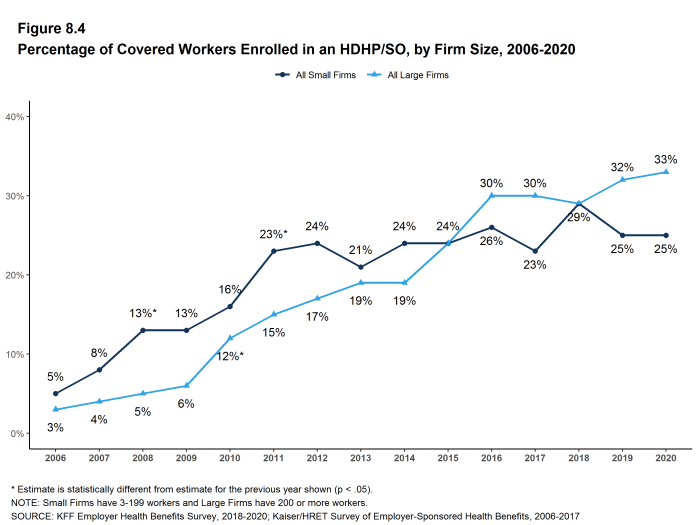
Figure 8.4: Percentage of Covered Workers Enrolled in an HDHP/SO, by Firm Size, 2006-2020
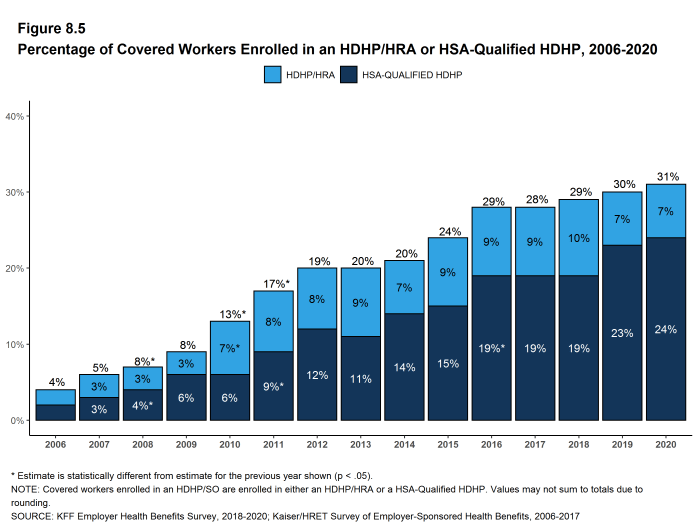
Figure 8.5: Percentage of Covered Workers Enrolled in an HDHP/HRA or HSA-Qualified HDHP, 2006-2020
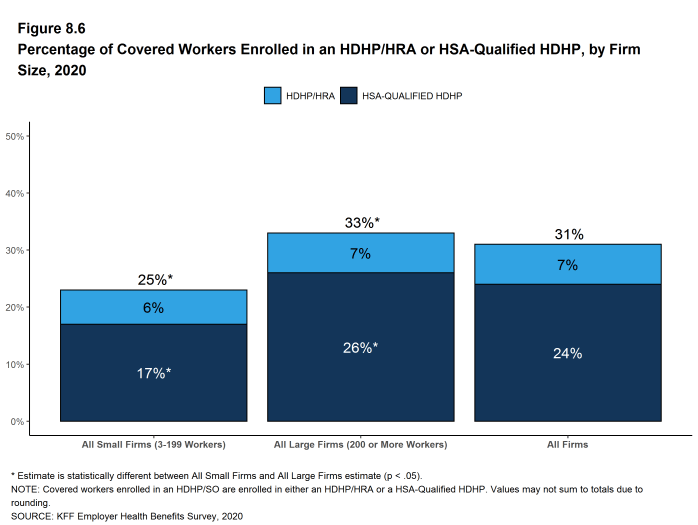
Figure 8.6: Percentage of Covered Workers Enrolled in an HDHP/HRA or HSA-Qualified HDHP, by Firm Size, 2020
PREMIUMS AND WORKER CONTRIBUTIONS
- In 2020, the average annual premiums for covered workers in HDHP/HRAs are $7,464 for single coverage and $22,643 for family coverage [Figure 8.7].
- The average annual premiums for workers in HSA-qualified HDHPs are $6,737 for single coverage and $19,819 for family coverage. These amounts are significantly less than the average single and family premium for covered workers in plans that are not HDHP/SOs [Figure 8.8].
- The average premium for single coverage for covered workers enrolled in HSA-qualified HDHPs is lower than the average premium for single coverage for covered workers enrolled in HDHP/HRAs.
- The average annual worker contributions to premiums for workers enrolled in HDHP/HRAs are $1,221 for single coverage and $5,480 for family coverage [Figure 8.7]. The average contribution for family coverage for covered workers in HDHP/HRAs are similar to the average premium contribution made by covered workers in plans that are not HDHP/SOs [Figure 8.8].
- The average annual worker contributions to premiums for workers in HSA-qualified HDHPs are $1,019 for single coverage and $4,742 for family coverage. The average contributions for single and family coverage for covered workers in HSA-qualified HDHPs are significantly less than the average premium contribution made by covered workers in plans that are not HDHP/SOs [Figure 8.8].
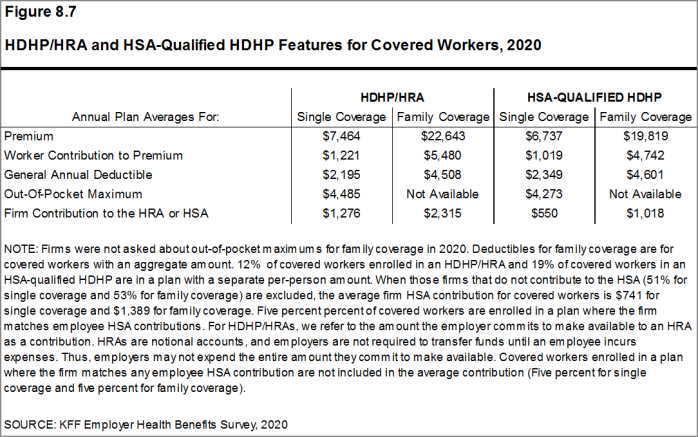
Figure 8.7: HDHP/HRA and HSA-Qualified HDHP Features for Covered Workers, 2020
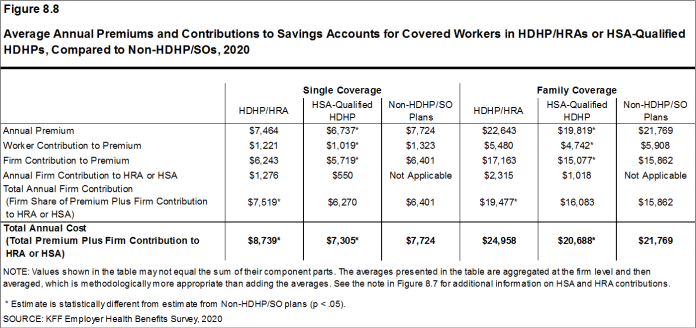
Figure 8.8: Average Annual Premiums and Contributions to Savings Accounts for Covered Workers in HDHP/HRAs or HSA-Qualified HDHPs, Compared to Non-HDHP/SOs, 2020
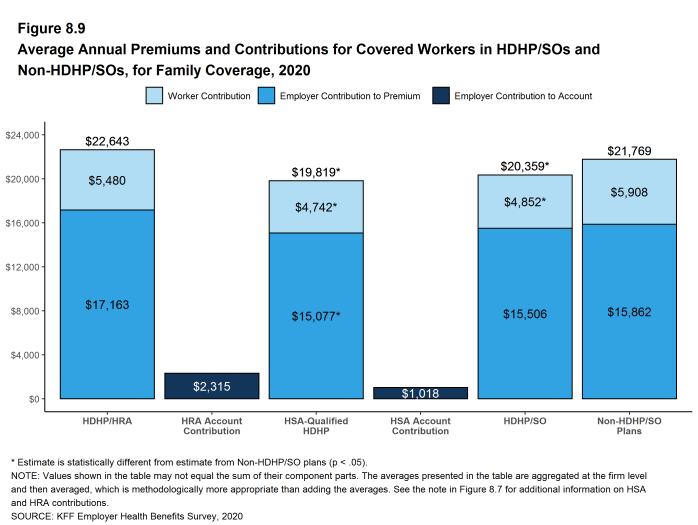
Figure 8.9: Average Annual Premiums and Contributions for Covered Workers in HDHP/SOs and Non-HDHP/SOs, for Family Coverage, 2020
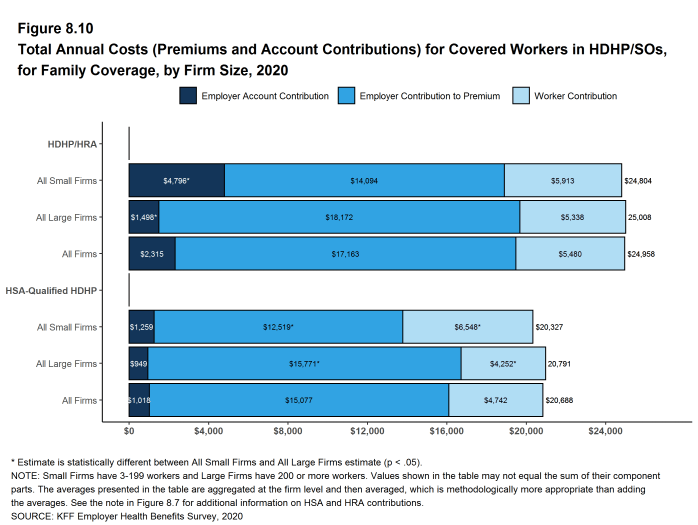
Figure 8.10: Total Annual Costs (Premiums and Account Contributions) for Covered Workers in HDHP/SOs, for Family Coverage, by Firm Size, 2020
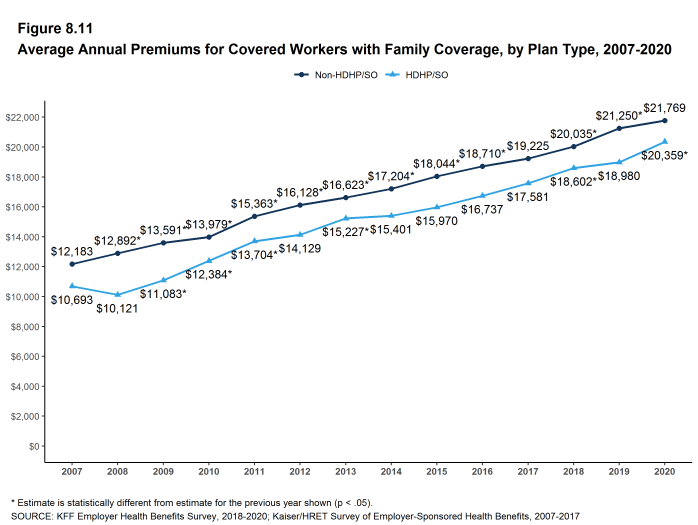
Figure 8.11: Average Annual Premiums for Covered Workers With Family Coverage, by Plan Type, 2007-2020
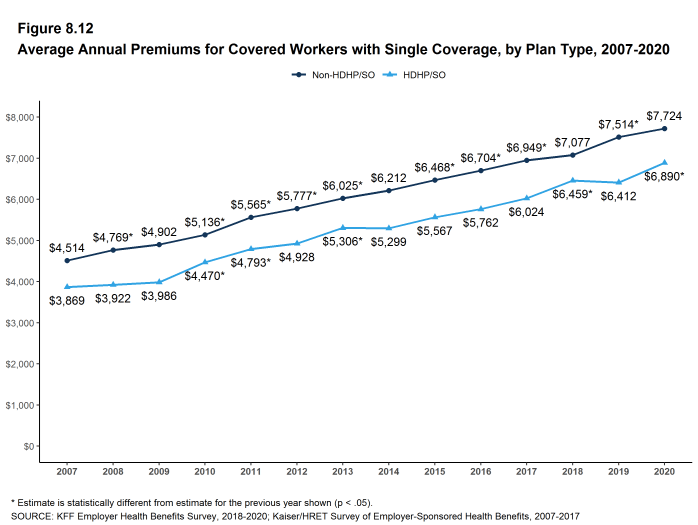
Figure 8.12: Average Annual Premiums for Covered Workers With Single Coverage, by Plan Type, 2007-2020
OUT-OF-POCKET MAXIMUMS AND PLAN DEDUCTIBLES
- HSA-qualified HDHPs are legally required to have an annual out-of-pocket maximum of no more than $6,900 for single coverage and $13,800 for family coverage in 2020. Non-grandfathered HDHP/HRA plans are required to have out-of-pocket maximums of no more than $8,150 for single coverage and $16,300 for family coverage in 2020.[^803] Virtually all HDHP/HRA plans have an out-of-pocket maximum for single coverage in 2020.
- The average annual out-of-pocket maximum for single coverage is $4,485 for HDHP/HRAs and $4,273 for HSA-qualified HDHPs [Figure 8.7].
- As expected, workers enrolled in HDHP/SOs have higher deductibles than workers enrolled in HMOs, PPOs, or POS plans.
- The average general annual deductible for single coverage is $2,195 for HDHP/HRAs and $2,349 for HSA-qualified HDHPs [Figure 8.14]. These averages are similar to the amounts reported in recent years. There is wide variation around these averages: 50% of covered workers enrolled in an HDHP/SO are in a plan with a deductible of $1,000 to $1,999 for single coverage while 20% are in a plan with a deductible of $3,000 or more [Figure 8.13].
- The survey asks firms whether the family deductible amount is (1) an aggregate amount (i.e., the out-of-pocket expenses of all family members are counted until the deductible is satisfied), or (2) a per-person amount that applies to each family member (typically with a limit on the number of family members that would be required to meet the deductible amount) (see Section 7 for more information).
- The average aggregate deductibles for workers with family coverage are $4,508 for HDHP/HRAs and $4,601 for HSA-qualified HDHPs [Figure 8.7]. As with single coverage, there is wide variation around these averages for family coverage: 17% of covered workers enrolled in HDHP/SOs with an aggregate family deductible have a deductible of $2,000 to $2,999 while 19% have a deductible of $6,000 dollars or more [Figure 8.16].
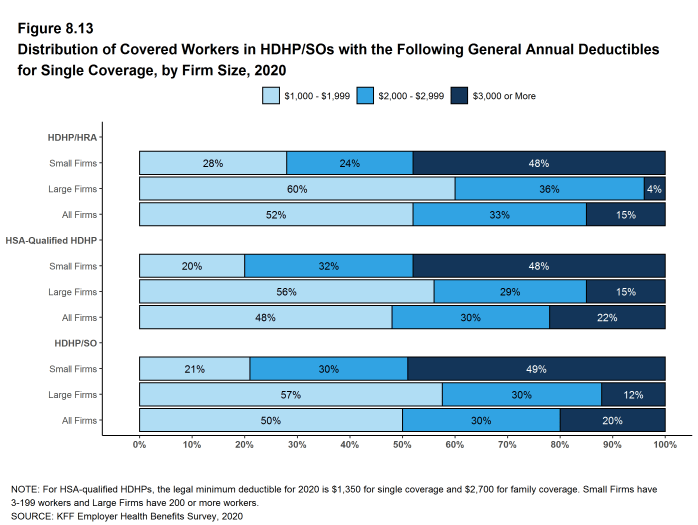
Figure 8.13: Distribution of Covered Workers in HDHP/SOs With the Following General Annual Deductibles for Single Coverage, by Firm Size, 2020
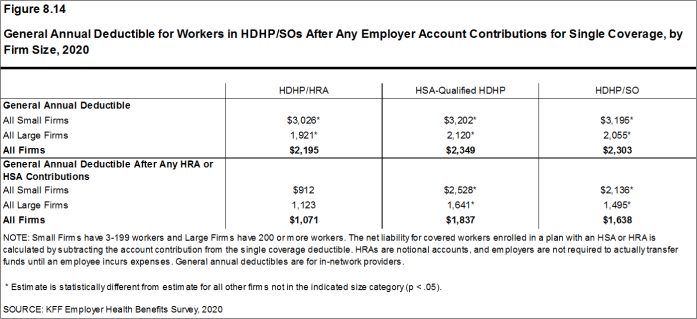
Figure 8.14: General Annual Deductible for Workers in HDHP/SOs After Any Employer Account Contributions for Single Coverage, by Firm Size, 2020
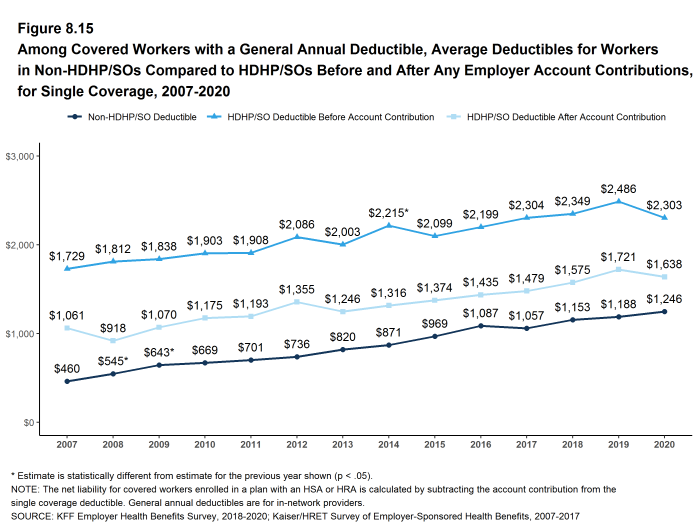
Figure 8.15: Among Covered Workers With a General Annual Deductible, Average Deductibles for Workers in Non-HDHP/SOs Compared to HDHP/SOs Before and After Any Employer Account Contributions, for Single Coverage, 2007-2020
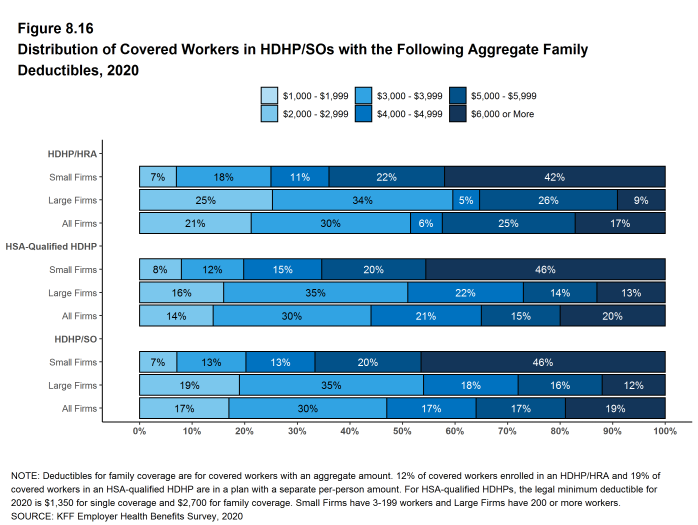
Figure 8.16: Distribution of Covered Workers in HDHP/SOs With the Following Aggregate Family Deductibles, 2020
EMPLOYER ACCOUNT CONTRIBUTIONS
- Employers contribute to HDHP/SOs in two ways: through their contributions toward the premium for the health plan and through their contributions (if any, in the case of HSAs) to the savings account option (i.e., the HRAs or HSAs themselves).
- Looking at only the annual employer contributions to premiums, covered workers in HDHP/HRAs on average receive employer contributions of $6,243 for single coverage and $17,163 for family coverage [Figure 8.8]. These amounts are similar to the contribution amounts last year.
- The average annual employer contributions to premiums for workers in HSA-qualified HDHPs are $5,719 for single coverage and $15,077 for family coverage. Both amounts are significantly higher than the contribution amounts last year. The average employer contributions for covered workers in HSA-qualified HDHPs for single coverage and family coverage are lower than the average contribution for covered workers in plans that are not HDHP/SOs [Figure 8.8].
- Looking at employer contributions to the savings options, covered workers enrolled in HDHP/HRAs on average receive an annual employer contribution to their HRA of $1,276 for single coverage and $2,315 for family coverage [Figure 8.8].
- HRAs are generally structured in such a way that employers may not actually spend the whole amount that they make available to their employees’ HRAs.25 Amounts committed to an employee’s HRA that are not used by the employee generally roll over and can be used in future years, but any balance may revert back to the employer if the employee leaves his or her job. Thus, the employer contribution amounts to HRAs that we capture in the survey may exceed the amount that employers will actually spend.
- Covered workers enrolled in HSA-qualified HDHPs on average receive an annual employer contribution to their HSA of $550 for single coverage and $1,018 for family coverage [Figure 8.8].
- In many cases, employers that sponsor HSA-qualified HDHP/SOs do not make contributions to HSAs established by their employees. Fifty-one percent of employers offering single coverage and 53% offering family coverage through HSA-qualified HDHPs do not make contributions toward the HSAs that their workers establish. Among covered workers enrolled in an HSA-qualified HDHP, 25% enrolled in single coverage and 25% enrolled in family coverage do not receive an account contribution from their employer [Figure 8.17] and [Figure 8.18].
- The average HSA contributions reported above include the portion of covered workers whose employer contribution to the HSA is zero. When those firms that do not contribute to the HSA are excluded from the calculation of the average amounts, the average employer contribution for covered workers is $741 for single coverage and $1,389 for family coverage.
- The percentages of covered workers enrolled in a plan where the employer makes no HSA contribution (25% for single coverage and 25% for family coverage) are similar to the percentages in recent years [Figure 8.17] and [Figure 8.18].
- There is considerable variation in the amount that employers contribute to savings accounts.
- Forty-seven percent of covered workers in an HDHP/HRA receive an annual HRA contribution of less than $800 for single coverage, while 18% receive an annual HRA contribution of $1,600 or more [Figure 8.17].
- Forty-one percent of covered workers in an HSA-qualified HDHP receive an annual HSA contribution of less than $400 for single coverage, including 25% that receive no HSA contribution from their employer [Figure 8.17]. In contrast, 11% of covered workers in an HSA-qualified HDHP receive an annual HSA contribution of $1,200 or more. Five percent of covered workers have an employer that matches any HSA contribution for single coverage.
- Employer contributions to savings account options (i.e., the HRAs and HSAs themselves) for their workers can be added to their health plan premium contributions to calculate total employer contributions toward HDHP/SOs. We note that HRAs are a promise by an employer to pay up to a specified amount and that many employees will not receive the full amount of their HRA in a year, so adding the employer premium contribution amount and the HRA contribution represents an upper bound for employer liability that overstates the amount that is actually expended. Since employer contributions to employee HSAs immediately transfer the full amount to the employee, adding employer premium and HSA contributions is an instructive way to look at their total liability under these plans.
- For HDHP/HRAs, the average annual total employer contribution for covered workers is $7,519 for single coverage and $19,477 for family coverage. The average total employer contributions for covered workers for single coverage and family coverage in HDHP/HRAs are higher than the average firm contributions toward single and family coverage in plans that are not HDHP/SOs [Figure 8.8].
- For HSA-qualified HDHPs, the average total annual firm contribution for covered workers is $6,270 for single coverage and $16,083 for workers with family coverage. The average total firm contribution amounts for single coverage and family coverage in HSA-qualified HDHPs are similar to the average firm contributions toward health plans that are not HDHP/SOs [Figure 8.8].
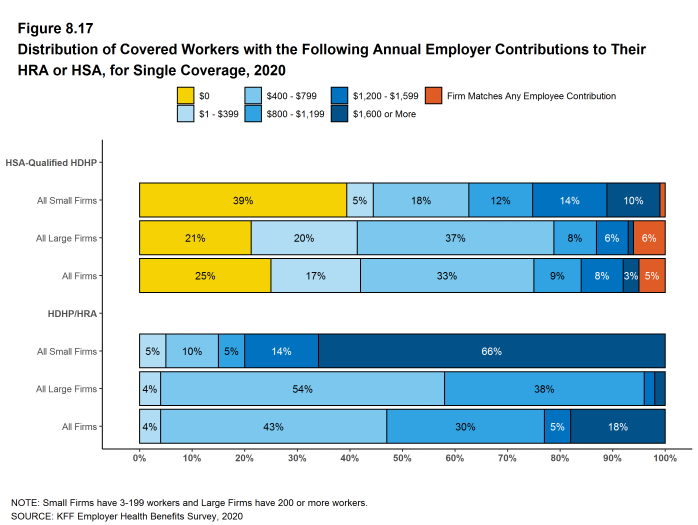
Figure 8.17: Distribution of Covered Workers With the Following Annual Employer Contributions to Their HRA or HSA, for Single Coverage, 2020
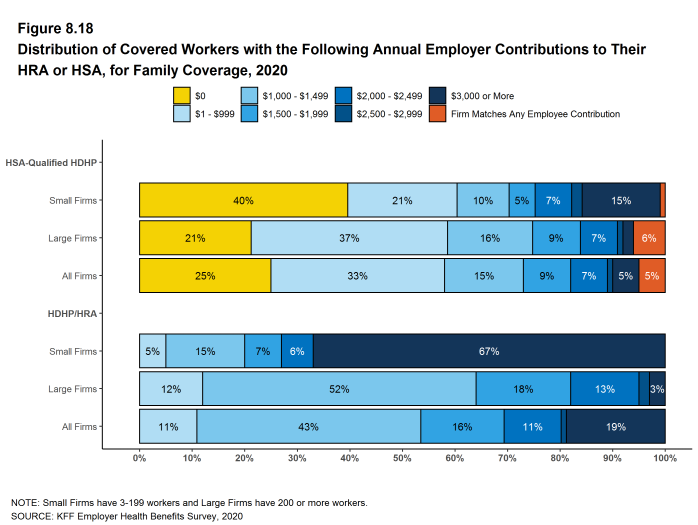
Figure 8.18: Distribution of Covered Workers With the Following Annual Employer Contributions to Their HRA or HSA, for Family Coverage, 2020
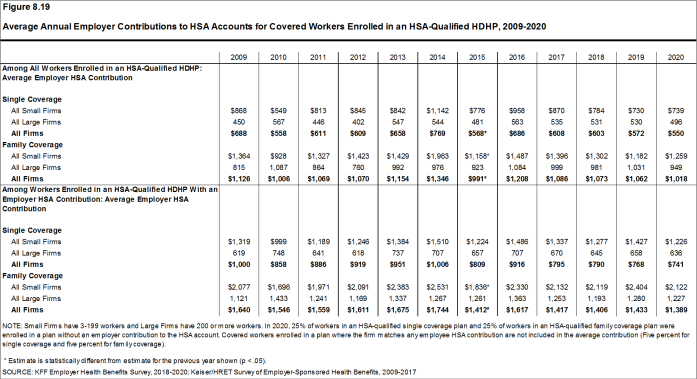
Figure 8.19: Average Annual Employer Contributions to HSA Accounts for Covered Workers Enrolled in an HSA-Qualified HDHP, 2009-2020
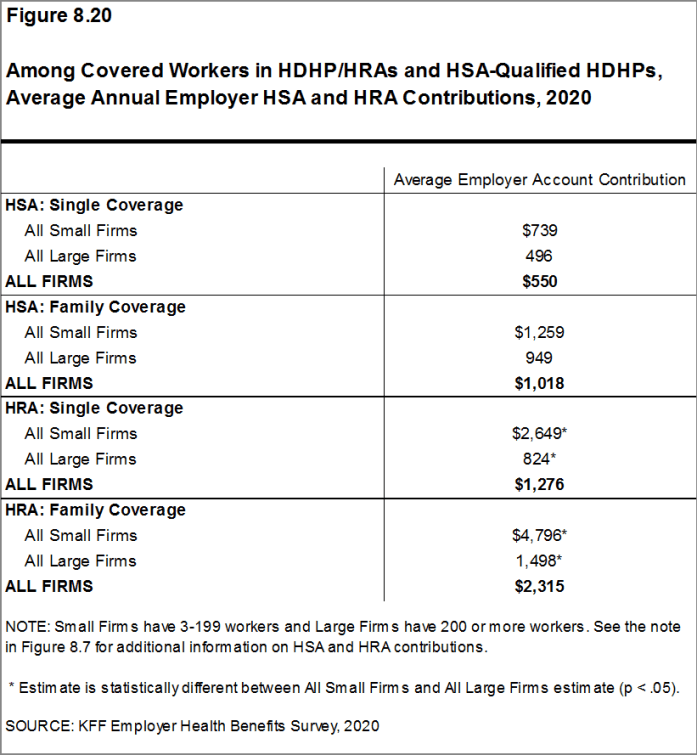
Figure 8.20: Among Covered Workers in HDHP/HRAs and HSA-Qualified HDHPs, Average Annual Employer HSA and HRA Contributions, 2020
COST SHARING FOR OFFICE VISITS
- The cost-sharing pattern for primary care office visits differs for workers enrolled in HDHP/SOs. Thirty-five percent of covered workers in HDHP/HRAs have a copayment for primary care physician office visits compared to 9% enrolled in HSA-qualified HDHPs [Figure 8.21]. Workers in other plan types are much more likely to face copayments than coinsurance for physician office visits (see Section 7 for more information).
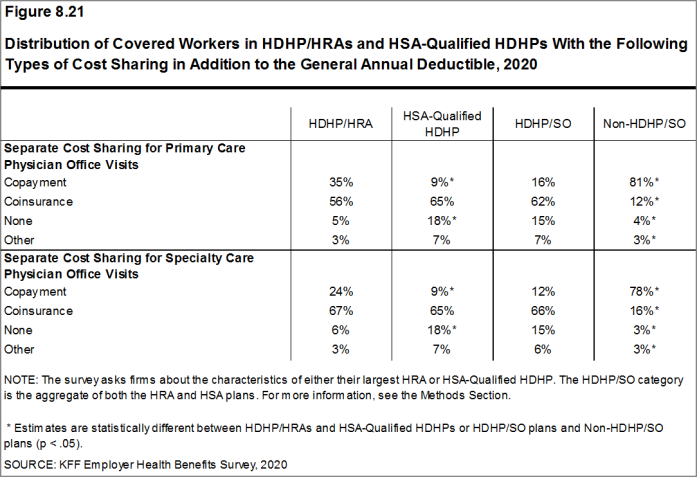
Figure 8.21: Distribution of Covered Workers in HDHP/HRAs and HSA-Qualified HDHPs With the Following Types of Cost Sharing in Addition to the General Annual Deductible, 2020
- There is no legal requirement for the minimum deductible in a plan offered with an HRA. The survey defines a high-deductible HRA plan as a plan with a deductible of at least $1,000 for single coverage and $2,000 for family coverage. Federal law requires a deductible of at least $1,400 for single coverage and $2,800 for family coverage for HSA-qualified HDHPs in 2020 (or $1,350 and $2,700, respectively, for plans in their 2019 plan year). Not all firms’ plan years correspond with the calendar year, so some firms may report a plan with limits from the prior year. See definitions at the end of this Section for more information on HDHP/HRAs and HSA-qualified HDHPs.↩︎
- The definitions of HDHP/SOs do not include other consumer-driven plan options, such as arrangements that combine an HRA with a lower-deductible health plan or arrangements in which an insurer (rather than the employer as in the case of HRAs or the enrollee as in the case of HSAs) establishes an account for each enrollee. Other arrangements may be included in future surveys as the market evolves.↩︎
- The survey asks “Up to what dollar amount does your firm promise to contribute each year to an employee’s HRA or health reimbursement arrangement for single coverage?” We refer to the amount that the employer commits to make available to an HRA as a contribution for ease of discussion. As discussed, HRAs are notional accounts, and employers are not required to actually transfer funds until an employee incurs expenses. Thus, employers may not expend the entire amount that they commit to make available to their employees through an HRA. Some employers may make their HRA contribution contingent on other factors, such as completing wellness programs.↩︎
Prescription Drug Benefits
Nearly all (99%) covered workers are at a firm that provides prescription drug coverage in its largest health plan. Many employer plans have increasingly complex benefit designs for prescriptions drugs, as employers and insurers expand the use of formularies with multiple cost-sharing tiers as well as other management approaches. To reduce the burden on respondents, we ask offering firms about the attributes of prescription drug coverage only for their largest health plan. This survey asks employers about the cost-sharing in up to four tiers, and for a tier exclusively for specialty drugs. Some plans may have more than one tier for specialty drugs or other variations. There also may be considerable variation in how plans structure their formularies.
DISTRIBUTION OF COST SHARING
- The large majority of covered workers (89%) are in a plan with tiered cost sharing for prescription drugs [Figure 9.1]. Cost-sharing tiers generally refer to a health plan placing a drug on a formulary or preferred drug list that classifies drugs into categories that are subject to different cost sharing or management. It is common for there to be different tiers for generic, preferred and non-preferred drugs. In recent years, plans have created additional tiers that may, for example, be used for specialty drugs or expensive biologics. Some plans may have multiple tiers for different categories; for example, a plan may have preferred and non-preferred specialty tiers. The survey obtains information about the cost-sharing structure for up to five tiers.
- Eighty-three percent of covered workers are in a plan with three, four, or more tiers of cost sharing for prescription drugs [Figure 9.1]. These totals include tiers that cover only specialty drugs, even though the cost-sharing information for those tiers is reported separately.
- Although the overall distribution of HDHP/SOs does not statistically differ from non-HDHP/SO plans, certain segments of that distribution have a different cost-sharing pattern for prescription drugs than other plan types. Compared to covered workers in other plan types, those in HDHP/SOs are more likely to be in a plan with the same cost sharing regardless of drug type (17% vs. 2%) or in a plan that has no cost sharing for prescriptions once the plan deductible is met (9% vs. 2%) [Figure 9.2].

Figure 9.1: Distribution of Covered Workers Facing Different Cost-Sharing Formulas for Prescription Drug Benefits, by Firm Size, 2020
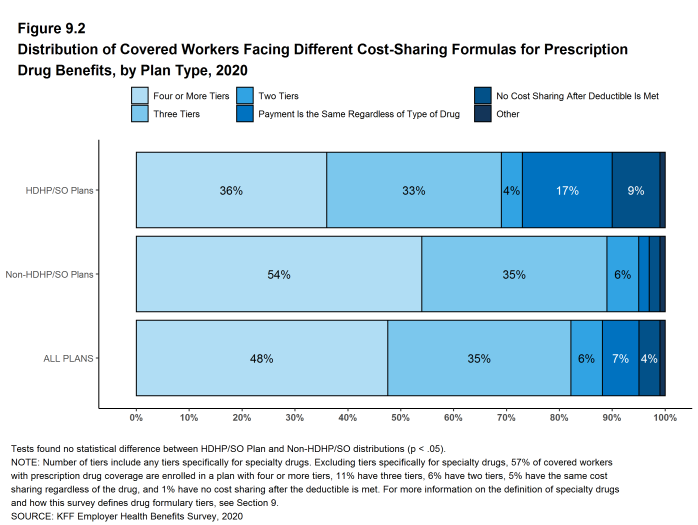
Figure 9.2: Distribution of Covered Workers Facing Different Cost-Sharing Formulas for Prescription Drug Benefits, by Plan Type, 2020
TIERS NOT EXCLUSIVELY FOR SPECIALTY DRUGS
- Even when formulary tiers covering only specialty drugs are not counted, a large share (77%) of covered workers are in a plan with three or more tiers of cost sharing for prescription drugs. The cost-sharing statistics presented in this section do not include information about tiers that cover only specialty drugs. In cases in which a plan covers specialty drugs on a tier with other drugs, they will still be included in these averages. Cost-sharing statistics for tiers covering only specialty drugs are presented further down in this section.
- For covered workers in a plan with three or more tiers of cost sharing for prescription drugs, copayments are the most common form of cost sharing in the first four tiers and coinsurance is the next most common [Figure 9.3].
- Among covered workers in plans with three or more tiers of cost sharing for prescription drugs, the average copayments are $11 for first-tier drugs, $35 second-tier drugs, $62 for third-tier drugs, and $116 for fourth-tier drugs [Figure 9.6].
- Among covered workers in plans with three or more tiers of cost sharing for prescription drugs, the average coinsurance rates are 18% for first-tier drugs, 25% second-tier drugs, 37% third-tier drugs, and 28% for fourth-tier drugs [Figure 9.6].
- Eleven percent of covered workers are in a plan with two tiers for prescription drug cost sharing (excluding tiers covering only specialty drugs).
- For these workers, copayments are more common than coinsurance for first-tier and second-tier drugs [Figure 9.3]. The average copayment for the first tier is $12 and the average copayment for the second tier is $37 [Figure 9.6].
- Six percent of covered workers are in a plan with the same cost sharing for prescriptions regardless of the type of drug (excluding tiers covering only specialty drugs).
- Among these workers, 24% have copayments and 76% have coinsurance [Figure 9.3]. The average coinsurance rate is 20% [Figure 9.6].
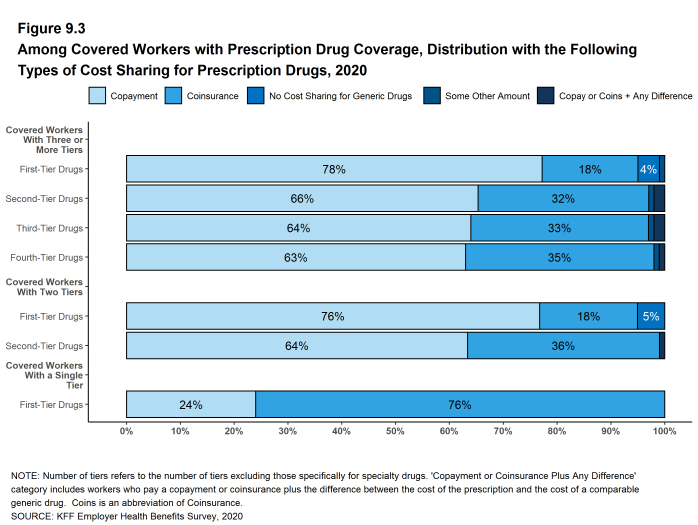
Figure 9.3: Among Covered Workers With Prescription Drug Coverage, Distribution With the Following Types of Cost Sharing for Prescription Drugs, 2020
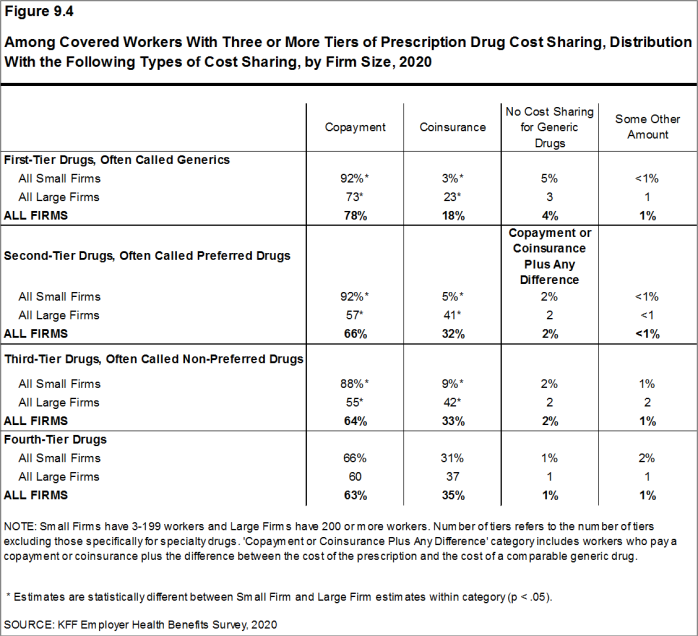
Figure 9.4: Among Covered Workers With Three or More Tiers of Prescription Drug Cost Sharing, Distribution With the Following Types of Cost Sharing, by Firm Size, 2020
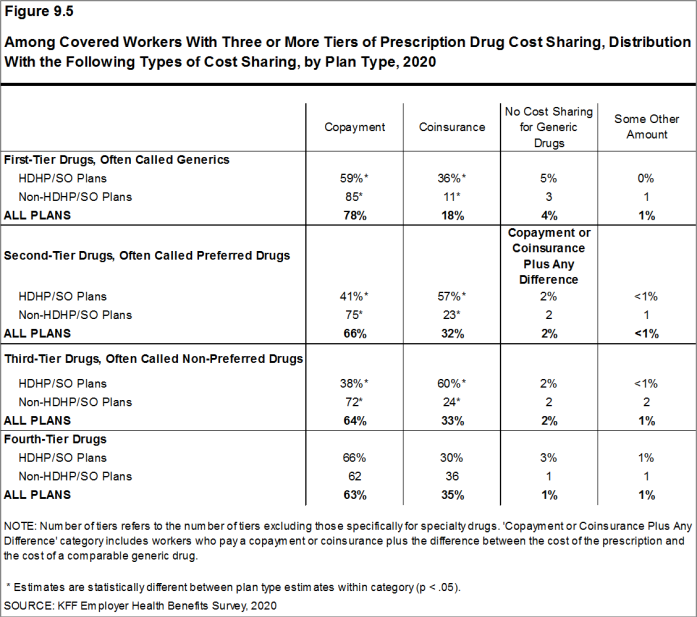
Figure 9.5: Among Covered Workers With Three or More Tiers of Prescription Drug Cost Sharing, Distribution With the Following Types of Cost Sharing, by Plan Type, 2020
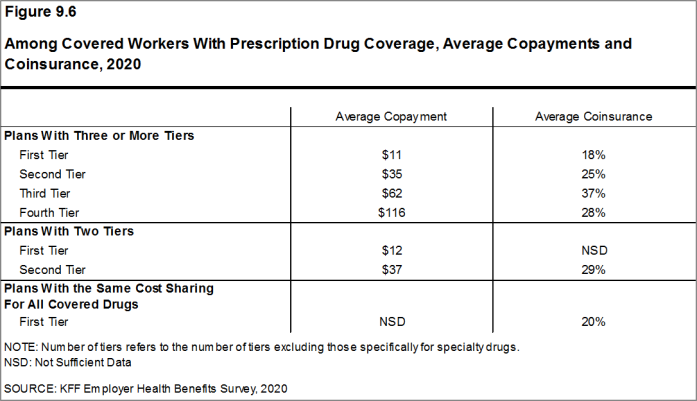
Figure 9.6: Among Covered Workers With Prescription Drug Coverage, Average Copayments and Coinsurance, 2020
COINSURANCE MAXIMUMS
- Coinsurance rates for prescription drugs often include maximum and/or minimum dollar amounts. Depending on the plan design, coinsurance maximums may significantly limit the amount an enrollee must spend out-of-pocket for higher-cost drugs. Even in plans without explicit coinsurance maximum amounts, the overall plan out-of-pocket maximum limits enrollee cost sharing on covered services, including prescription drugs.
- These coinsurance minimum and maximum amounts vary across the tiers.
- For example, among covered workers in a plan with coinsurance for the first cost-sharing tier, 29% have only a maximum dollar amount attached to the coinsurance rate, 10% have only a minimum dollar amount, 22% have both a minimum and maximum dollar amount, and 39% have neither. For those in a plan with coinsurance for the fourth cost-sharing tier, 63% have only a maximum dollar amount attached to the coinsurance rate, 2% have only a minimum dollar amount, 11% have both a minimum and maximum dollar amount, and 24% have neither [Figure 9.7].
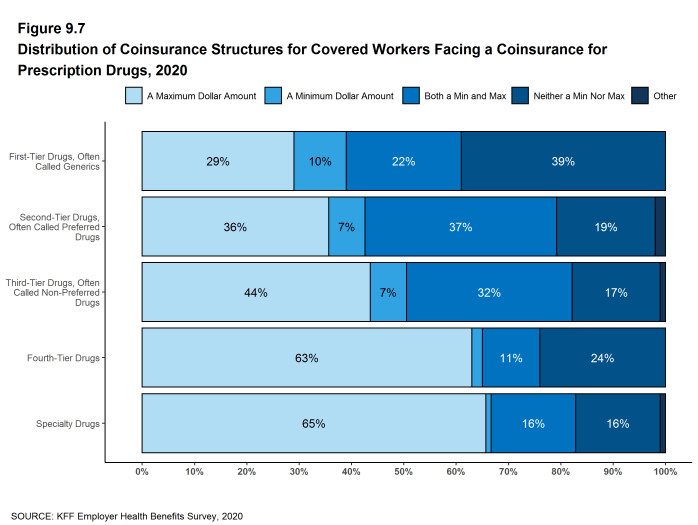
Figure 9.7: Distribution of Coinsurance Structures for Covered Workers Facing a Coinsurance for Prescription Drugs, 2020
SEPARATE TIERS FOR SPECIALTY DRUGS
- Specialty drugs, such as biologics that may be used to treat chronic conditions, or some cancer drugs, can be quite expensive and often require special handling and administration. We revised our questions beginning with the 2016 survey to obtain more information about formulary tiers that are exclusively for specialty drugs. We are reporting results only among large firms because a small firm respondents had large shares of “don’t know” responses to some of these questions.
- Ninety-six percent of covered workers at large firms have coverage for specialty drugs [Figure 9.8]. Among these workers, 45% are in a plan with at least one cost-sharing tier just for specialty drugs [Figure 9.9].
- Among covered workers at large firms in a plan with at least one separate tier for specialty drugs, 45% have a copayment for specialty drugs and 53% have coinsurance [Figure 9.10]. The average copayment is $109 and the average coinsurance rate is 26% [Figure 9.11]. Eighty-seven percent of those with coinsurance have a maximum dollar limit on the amount of coinsurance they must pay.
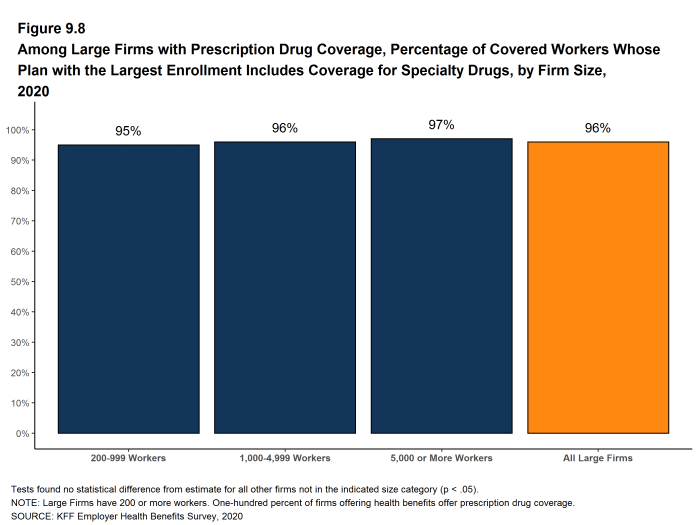
Figure 9.8: Among Large Firms With Prescription Drug Coverage, Percentage of Covered Workers Whose Plan With the Largest Enrollment Includes Coverage for Specialty Drugs, by Firm Size, 2020
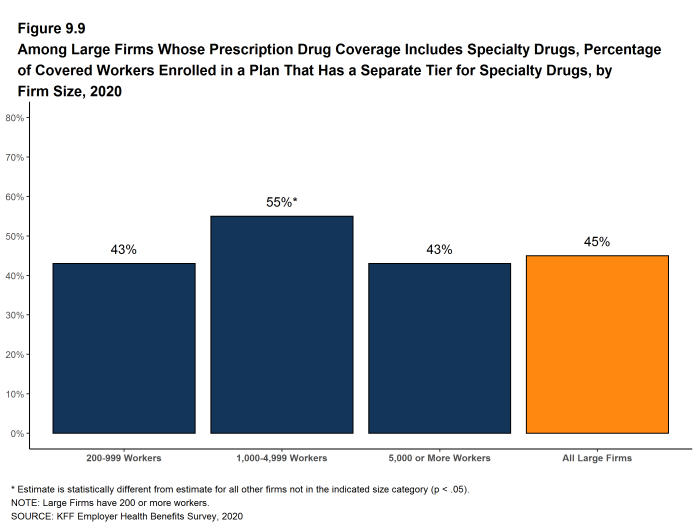
Figure 9.9: Among Large Firms Whose Prescription Drug Coverage Includes Specialty Drugs, Percentage of Covered Workers Enrolled in a Plan That Has a Separate Tier for Specialty Drugs, by Firm Size, 2020
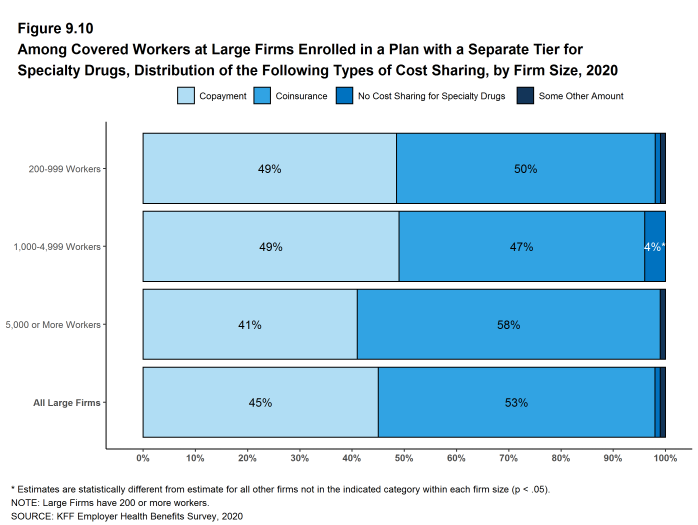
Figure 9.10: Among Covered Workers at Large Firms Enrolled in a Plan With a Separate Tier for Specialty Drugs, Distribution of the Following Types of Cost Sharing, by Firm Size, 2020

Figure 9.11: Among Covered Workers at Large Firms Enrolled in a Plan With a Separate Tier for Specialty Drugs, Average Copayments and Coinsurance, by Firm Size, 2020
Plan Funding
Many firms, particularly larger firms, choose to pay for some or all of the health services of their workers directly from their own funds rather than by purchasing health insurance for them. This is called self-funding. Both public and private employers use self-funding to provide health benefits. Federal law (the Employee Retirement Income Security Act of 1974, or ERISA) exempts self-funded plans established by private employers (but not public employers) from most state insurance laws, including reserve requirements, mandated benefits, premium taxes, and many consumer protection regulations. Sixty-seven percent of covered workers are in a self-funded health plan in 2020. Self-funding is common among larger firms because they can spread the risk of costly claims over a large number of workers and dependents. Some employers which sponsor self-funded plans purchase stoploss coverage to limit their liabilities.
In recent years, a complex funding option, often called level-funding, has become more widely available to small employers. Level-funded arrangements are nominally self-funded options that package together a self-funded plan with extensive stoploss coverage that significantly reduces the risk retained by the employer. Sixteen percent of covered workers in small firms (3-199 workers) are in a level-funded plan.
SELF-FUNDED PLANS
- Sixty-seven percent of covered workers are in a plan that is self-funded, significantly higher than the percentage 61% last year [Figure 10.1] and [Figure 10.2].
- The percentage of covered workers enrolled in self-funded plans is similar to the percentage in five years ago (63%) but higher than the percentage (59%) ten years ago [Figure 10.2].
- As expected, covered workers in large firms are significantly more likely to be in a self-funded plan than covered workers in small firms (84% vs. 23%). The percentage of covered workers in self-funded plans generally increases as the number of workers in a firm increases. [Figure 10.1] and [Figure 10.3].
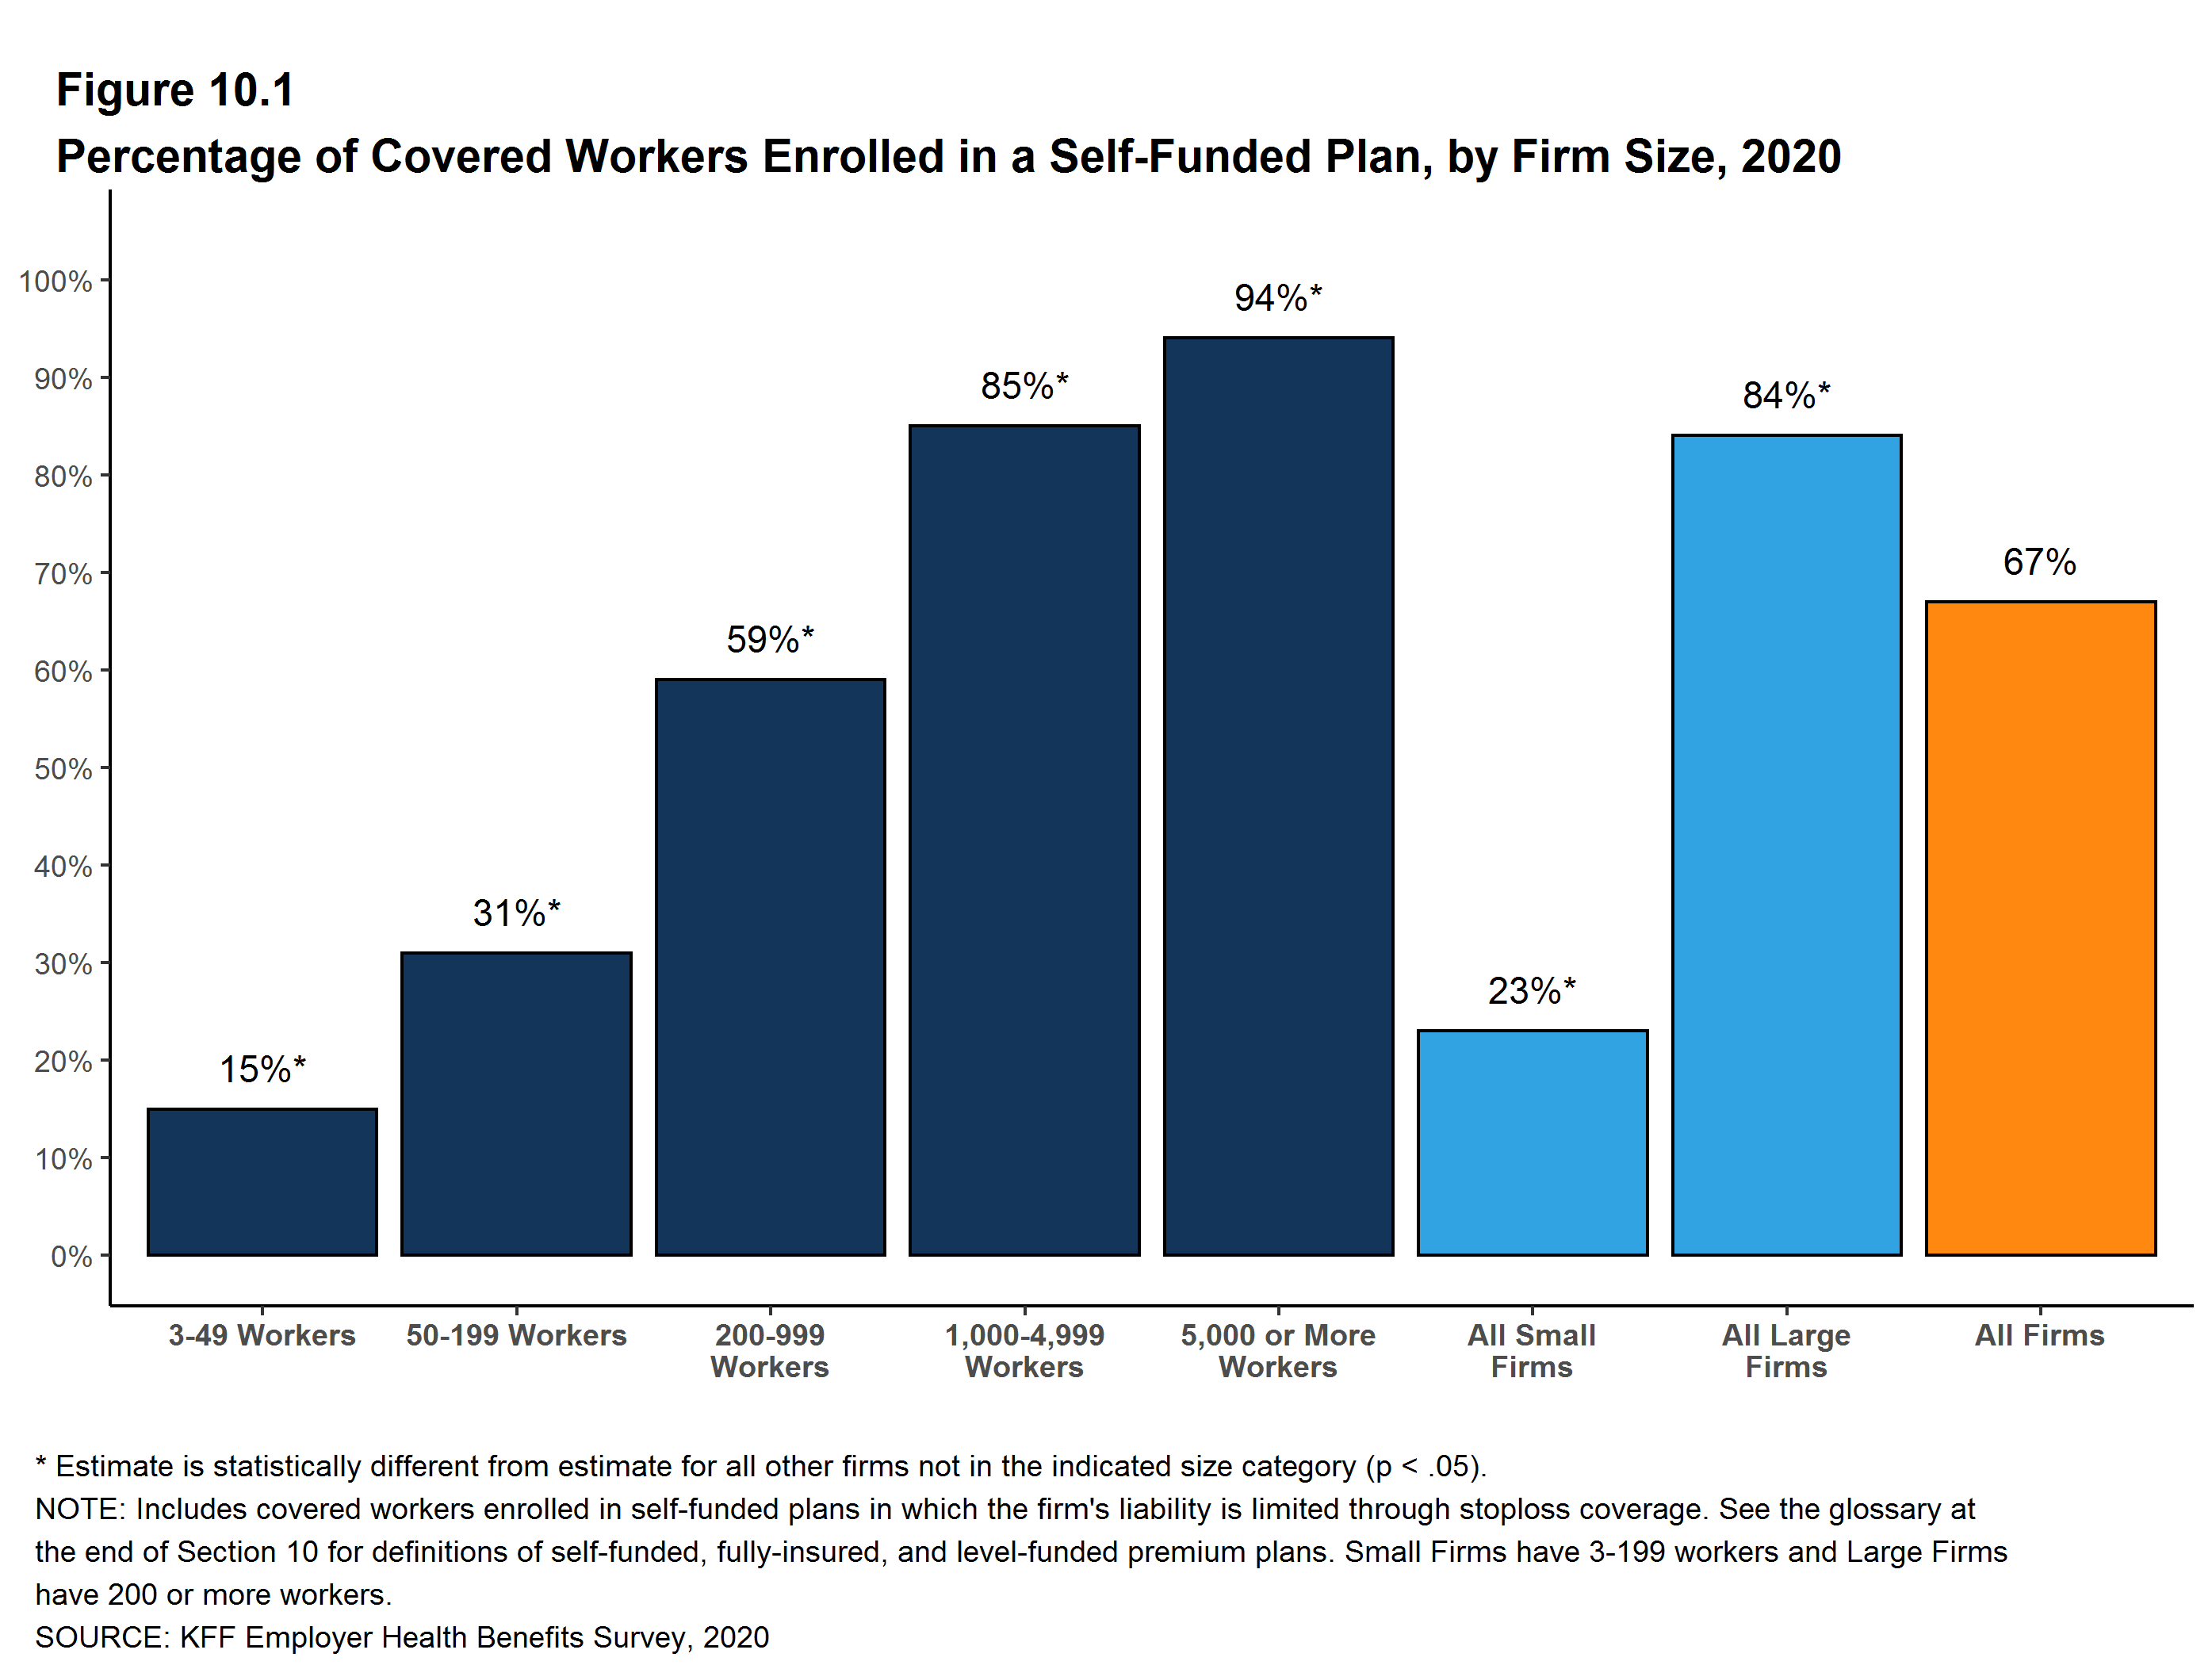
Figure 10.1: Percentage of Covered Workers Enrolled in a Self-Funded Plan, by Firm Size, 2020
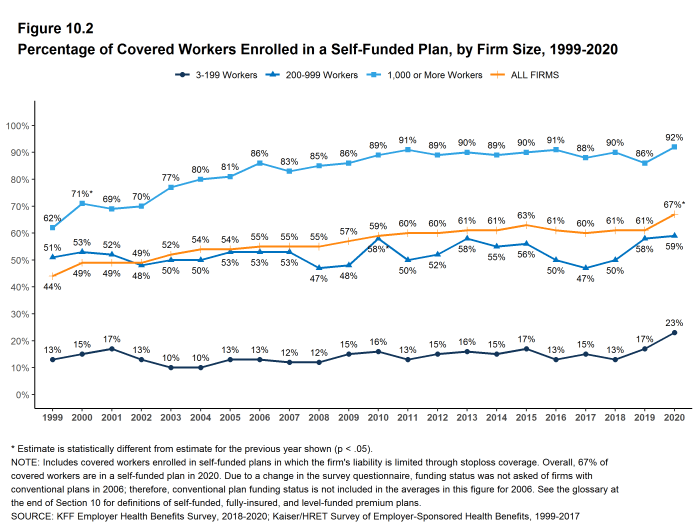
Figure 10.2: Percentage of Covered Workers Enrolled in a Self-Funded Plan, by Firm Size, 1999-2020
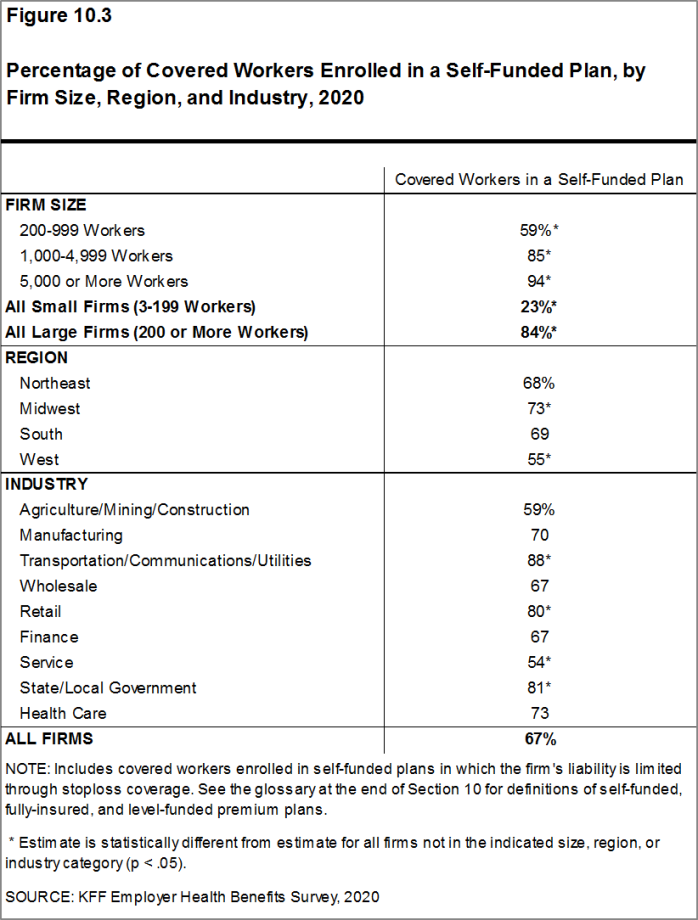
Figure 10.3: Percentage of Covered Workers Enrolled in a Self-Funded Plan, by Firm Size, Region, and Industry, 2020
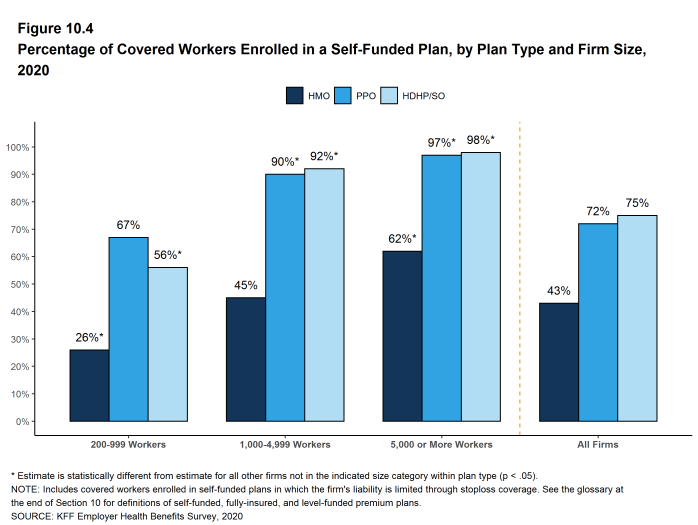
Figure 10.4: Percentage of Covered Workers Enrolled in a Self-Funded Plan, by Plan Type and Firm Size, 2020
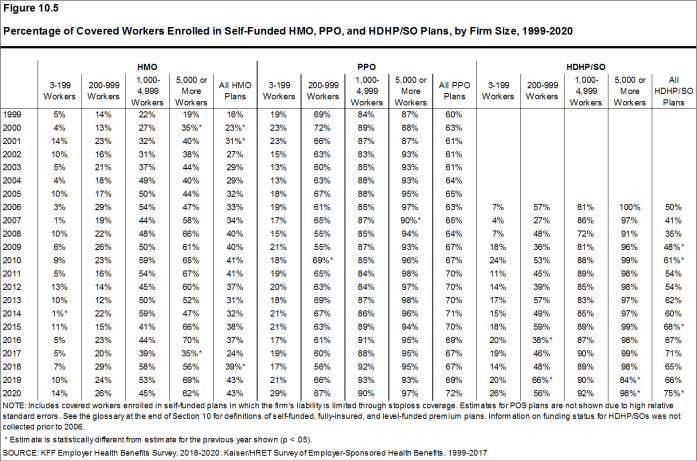
Figure 10.5: Percentage of Covered Workers Enrolled in Self-Funded HMO, PPO, and HDHP/SO Plans, by Firm Size, 1999-2020
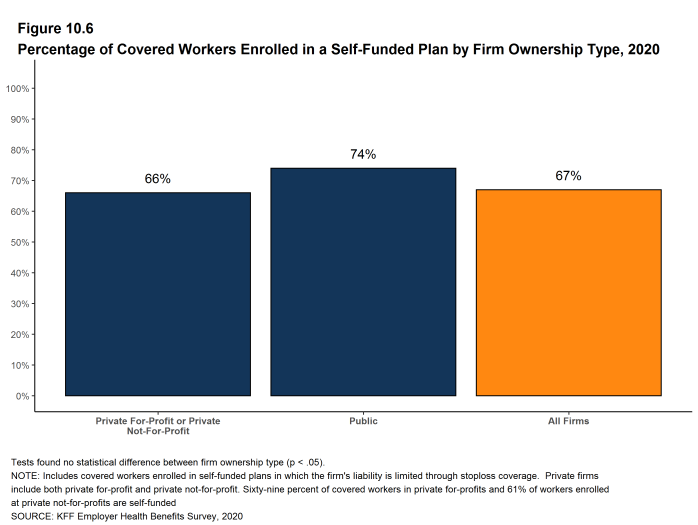
Figure 10.6: Percentage of Covered Workers Enrolled in a Self-Funded Plan by Firm Ownership Type, 2020
LEVEL-FUNDED PLANS
In the past few years, insurers have begun offering health plans that provide a nominally self-funded option for small or mid-sized employers that incorporates stoploss insurance with relatively low attachment points. Often, the insurer calculates an expected monthly expense for the employer, which includes a share of the estimated annual cost for benefits, premium for the stoploss protection, and an administrative fee. The employer pays this “level premium” amount, with the potential for some reconciliation between the employer and the insurer at the end of the year, if claims differ significantly from the estimated amount. These policies are sold as self-funded plans, so they generally are not subject to state requirements for insured plans and, for those sold to employers with fewer than 50 employees, are not subject to the rating and benefit standards in the ACA for small firms.
Due to the complexity of the funding (and regulatory status) of these plans, and because employers often pay a monthly amount that resembles a premium, respondents may be confused as to whether or not their health plan is self-funded or insured. We asked employers with fewer than 200 workers whether they have a level-funded plan.
- Thirteen percent of small firms offer a level-funded plan in 2020, similar to the percentage (7%) last year.
- Thirty-one percent of covered workers in small firms are in a plan that is either self-funded or level-funded in 2020, higher than the percentage (24%) last year [Figure 10.7].
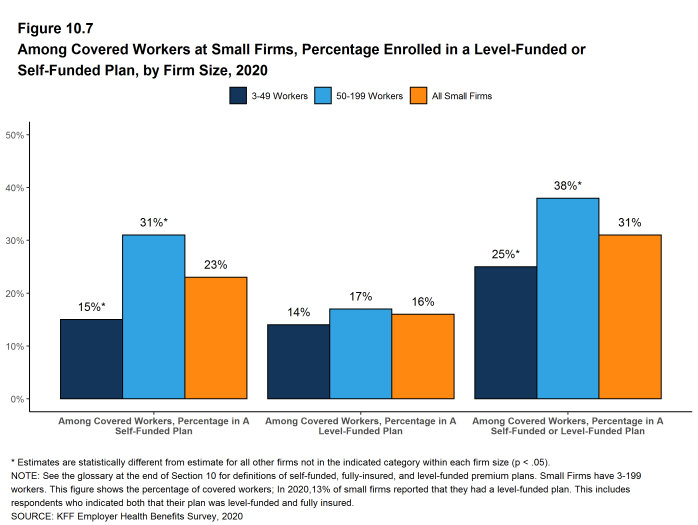
Figure 10.7: Among Covered Workers at Small Firms, Percentage Enrolled in a Level-Funded or Self-Funded Plan, by Firm Size, 2020
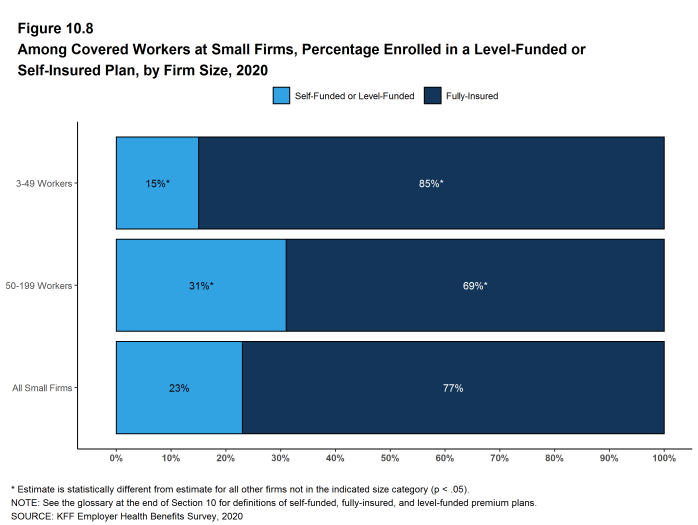
Figure 10.8: Among Covered Workers at Small Firms, Percentage Enrolled in a Level-Funded or Self-Insured Plan, by Firm Size, 2020
STOPLOSS COVERAGE AND ATTACHMENT POINTS
Stoploss coverage may limit the amount of claims that must be paid by a plan sponsor for each worker or may limit the total amount the plan sponsor must pay for all claims over the plan year. At firms with 50 or more workers, sixty-two percent of covered workers in self-funded health plans are in plans that have stoploss insurance, similar to percentage the last time we asked the question in 2018 [Figure 10.9].
- The percentage of covered workers in self-funded plans with stoploss insurance (62%) is similar to the value when the survey first asked about stoploss insurance in 2011 (58%). [Figure 10.10].
- Among covered workers in self-funded plans with 50 or more workers that have stoploss, 87% are in plans where the stoploss insurance limits the amount the plan must spend on each worker or enrollee, 57% are in plans where the stoploss insurance limits the overall amount the plan must pay, 70% are in plans where the stoploss insurance limits the amounts that the plans must pay for high claims or episodes, and 10% are in plans where the stoploss insurance includes a different type of limit. Respondents were asked to choose all of the options that applied to their stoploss coverage [Figures 10.11]. Some plans have several limits applying to their plan. Starting in 2020, we restructured these questions and, while we believe the answers are similar to 2011 through 2018, changes in question wording may impact responses.
- Firms with 50 or more workers who have a per-enrollee stoploss coverage component were asked for the dollar amount where the stoploss coverage would start to pay for most or all of the claim (called an attachment point). The average attachment points for these firms are $100,000 for small firms (50-199) and $380,000 for large firms [Figure 10.13].
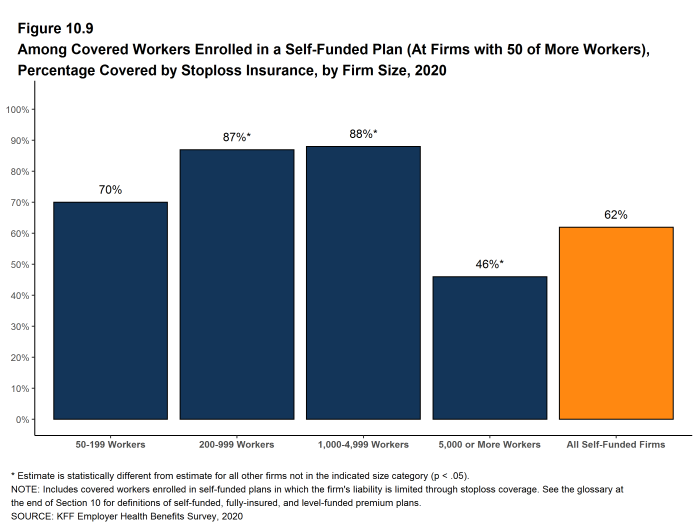
Figure 10.9: Among Covered Workers Enrolled in a Self-Funded Plan (At Firms With 50 of More Workers), Percentage Covered by Stoploss Insurance, by Firm Size, 2020
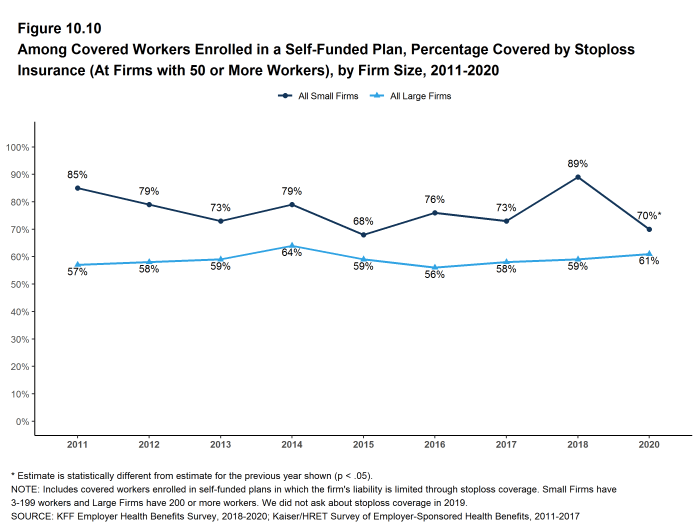
Figure 10.10: Among Covered Workers Enrolled in a Self-Funded Plan, Percentage Covered by Stoploss Insurance (At Firms With 50 or More Workers), by Firm Size, 2011-2020
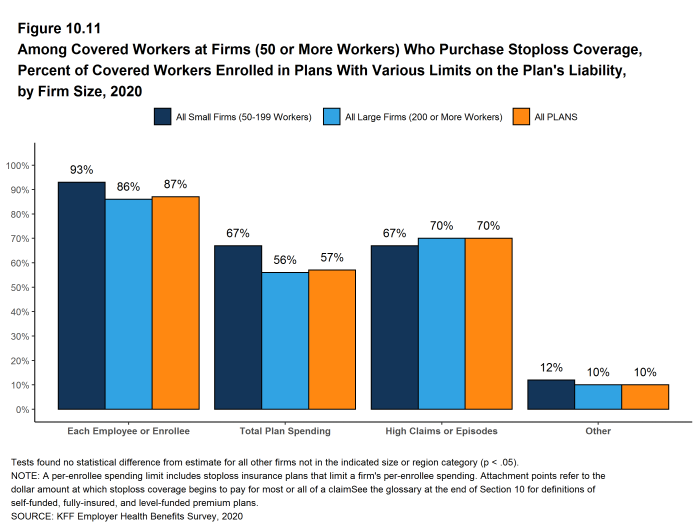
Figure 10.11: Among Covered Workers at Firms (50 or More Workers) Who Purchase Stoploss Coverage, Percent of Covered Workers Enrolled in Plans With Various Limits On the Plan’s Liability, by Firm Size, 2020
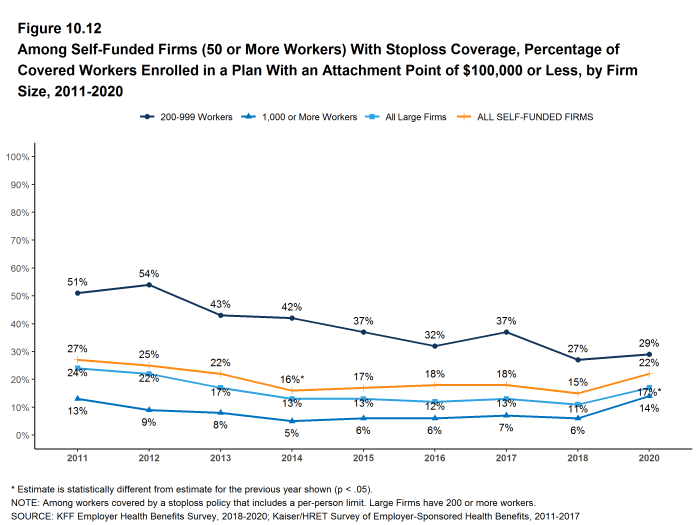
Figure 10.12: Among Self-Funded Firms (50 or More Workers) With Stoploss Coverage, Percentage of Covered Workers Enrolled in a Plan With an Attachment Point of $100,000 or Less, by Firm Size, 2011-2020
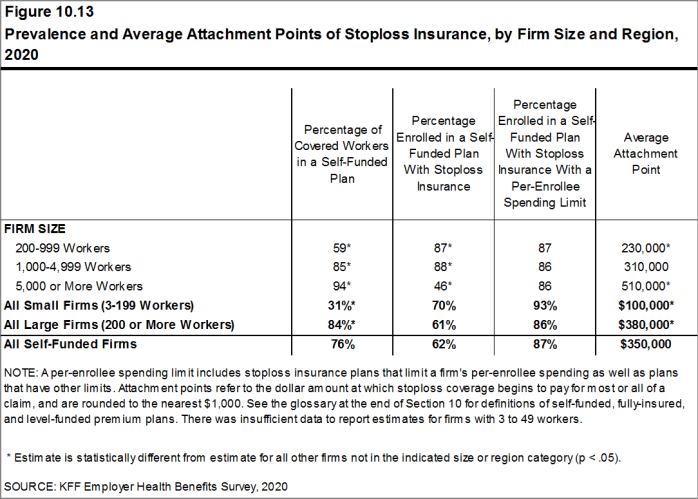
Figure 10.13: Prevalence and Average Attachment Points of Stoploss Insurance, by Firm Size and Region, 2020
Retiree Health Benefits
Retiree health benefits are an important consideration for older workers making decisions about their retirement. Retiree benefits can be a crucial source of coverage for people retiring before Medicare eligibility. For retirees with Medicare coverage, retiree health benefits can provide an important supplement to Medicare, helping them pay for cost sharing and benefits not otherwise covered by Medicare.
In 2019, we modified the question that we use to ask firms whether or not they provide retiree health benefits; specifically, in contrast to prior years, the 2019 and 2020 surveys explicitly stated that firms that had terminated retiree health benefits but still has some retirees getting coverage, or that had current employees who will get retiree health coverage in the future, should answer ‘yes’ to the question. For this reason, estimates of retiree health benefits from 2019 onwards are not comparable to prior surveys.
This year’s survey finds that 29% of large firms offering health benefits offer retiree health benefits, similar to the percentage (28%) in 2019.
This survey asks retiree health benefits questions only of large firms (200 or more workers).
EMPLOYER RETIREE BENEFITS
- In 2020, 29% of large firms that offer health benefits offer retiree health benefits for at least some current workers or retirees, similar to the percentage last year [Figure 11.1]. See the Methods section for a discussion of changes to survey question on retiree health benefits for 2019 survey. Due to this change, we did not test to see if current percentage is different than those in 2018 or before.
- Retiree health benefits offer rates vary considerably by firm characteristics.
- Among large firms offering health benefits, the likelihood that a firm will offer retiree health benefits increases with firm size [Figure 11.2].
- The share of large firms offering retiree health benefits varies considerably by industry [Figure 11.2].
- Among large firms offering health benefits, public employers are more likely (66%) to offer retiree health benefits than other firm types [Figure 11.3].
- Large firms offering health benefits with at least some union workers are more likely to offer retiree health benefits than large firms without any union workers (47% vs. 23%) [Figure 11.3].
- Large firms offering health benefits with a relatively large share of older workers (where at least 35% of the workers are age 50 or older) are more likely to offer retiree health benefits than large firms with a smaller share of older workers (39% vs. 20%) [Figure 11.3].
- Large firms offering health benefits with a relatively large share of higher-wage workers (where at least 35% of workers earn $64,000 a year or more) are more likely to offer retiree health benefits than large firms with a smaller share of higher-wage workers (38% vs. 23%) [Figure 11.3].
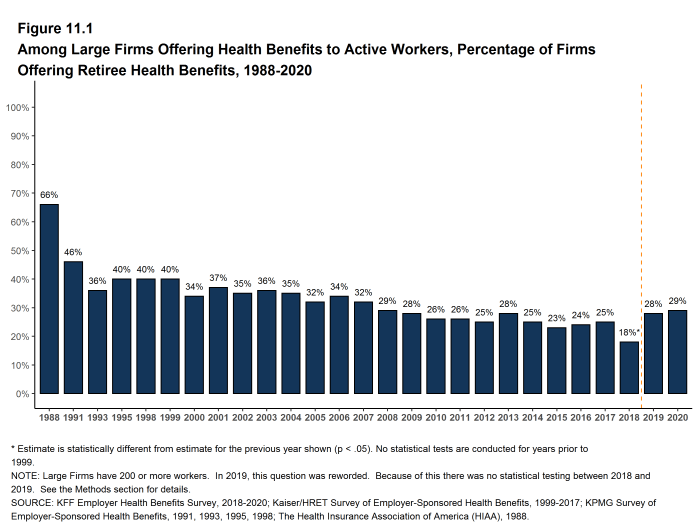
Figure 11.1: Among Large Firms Offering Health Benefits to Active Workers, Percentage of Firms Offering Retiree Health Benefits, 1988-2020
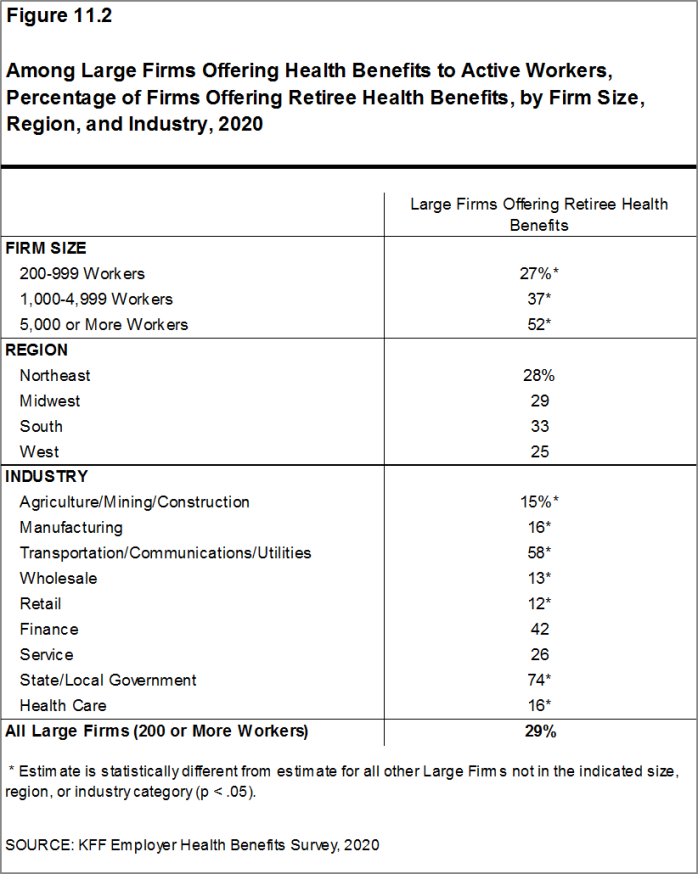
Figure 11.2: Among Large Firms Offering Health Benefits to Active Workers, Percentage of Firms Offering Retiree Health Benefits, by Firm Size, Region, and Industry, 2020
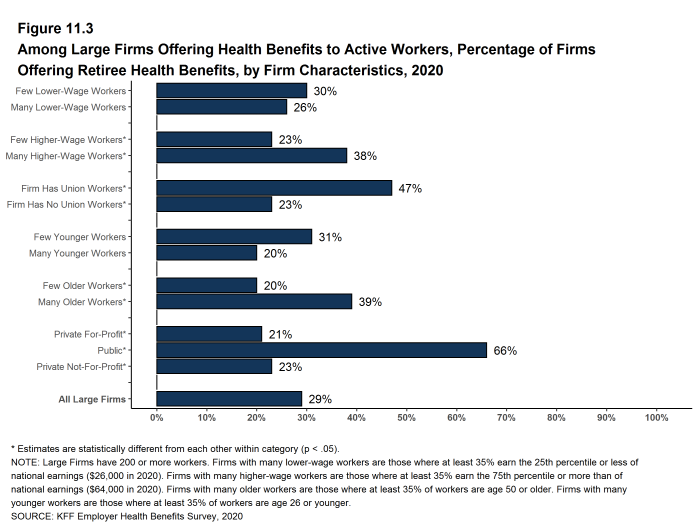
Figure 11.3: Among Large Firms Offering Health Benefits to Active Workers, Percentage of Firms Offering Retiree Health Benefits, by Firm Characteristics, 2020
EARLY RETIREES, MEDICARE-AGE RETIREES AND SPOUSES
- Among large firms offering retiree health benefits, 87% offer benefits to early retirees under the age of 65 and 67% offer them to Medicare-age retirees [Figure 11.4].
- Among all large firms offering health benefits to current workers, 20% offer retiree health benefits to Medicare-age retirees.
- Among large firms offering retiree health benefits, 56% offer benefits to both early and Medicare-age retirees.
- Among large firms offering retiree benefits, a large share (86%) report offering health benefits to the spouses of retirees [Figure 11.5].
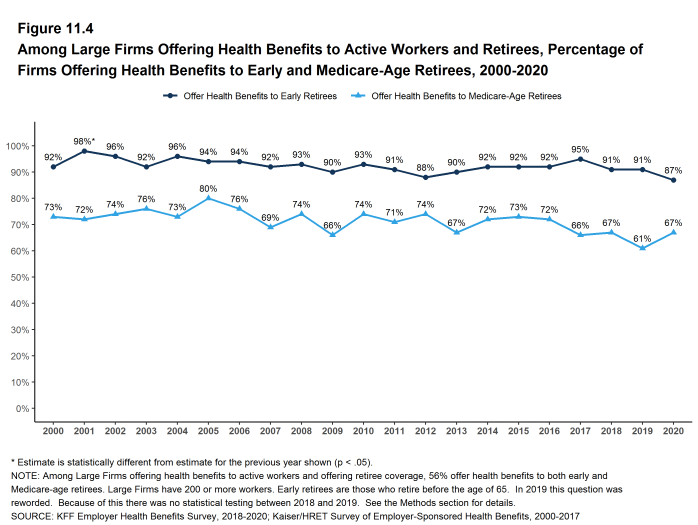
Figure 11.4: Among Large Firms Offering Health Benefits to Active Workers and Retirees, Percentage of Firms Offering Health Benefits to Early and Medicare-Age Retirees, 2000-2020
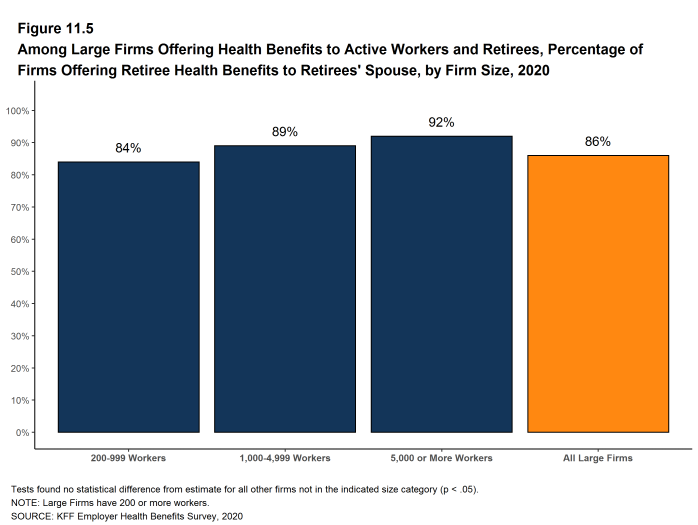
Figure 11.5: Among Large Firms Offering Health Benefits to Active Workers and Retirees, Percentage of Firms Offering Retiree Health Benefits to Retirees’ Spouse, by Firm Size, 2020
MEDICARE ADVANTAGE
- Forty-four percent of large employers offering retiree health benefits to Medicare-age retirees offer coverage to at least some Medicare-age retirees through a contract with a Medicare Advantage plan, similar to the percentage last year (44%) [Figure 11.6].
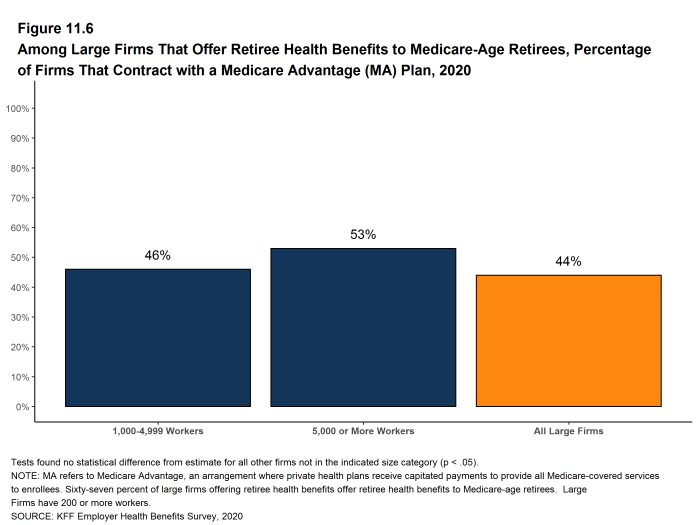
Figure 11.6: Among Large Firms That Offer Retiree Health Benefits to Medicare-Age Retirees, Percentage of Firms That Contract With a Medicare Advantage (MA) Plan, 2020
Health Screening and Health Promotion and Wellness Programs
Most firms offer some form of wellness program to help workers and family members identify health issues and manage chronic conditions. Many employers believe that improving the health of their workers and their family members can improve morale and productivity, as well as reduce health care costs.
In addition to offering wellness programs, a majority of large firms now offer health screening programs, including health risk assessments, which are questionnaires asking workers about lifestyle, stress, or physical health, and biometric screening, which we define as in-person health examinations conducted by a medical professional. Firms and insurers may use the health information collected during screenings to target wellness offerings or other health services to workers with certain conditions or behaviors. Some firms have incentive programs that reward or penalize workers for different activities, including participating in wellness programs or completing health screenings.
Among large firms offering health benefits in 2020, 60% offer workers the opportunity to complete a health risk assessment, 50% offer workers the opportunity to complete a biometric screening, and 81% offer workers one or more wellness programs, such as programs to help them stop smoking or lose weight, or programs that offer lifestyle and behavioral coaching. Substantial shares of these large firms provide incentives for workers to participate in or complete the programs.
Only firms offering health benefits were asked about their wellness and health promotion programs.
Employers have been and continue to deal with the coronavirus pandemic, including by modifying wellness and screening programs and employee assistance programs. For example, some employees may not be available for health screening or may not be able to participate in wellness-related programs. Some employers may have chosen to modify or suspend financial incentives due to potential difficulties with employees achieving compliance. Due to the timing of the survey, we were not able to include questions about how employers may have adapted their health plans and employee assistance programs to address some of the impacts of the epidemic.
HEALTH RISK ASSESSMENTS
Many firms provide workers the opportunity to complete a health risk assessment to identify potential health issues. Health risk assessments generally include questions about medical history, health status, and lifestyle. At small firms, health risk assessments are often administered by an insurer.
- Among firms offering health benefits, 42% of small firms and 60% of large firms provide workers the opportunity to complete a health risk assessment [Figure 12.1]. These percentages are similar to the corresponding percentages for 2019 (41% for small firms and 65% for large firms) [Figure 12.2].
- Some firms offer incentives to encourage workers to complete a health risk assessment.
- Among large firms that offer a health risk assessment, 52% offer workers an incentive to complete the assessment [Figure 12.3].
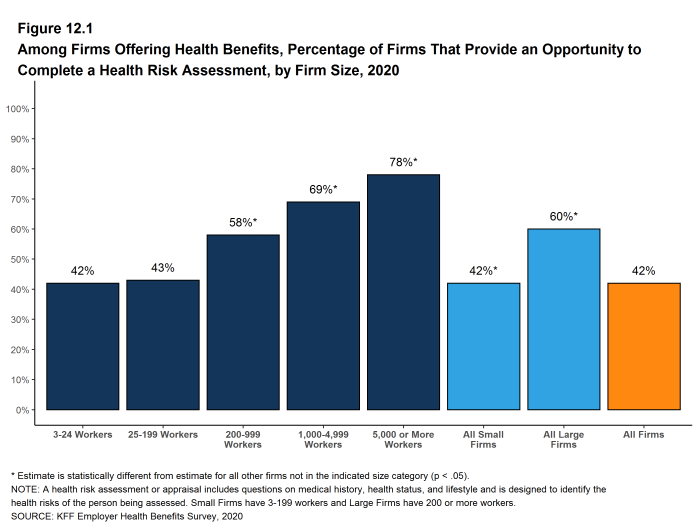
Figure 12.1: Among Firms Offering Health Benefits, Percentage of Firms That Provide an Opportunity to Complete a Health Risk Assessment, by Firm Size, 2020
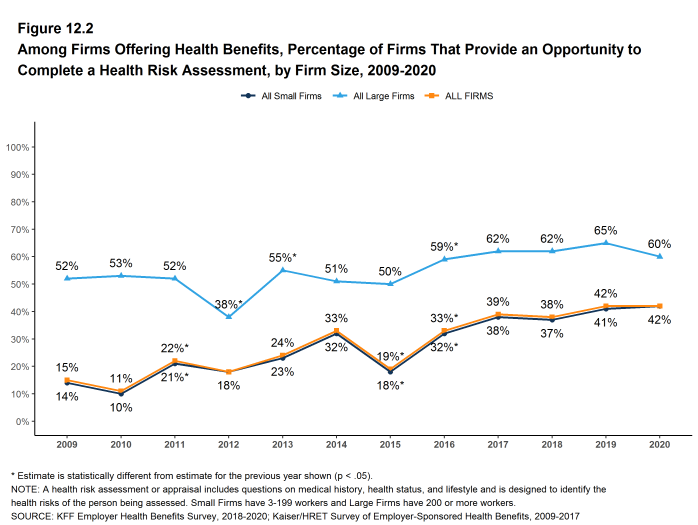
Figure 12.2: Among Firms Offering Health Benefits, Percentage of Firms That Provide an Opportunity to Complete a Health Risk Assessment, by Firm Size, 2009-2020
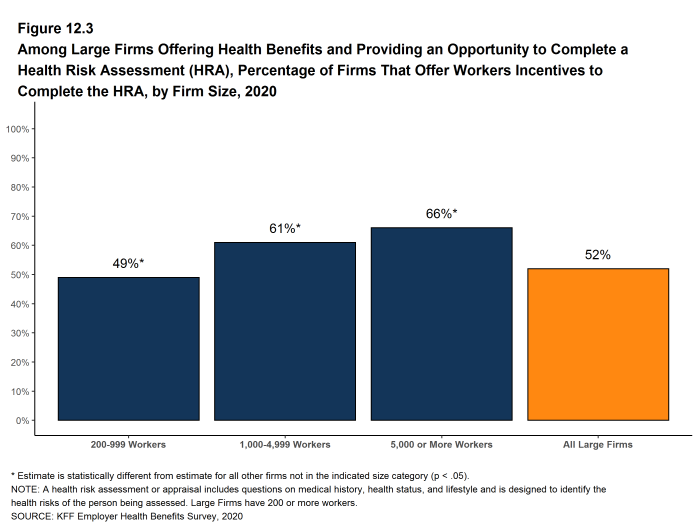
Figure 12.3: Among Large Firms Offering Health Benefits and Providing an Opportunity to Complete a Health Risk Assessment (HRA), Percentage of Firms That Offer Workers Incentives to Complete the HRA, by Firm Size, 2020
BIOMETRIC SCREENING
Biometric screening is a health examination that measures a person’s risk factors (such as cholesterol, blood pressure, and body mass index (BMI)) for certain medical issues. A biometric outcome involves assessing whether the person meets specified health targets related to certain risk factors, such as meeting a target BMI or cholesterol level. As defined by this survey, goals related to smoking are not included in the biometric screening questions.
- Among firms offering health benefits, 33% of small firms and 50% of large firms provide workers the opportunity to complete a biometric screening [Figure 12.4]. These percentages are similar to 2019 (26% and 52%) [Figure 12.5].
- Some firms offer incentives to encourage workers to complete the biometric screening.
- Among firms with biometric screening programs, 17% of small firms and 65% of large firms offer workers an incentive to complete the screening [Figure 12.6].
- In addition to incentives for completing a biometric screening, some firms offer workers incentives to meet biometric outcomes. Among large firms with biometric screening programs, 18% reward or penalize workers based on achieving specified biometric outcomes (such as meeting a target BMI) [Figure 12.6].
- The size of the incentives firms offer for meeting biometric outcomes varies considerably. Among large firms offering a reward or penalty for meeting biometric outcomes, the maximum reward is valued at $150 or less for 12% of firms and more than $1,000 for 32% of firms [Figure 12.7]. Seven percent of these firms combine the reward with incentives for other activities. This may include employers who ask employees to complete several health screening, disease management, wellness/health promotion activities in order to qualify for incentives.
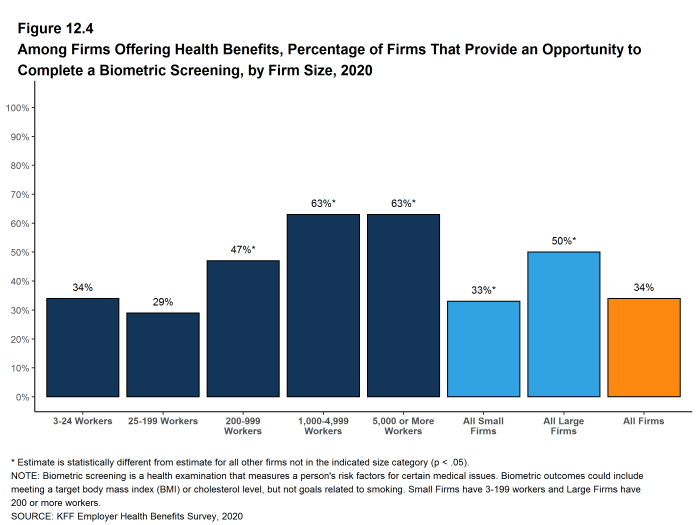
Figure 12.4: Among Firms Offering Health Benefits, Percentage of Firms That Provide an Opportunity to Complete a Biometric Screening, by Firm Size, 2020
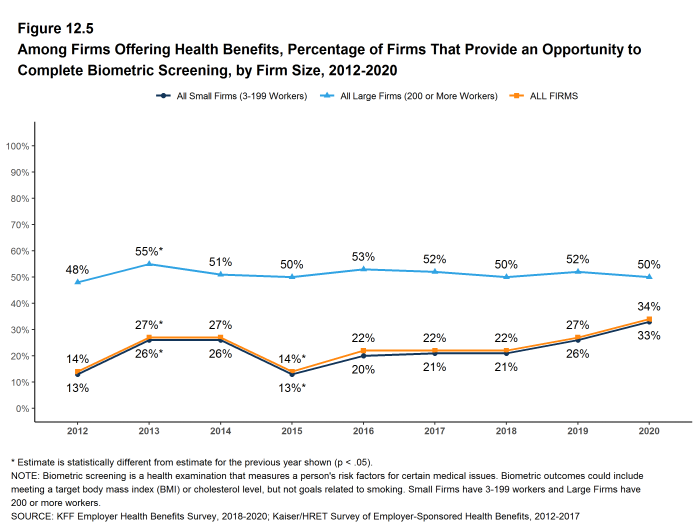
Figure 12.5: Among Firms Offering Health Benefits, Percentage of Firms That Provide an Opportunity to Complete Biometric Screening, by Firm Size, 2012-2020
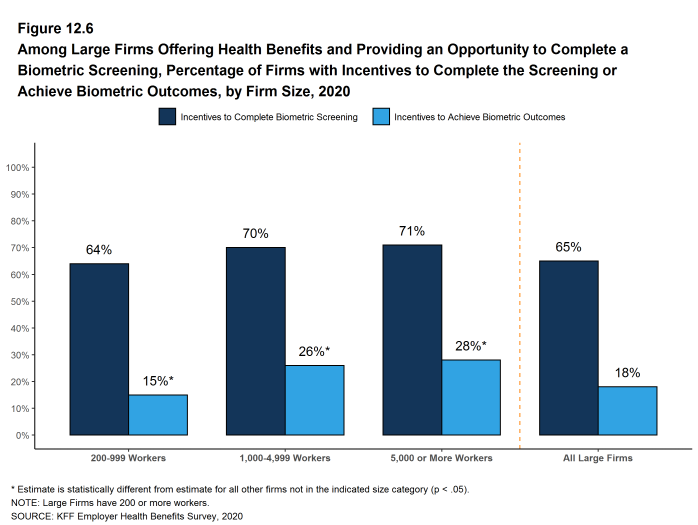
Figure 12.6: Among Large Firms Offering Health Benefits and Providing an Opportunity to Complete a Biometric Screening, Percentage of Firms With Incentives to Complete the Screening or Achieve Biometric Outcomes, by Firm Size, 2020
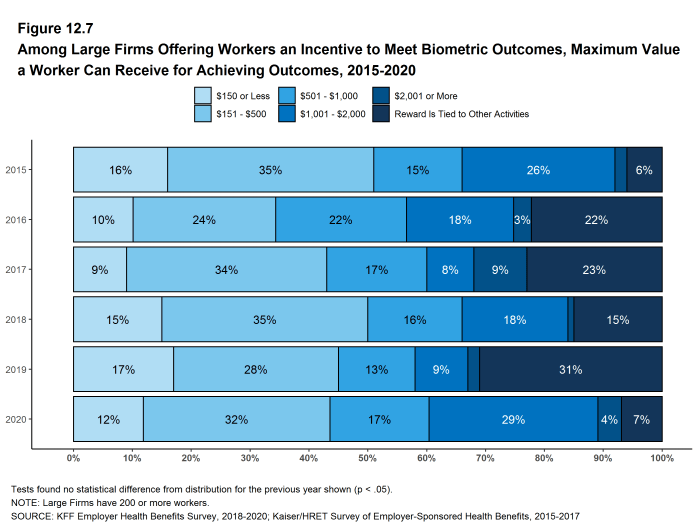
Figure 12.7: Among Large Firms Offering Workers an Incentive to Meet Biometric Outcomes, Maximum Value a Worker Can Receive for Achieving Outcomes, 2015-2020
HEALTH SCREENING PROGRAMS
Among firms offering health benefits, 50% of small firms and 68% of large firms offer workers a health risk assessment, biometric screening or both screening programs.
- Forty percent of large firms offering health benefits have an incentive for workers to complete a biometric screening or health risk assessment [Figure 12.9].
- In large firms providing workers the opportunity to complete a health risk assessment, 44% of covered workers complete an assessment [Figure 12.11].
- There is considerable variation across firms in the percentage of workers who complete the assessment. Twenty-one percent of large firms providing workers the opportunity to complete a health risk assessment report that more than 75% of their workers complete the assessment, while 37% report no more than 25% of workers complete the assessment.
- In large firms providing workers the opportunity to complete a biometric screening, 45% of covered workers complete a screening [Figure 12.11].
- There is considerable variation across firms in the percentage of workers who complete a biometric screening. Twenty-one percent of large firms providing workers the opportunity to complete a biometric screening report that more than 75% of their workers complete the screening, while 33% report no more than 25% of workers complete the screening.
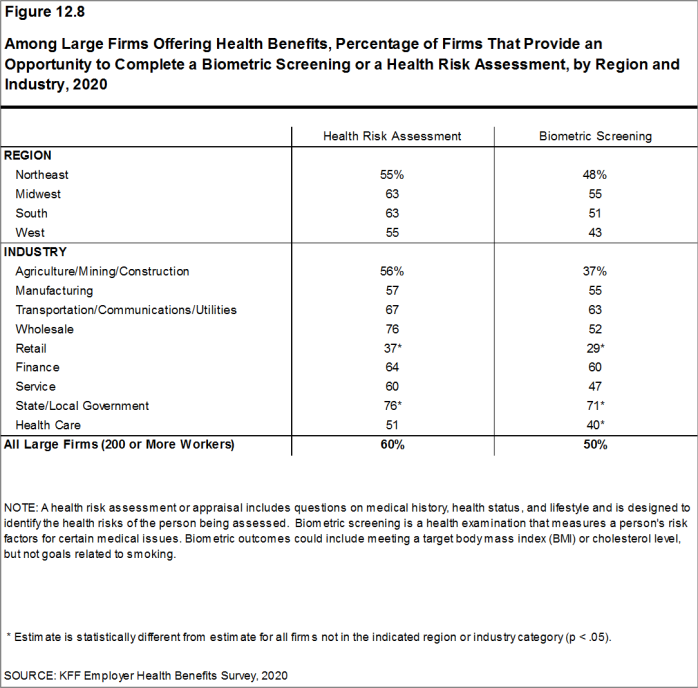
Figure 12.8: Among Large Firms Offering Health Benefits, Percentage of Firms That Provide an Opportunity to Complete a Biometric Screening or a Health Risk Assessment, by Region and Industry, 2020
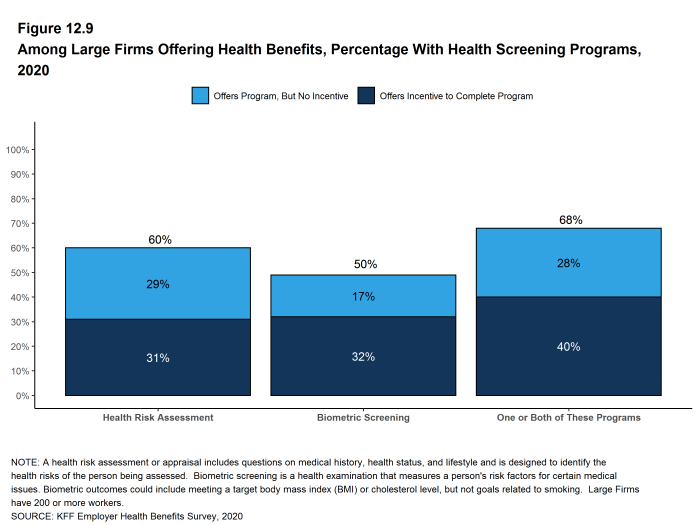
Figure 12.9: Among Large Firms Offering Health Benefits, Percentage With Health Screening Programs, 2020

Figure 12.10: Among Large Firms Offering Health Benefits, Percentage With Either a Health Risk Assessment or a Biometric Screening, 2013-2020
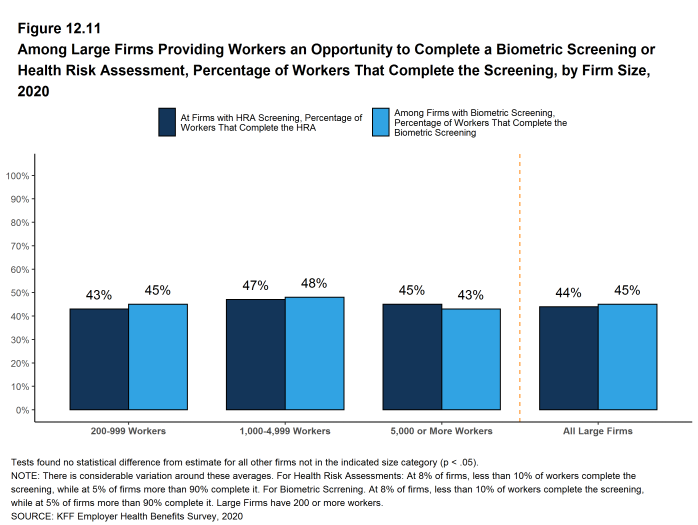
Figure 12.11: Among Large Firms Providing Workers an Opportunity to Complete a Biometric Screening or Health Risk Assessment, Percentage of Workers That Complete the Screening, by Firm Size, 2020
WELLNESS AND HEALTH PROMOTION PROGRAMS
Large shares of employers continue to offer educational and other programs to help workers engage in healthy lifestyles and reduce health risks. Wellness and health promotion programs may include exercise programs, health education classes, health coaching, and stress-management counseling. These programs may be offered directly by the firm, an insurer, or a third-party contractor.
- Among firms offering health benefits, 41% of small firms and 69% of large firms offer programs to help workers stop smoking or using tobacco, 36% of small firms and 58% of large firms offer programs to help workers lose weight, and 38% of small firms and 67% of large firms offer some other lifestyle or behavioral coaching program. Overall, 53% of small firms and 81% of large firms offering health benefits offer at least one of these three programs [Figure 12.12] and [Figure 12.13].
- Forty-four percent of large firms offering one of these wellness or health promotion programs offer an incentive to encourage workers to participate in or complete the programs [Figure 12.15]
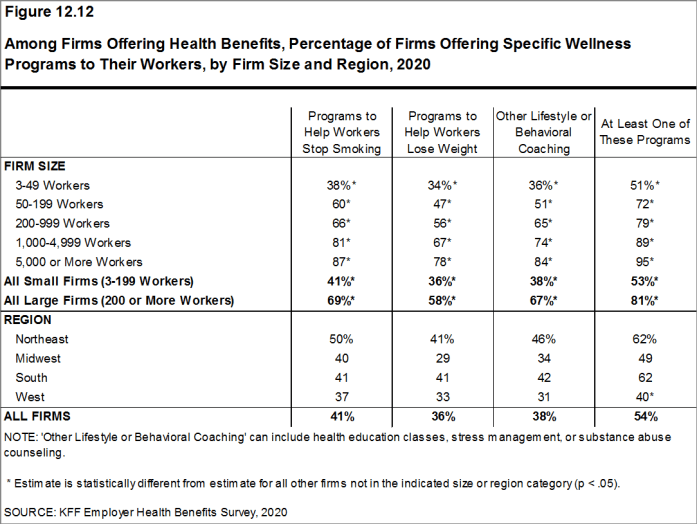
Figure 12.12: Among Firms Offering Health Benefits, Percentage of Firms Offering Specific Wellness Programs to Their Workers, by Firm Size and Region, 2020
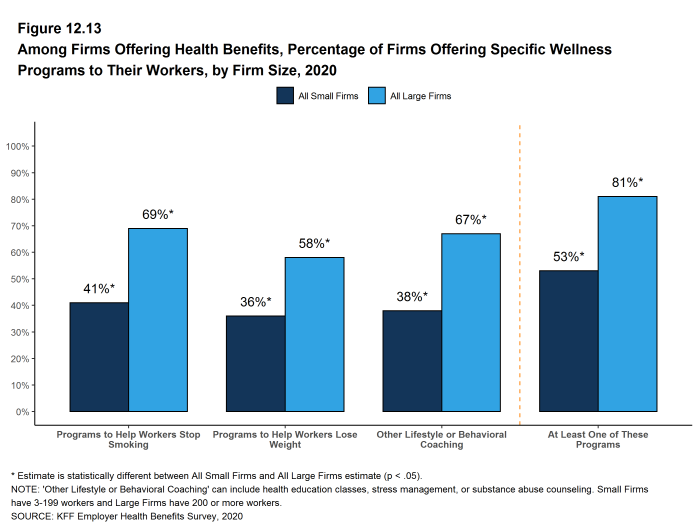
Figure 12.13: Among Firms Offering Health Benefits, Percentage of Firms Offering Specific Wellness Programs to Their Workers, by Firm Size, 2020
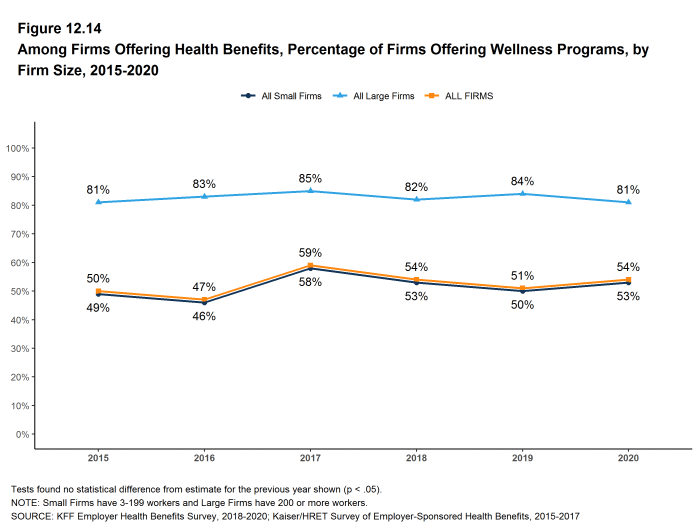
Figure 12.14: Among Firms Offering Health Benefits, Percentage of Firms Offering Wellness Programs, by Firm Size, 2015-2020
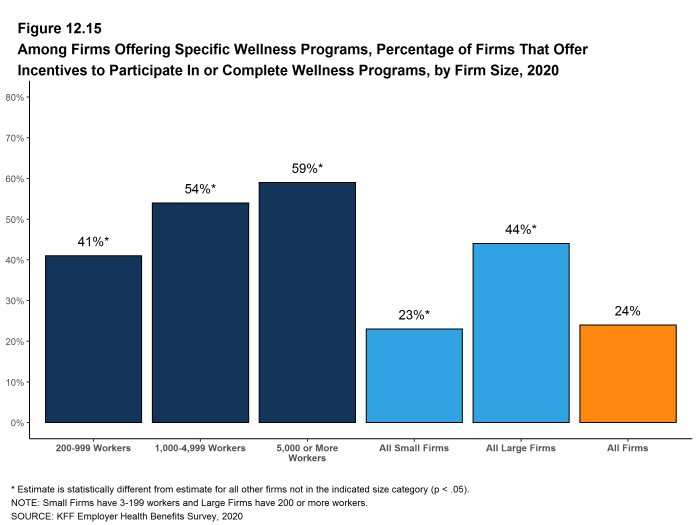
Figure 12.15: Among Firms Offering Specific Wellness Programs, Percentage of Firms That Offer Incentives to Participate in or Complete Wellness Programs, by Firm Size, 2020
INCENTIVES FOR WELLNESS AND HEALTH SCREENING PROGRAMS
Firms with incentives for health risk assessments, biometric screenings, or wellness or health promotion programs were asked to report the maximum reward or penalty a worker could earn for all of the firm’s health promotion activities combined. Some firms do not offer incentives for individual activities, but offer rewards to workers who complete a variety of activities.26 Among large firms offering incentives for any of these programs, the maximum value for all wellness-related incentives is $150 or less in 20% of firms and more than $1,000 in 20% of firms [Figure 12.16].
- This year we asked large firms with an incentive to participate in a health promotion or health screening program, how effective they believed these incentives were at increasing employee participation. 30% believed incentives were ‘very effective’ and 47% said ‘moderately effective’. [Figure 12.18].
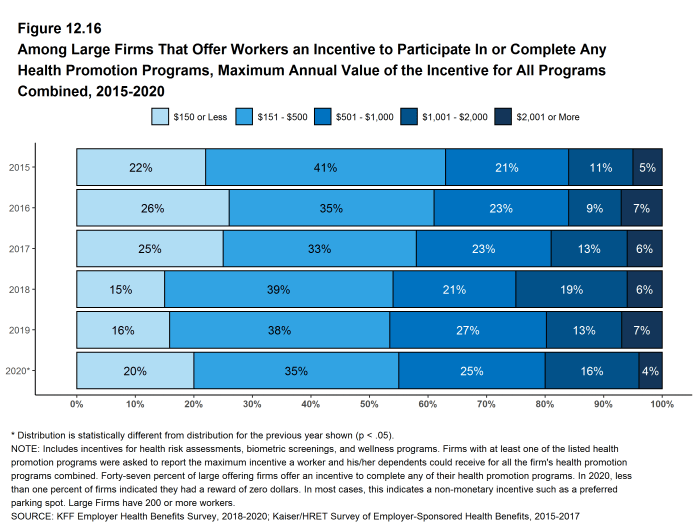
Figure 12.16: Among Large Firms That Offer Workers an Incentive to Participate in or Complete Any Health Promotion Programs, Maximum Annual Value of the Incentive for All Programs Combined, 2015-2020
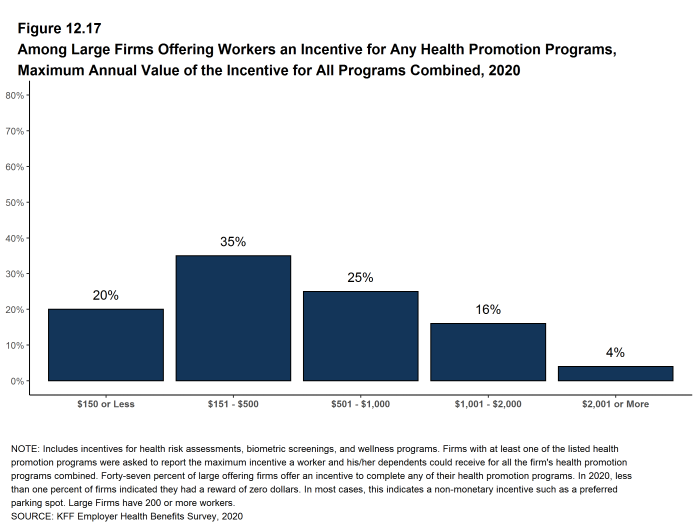
Figure 12.17: Among Large Firms Offering Workers an Incentive for Any Health Promotion Programs, Maximum Annual Value of the Incentive for All Programs Combined, 2020
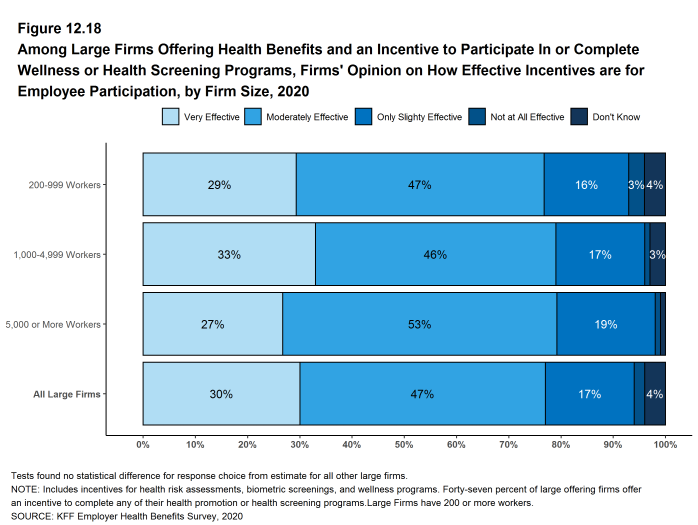
Figure 12.18: Among Large Firms Offering Health Benefits and an Incentive to Participate in or Complete Wellness or Health Screening Programs, Firms’ Opinion On How Effective Incentives Are for Employee Participation, by Firm Size, 2020
EFFECTIVENESS OF WELLNESS AND HEALTH SCREENING PROGRAMS
This year we asked firms offering one or more health promotion or health screening programs whether they believed the programs were effective in meeting certain objectives often offered as reasons to have these programs. Firms offering these programs may have different objectives for different programs, so we offered respondents the opportunity to say that a specific objective was not a goal of their programs.
- Reducing utilization. Sixteen percent of small firms and 8% of large firms said that their programs were very effective in reducing utilization, 33% of small firms and 59% of large firms said that their programs were moderately or only slightly effective, while 8% of small firms and 8% of large firms said that their programs were not at all effective. Among large firms offering a health screening or wellness program, 14% said that reducing utilization was not a program goal and 11% said that they did not know.
- Reducing absenteeism. Twelve percent of small firms and 5% of large firms said that their programs were very effective in reducing employee absenteeism, 31% of small firms and 48% of large firms said that their programs were moderately or only slightly effective, while 13% of small firms and 12% of large firms said that their programs were not at all effective. Among large firms offering a health screening or wellness program, 23% said that reducing absenteeism was not a program goal and 12% said that they did not know.
- Improving enrollee health and well being. Fourteen percent of small firms and 12% of large firms said that their programs were very effective in improving enrollee health and well being, 44% of small firms and 66% of large firms said that their programs were moderately or only slightly effective, while 9% of small firms and 4% of large firms said that their programs were not at all effective. Among large firms offering a health screening or wellness program, 9% said that improving enrollee health and well being was not a program goal and 9% said that they did not know.
- Reducing the firm’s health costs. Sixteen percent of small firms and 11% of large firms said that their programs were very effective in reducing the firm’s health costs, 30% of small firms and 59% of large firms said that their programs were moderately or only slightly effective, while 16% of small firms and 9% of large firms said that their programs were not at all effective. Among large firms offering a health screening or wellness program, 13% said that reducing the firm’s health costs was not a program goal and 8% said that they did not know.
- Being valued by employees as a benefit. Thirty-four percent of small firms and 20% of large firms said that their programs were very effective in being valued by employees as a benefit, 26% of small firms and 61% of large firms said that their programs were moderately or only slightly effective, while 6% of small firms and 5% of large firms said that their programs were not at all effective. Among large firms offering a health screening or wellness program, 7% said that being valued by employees as a benefit was not a program goal and 7% said that they did not know.
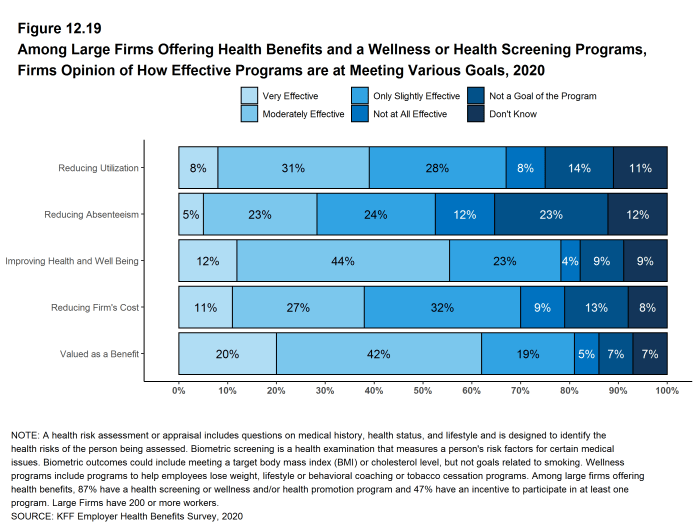
Figure 12.19: Among Large Firms Offering Health Benefits and a Wellness or Health Screening Programs, Firms Opinion of How Effective Programs Are at Meeting Various Goals, 2020
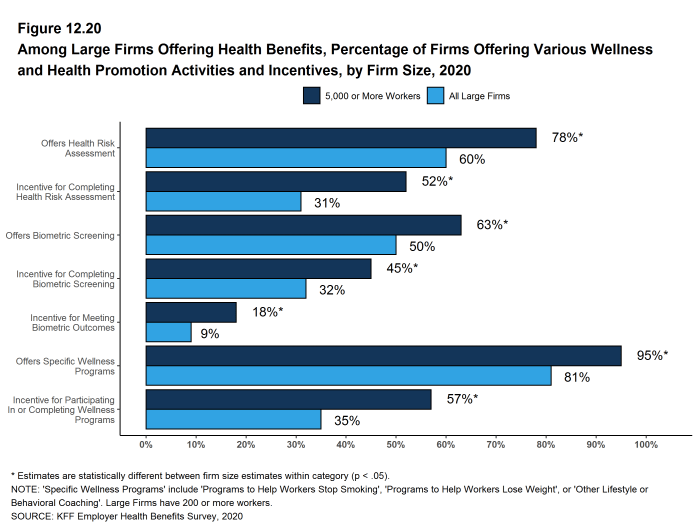
Figure 12.20: Among Large Firms Offering Health Benefits, Percentage of Firms Offering Various Wellness and Health Promotion Activities and Incentives, by Firm Size, 2020
SURCHARGES AND INCENTIVES RELATED TO TOBACCO USE
Some firms require employees that use tobacco products to pay higher premium contributions or cost sharing.
- Nine percent of firms offering health benefits have higher premium contributions or cost-sharing for employees who use tobacco products or vape. Five percent of firms offering health benefits provide employees with some form of direct payment (such as a higher account contribution) based on whether or not an employee uses tobacco products or vapes. Some firms noted that not smoking is a condition of employment.
- Among firms with one of these incentives (higher premium contributions or cost sharing, or direct payments or account contributions), 52% say that the maximum incentive or penalty for an employee based on the employees smoking status was $150 or less, 32% say the maximum amount was between $151 and $500, and 15% say the maximum amount was between $501 and $1,000 [Figure 12.22].
- Among firms with 1,000 or more employees with tobacco cessation programs, 53% say that their program targets people who use electronic cigarettes (known as vaping), 19% say the program does not target vaping, and 28% did not know [Figure 12.23].
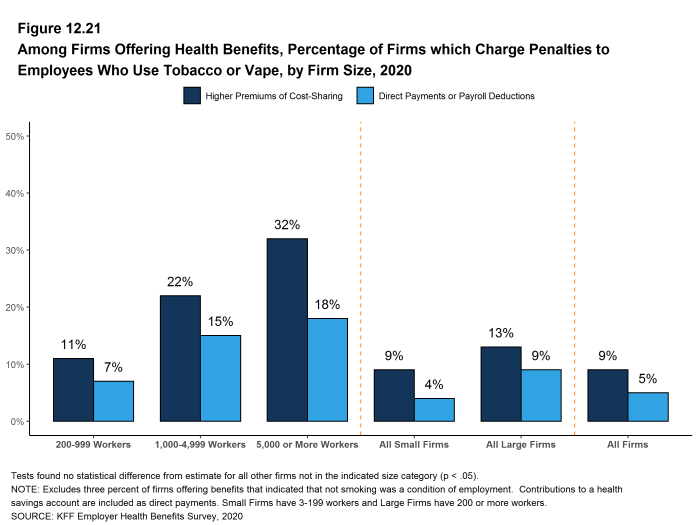
Figure 12.21: Among Firms Offering Health Benefits, Percentage of Firms Which Charge Penalties to Employees Who Use Tobacco or Vape, by Firm Size, 2020
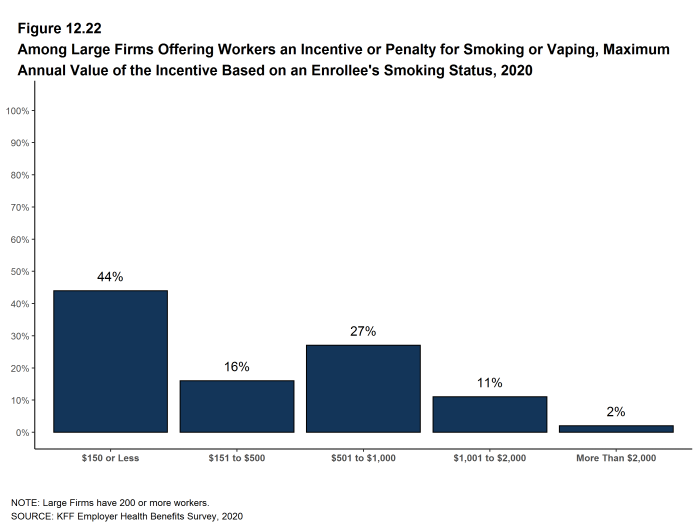
Figure 12.22: Among Large Firms Offering Workers an Incentive or Penalty for Smoking or Vaping, Maximum Annual Value of the Incentive Based On an Enrollee’s Smoking Status, 2020
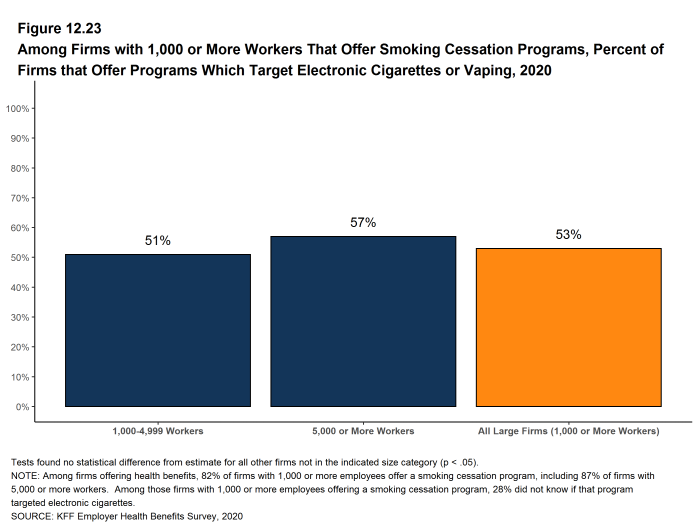
Figure 12.23: Among Firms With 1,000 or More Workers That Offer Smoking Cessation Programs, Percent of Firms That Offer Programs Which Target Electronic Cigarettes or Vaping, 2020
- In 2020, less than one percent of firms indicated that they had an incentive for completing health risk assessments, biometric screenings, or wellness or health promotion programs, but had a maximum incentive of zero dollars. These firms may have non-monetary incentives such as preferred parking spots or employee recognition programs.↩︎
Employer Practices, Alternative Sites of Care and Provider Networks
Employers frequently review and modify their health plans to incorporate new options or adapt to new circumstances. We monitor new options, such as telemedicine, and ask about changes in the health or policy environments. This year employers have been dealing with the coronavirus pandemic, which affects health, access to care, workplace health programs and even open enrollments. Because the survey started fielding in January, before the full impacts of the pandemic became apparent, we did not include questions about employers responses to it this year.
We note that there is a significant increase in the percentage of firms, particularly smaller firms (50-199 workers), reporting that they cover some services through telemedicine. While telemedicine has grown in recent years, it is possible that some of the growth reflects plan changes in response to the coronavirus pandemic as well as to the increased awareness in telemedicine that has occurred over the spring and summer. About one-half of the responses to this year’s survey occurred after March, which is when people began to shelter at home and seek alternative ways to get medical care. It will be important to monitor how plans and employers adapt over the longer term when concerns over the coronavirus have ended.
SHOPPING FOR HEALTH COVERAGE
Fifty-five percent of firms offering health benefits reported shopping for a new health plan or a new insurance carrier in the past year, similar to the percentage last year. Firms with 5,000 or more workers were less likely to shop for coverage (28%) than firms in other size categories [Figure 13.1].
- Among firms that offer health benefits and who shopped for a new plan or carrier in the past year, 15% changed insurance carriers [Figure 13.2].
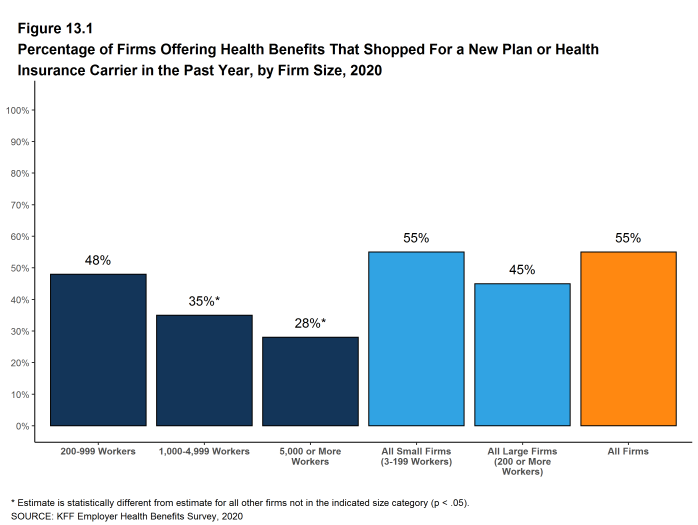
Figure 13.1: Percentage of Firms Offering Health Benefits That Shopped for a New Plan or Health Insurance Carrier in the Past Year, by Firm Size, 2020
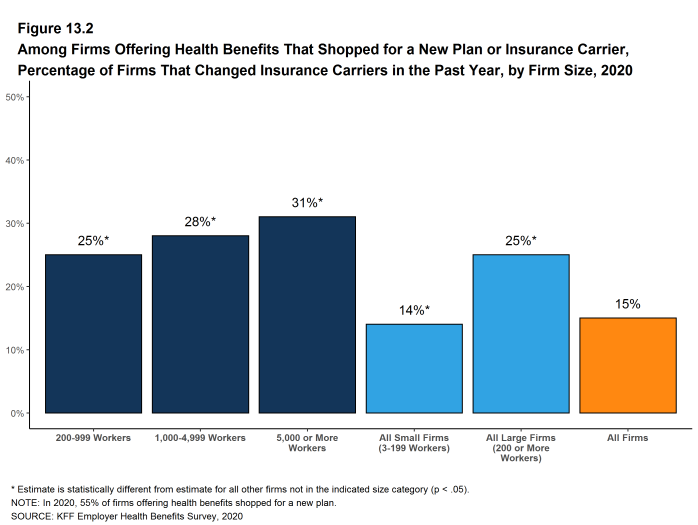
Figure 13.2: Among Firms Offering Health Benefits That Shopped for a New Plan or Insurance Carrier, Percentage of Firms That Changed Insurance Carriers in the Past Year, by Firm Size, 2020
ALTERNATIVE CARE SETTINGS: TELEMEDICINE AND RETAIL CLINICS
Many firms provide coverage for health services delivered outside typical provider settings. Telemedicine is the delivery of health care services through telecommunications to a patient from a provider who is at a remote location, including video chat and remote monitoring. This generally would not include the mere exchange of information via email, exclusively web-based resources, or online information a plan may make available unless a health professional provides information specific to the enrollee’s condition. We note that during the coronavirus pandemic, some plans have eased their definitions to allow more types of digital communication to be reimbursed.
- Eighty-five percent of firms with 50 or more workers that offer health benefits cover the provision of some health care services through telemedicine in their largest health plan, a significant increase from the percentage (69%) in 2019. [Figure 13.3].
- Over the last year, the percentage of small firms (50-199 workers) reporting that they cover services through telemedicine increased from 65% last year to 84% this year and the percentage of large firms increased from 82% to 89% [Figure 13.5].
- Among firms with 50 or more workers with plans that cover health services through telemedicine, 46% provide a financial incentive for workers to use telemedicine instead of visiting a traditional physician’s office in-person, similar to the percentage in 2019 [Figure 13.4].
- Seventy-nine percent of firms with 10 or more employees that offer health benefits cover health care services received in retail clinics, such as those located in pharmacies, supermarkets and retail stores, in their largest health plan [Figure 13.6]. These clinics are often staffed by nurse practitioners or physician assistants and treat minor illnesses and provide preventive services.
- Among firms with 10 or more employees covering health services received in retail clinics in their largest plan, 17% provide a financial incentive for workers to use a retail health clinic instead of visiting a traditional physician’s office [Figure 13.6].
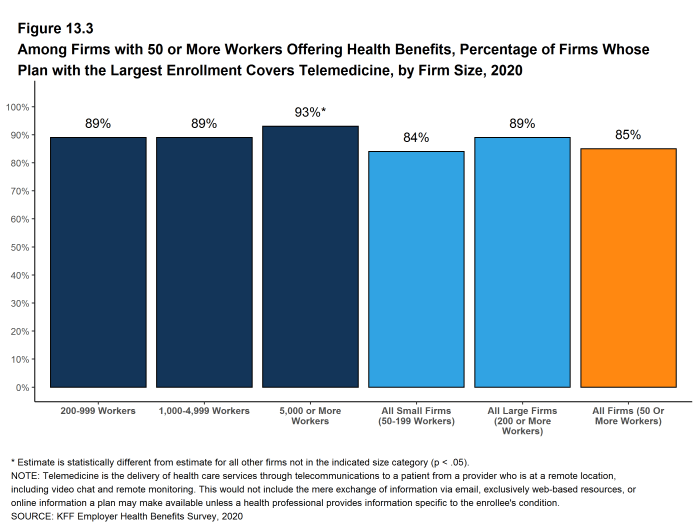
Figure 13.3: Among Firms With 50 or More Workers Offering Health Benefits, Percentage of Firms Whose Plan With the Largest Enrollment Covers Telemedicine, by Firm Size, 2020
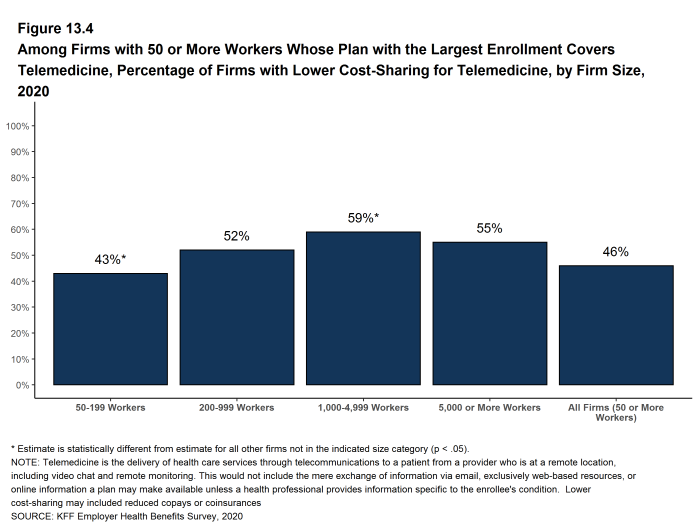
Figure 13.4: Among Firms With 50 or More Workers Whose Plan With the Largest Enrollment Covers Telemedicine, Percentage of Firms With Lower Cost-Sharing for Telemedicine, by Firm Size, 2020
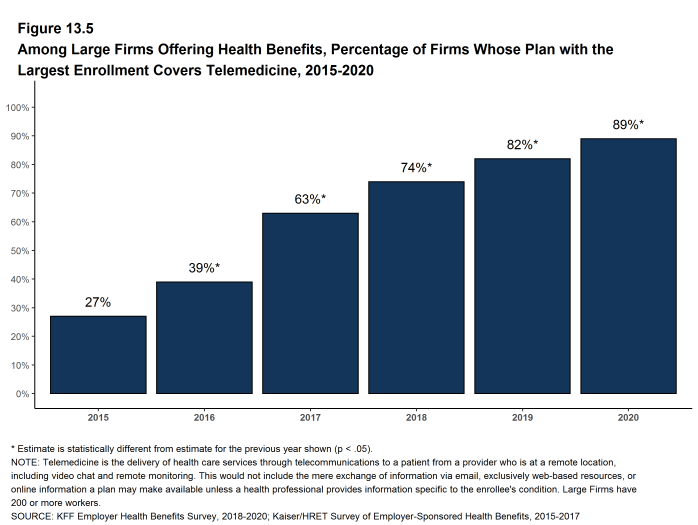
Figure 13.5: Among Large Firms Offering Health Benefits, Percentage of Firms Whose Plan With the Largest Enrollment Covers Telemedicine, 2015-2020
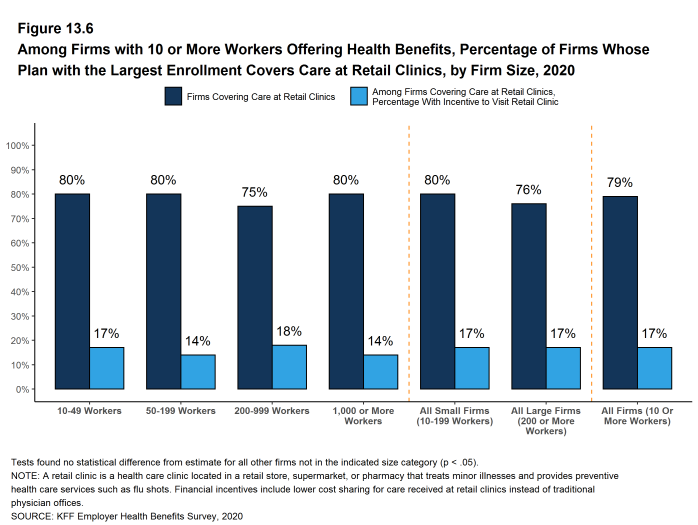
Figure 13.6: Among Firms With 10 or More Workers Offering Health Benefits, Percentage of Firms Whose Plan With the Largest Enrollment Covers Care at Retail Clinics, by Firm Size, 2020
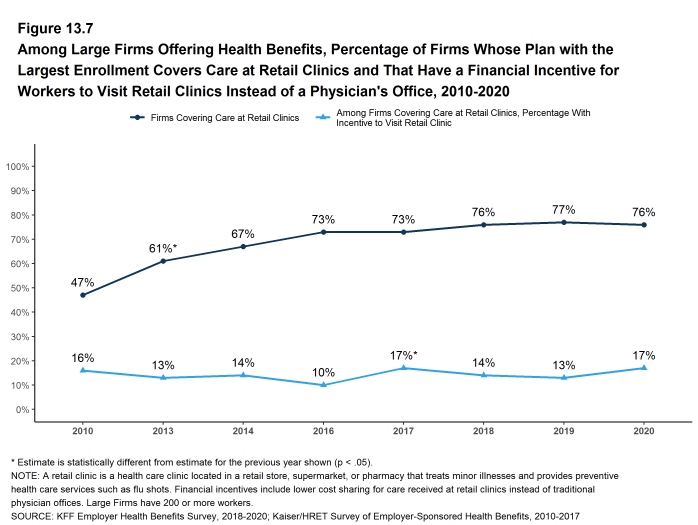
Figure 13.7: Among Large Firms Offering Health Benefits, Percentage of Firms Whose Plan With the Largest Enrollment Covers Care at Retail Clinics and That Have a Financial Incentive for Workers to Visit Retail Clinics Instead of a Physician’s Office, 2010-2020
FIRM APPROACHES TO PLAN NETWORKS
Firms and health plans can structure their networks of providers and their cost sharing to encourage enrollees to use providers who are lower cost or who provide better care. Periodically we ask employers about network strategies, such as using tiered or narrow networks.
- Employers overall report being quite satisfied with the choice of provider networks made available to them by their insurer or plan administrator.
- Among employers offering health benefits, 45% of firms report being ‘very satisfied’ and 38% report being ‘satisfied’ by the choice of provider networks available to them. Large firms are more likely to be ‘very satisfied’ with the available network choices than smaller firms. [Figure 13.8].
- Employers are somewhat less satisfied with the cost of the provider networks available to them from their insurer or administrator. Among employers offering health benefits, only 22% of firms report being ‘very satisfied’ while 39% report being ‘satisfied’ with the cost of provider networks available to them. Small firms are more likely to be ‘very dissatisfied’ with the cost of the provider networks available to them [Figure 13.8].
- One way that employers and health plans can affect the cost and quality of services in their provider networks is to eliminate hospitals or health systems that are not performing well.
- Only a small share (4%) of firms offering health benefits say that either they or their insurer eliminated a hospital or health system from a provider network during the past year in order to reduce the plan’s cost [Figure 13.9].
- Another approach that employers can use is to offer a health plan with a relatively small, or narrow network of providers. Narrow network plans limit the number of providers that can participate in order to reduce costs and generally are more restrictive than standard HMO networks.
- Seven percent of firms offering health benefits report that they offer at least one plan that they considered to be a narrow network plan, similar to the percentage reported last year [Figure 13.9].
- Firms with 5,000 or more workers offering health benefits are more likely than firms of other sizes to offer at least one plan with a narrow network (26%) [Figure 13.9].
- Employers offering health benefits were asked to characterize the breadth of the provider network in their plan with the largest enrollment. Fifty-one percent of firms say that the network in the plan with the largest enrollment is ‘very broad’, 42% say it is ‘somewhat broad’, and 6% say it is ‘somewhat narrow’ [Figure 13.11].
Employees with mental or behavioral health claims disproportionately receive services from providers outside of plan networks.27 The coronavirus pandemic has placed a spotlight on the importance of mental and behavioral health care and access to these services, and many plans have been able to enhance access to these services through telemedicine. We asked employers if they were satisfied with the availability of mental health providers in their provider networks. We note that the survey was conducted between January and July this year, so it is possible that employer views changed over the period as the scope of the pandemic became more apparent and as alternative means of providing services became available.
- Only about one-in-five (22%) employers is very satisfied with the availability of mental health providers in their provider networks. The share does not vary with firm size [Figure 13.8].
- Employers offering health benefits also were asked to characterize the breadth of the network for mental health and substance abuse in their plan with the largest enrollment. Thirty-five percent of firms say that the network for mental health and substance abuse in the plan with the largest enrollment is ‘very broad’, 46% say it is ‘somewhat broad’, 15% say it is ‘somewhat narrow’, and 4% say it is ‘very narrow’. The responses do not vary for by firm size. [Figure 13.11]
- Among employers with 50 or more employees offering health benefits, 9% asked their insurer or third party administrator to increase access to in-network mental health and substance abuse providers over the last two years. Firms with 1,000 or more employees were more likely to request more in-network access for these services [Figure 13.12].
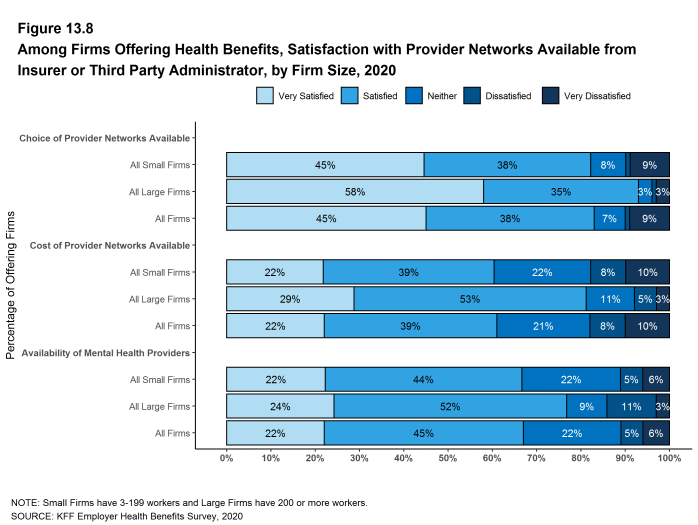
Figure 13.8: Among Firms Offering Health Benefits, Satisfaction With Provider Networks Available From Insurer or Third Party Administrator, by Firm Size, 2020
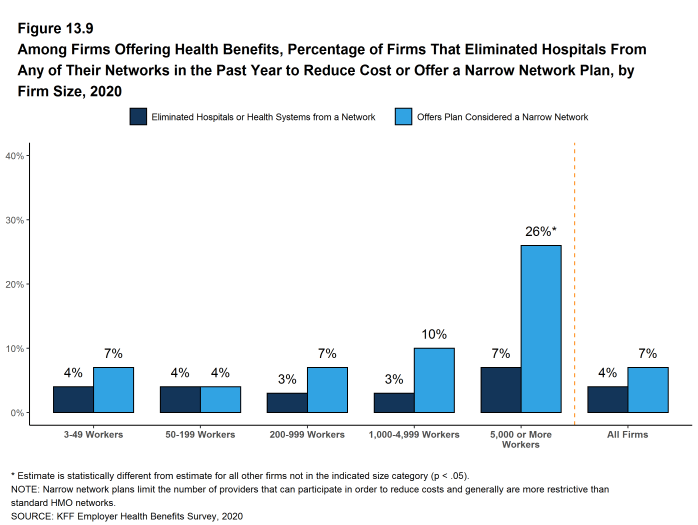
Figure 13.9: Among Firms Offering Health Benefits, Percentage of Firms That Eliminated Hospitals From Any of Their Networks in the Past Year to Reduce Cost or Offer a Narrow Network Plan, by Firm Size, 2020
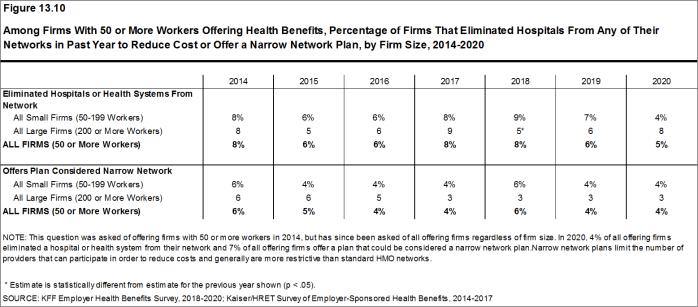
Figure 13.10: Among Firms With 50 or More Workers Offering Health Benefits, Percentage of Firms That Eliminated Hospitals From Any of Their Networks in Past Year to Reduce Cost or Offer a Narrow Network Plan, by Firm Size, 2014-2020
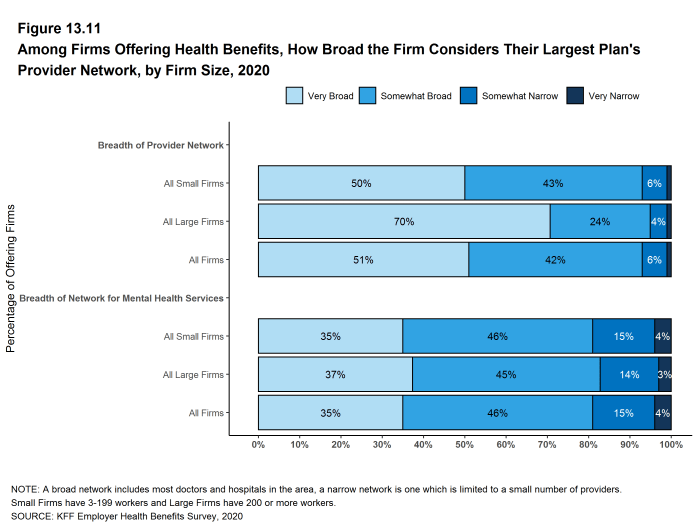
Figure 13.11: Among Firms Offering Health Benefits, How Broad the Firm Considers Their Largest Plan’s Provider Network, by Firm Size, 2020
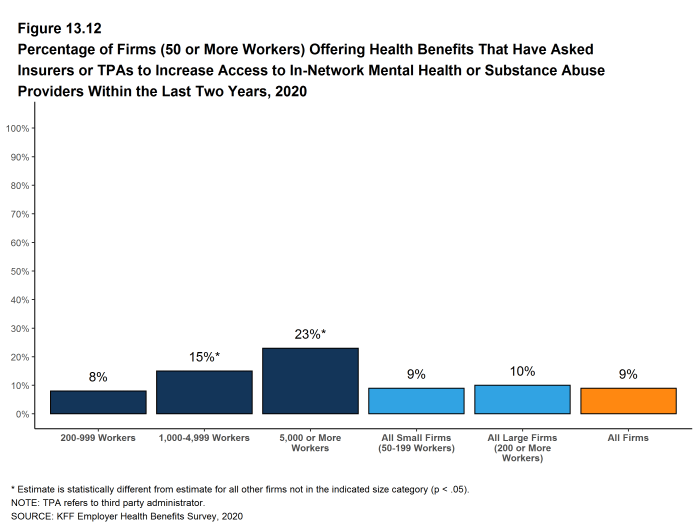
Figure 13.12: Percentage of Firms (50 or More Workers) Offering Health Benefits That Have Asked Insurers or Tpas to Increase Access to In-Network Mental Health or Substance Abuse Providers Within the Last Two Years, 2020
CHRONIC CONDITIONS
In recent years employers and health plans have taken steps to encourage people with chronic illnesses to obtain the services they may need to maintain their health. Efforts may include communications, case and disease management, or reducing financial barriers, such as cost sharing.
- Among employers with 200 or more employees offering health benefits, 21% say that their health plan with the largest enrollment waives cost sharing for some medications or supplies to encourage employees with chronic illnesses to follow their treatment. This likelihood increases with firm size [Figure 13.13].
In 2019, the federal government issued new rules that expanded the number and types of items and services that may be considered preventive by HSA-qualified health plans, which means that plan sponsors may pay for part or all of these services before enrollees meet the plan deductibles in these plans.28
- Among employers with 200 or more employees offering an HSA-qualified health plan, 29% say that they changed the services or products that individuals with chronic conditions could receive without first meeting their deductibles. Firms with 5,000 or more employees (48%) are more likely and firms with 200 to 999 employees are less likely (26%) to say they changed the services or products available before the deductible is met [Figure 13.14].
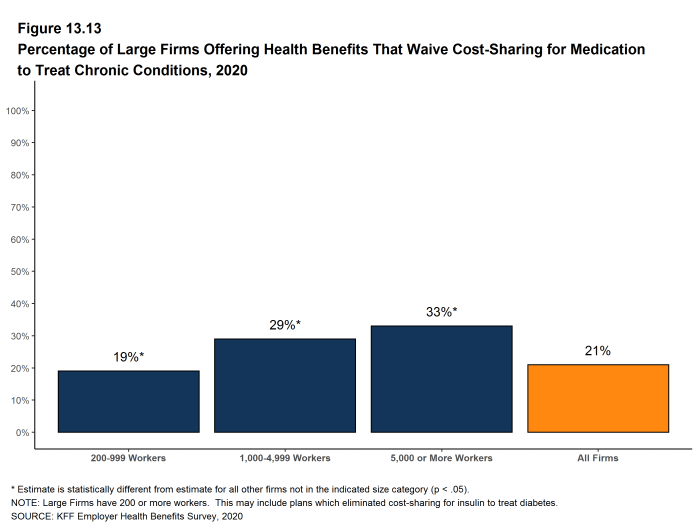
Figure 13.13: Percentage of Large Firms Offering Health Benefits That Waive Cost-Sharing for Medication to Treat Chronic Conditions, 2020
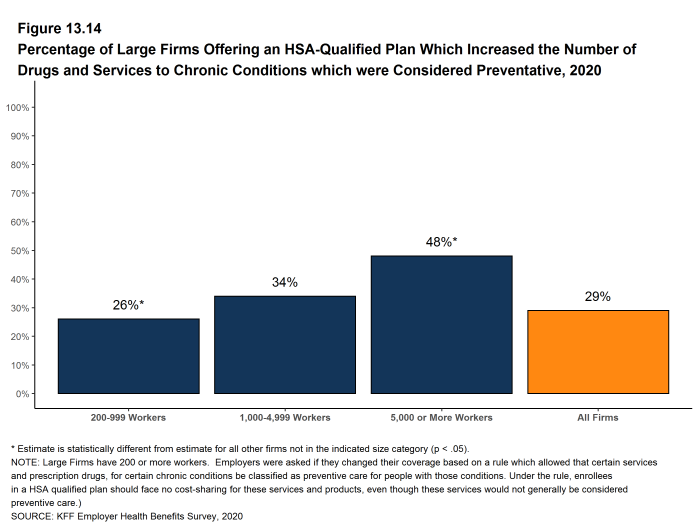
Figure 13.14: Percentage of Large Firms Offering an HSA-Qualified Plan Which Increased the Number of Drugs and Services to Chronic Conditions Which Were Considered Preventative, 2020
LOWER WAGE WORKERS
Some firms help lower-wage workers by reducing or subsidizing their cost sharing liability.
- Among employers with 50 or more employees offering health benefits, 7% have a program that reduces cost sharing for lower-wage workers. Among firms with 50 or more employees offering health benefits that make contributions to workers’ HSA or HRAs, 1% provide larger account contributions for their lower-wage workers [Figure 13.15].
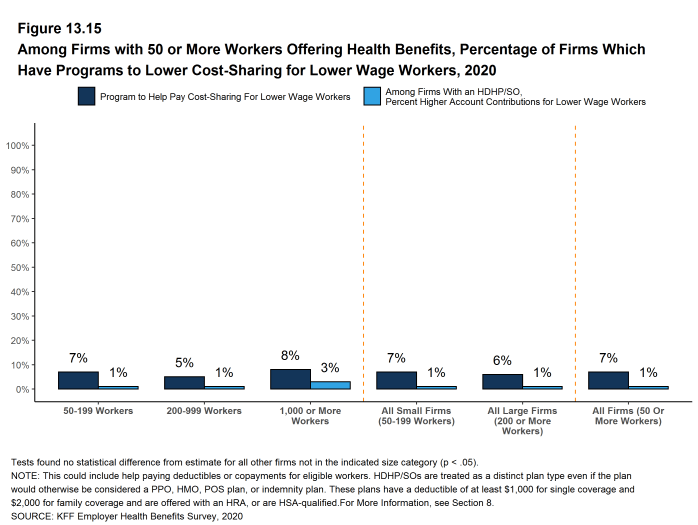
Figure 13.15: Among Firms With 50 or More Workers Offering Health Benefits, Percentage of Firms Which Have Programs to Lower Cost-Sharing for Lower Wage Workers, 2020
PRIVATE EXCHANGES AND DEFINED CONTRIBUTIONS
A private exchange is a virtual market that allows employers to provide their workers with a choice of several different health benefit options, often including voluntary or ancillary benefits options. Private exchanges generally are created by consulting firms, insurers, or brokers, and are different than the public exchanges run by the states or the federal government. There is considerable variation in the types of exchanges currently offered: some exchanges allow workers to choose between multiple plans offered by the same carrier while in other cases multiple carriers participate. Private exchanges have been operating for several years, but enrollment remains modest.
- Five percent of firms offering health benefits with 50 or more workers offer coverage through a private exchange. These firms provide coverage to 5% of covered workers in firms with 50 or more workers. These percentages are similar to those in 2019.
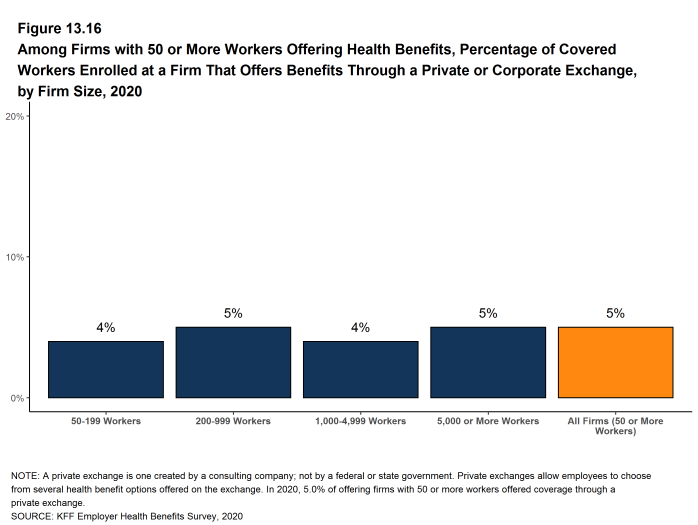
Figure 13.16: Among Firms With 50 or More Workers Offering Health Benefits, Percentage of Covered Workers Enrolled at a Firm That Offers Benefits Through a Private or Corporate Exchange, by Firm Size, 2020
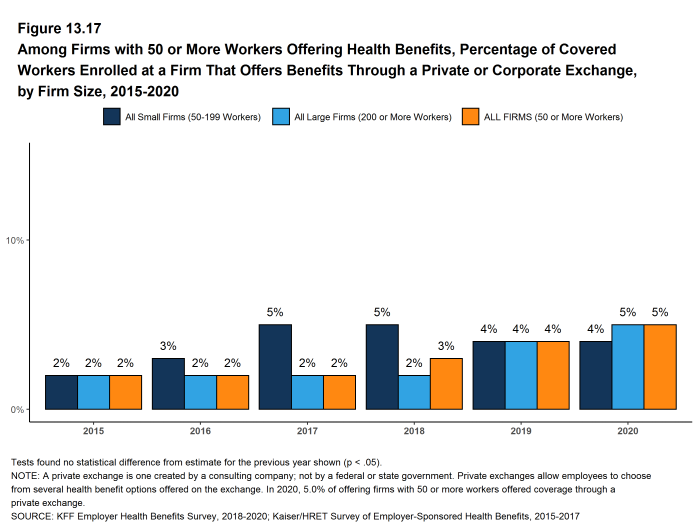
Figure 13.17: Among Firms With 50 or More Workers Offering Health Benefits, Percentage of Covered Workers Enrolled at a Firm That Offers Benefits Through a Private or Corporate Exchange, by Firm Size, 2015-2020
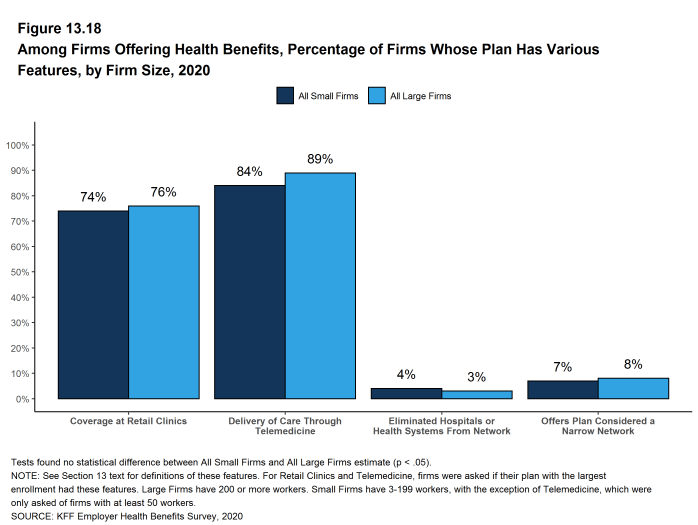
Figure 13.18: Among Firms Offering Health Benefits, Percentage of Firms Whose Plan Has Various Features, by Firm Size, 2020
- Internal Revenue Service. Additional Preventive Care Benefits Permitted to be Provided by a High Deductible Health Plan Under § 223 [Internet]. NOTICE 2019-45; 2019. Available from: https://www.irs.gov/pub/irs-drop/n-19-45.pdf↩︎