Drilling Down on Dental Coverage and Costs for Medicare Beneficiaries
Issue Brief
NOTE: A newer version of this analysis is available here. Due to a data collection and processing issue identified by CMS, the estimates for private dental coverage derived from the 2016 Medicare Current Beneficiary Survey (MCBS) were lower than they should have been by an unknown magnitude. As a result, the estimate of how many beneficiaries lack dental coverage (65%) should not be used. It is not possible to calculate a correct estimate for that year due to the MCBS data collection issue. CMS resolved this issue in 2017. Due to this and other methodological changes in our analysis, estimates of the number of people on Medicare with dental insurance cannot be trended using our 2016 estimate. Please see the methodology here for more information.
Oral health is an integral part of overall health, but its importance to overall health and well-being often goes unrecognized.1 Untreated oral health problems can lead to serious health complications. Having no natural teeth can cause nutritional deficiencies and related health problems.2 Untreated caries (cavities) and periodontal (gum) disease can exacerbate certain diseases, such as diabetes and cardiovascular disease, and lead to chronic pain, infections, and loss of teeth.3 Lack of routine dental care can also delay diagnosis of conditions, which can lead to potentially preventable complications, high-cost emergency department visits, and adverse outcomes.
Medicare, the national health insurance program for about 60 million older adults and younger beneficiaries with disabilities, does not cover routine dental care, and the majority of people on Medicare have no dental coverage at all. Limited or no dental insurance coverage can result in relatively high out-of-pocket costs for some and foregone oral health care for others. This brief reviews the state of oral health for people on Medicare. It describes the consequences of foregoing dental care, current sources of dental coverage, use of dental services, and related out-of-pocket spending.
Key Findings
- Almost two-thirds of Medicare beneficiaries (65%), or nearly 37 million people, do not have dental coverage (Figure 1).
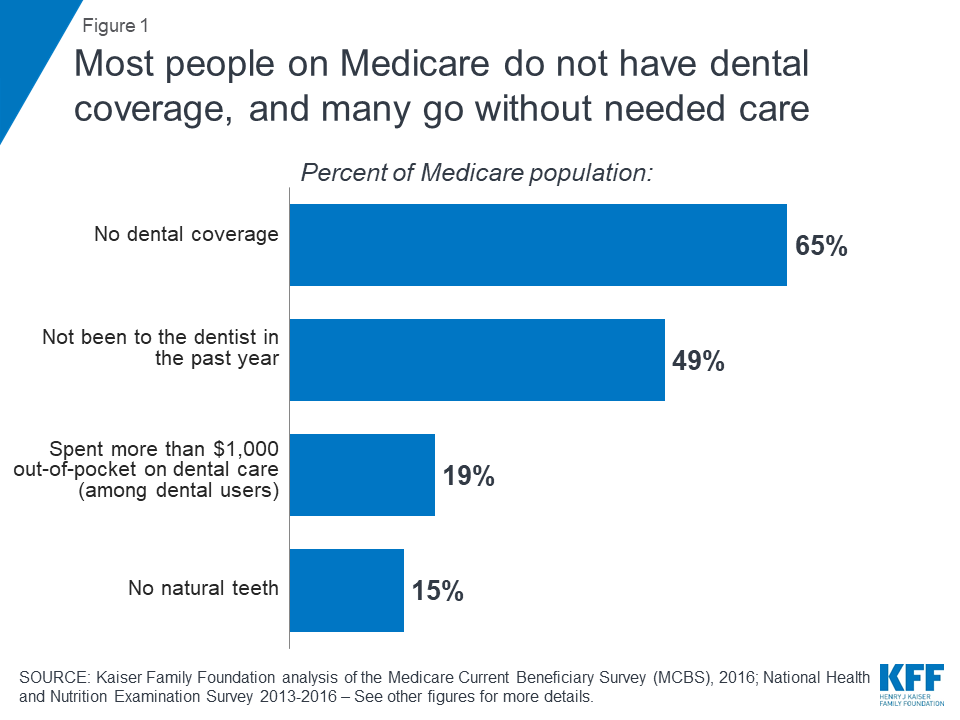
- Almost half of all Medicare beneficiaries did not have a dental visit within the past year (49%), with higher rates among those who are black (71%) or Hispanic (65%), have low incomes (70%), and are living in rural areas (59%), as of 2016.4
- Almost one in five Medicare beneficiaries (19%) who used dental services spent more than $1,000 out-of-pocket on dental care in 2016.
The Health and Economic Consequences of Unmet Need
Numerous studies confirm the direct connection between oral health and overall health.5 ,6 Oral health is often a reflection of the overall health of the body.7 Oral health examinations can identify nutritional deficiencies, HIV, certain microbial infections, and some cancers.8 ,9 In addition to reflecting underlying disease, poor oral health can exacerbate general health issues and systemic diseases. Periodontal disease, or advanced gum disease, is associated with increased risk of cardiovascular diseases, including arteriosclerosis, coronary heart disease, and stroke,10 ,11 ,12 increased risk of mortality for those with chronic kidney disease,13 adverse pregnancy outcomes,14 increased risk of cancer,15 ,16 and poor glycemic control for diabetes.17 ,18 The chronic systemic inflammation and dysbiosis (bacterial imbalances in the mouth) that are characteristic of periodontal disease can exacerbate these conditions. For example, inflammation and dysbiosis may generate immune responses that increase the risk of cancer as well as contribute to insulin resistance that makes diabetes management more difficult.19 ,20 ,21
Oral health issues pose particular concerns for older adults. For example, xerostomia (dry mouth) is a side effect for hundreds of medications. Dry mouth significantly increases the risk of dental caries, loosening dentures that can lead to painful ulcerations, difficulty chewing or swallowing and altered taste, which can negatively impact nutrition, as well as a series of other oral health issues such as recurrent oral thrush and lesions on the oral mucosa.22 Incidence of dry mouth increases with the number of medications used, and is a particular concern for seniors: 54 percent of adults age 65 and older take at least four prescription drugs.23 ,24 ,25
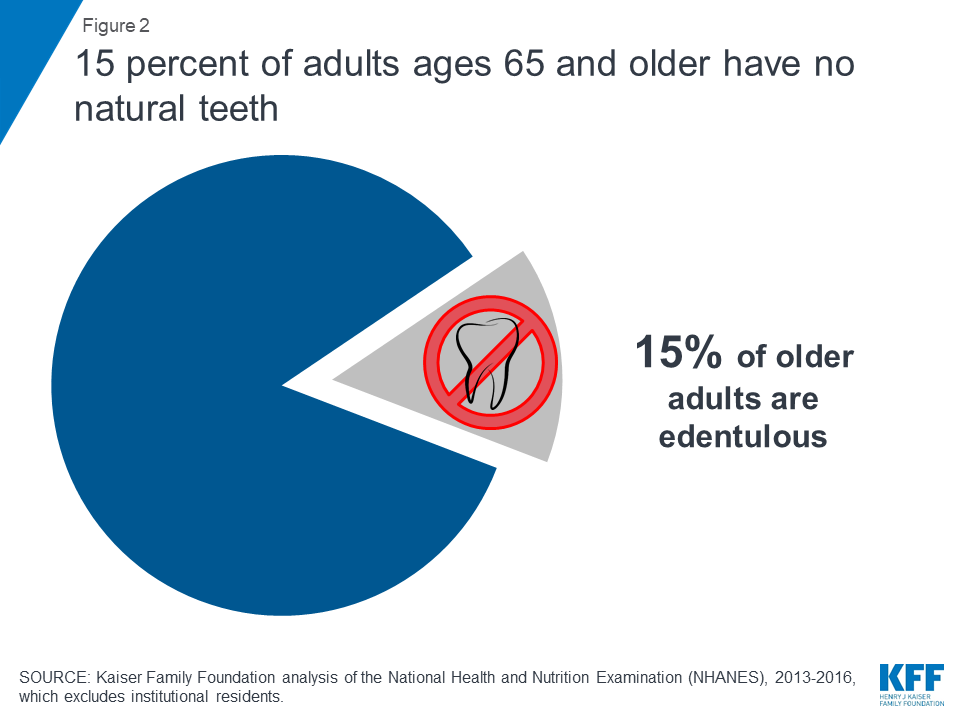
Among adults 65 and older residing in the community, 15 percent are edentulous, meaning they have no natural teeth (Figure 2).26 The share of older adults without natural teeth increases with age, from 12 percent among those 65 to 74 years old to 20 percent for 75 to 80 year olds. Edentulism is also more common among seniors with low incomes. While edentulism among all older adults has declined over time, the greatest declines have been among primarily high income populations.27 For example, almost one in three of those with incomes below 100% of the federal poverty level (30%) have no natural teeth, a rate five times higher than those with incomes over 400% of the federal level (6%).28 There is also significant geographic variation in the number of older adults without teeth. For example, more than 30 percent of seniors in West Virginia have no natural teeth, compared to less than 10 percent in states such as California and Connecticut.29
Having no or few teeth can adversely impact quality of life. Many older adults report being embarrassed about their teeth, avoid smiling, and even reduce social participation due the condition of their mouth and teeth.30 Furthermore, having no or few teeth can make chewing and eating difficult and can lead to additional health complications. Among all Medicare beneficiaries living in the community, 18 percent have some difficulty chewing and eating solid foods due to their teeth – a rate that rises to 29 percent for those with low incomes and 33 percent for adults with disabilities on Medicare who are under age 65.31 Tooth loss also affects nutrition because people without teeth are more likely to substitute easier to chew foods that are high in saturated fat and cholesterol for fruits and vegetables which are harder to chew.32 ,33
Older adults also have high rates of untreated caries and periodontal disease, which negatively affect oral and overall health: more than 14 percent of older adults have untreated caries34 and about 2 in 3 (68%) have periodontal disease.35 If left untreated, caries and periodontal disease can lead to infections, abscesses, tooth loss, and chronic pain.36 Many older adults report having frequent painful aching in their mouths, with 15 percent having painful aching at least occasionally.37
Poor oral health is associated with potentially preventable and costly emergency department (ED) visits, with more than 2 million visits to the ED each year among people of all ages due to oral health complications.38 Many dental-related ED visits are for potentially avoidable, non-traumatic dental conditions and could be treated in a primary care setting.39 ,40 However, further research is needed that focuses specifically on the Medicare population and their use of EDs for dental-related issues, including how lack of dental coverage may impact potentially preventable ED use.
Many People on Medicare Forego Non-Emergency Dental Care
A relatively large share of people on Medicare go without needed dental care. The American Dental Association recommends at least one annual visit per year, but suggests more frequent visits depending on the health status and dental needs of individual patients.41 Yet, almost half of all Medicare beneficiaries did not have a dental visit in 2016 (49%) – with even higher rates reported among those who are black or Hispanic, have low incomes, are in relatively poor health, and live in rural areas (Figure 3).
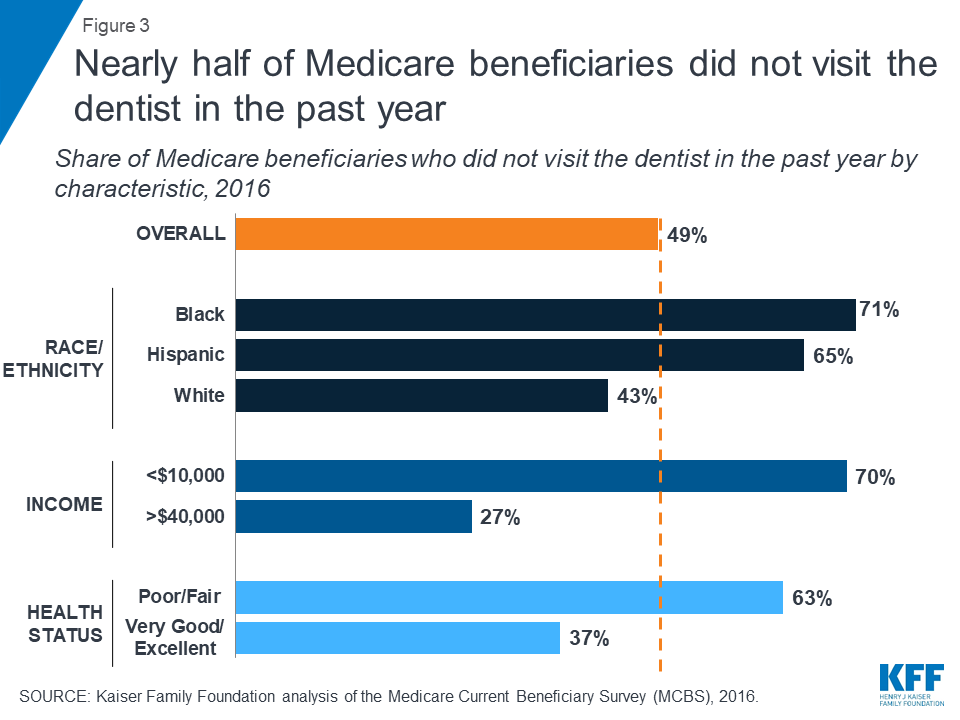
- In 2016, more than seven in ten black beneficiaries (71%) and nearly two in three Hispanic beneficiaries (65%) went without a dental visit in the past year, compared to 43 percent of white beneficiaries;
- Seven in ten beneficiaries living on incomes of less than $10,000 per year (70%) reported not going to the dentist within the past year, compared to 27 percent of beneficiaries with incomes over $40,000 per year;
- More than six in ten beneficiaries in self-reported fair or poor health did not go to the dentist in the past year (63%), as compared to 37 percent of beneficiaries in excellent or very good health;
- More than six in ten beneficiaries younger than 65 with disabilities (62%) went without a dental visit in the past year; and
- Nearly six in ten (59%) beneficiaries living in rural areas did not see a dentist in the past year, compared to 46 percent of beneficiaries living in metropolitan areas.
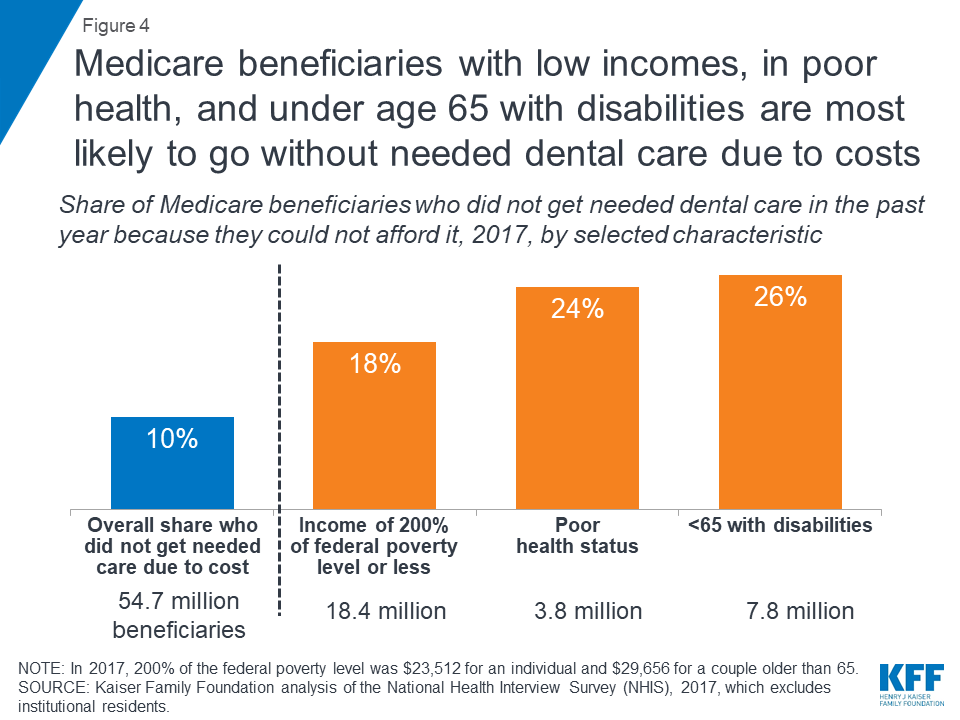
Many Medicare beneficiaries go without dental care due to costs. Overall, 10 percent of all beneficiaries did not get needed dental care in the past year because they could not afford it (Figure 4). The rate was higher among those with low incomes (18%), those in relatively poor health (24%), and beneficiaries under 65 with long-term disabilities (26%). While cost is often cited as top reason for not going to the dentist among those who said they needed care but did not go, fear of the dentist, inconvenient location or time for an appointment are also important contributing factors.42
Older adults also encounter additional challenges accessing oral health care, including dental health professional shortages, transportation challenges, and health literacy issues. Approximately 46 million people of all ages live in dental health professional shortage areas, 66 percent of which are considered rural.43 ,44 Many older adults and adults with disabilities cite transportation as an important barrier to accessing health care, which disproportionately affects certain populations, such as those living in rural areas and those with low-incomes.45 Oral health literacy continues to be an issue as many do not understand the importance of oral health, how to prevent oral health diseases, and how to obtain dental care.46
Beneficiaries with Significant Dental Needs May Incur High Out-of-Pocket Costs, If They Seek Treatment
The vast majority (89%) of beneficiaries who received dental services paid for some of their care out-of-pocket (Figure 5). Across all beneficiaries, average out-of-pocket spending on dental care was $469 in 2016, and among those who used any dental services, average out-of-pocket spending on dental care was $922. Almost one-fifth of beneficiaries who used dental services (19%) spent more than $1,000 out-of-pocket on dental care. With half of Medicare beneficiaries living on less than $26,200 per year, this is a significant portion of their incomes.47 Only a small percentage (11%) used dental services without incurring any out-of-pocket costs. Medicare beneficiaries who used dental services may or may not have had dental insurance, including dental coverage through Medicare Advantage, Medicaid, or private plans.

As might be expected, average out-of-pocket spending on dental care rises with income because higher income beneficiaries are more able to afford such expenses, not because they have greater dental needs. Conversely, lower income beneficiaries are more likely to forego needed dental care. Among dental users, one in four beneficiaries (25%) living on incomes of less than $10,000 per year spent more than $500 out-of-pocket per year on dental care. Among those living on $10,000-$20,000 per year, more than 28 percent spent more than $500 out-of-pocket on dental care. The share of beneficiaries spending more than $500 out-of-pocket on dental care rises to 29 percent for those living on $20,000-$40,000 per year to 34 percent for those living on more than $40,000 per year.
Current Sources of Dental Coverage
Since its establishment in 1965, Medicare has explicitly excluded coverage for dental services, except in very limited circumstances.48 Traditional Medicare does not cover routine preventive dental services (such as exams, cleanings, or x-rays), nor minor and major restorative services (such as fillings, crowns, or dentures; Figure 6).
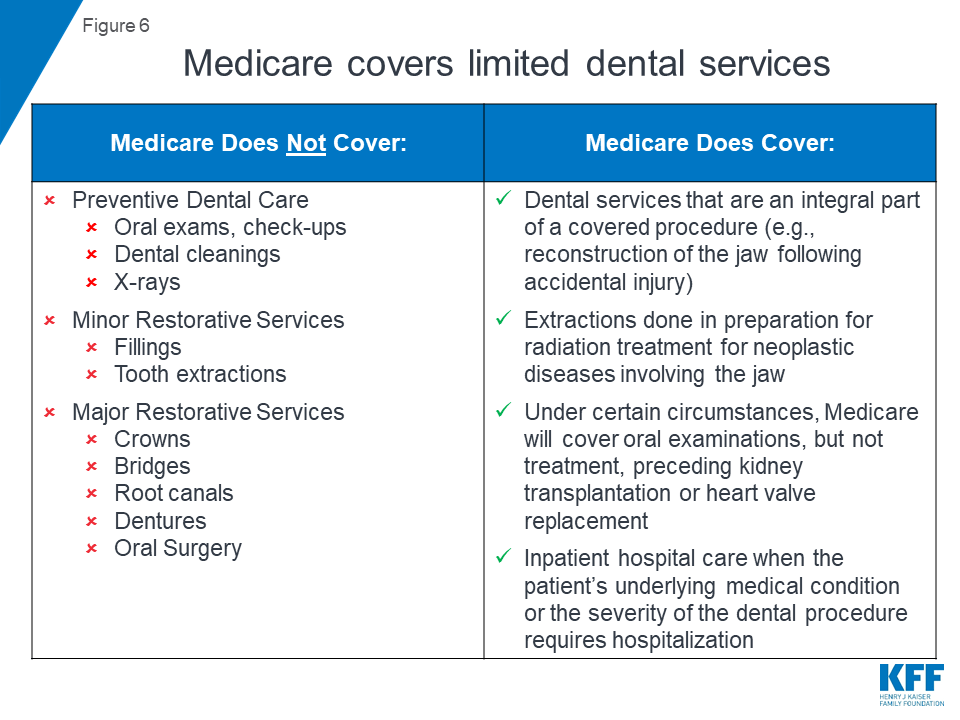
Medicare coverage is limited to dental services that are an integral part of a covered procedure, extractions done in preparation for radiation treatment for cancers involving the jaw, and oral examinations (but not treatment) preceding kidney transplants or heart valve replacements.49 Medicare also covers hospital care (such as emergency department visits) resulting from complications of a dental procedure, but does not cover the cost of the dental care itself.50 Current coverage policy for dental care is not completely clear or consistent, and the Medicare program is reviewing its authority to provide additional services.51
Nearly 37 million people, or almost two in three Medicare beneficiaries (65%), do not have any form of dental coverage (Figure 7). Beneficiaries without any form of dental coverage are more likely than others to go without needed dental care, unless they can afford to cover the costs out-of-pocket.52 ,53

The remaining Medicare beneficiaries have access to dental coverage through Medicare Advantage plans, Medicaid, and private plans, including employer-sponsored retiree plans and individually purchased plans. In 2016, about 10.2 million beneficiaries (18%) had access to some dental coverage through Medicare Advantage (including approximately 1.2 million enrollees who also have access to dental coverage through Medicaid). An estimated 6.2 million low-income Medicare beneficiaries (11%) had access to dental coverage through Medicaid (including the aforementioned who also have coverage through Medicare Advantage plans), and 4.5 million (8%) had coverage through private plans.
Scope of Coverage
The scope of dental coverage and affordability of dental care is an issue for people of all ages. Private dental insurance plans, primarily for working-age adults, vary in terms of benefits and cost-sharing, but typically provide limited coverage for high-cost treatments. Private dental insurance tends to cover most, if not all costs, associated with preventive services, but has less generous coverage for more expensive services, exposing patients to high out-of-pocket costs for needed dental care. For example, in these private dental plans, preventive care is generally 100% covered, while co-insurance for minor and major restorative services often ranges from 20-40% for basic procedures and up to 50% or more for major procedures.54 Further, private dental plans often impose an annual dollar cap on the amount the plan will pay toward covered services, with a median cap of about $1,500.55 Thus, even with dental insurance, people of all ages can face high out-of-pocket costs for dental treatments, an issue that also affects people on Medicare.
In the following sections, we review current sources of dental coverage that may be available to people on Medicare, including Medicare Advantage, Medicaid, and private dental plans (employer-sponsored retiree and individually purchased).
MEDICARE ADVANTAGE
Many Medicare Advantage plans provide access to dental coverage as a supplemental, non-Medicare covered benefit.56 In 2016, 60 percent of Medicare Advantage enrollees, or about 10.2 million beneficiaries, had access to some dental coverage (Figure 8).57 The remaining 40 percent of all Medicare Advantage enrollees, or almost 7 million beneficiaries, did not have access to dental coverage under their plan.
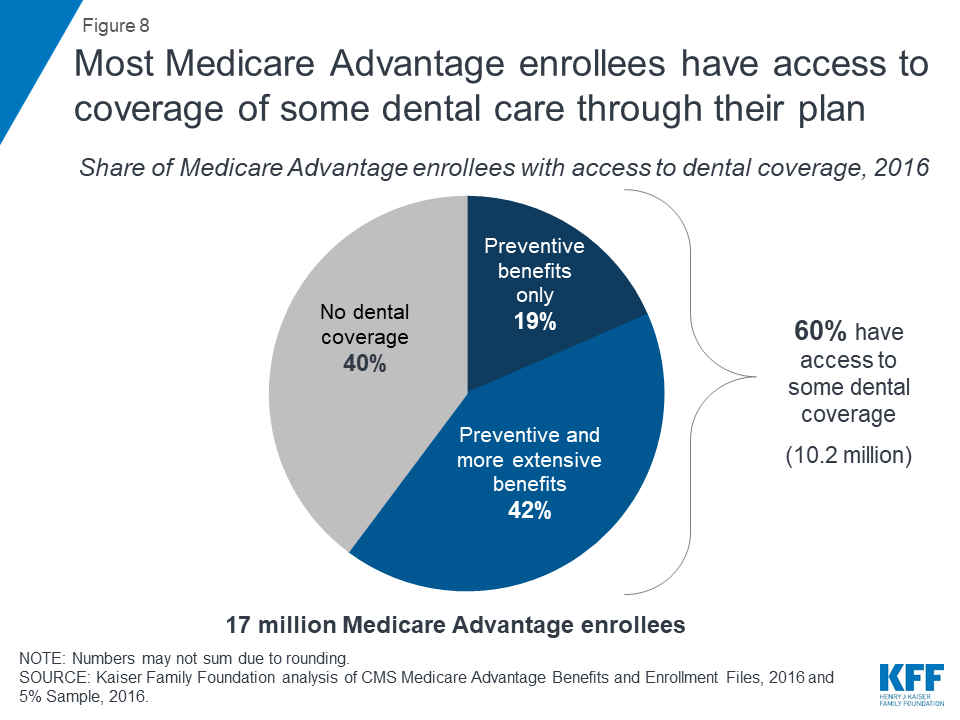
About four in ten (42%) Medicare Advantage enrollees had access to both preventive and more extensive dental benefits, while about one in five (19%) had access to preventive dental benefits only, which would exclude coverage of benefits many older adults need such as fillings, crowns, implants and dentures.58 Preventive dental coverage under Medicare Advantage plans generally includes oral exams, cleanings, fluoride treatments, and dental x-rays.
Additional Premiums for Dental Coverage. Some Medicare Advantage plans charge an additional premium for dental benefits, and enrollees must pay that premium in order to receive the dental coverage. No data are available about how many people take up this option when a premium is required. Overall, almost three in ten (29%) Medicare Advantage enrollees with access to dental benefits under their plan may be required to pay a monthly premium, averaging $284 per year in 2016, for the plan dental benefits. Premiums are more common in plans that offer coverage beyond preventive dental coverage: almost four in ten (38%) enrollees in plans that offered both extensive and preventive dental coverage may be required to pay a premium for that coverage, compared to less than one in ten enrollees (8%) in plans that provided only preventive coverage. Premiums for Medicare Advantage dental benefits in 2016 ranged from about $72 per year to more than $720 per year. Dental premiums are in addition to premiums for other Medicare Advantage benefits, as well as the Medicare Part B premium.
Cost-Sharing. Medicare Advantage plans’ cost-sharing for dental benefits varies widely from plan-to-plan and across counties. Some plans require no cost-sharing for preventive services but charge a monthly premium, while other plans require enrollees to pay a flat co-pay (e.g., $5) for each preventive service. Similarly, for relatively extensive benefits, some plans cover most of the cost of some benefits (e.g., dentures) and others charge a flat coinsurance rate (e.g., 50%) for all services. Plans charge coinsurance rates that often range greatly – from 20-70% – and some plans require flat copayments instead of coinsurance.59
Annual Caps on Coverage and Service Limits. Medicare Advantage plans that offer access to preventive and more extensive dental benefits commonly cap the total amount the plan will pay for dental care. Of the 7 million Medicare Advantage enrollees in plans that offered both preventive and more extensive dental benefits, about four in ten (43%) are in plans with dollar limits on coverage, and most plans had limits around $1,000.60 Coverage limits are far more common among plans that cover both preventive and more extensive benefits than plans that cover only preventive services. In addition to dollar limits, Medicare Advantage plans typically limit the number of services covered (e.g., one periodontal exam every three years).
MEDICAID
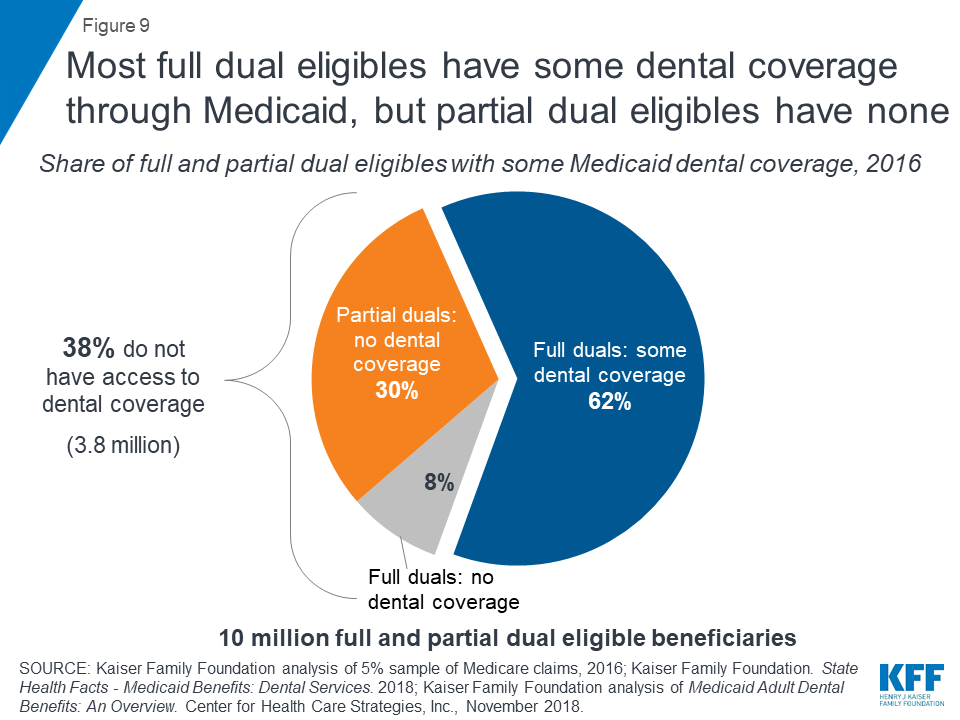
Medicaid is a source of dental coverage for some low-income Medicare beneficiaries dually eligible for Medicaid (known as “dual eligibles”), but only in the states that elect to provide a dental benefit to adults. In 2016, approximately 10 million Medicare beneficiaries qualified for Medicaid, with 7 million qualifying as full dual eligibles and 3 million as partial dual eligibles.61 Full dual eligibles are generally eligible to receive full Medicaid benefits, such as dental, when it is covered by that state, whereas partial dual eligibles generally receive assistance from Medicaid with Medicare premiums and/or cost-sharing, but not other benefits. State Medicaid programs are not required to cover dental benefits for adults because it is an optional benefit, and can choose to provide the benefit to some but not all dual eligibles.
Among full dual eligibles, almost nine in ten (88%) lived in a state where they were eligible for some dental benefits from Medicaid.62 However, the range in covered benefits varies significantly across states. For example, some states only offer preventive benefits, such as Kansas, Maine, and North Dakota, which allow a limited number of exams and cleanings per year. A number of states offer more extensive coverage, but have annual dollar caps on benefits and may require prior authorization for certain procedures. There also some states, such as Georgia and Oklahoma, which limit coverage to emergency dental visits only. States that offer emergency-only benefits may not provide much additional coverage than what is currently covered by traditional Medicare. About one-tenth of dual eligibles (12%), or 800,000 people, resided in the 6 states that provided no dental coverage through Medicaid in 2016 (Alabama, Delaware, Maryland, Tennessee, Texas, Virginia).
In addition to the 800,000 full dual eligibles who do not have dental coverage through Medicaid, another 3 million partial dual eligibles do not have Medicaid dental coverage because they are not eligible for Medicaid-covered benefits. Overall, 3.8 million low-income people who qualify for Medicaid did not have dental coverage through Medicaid in 2016 (Figure 9).
State dental benefits can change over time, particularly in response to budget pressures, since dental coverage for adults is an optional Medicaid benefit. For example, in California, adult dental benefits were cut in 2009 due to budget constraints, partially restored in 2014, and fully restored in 2018.63 ,64 In 2018 and 2019, two states (California, Illinois) enhanced or added dental benefits for all adults, while three states enhanced benefits for certain adult populations (Arizona’s applies to Non-Long Term Services and Supports (LTSS) adults, Utah’s applies to only those with disabilities, and Maryland’s applies only to full dual eligibles). Six states (Alaska, Connecticut, Iowa, Kentucky, Oklahoma, Nevada) restricted adult dental benefits.65
Overlap of Dental Coverage for Dual Eligibles
Some beneficiaries covered by both Medicare and Medicaid are also able to access dental care through Medicare Advantage plans. In total, approximately 2.4 million full and partial dual eligibles (1.4 million full dual eligibles and 1.0 million partial dual eligibles) were enrolled in Medicare Advantage plans that provided access to dental coverage in 2016.66 However, premiums and cost-sharing for dental benefits may still present a significant hurdle and may make the coverage unaffordable, particularly if Medicaid does not cover these costs. About one in ten (11%) dual eligibles were in plans that charged an additional premium for dental coverage, which would be in addition to any cost-sharing for the dental care.
About 1.2 million full dual eligibles lived in states that offer some dental coverage through Medicaid and were enrolled in Medicare Advantage plans that offer access to some dental coverage. While these beneficiaries have more than one option for dental coverage, coordinating Medicaid dental coverage and dental coverage through Medicare Advantage plans, and specifically, figuring out the circumstances under which each coverage option would pay for particular services, can be especially complicated and murky.
PRIVATE INSURANCE
Medicare beneficiaries may also receive dental benefits through private plans such as employer-sponsored retiree plans or through individually purchased plans. In 2016, about 4.5 million Medicare beneficiaries received dental coverage through private plans.67
Unfortunately, data describing dental coverage under employer-sponsored retiree and individually purchased plans for people on Medicare are limited. For example, nearly 10 million beneficiaries in traditional Medicare had employer-sponsored retiree insurance.68 However, there are no known data sources that convey how many of these plans cover dental benefits, or the level of dental coverage these plans provide.
Medicare beneficiaries can purchase individual dental policies directly through companies such as DeltaDental, United Healthcare, Cigna, and BlueCross BlueShield. These plans vary in terms of premiums, covered benefits, cost-sharing requirements, annual service limits, and annual benefit caps. Based upon company websites, annual caps appear to be similar to those offered by Medicare Advantage plans.
Older Adults Can Incur Substantial Out-of-Pocket Costs for Dental Care, Even with Insurance: Three Scenarios
Even with dental insurance, older adults can face substantial out-of-pocket costs for their dental care. While the scope of dental coverage varies, it is often the case that out-of-pocket costs may be relatively low for people who simply need routine check-ups and cleanings. However, people who need more extensive oral health services can incur relatively high costs for their dental care, on top of premiums and other out-of-pocket medical expenses, due to coinsurance requirements and annual caps.
We developed the following scenarios, with input from oral health experts, to demonstrate the range in potential costs older adults may face for common dental services, based on fees obtained from the American Dental Association (ADA) 2018 Survey of Dental Fees. The scenarios, based on national, median fees, are designed to be illustrative, recognizing that fees vary by a number of factors, including geography and the negotiated rates established between dentists and insurers. (See Table 4 for a detailed description of services and fees for each of the three scenarios.)
| Scenario 1: Linda, age 67, is in excellent health and visits her dentist regularly. In a typical year, such as last year, Linda has one dental visit with an oral exam, cleaning, and x-rays, and a follow-up exam and cleaning six months later. |
Without dental coverage, the total cost of Linda’s procedures would be about $350, based on national median fees derived from the 2018 ADA survey of dental fees. If Linda had coverage through a private, dental insurance plan – either a dental plan that she purchased directly or through a Medicare Advantage plan – her out-of-pocket costs would be relatively low because dental insurance often covers a large portion of preventive dental costs. Even if her dental plan capped annual benefits, as many do, she would have limited expenses because annual caps are typically not less than $500. Linda could have paid a premium for her Medicare Advantage dental plan and premiums are on average $284 per year,69 varying based on the extent of coverage and other factors.
If Linda had coverage under both Medicare and Medicaid (dually eligible) and lived in a state that covered adult dental through Medicaid, she would most likely have limited, if any expenses, if she were able to find a dentist who treats Medicaid patients and lived in a state that covers more than one preventive visit per year.
| Scenario 2: James, age 72, went to the dentist after realizing he hadn’t had an oral exam in close to two years. After what he hoped would be a routine check-up and cleaning, his dentist said he would need periodontal treatment, three fillings, and two crowns due to degradation of restorations. After receiving these restorative services, he returned six months later for a regular check-up where he received periodontal maintenance. |
Without dental coverage, the total cost of James’ visits would be an estimated $4,300. If James had dental coverage through a private plan or Medicare Advantage, his costs would be lower, but he would still likely incur substantial costs. Some Medicare Advantage plans, for example, cover only preventive services, which would leave him with the biggest expenses to pay for on his own. Others cover both preventive and more extensive dental care, but require relatively high coinsurance for the most expensive procedures, and often with caps on the annual amount paid by the plan. Medicare Advantage plans often charge coinsurance, which ranges from 20%-70% depending on the type of service.70 If James had signed up for a Medicare Advantage plan, with dental coverage that included a common cap of $1,000, he would be responsible for all charges above the cap, or as much as $3,300.
If James qualified for Medicaid, he could potentially get some help with these expenses, if he lived in a state that covers both preventive and more extensive dental services for older adults.
| Scenario 3: Dorothy, age 80, has diabetes, heart disease, and arthritis, and takes multiple medications to manage her medical conditions, some of which cause dry mouth. Because she was more focused on her other health problems, she had not been to a dentist in three years. Last year, she went to see a dentist at the suggestion of her physician after she complained of a dull throbbing pain in her lower left jaw. After a comprehensive exam and x-rays, her dentist told her that she needed a root canal and crown, and would need to have four upper teeth extracted. Her dentist recommended two implants to replace the extracted teeth, but when she heard what that would cost, she opted instead for a partial upper denture. |
Without dental coverage, Dorothy’s dental bill would be about $4,700, assuming she opted for the less expensive removable partial denture, but closer to $10,000 for 2 implants, if not more, since the estimated costs of the implants exclude fees for the final restorations.71
If Dorothy had coverage through a private plan or Medicare Advantage plan, her costs would be somewhat lower, but by how much would depend on the specific features of her dental plan. With a more extensive plan, she may or may not have coverage for specific services, such as dentures, which is a substantial portion of her bill. Plans typically require coinsurance for these procedures, meaning she would still have to pay a significant amount out of pocket for her care. Plans often have caps on coverage, which means Dorothy would be responsible for all costs above her limit, which would be close to $4,000 in a plan with a $1,000 annual cap, or close to $9,000 if she had chosen the implants, or possibly less if the plan negotiated lower rates.
If Dorothy qualified for Medicaid, she could get some coverage if she lived in one of the states that covers adult dental. However, state annual caps and coverage of certain procedures vary, including for dentures, so she still might pay a substantial amount of money out-of-pocket. Dorothy would also need to make a number of visits to the dentist for these procedures, which could be a barrier for many Medicare beneficiaries, especially those that face transportation challenges.
Discussion
Oral health is important to people of all ages, including older adults and younger Medicare beneficiaries with disabilities, but maintaining good oral health is often challenging. Medicare does not generally cover dental care, which can make dental procedures unaffordable. Some Medicare beneficiaries have access to dental coverage through Medicare Advantage plans, Medicaid, or private plans (employer-sponsored retiree or individually purchased policies), but, similar to private dental plans offered to working-age adults, coverage varies widely, is often less generous for procedures beyond routine preventive care, and is frequently subject to annual caps. Poor dental care and oral health lead to edentulism, untreated caries, and periodontal disease, which contribute to adverse health outcomes and high-cost preventable emergency room visits. These ongoing challenges heighten interest in finding ways to make dental care more affordable and accessible for the Medicare population.
A broad array of policy options could be considered to expand dental coverage to people on Medicare. Some advocates believe that the Centers for Medicare and Medicaid Services (CMS) currently has the authority to cover oral health care when medically necessary for treatment of Medicare-covered diseases, illnesses, and injuries, and at the request of members of Congress, the agency is reviewing this.72 ,73 Legislation that would have a broader scope is also under consideration. For example, during the 115th and 116th Congresses, some have proposed striking the dental exclusion and including dental services as a covered benefit.74 Others have considered a separate, voluntary dental benefit, similar to the Part D prescription drug benefit, with its own premium.75 An alternative approach could be to create a benefit exclusively for low-income beneficiaries, under Medicare or Medicaid. Each of these approaches would have budget implications, and raises questions concerning scope of coverage, cost-sharing, provider fees and administration. Thus far, the Congressional Budget Office has not estimated the cost of adding a dental benefit to Medicare. Given the significant health risks associated with poor oral care and the costs and consequences of untreated dental needs, identifying potential solutions to improve the oral health status of the Medicare population remains a challenge.
Kendal Orgera, a Policy Analyst with the Kaiser Family Foundation, and Anthony Damico, an independent consultant, provided programming support for this brief. The brief also benefited from the research support of Nadia Massad and Robbie Herman of the Howard University College of Dentistry, and comments from reviewers, including Cassandra Yarbrough and Marko Vujicic of the American Dental Association.
This brief was funded in part by the AARP Public Policy Institute.
Data And Methods
Data and Methods
This analysis uses data from the Medicare Current Beneficiary Survey (MCBS), 2016; Medicare Chronic Conditions Data Warehouse data from 5 percent of beneficiaries (5% Sample), 2016; and CMS Medicare Advantage Enrollment, Benefit, and Landscape files, 2016, with enrollment data from March of that year and excluding Puerto Rico. The analysis also uses data from the National Health Interview Survey (NHIS), 2017; National Health and Nutrition Examination Survey (NHANES), 2013-2016; Kaiser Family Foundation database of Medicaid Dental Benefits, 2018; and Center for Health Care Strategies’ (CHCS) Medicaid Adult Benefits data, 2018.
To determine dental coverage in Figure 7, we combined data from multiple sources. The 5% Sample and the Medicare Advantage Benefit files were used to determine the number of Medicare Advantage enrollees with access to dental coverage. Both data sets were restricted to beneficiaries with both Parts A and B in March of 2016 and excluded US territories. The 5% Sample, combined with data from the KFF database of Medicaid Dental Benefits and CHCS, was used to calculate the number of dual eligibles with some dental coverage based on whether they lived in a state that offered dental benefits through Medicaid. 2016 is the most recent year of data available for the 5% Sample and was used to estimate Medicaid dental coverage, based on 2018 dental benefits in each state. Private dental coverage was calculated using the MCBS responses to questions about whether a beneficiary has dental coverage, and the total with private dental coverage includes community beneficiaries who answered affirmatively. Beneficiaries residing in nursing homes and other facilities were not asked the question in the MCBS, which excluded approximately 792,000 non-Medicare Advantage, non-dual beneficiaries; the Medicare Advantage and dual eligible statistics from the 5% Sample include beneficiaries residing in facilities.
To examine the scope of dental coverage offered by Medicare Advantage plans in greater detail, we reviewed 2019 Medicare Advantage plans with the highest enrollment in 6 large metropolitan counties: San Diego, CA; Harris, TX; Cook County, IL; Miami-Dade, FL; Philadelphia, PA; Charleston, SC; and 2 rural counties: Jefferson, OR and Wayne, OH. For this subanalysis, we selected the 8 counties based on geographical region, differences in population and density, where at least 1,000 people were enrolled in Medicare Advantage plans, and at least 3 firms offered plans. In each of the 8 counties, the 3 largest plans offered were selected, with no more than one plan from a firm. The subanalysis examined a variety of aspects of Medicare Advantage plans including premiums, annual caps, coinsurance/co-pays, covered services, networks, sub-contracting of dental networks, among others. Special Needs Plans and Employer-sponsored Group Waiver Plans were excluded.
NHANES 2013-2016 was used to define edentulism as no permanent tooth present and no dental root fragments present. If the tooth was recorded as not being present, it was marked as edentulous. NHANES 2015-2016 was used to define untreated caries. Untreated caries were defined differently in 2013-2014 and 2015-2016, so only 2015-2016 was used in this analysis. Untreated caries were defined as permanent teeth with a carious surface condition. Only individuals with at least one tooth present were included in the analysis. Decay in the root (i.e., root caries) was not included. In both analyses, third molars and dental implants were excluded.
Tables
| Table 1: Medicare Beneficiaries Who Did Not Visit a Dentist in the Past Year and Beneficiaries’ Out-of-Pocket Spending on Dental Care, Among Dental Users | |||||||||
| Number of Medicare Beneficiaries (in millions of people) | No Dental Visit in Past Year | Beneficiaries’ Out-of-Pocket Spending on Dental Care, Among Dental Users | |||||||
| Any Dental Spending(in millions of people) | Total | $0 | $1 – $500 | $501 -$1000 | $1001 -$2000 | $2001 or More | |||
| Overall | 56.4 | 49% | 28.7 | $922 | 11% | 59% | 12% | 8% | 11% |
| Age | |||||||||
| Under 65 years | 8.7 | 62% | 3.3 | $713 | 22% | 60% | 7% | 5% | 7% |
| 65-74 years | 28.0 | 44% | 15.7 | $950 | 10% | 59% | 11% | 9% | 11% |
| 75-84 years | 14.0 | 47% | 7.3 | $966 | 9% | 57% | 14% | 8% | 13% |
| 85+ years | 5.7 | 56% | 2.5 | $894 | 6% | 62% | 14% | 9% | 9% |
| Gender | |||||||||
| Men | 25.7 | 51% | 12.6 | $977 | 10% | 57% | 12% | 9% | 12% |
| Women | 30.7 | 47% | 16.1 | $879 | 11% | 60% | 11% | 8% | 10% |
| Race/Ethnicity | |||||||||
| White | 42.1 | 43% | 23.8 | $964 | 8% | 60% | 12% | 9% | 11% |
| Black | 5.4 | 71% | 1.5 | $706 | 23% | 55% | 7% | 6% | 9% |
| Hispanic | 5.0 | 65% | 1.7 | $661 | 36% | 44% | 7% | 3% | 10% |
| Other | 3.6 | 58% | 1.5 | $733 | 17% | 59% | 11% | 3% | 11% |
| Income | |||||||||
| Less Than $10,000 | 7.3 | 70% | 2.1 | $732 | 23% | 51% | 9% | 8% | 8% |
| $10,000 – $19,999 | 14.2 | 66% | 4.8 | $931 | 16% | 56% | 11% | 8% | 9% |
| $20,000 – $39,999 | 17.7 | 47% | 9.4 | $975 | 9% | 61% | 12% | 7% | 11% |
| $40,0000 or above | 17.2 | 27% | 12.4 | $911 | 7% | 59% | 12% | 9% | 13% |
| Geographic Area | |||||||||
| Metropolitan | 44.9 | 46% | 23.8 | $973 | 11% | 57% | 12% | 8% | 12% |
| Rural Micropolitan | 7.5 | 59% | 3.2 | $745 | 6% | 66% | 9% | 9% | 9% |
Rural Adjacent or Nonadjacent | 4.1 | 69% | 1.7 | $538 | 9% | 69% | 8% | 8% | 6% |
| Health status | |||||||||
| Excellent | 8.8 | 33% | 5.8 | $759 | 10% | 58% | 13% | 11% | 8% |
| Very Good | 15.7 | 40% | 9.4 | $976 | 7% | 59% | 12% | 9% | 13% |
| Good | 15.9 | 52% | 7.6 | $914 | 12% | 60% | 10% | 8% | 10% |
| Fair | 8.5 | 62% | 3.1 | $879 | 17% | 56% | 10% | 5% | 11% |
| Poor | 2.9 | 64% | 1.0 | $718 | 17% | 55% | 9% | 7% | 12% |
| NOTE: Excludes beneficiaries in long-term care facilities as they do not collect data on dental utilization.Numbers may not sum due to rounding. Income numbers have been adjusted to align with the Urban Institute Dynasim model.SOURCE: Kaiser Family Foundation analysis of Medicare Current Beneficiary Survey (MCBS) Cost Supplement, 2016. | |||||||||
| Table 2: Medicare Beneficiaries Who Needed Dental Care, But Could Not Afford It, by Selected Characteristics | ||
| Number of Medicare Beneficiaries(in millions) | Share Who Could Not Afford Dental Care in theLast 12 Months | |
| Overall | 54.7 | 10% |
| Age | ||
| Under 65 years | 7.8 | 26% |
| 65-74 years | 27.3 | 9% |
| 75-84 years | 14.4 | 6% |
| 85+ years | 5.2 | 4% |
| Gender | ||
| Men | 24.5 | 10% |
| Women | 30.2 | 11% |
| Race/Ethnicity | ||
| White | 41.7 | 9% |
| Black | 5.6 | 12% |
| Hispanic | 4.8 | 15% |
| Other | 2.7 | 10% |
| Income | ||
| <100% FPL | 6.3 | 19% |
| 100-200% FPL | 12.0 | 18% |
| 200-400% FPL | 17.5 | 9% |
| 400%+ FPL | 18.9 | 4% |
| Health status | ||
| Excellent/Very Good | 22.7 | 5% |
| Good/Fair | 28.2 | 12% |
| Poor | 3.8 | 24% |
| NOTE: Numbers may not sum due to rounding. In 2017, 100% of the federal poverty level was $11,756 for an individual and $14,828 for a couple older than 65.SOURCE: Kaiser Family Foundation analysis of the National Health Interview Survey (NHIS), 2017, which excludes institutional residents. | ||
| Table 3: Dental Benefits for Dual Eligibles Under Medicaid and for Medicare Advantage Enrollees (in thousands of beneficiaries) | ||||||
| Dental Benefits for Dual Eligibles Under Medicaid | Dental Benefits for Medicare Advantage Enrollees | |||||
| State | Dental Benefit Covered | Total Dual Eligibles* | Full Dual Eligibles with Some Dental Benefits | Limits on Services | Total Medicare Advantage Enrollment | % With Access to Dental Coverage |
| National | 9,995 | 6,218 | 16,925 | 60% | ||
| Alabama | No | 203 | 0 | No dental benefit | 255 | 60% |
| Alaska | Yes | 15 | 15 | Must have PA | N/A | N/A |
| Arizona | Yes | 185 | 138 | $1000 limit for emergency dental services, $1000 comprehensive benefit for ALTCS members | 433 | 61% |
| Arkansas | Yes | 129 | 32 | Limited mix of services -fewer than 100 diagnostic, preventive, and minor restorative procedures; annual expenditure for care is $1,000 or less | 120 | 74% |
| California | Yes | 1,278 | 1,238 | $1,800 cap on services/year; does not apply to emergency services or to residents of nursing facilities, cap can be exceeded with PA | 2,229 | 57% |
| Colorado | Yes | 108 | 67 | $1,000 benefit maximum. Limitations apply depending on the dental procedure. | 288 | 45% |
| Connecticut | Yes | 167 | 73 | $1000 annual benefit maximum unless medically necessary. Also excludes dental surgery, dentures and some dental treatment. | 167 | 78% |
| Delaware | No | 28 | 0 | No dental benefit | 17 | 66% |
| DC | Yes | 30 | 20 | Some procedures require PA | 12 | 71% |
| Florida | Yes | 764 | 371 | Problem focused visits, extractions, pain management, and dentures based on medical necessity | 1,644 | 72% |
| Georgia | Yes | 294 | 125 | Emergency dental visits only | 508 | 71% |
| Hawaii | Yes | 31 | 37 | Emergency treatment | 115 | 44% |
| Idaho | Yes | 45 | 27 | No limits | 90 | 58% |
| Illinois | Yes | 329 | 283 | Extensive mix of services – more than 100 diagnostic, preventive, and minor and major restorative procedures; annual expenditure cap for care is at least $1,000 | 408 | 52% |
| Indiana | Yes | 191 | 110 | PA for specified services Exam and cleaning 1/year (2/year for nursing facility residents), x-rays vary by type, periodontia limited | 277 | 65% |
| Iowa | Yes | 84 | 65 | Extensive mix of services – more than 100 diagnostic, preventive, and minor and major restorative procedures; annual expenditure cap for care is at least $1,000 | 99 | 34% |
| Kansas | Yes | 61 | 38 | 1 exam/cleaning per 6 months; x-rays vary by type;1 crown per 5 years | 66 | 83% |
| Kentucky | Yes | 164 | 87 | Comprehensive exam – 1 per year, x rays vary by type, prophylaxis limited by age, all other limited by age | 227 | 58% |
| Louisiana | Yes | 206 | 108 | Limited to following services: Examination; Radiographs; Complete Dentures Denture relines Denture repairs; Acrylic Partial Dentures | 250 | 92% |
| Maine | Yes | 84 | 49 | 2 exams with cleaning/year but only 1 in 150 days; 1 orthodontia treatment | 75 | 61% |
| Maryland | No | 137 | 0 | No dental benefit | 90 | 68% |
| Massachusetts | Yes | 297 | 275 | No limits | 247 | 26% |
| Michigan | Yes | 295 | 248 | Frequency limits on most services. Some services require PA. | 624 | 43% |
| Minnesota | Yes | 133 | 116 | Non-pregnant adults receive limited benefits. Exams and cleanings limited to 4 times per year; x-rays vary by type | 505 | 40% |
| Mississippi | Yes | 161 | 78 | $2500 annual maximum | 83 | 98% |
| Missouri | Yes | 171 | 132 | Traditional Medicaid Adults have dental coverage under a limited dental package | 334 | 85% |
| Montana | Yes | 26 | 16 | $1,125 annual maximum benefit; Aged, Blind, Disabled not subject to annual cap; Diagnostic, Preventive, and Anesthesia don’t count toward cap | 40 | 57% |
| Nebraska | Yes | 39 | 34 | Dental coverage limited to $750 per fiscal year, excludes emergencies | 38 | 31% |
| Nevada | Yes | 53 | 26 | Emergency-Only | 153 | 85% |
| New Hampshire | Yes | 30 | 19 | Emergency-Only | 22 | 29% |
| New Jersey | Yes | 199 | 172 | No limits | 245 | 35% |
| New Mexico | Yes | 85 | 51 | Most restorative services such as crowns are not covered for adults | 120 | 36% |
| New York | Yes | 805 | 663 | Extensive mix of services – more than 100 diagnostic, preventive, and minor and major restorative procedures; annual expenditure cap for care is at least $1,000 | 1,240 | 59% |
| North Carolina | Yes | 313 | 238 | Yes – Not Specified | 541 | 48% |
| North Dakota | Yes | 14 | 11 | 1 exam/evaluation per year 1 panoramic radiographic image every 5 years; 1 prophylaxis per year; 2 fluoride per year | 22 | 17% |
| Ohio | Yes | 333 | 211 | Comprehensive adult dental coverage. Certain services require PA. | 734 | 68% |
| Oklahoma | Yes | 111 | 90 | Emergency Extractions only | 116 | 59% |
| Oregon | Yes | 124 | 78 | Prevention of dental disease states, limits on denture, crown, and periodontal coverage. | 337 | 53% |
| Pennsylvania | Yes | 441 | 354 | Dental services limited to: Dentures – 1 per lifetime; Exams/prophylaxis – 1 per 180 days; Crowns, Periodontics, Endodontics only approved via exception | 1,017 | 69% |
| Rhode Island | Yes | 38 | 31 | Not all codes covered | 72 | 81% |
| South Carolina | Yes | 149 | 122 | Limited mix of services -fewer than 100 diagnostic, preventive, and minor restorative procedures; annual expenditure for care is $1,000 or less | 221 | 91% |
| South Dakota | Yes | 20 | 12 | $1,000 annual limit (emergency, preventive services, dentures exempt from $1,000 limit). | 31 | 25% |
| Tennessee | No | 274 | 0 | No dental benefit | 442 | 68% |
| Texas | No | 670 | 0 | No dental benefit | 1,161 | 52% |
| Utah | Yes | 35 | 28 | Pregnant, Blind or Disabled adult Medicaid members are allowed dental services. All others receive Emergency Dental Services only. | 119 | 77% |
| Vermont | Yes | 28 | 20 | $510 per year for non-pregnant adults; limits on treatment for TMJ disorders and prophylaxis; Certain services required PA | 10 | N/A |
| Virginia | No | 183 | 0 | No dental benefit | 218 | 68% |
| Washington | Yes | 184 | 127 | Some may require PA | 359 | 75% |
| West Virginia | Yes | 80 | 46 | Emergency services only | 102 | 41% |
| Wisconsin | Yes | 160 | 138 | 1 Exam/cleaning per year, certain services require PA | 402 | 44% |
| Wyoming | Yes | 10 | 7 | Preventive and emergency services only. No restorative | 2 | N/A |
| NOTES: Numbers may not sum due to rounding; numbers rounded to nearest thousands. N/A denotes sample size is too small to be reliable with fewer than 2,000 beneficiaries in the cell.*Includes Partial Dual Eligibles with No Coverage; PA – Prior Authorization2016 is the most recent year of data available for the 5% Sample of Medicare claims and was used to estimate Medicaid dental coverage, based on 2018 dental benefits in each state.6 States in the Kaiser Family Foundation analysis of state Medicaid benefits were listed as NR (No Response): IL, IA, NV, NH, NY, SC; in the Limits on Services section, AR was also listed as NR. State Medicaid benefits in these states came from the CHCS data.SOURCE: Kaiser Family Foundation analysis of the 5% Sample of Medicare claims, 2016; Kaiser Family Foundation. State Health Facts – Medicaid: Dental Benefits. 2018; The Center for Health Care Strategies. Medicaid Adult Dental Benefits: An Overview. Updated November 2018. | ||||||
| Table 4: Three Scenarios: Costs of Dental Procedures | ||
| Dental Treatment Scenarios | Services Received | National Median Fees |
| Scenario 1 | ||
| Linda, age 67, is in excellent health and visits her dentist regularly. In a typical year, such as last year, Linda has one dental visit with an oral exam, cleaning, and x-rays, and a follow-up exam and cleaning six months later. | First Preventive Dental Visit | |
| Periodic Oral Exam (D0120) | $53 | |
| Prophylaxis (D1110) | $95 | |
| 4 Bitewing Radiographs Every 24-36 months (D0274) | $67 | |
| Second Preventive Dental Visit | ||
| Periodic Oral Exam (D0120) | $53 | |
| Prophylaxis (D1110) | $95 | |
| Total Cost | $363 | |
| Scenario 2 | ||
| James, age 72, went to the dentist after realizing he hadn’t had an oral exam in close to two years. After what he hoped would be a routine check-up and cleaning, his dentist said he would need periodontal treatment, three fillings, and two crowns due to degradation of restorations. After receiving these restorative services, he returned six months later for a regular check-up where he received periodontal maintenance. | First Dental Visit | |
| Periodic Oral Exam (D0120) | $53 | |
| Periodontal Scaling and Root Planing – Four or MoreTeeth per Quadrant (D4341) ($259×4) | $1,036 | |
| 4 Bitewing Radiographs Every 6-18 months (D0274) | $67 | |
| Follow-Up Restorative Dental Visits | ||
| #13 DO-Resin Based Composite-2 Surfaces Posterior (D2392) | $239 | |
| #14 MO-Resin Based Composite-2 Surfaces Posterior (D2392) | $239 | |
| #29 MOD-Resin Based Composite-3 Surface Posterior (D2393) | $290 | |
| #3 Crown-Porcelain Fused to Noble Metal (D2752) | $1,108 | |
| #30 Crown-Porcelain Fused to Noble Metal (D2752) | $1,108 | |
| Second Preventive Dental Visit | ||
| Periodic Oral Exam (D0120) | $53 | |
| Periodontal Maintenance (D4910) | $145 | |
| Total Cost | $4,338 | |
| Scenario 3 | ||
| Dorothy, age 80, has diabetes, heart disease, and arthritis, and takes multiple medications to manage her medical conditions, some of which cause dry mouth. Because she was more focused on her other health problems, she had not been to a dentist in three years. Last year, she went to see a dentist at the suggestion of her physician after she complained of a dull throbbing pain in her lower left jaw. After a comprehensive exam and x-rays, her dentist told her that she needed a root canal and crown, and would need to have four upper teeth extracted. Her dentist recommended two implants to replace the extracted teeth, but when she heard what that would cost, she opted instead for a partial upper denture. | First Dental Visit | |
| Comprehensive Oral Examination (D0150) | $85 | |
| Panoramic X-Ray (D0330) | $118 | |
| FMX (D0120) | $138 | |
| Treatment Planning (D9450) | $135 | |
| Prophylaxis (D1110) | $95 | |
| Follow-Up Restorative Dental Visits | ||
| Endodontic Therapy, Molar #19 (D3330) | $1,075 | |
| Crown #19 – Porcelain Fused to Noble Metal (D2752) | $1,108 | |
| 4 Extractions (D7140) ($180 x 4) | $720 | |
| Maxillary Partial Denture with Resin Denture Bases (including any conventional clasps, rests, and teeth) (D5211) | $1,300 | |
| Total Cost | $4,774 | |
| NOTE: Fees do not assume negotiated discounts between dental providers and insurers.SOURCE: Kaiser Family Foundation analysis of the American Dental Association, 2018 Survey of Dental Fees, (Chicago, IL: American Dental Association, Health Policy Institute, 2018). | ||
Endnotes
- U.S. Department of Health and Human Services. Oral Health in America: A Report of the Surgeon General. Rockville, MD: U.S. Department of Health and Human Services, National Institute of Dental and Craniofacial Research, National Institutes of Health, 2000. ↩︎
- Ibid. ↩︎
- Ibid. ↩︎
- Dental utilization rates are not consistent across nationally representative datasets and may vary depending on populations of interest and how utilization is measured. ↩︎
- U.S. Department of Health and Human Services. Oral Health in America: A Report of the Surgeon General. Rockville, MD: U.S. Department of Health and Human Services, National Institute of Dental and Craniofacial Research, National Institutes of Health, 2000. ↩︎
- IOM (Institute of Medicine) and NRC (National Research Council). 2011. Improving access to oral health care for vulnerable and underserved populations. Washington, DC: The National Academies Press. ↩︎
- U.S. Department of Health and Human Services. Oral Health in America: A Report of the Surgeon General. Rockville, MD: U.S. Department of Health and Human Services, National Institute of Dental and Craniofacial Research, National Institutes of Health, 2000. ↩︎
- Ibid. ↩︎
- IOM (Institute of Medicine) and NRC (National Research Council). 2011. Improving access to oral health care for vulnerable and underserved populations. Washington, DC: The National Academies Press. ↩︎
- Schenkein HA, Loos BG. Inflammatory mechanisms linking periodontal diseases to cardiovascular diseases. J Clin Periodontol 2013;40 (Suppl. 14):S51–S69 https://onlinelibrary.wiley.com/doi/epdf/10.1111/jcpe.12060 ↩︎
- Tonetti MS, Van Dyke TE. Periodontitis and atherosclerotic cardiovascular disease: consensus report of the Joint EFP/AAP Workshop on Periodontitis and Systemic Diseases. J Clin Periodontol 2013;40 (Suppl. 14):S24–S29. https://onlinelibrary.wiley.com/doi/epdf/10.1111/jcpe.12089 ↩︎
- Dietrich T, Sharma P, Walter C, Weston P, Beck J. The epidemiological evidence behind the association between periodontitis and incident atherosclerotic cardiovascular disease. J Clin Periodontol 2013;40 (Suppl. 14):S70–S84. https://onlinelibrary.wiley.com/doi/10.1111/jcpe.12062 ↩︎
- Sharma P, Dietrich T, Ferro CJ, Cockwell P, Chapple ILC. Association between periodontitis and mortality in stages 3–5 chronic kidney disease: NHANES III and linked mortality study. J Clin Periodontol 2016;43:104–113. https://onlinelibrary.wiley.com/doi/10.1111/jcpe.12502 ↩︎
- This may impact women who are under 65 with disabilities on Medicare. Madianos PM, Bobetsis YA, Offenbacher S. Adverse pregnancy outcomes (APOs) and periodontal disease: pathogenic mechanisms. J Clin Periodontol 2013;40(Suppl. 14):S170–S180. https://onlinelibrary.wiley.com/doi/epdf/10.1111/jcpe.12082. ↩︎
- Nwizu NN, Marshall JR, Moysich K, et al. Periodontal Disease and Incident Cancer Risk among Postmenopausal Women: Results from the Women’s Health Initiative Observational Cohort. Cancer Epidemiol Biomarkers Prev 2017;26(8):1255–65. http://cebp.aacrjournals.org/content/26/8/1255#ref-1 ↩︎
- Michaud DS, Kelsey KT, Papathanasiou E, Genco CA, Giovannucci E. Periodontal disease and risk of all cancers among male never smokers: an updated analysis of the Health Professionals Follow-up Study. Ann Oncol. 2016;27(5):941-7. https://www.ncbi.nlm.nih.gov/pubmed/26811350 ↩︎
- Teeuw WJ, Gerdes VE, Loos BG. Effect of periodontal treatment on glycemic control of diabetic patients: a systematic review and meta-analysis. Diabetes Care 2010;33(2):421-7. https://www.ncbi.nlm.nih.gov/pmc/articles/PMC2809296/pdf/zdc421.pdf ↩︎
- Preshaw PM, Alba AL, Herrera D, et al. Periodontitis and diabetes: a two-way relationship. Diabetologia 2011;55(1):21-31. https://www.ncbi.nlm.nih.gov/pmc/articles/PMC3228943/#CR7 ↩︎
- Hajishengallis G. Periodontitis: from microbial immune subversion to systemic inflammation. Nat Rev Immunol. 2015;15(1):30-44. https://www.ncbi.nlm.nih.gov/pmc/articles/PMC4276050/ ↩︎
- Michaud DS, Kelsey KT, Papathanasiou E, Genco CA, Giovannucci E. Periodontal disease and risk of all cancers among male never smokers: an updated analysis of the Health Professionals Follow-up Study. Ann Oncol. 2016;27(5):941-7. ↩︎
- Teeuw WJ, Gerdes VE, Loos BG. Effect of periodontal treatment on glycemic control of diabetic patients: a systematic review and meta-analysis. Diabetes Care 2010;33(2):421-7. ↩︎
- Plemons JM, Al-Hashimi I, Marek CL. Managing xerostomia and salivary gland hypofunction: Executive summary of a report from the American Dental Association Council on Scientific Affairs. JADA 2014:145(8):867-873. https://jada.ada.org/article/S0002-8177(14)60200-2/fulltext ↩︎
- Ibid. ↩︎
- Han P, Suarez-Durall P, Mulligan R. Dry mouth: A critical topic for older adult patients. J Prosthodont Res 2015: 59(1):6-19. https://www.journalofprosthodonticresearch.com/article/S1883-1958(14)00113-3/pdf ↩︎
- Kirzinger, A, Lopes, L, Wu, B, Brodie, M. KFF Health Tracking Poll – February 2019: Prescription Drugs. March 2019. https://modern.kff.org/health-costs/poll-finding/kff-health-tracking-poll-february-2019-prescription-drugs/ ↩︎
- Edentulous was defined as no permanent tooth present and no dental root fragments present. Molars and dental implants were excluded from the analysis (see data and methods for details). ↩︎
- Dye BA, Weatherspoon DJ, Mitnik GL. Tooth loss among older adults according to poverty status in the United States from 1999 through 2004 and 2009 through 2014. JADA 2019; 150(1):9-23. ↩︎
- Kaiser Family Foundation analysis of National Health and Nutrition Examination Survey (NHANES), 2013-2016; unpublished estimates. ↩︎
- Kaiser Family Foundation, State Health Facts: Percentage of Adults 65+ Who Have Had All of Their Natural Teeth Extracted. 2016. https://modern.kff.org/other/state-indicator/percent-who-had-all-teeth-extracted/?currentTimeframe=0&sortModel=%7B%22colId%22:%22Location%22,%22sort%22:%22asc%22%7D ↩︎
- Health Policy Institute. Oral Health and Well-Being in the United States. September 2016. https://www.ada.org/~/media/ADA/Science%20and%20Research/HPI/Files/HPIgraphic_0916_2.pdf?la=en ↩︎
- Kaiser Family Foundation analysis of the Medicare Current Beneficiary Survey (MCBS), 2016; unpublished estimates. ↩︎
- Centers for Disease Control and Prevention. Oral Health for Older Americans: Facts About Older Adults Oral Health. May 2, 2018. https://www.cdc.gov/oralhealth/basics/adult-oral-health/adult_older.htm ↩︎
- Griffin SO, Jones JA, Brunson D, Griffin PM, Bailey WD. Burden of oral disease among older adults and implications for public health priorities. Am J Public Health 2012;102(3):411-8. https://www.ncbi.nlm.nih.gov/pmc/articles/PMC3487659/#bib7 ↩︎
- Kaiser Family Foundation analysis of National Health and Nutrition Examination Survey (NHANES), 2015-2016; unpublished estimates. ↩︎
- Eke PI, Dye BA, Wei L, et al. Update on Prevalence of Periodontitis in Adults in the United States: NHANES 2009 to 2012. J Periodontol 2015;86(5):611-22. https://www.ncbi.nlm.nih.gov/pmc/articles/PMC4460825/ ↩︎
- Griffin SO, Jones JA, Brunson D, Griffin PM, Bailey WD. Burden of oral disease among older adults and implications for public health priorities. Am J Public Health 2012;102(3):411-8. https://www.ncbi.nlm.nih.gov/pmc/articles/PMC3487659/#bib7 ↩︎
- Kaiser Family Foundation analysis of National Health and Nutrition Examination Survey (NHANES), 2013-2016; unpublished estimates. ↩︎
- Rui P, Kang K. National Hospital Ambulatory Medical Care Survey: 2015 Emergency Department Summary Tables. https://www.cdc.gov/nchs/data/nhamcs/web_tables/2015_ed_web_tables.pdf ↩︎
- Allareddy V, Rampa S, Lee MK, et al. Hospital-based emergency department visits involving dental conditions. The Journal of the American Dental Association 2014;45(4):331–337. https://jada.ada.org/article/S0002-8177(14)60010-6/fulltext ↩︎
- Okunseri C, Okunseri E, Thorpe JM, Xiang Q, Szabo A. Patient characteristics and trends in nontraumatic dental condition visits to emergency departments in the United States. Clin Cosmet Investig Dent 2012;4:1-7. https://www.ncbi.nlm.nih.gov/pmc/articles/PMC3652363/ ↩︎
- American Dental Association. American Dental Association Statement on Regular Dental Visits. June 10, 2013. https://www.ada.org/en/press-room/news-releases/2013-archive/june/american-dental-association-statement-on-regular-dental-visits ↩︎
- Vujicic M, Buchmueller T, Klein R. Dental Care Presents The Highest Level Of Financial Barriers, Compared To Other Types Of Health Care Services. Health Affairs 2016; 35(12): 2176–2182. https://www.healthaffairs.org/doi/10.1377/hlthaff.2016.0800 ↩︎
- Health Resources and Services Administration. National and State-Level Projections of Dentists and Dental Hygienists in the U.S., 2012-2025. February 2015. https://bhw.hrsa.gov/sites/default/files/bhw/nchwa/projections/nationalstatelevelprojectionsdentists.pdf ↩︎
- Nelson J, Thatcher J, Williams J. National Rural Oral Health Association. Improving Rural Oral Healthcare Access. May 2018. https://www.ruralhealthweb.org/NRHA/media/Emerge_NRHA/Advocacy/Policy%20documents/05-11-18-NRHA-Policy-Improving-Rural-Oral-Health-Access.pdf ↩︎
- Syed ST, Gerger BS, Sharp LK. Traveling Towards Disease: Transportation Barriers to Health Care Access. J Community Health 2013;38(5):976-93. https://www.ncbi.nlm.nih.gov/pmc/articles/PMC4265215/ ↩︎
- IOM (Institute of Medicine). 2011. Advancing Oral Health in America. Washington, DC: The National Academies Press. ↩︎
- Jacobson G, Griffin S, Neuman T, Smith K. Kaiser Family Foundation. Income and Assets of Medicare Beneficiaries, 2016-2035. April 2017. http://files.kff.org/attachment/Issue-Brief-Income-and-Assets-of-Medicare-Beneficiaries-2016-2035 ↩︎
- Centers for Medicare and Medicaid Services. Medicare Dental Coverage. November 19, 2013. https://www.cms.gov/Medicare/Coverage/MedicareDentalCoverage/index.html ↩︎
- Ibid. ↩︎
- Institute of Medicine. 2000. Extending Medicare Coverage for Preventive and Other Services. Washington, DC: The National Academies Press. ↩︎
- Inside Health Policy. Advocates Seek Medically Necessary Oral Health Care, CMS Eyes Issue. January 29, 2019. ↩︎
- Manski RJ, Goodman HS, Reid BC, Macek MD. Dental insurance visits and expenditures among older adults. Am J Public Health 2004;94(5):759-64. https://www.ncbi.nlm.nih.gov/pmc/articles/PMC1448334/ ↩︎
- Manski RJ, Moeller JF, Chen H, Schimmel J, Pepper JV, St Clair PA. Dental use and expenditures for older uninsured Americans: the simulated impact of expanded coverage. Health Serv Res 2014;50(1):117-35. https://www.ncbi.nlm.nih.gov/pmc/articles/PMC4295003/ ↩︎
- National Association of Dental Plans. Dental Benefits Basics: What do dental plans normally cover? https://www.nadp.org/Dental_Benefits_Basics/Dental_BB_2.aspx ↩︎
- Ibid. ↩︎
- Many Medicare Advantage plans outsource the management of the dental benefits to large dental insurers. ↩︎
- Kaiser Family Foundation analysis of Medicare Advantage Enrollment File, 2016; unpublished estimates. ↩︎
- Kaiser Family Foundation analysis of Medicare Advantage Enrollment File, 2016; unpublished estimates. Less than 1% had access to extensive dental coverage only ↩︎
- To examine the scope of dental coverage offered by Medicare Advantage plans in greater detail, we reviewed 2019 Medicare Advantage plans with the highest enrollment in 6 large metropolitan counties: San Diego, California; Harris, Texas; Cook County, Illinois; Miami-Dade, Florida; Philadelphia, Pennsylvania; Charleston, South Carolina; and 2 rural counties: Jefferson, Oregon and Wayne, Ohio. Coinsurance estimates are illustrative (see data and methods for details). ↩︎
- Kaiser Family Foundation analysis of Medicare Advantage Enrollment File, 2016; unpublished estimates. ↩︎
- Kaiser Family Foundation analysis of 5% Sample, 2016; unpublished estimates. ↩︎
- 2016 is the most recent year of data available for the 5% Sample of Medicare claims and was used to estimate Medicaid dental coverage, based on 2018 dental benefits in each state. Kaiser Family Foundation analysis of 5% Sample of Medicare claims, 2016; unpublished estimates. Kaiser Family Foundation. State Health Facts – Medicaid: Dental Benefits. 2018. https://modern.kff.org/medicaid/state-indicator/dental-services/?currentTimeframe=0&sortModel=%7B%22colId%22:%22Location%22,%22sort%22:%22asc%22%7D; The Center for Health Care Strategies. Medicaid Adult Dental Benefits: An Overview. Updated November 2018. https://www.chcs.org/media/Adult-Oral-Health-Fact-Sheet_112118.pdf For states that listed “NR” (No Response) in the Kaiser Family Foundation database, the Center for Health Care Strategies Data was used to determine whether the state had some Medicaid dental benefits. ↩︎
- California Dental Association. New benefits for Denti-Cal adults in 2018. November 2, 2017. https://www.cda.org/news-events/new-benefits-for-denti-cal-adults-in-2018 ↩︎
- California Department of Health Care Services. What are the Medi-Cal Benefits? Accessed December 18, 2018. https://www.dhcs.ca.gov/services/medi-cal/Pages/Medi-Cal_EHB_Benefits.aspx ↩︎
- Kaiser Family Foundation and Health Management Associates. States Focus on Quality and Outcomes Amid Waiver Changes: Results from a 50-State Medicaid Budget Survey for State Fiscal Years 2018 and 2019. October 2018. http://files.kff.org/attachment/Report-States-Focus-on-Quality-and-Outcomes-Amid-Waiver-Changes-Results-from-a-50-State-Medicaid-Budget-Survey-for-State-Fiscal-Years-2018-and-2019 ↩︎
- Kaiser Family Foundation analysis of 5% Sample, 2016; unpublished estimates. ↩︎
- Kaiser Family Foundation analysis of the Medicare Current Beneficiary Survey (MCBS), 2016; unpublished estimates. ↩︎
- Cubanski J, Damico A, Neuman T, Jacobson G. Kaiser Family Foundation. Sources of Supplemental Coverage Among Medicare Beneficiaries in 2016. November 2018. http://files.kff.org/attachment/Data-Note-Sources-of-Supplemental-Coverage-Among-Medicare-Beneficiaries-in-2016 ↩︎
- Kaiser Family Foundation analysis of Medicare Advantage Enrollment File, 2016; unpublished estimates. ↩︎
- Coinsurance estimates are illustrative, based on our analysis of 2019 Medicare Advantage plans with the highest enrollment in 6 large metropolitan counties and 2 rural counties (see data and methods for details). ↩︎
- The implant procedure and treatment plan would be subject to dentist and patient preference; not all implant cost codes are available. An example scenario: intraoral – periapical first radiographic image (D0220): $100 ($50×2); Surgical placement of implant body – endosteal implant (D6010): $4,460 ($2,230×2); second stage implant surgery (D6011): $826 ($413×2) (procedures D6010 and D6011 may be performed by a periodontist or oral surgeon); prefabricated abutment – includes modification and placement (D6056): $1,432 ($716×2); implant/abutment supported removable denture for partially edentulous arch – maxillary (D6112); semi-precision attachment abutment (D6052) for 2 implants; fees were not available for the final restorations: D6112 and D6052 in the 2018 ADA Survey of Dental Fees, so the total cost of implant procedure is under-estimated. Total costs with available fee schedule: $6,818. Total out-of-pocket costs were calculated by including all services under Table 4 – scenario 3, as well as the total cost of implants, minus the cost of the partial maxillary denture (D5211) for a total of $10,292. ↩︎
- The Center for Medicare Advocacy. Legal Memorandum: Statutory Authority Exists for Medicare to Cover Medically Necessary Oral Health Care. January 3, 2019. https://www.medicareadvocacy.org/medicare-info/dental-coverage-under-medicare/ ↩︎
- Letter to Seema Verma and Alex Azar by members of Congress. September 17, 2018. https://familiesusa.org/sites/default/files/Letter%20on%20Medicare%20Coverage%20of%20Oral%20Health%20-%20September%2017%202018.pdf ↩︎
- Medicare Dental Benefit Act of 2019; S.22, 116th Congress (2019). https://www.congress.gov/bill/116th-congress/senate-bill/22/text; Seniors Have Ears, Eyes, and Teeth Act; H.R. 576, 116th Congress (2019). https://www.congress.gov/bill/116th-congress/house-bill/576/text; Medicare Dental, Vision, and Hearing Benefit Act of 2017; H.R.3111, 115th Congress (2017). https://www.congress.gov/bill/115th-congress/house-bill/3111/text; Medicare for All Act of 2017; S.1804, 115th Congress (2017). https://www.congress.gov/bill/115th-congress/senate-bill/1804/text ↩︎
- Willink A, Schoen C, Davis K. How Medicare Could Provide Dental, Vision, and Hearing Care for Beneficiaries. The Commonwealth Fund, January 2018. https://www.commonwealthfund.org/sites/default/files/documents/ ___media_files_publications_issue_brief_2018_jan_willink_medicare_dental_vision_hearing_ib.pdf ↩︎