COVID-19 Cases and Deaths in Long-Term Care Facilities through June 2021
Data Note
A previous data note found that weekly deaths and cases in LTCFs dropped to an all-time low in April 2021, largely due to the high rates of vaccination among LTCF residents and staff. Additionally, five states in that previous analysis reported zero deaths per 100,000 state residents in April 2021. This data note examines state reported LTCF data from 42 states plus Washington DC through the end of June 2021 to examine patterns of COVID-19 cases and deaths among LTCF residents and staff. While most states report record low deaths and cases in LTCFs, a handful of states have seen an uptick in deaths, and 12 states report higher cases in June 2021 than a previous period. Ongoing tracking to assess the impact of the Delta variant on long-term care facilities at the state-level can highlight the effect of this recent wave on LTCFs.
LTCFs include a range of facilities, including nursing homes, assisted living facilities, and other congregate care facilities for people with disabilities or older adults. Data in this analysis is as of the week of June 27th, 2021. See methods for more details.
COVID-19 Deaths in Long-Term Care Facilities
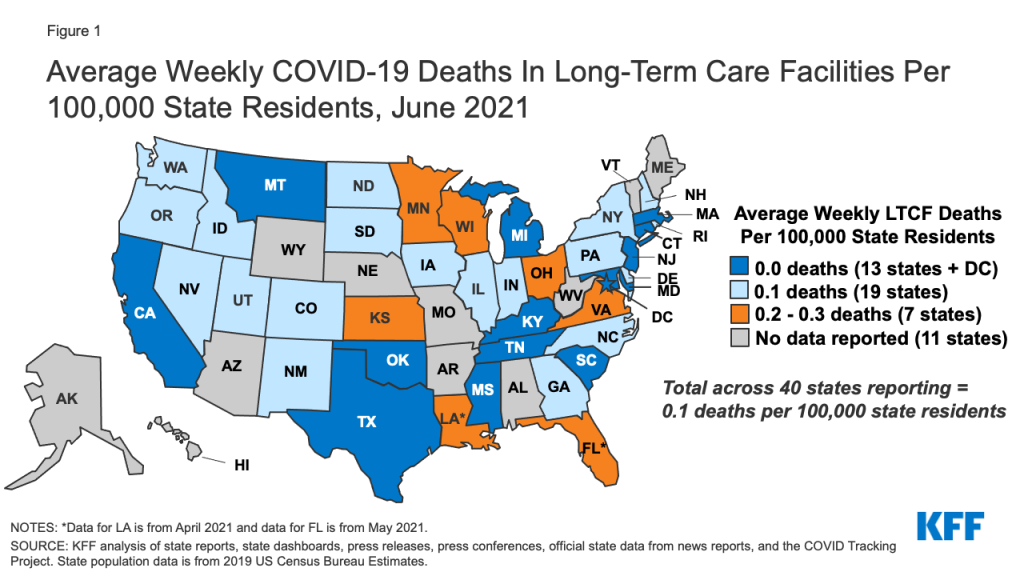
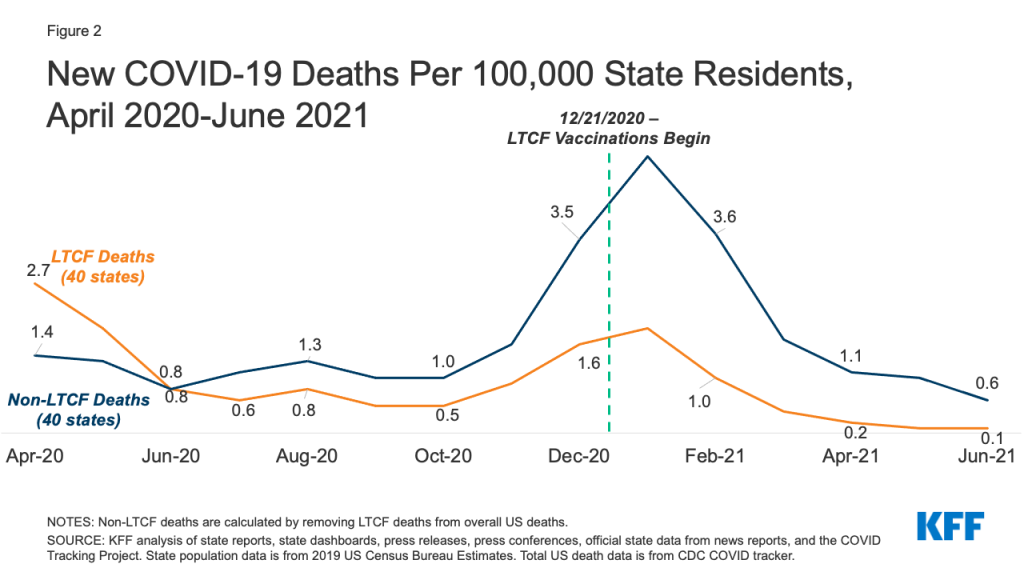
In most states, COVID-19 deaths in LTCFs have continued to fall, with 14 states reporting zero or close to zero weekly LTCF deaths per 100,000 state residents in June 2021. In 11 of these states, zero deaths per 100,000 state residents are rounded values that represent a very small number of LTCF deaths, while Washington DC, Montana, and Rhode Island reported real zero LTCF deaths in June 2021. 21 additional states reported an all-time low LTCF death rate (but not zero) in the most recent month of data available for the state (June 2021 for most states and May 2021 for Florida) (Appendix Table 1). Overall, the average weekly number of COVID-19 LTCF deaths per 100,000 state residents was 0.1 in June 2021, a decline of 96% from December 2020 (when average weekly deaths were 1.6 per 100,000). This decline ranges from 77% in Wisconsin to 100% in six states (California, Connecticut, Washington DC, Massachusetts, Montana, and Tennessee) (Table 1).1

However, five states reported an increase in COVID-19 deaths in LTCFs compared to an earlier period. In June 2021, average weekly deaths were higher than earlier months in Colorado (April 2021), Georgia (May 2021), New York (September 2020), and Wisconsin (July 2020) (Appendix Table 2). Louisiana reported slightly higher deaths in April 2021 (the most recent month available) compared to October 2020. Across all five states, however, LTCF deaths in the most recent month were still substantially lower than their peak.
While LTCF trends largely mirror COVID-19 deaths outside LTCFs, most states report higher death rates outside LTCFs. For example, states that reported zero or near zero LTCF deaths still reported deaths outside of long-term care facilities, ranging from 0.2 deaths per 100,000 in California to 1.2 deaths per 100,000 in Michigan (data not shown). Overall, COVID-19 deaths outside of LTCFs have dropped by 82%, from 3.5 to 0.6 deaths across the 40 states included in this analysis (Figure 2), a smaller decline than among LTCFs.

COVID-19 Cases in Long-Term Care Facilities
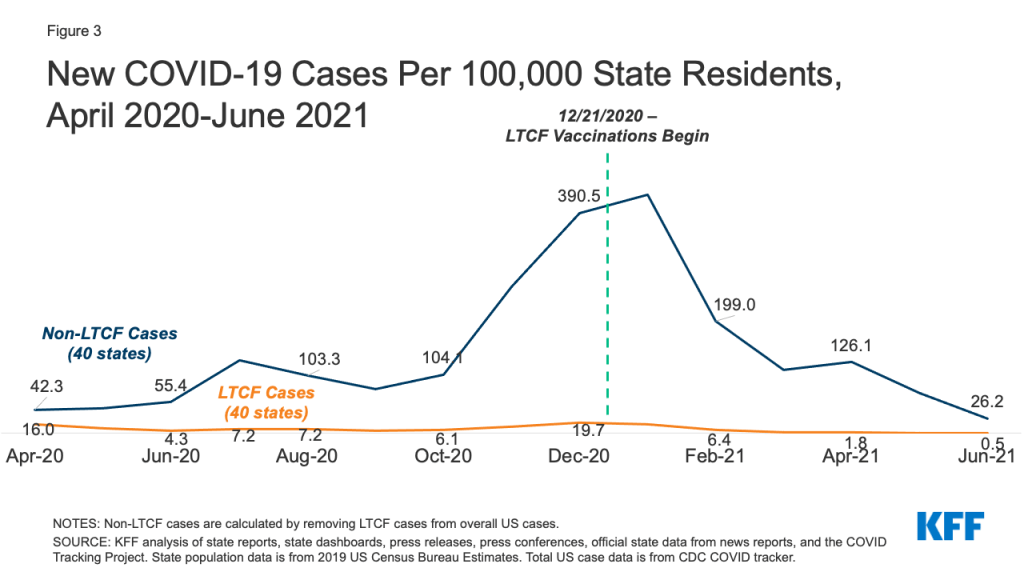
Across the 40 states for which we can trend LTCF cases, average new weekly cases in LTCFs were just 0.5 per 100,000 in June 2021, compared to a peak of 19.7 in December 2020, a decrease of 97% (Figure 3 and Table 2). 28 states reported an all-time low case rate in the most recent month of data available for the state (June 2021 for 27 states and May 2021 for Florida) (Appendix Table 2). Nearly all states analyzed have seen a decline of at least 90% in LTCF cases since December 2020, and Vermont and Washington saw declines of 89%.
However, in contrast to deaths, just one state (Rhode Island) reported zero LTCF cases per 100,000 state residents, and 12 states reported higher average weekly LTCF cases in June 2021 compared to an earlier month (Table 2 and Appendix Table 2). Three states reported their lowest LTCF case rate in March 2021 (Colorado, Kansas, and Louisiana), six states reported their lowest LTCF case rate in April 2021 (Arkansas, Mississippi, Montana, New Mexico, Utah, and Wisconsin), two states reported their lowest LTCF case rate in May 2021 (Georgia and Nevada), and Vermont reported its lowest case rate in October 2020. Among the 12 states that report data on new cases among residents and staff separately, it most states reported higher new cases among LTCF staff than LTCF residents (data not shown), likely reflecting the higher share of unvaccinated staff in LTCFs when compared to LTCF residents. It is unknown whether these new cases are among vaccinated or unvaccinated residents and staff, or whether these cases came from Delta variant infections.
Cases outside of LTCFs have been substantially higher than cases in LTCFs throughout the pandemic, with some state variation. Cases outside of LTCFs have dropped since December 2020, from 390.5 to 26.2 cases, a steep drop of 93% that mirrors the 97% drop in LTCF cases (Figure 3). However, of the six states that reported higher LTCF cases in June 2021 than April 2021 (Arkansas, Mississippi, Montana, New Mexico, Utah, and Wisconsin), only Arkansas reported higher cases outside of LTCFs in that same time period, suggesting faster spread of the virus in LTCFs than the surrounding community in the other 5 states.

Potential Impact of Delta Variant
The highly transmissible nature of the Delta variant may impact this trend of decreased LTCF cases and deaths. Preliminary federal data show a slight uptick in national nursing home cases and deaths in the first weeks of July 2021. Given the steady decline of LTCF cases and deaths since January 2021, additional weeks of data are necessary to understand whether this slight uptick is due to a data anomaly or the rise of the Delta variant in surrounding communities. While current data show that many of the recent hospitalizations and deaths due to COVID-19 are among unvaccinated individuals, many people in these facilities have pre-existing health conditions that could put them at high risk of illness or death if they experience a breakthrough infection, regardless of vaccination status. Ongoing tracking and analysis can shed light on the impact of increased community cases, given the close ties between community spread and LTCF cases and deaths.
Policy Implications
While LTCF cases and deaths have been steadily trending downward since the vaccine rollout, there are still several factors that prevent the long-term care crisis from coming to an end, including the rise of the Delta variant and low vaccination rates in some parts of the country (both in and out of LTCFs). These factors will be important to consider as policymakers use the experience of the pandemic in these settings to inform policy moving forward.
Most notably, the heavy toll that COVID-19 took among staff and residents at LTCFs highlighted the key role that timely, standardized, comprehensive data can play in policy—and the problems that can arise when it is absent. The federal government stood up a new COVID-19 data reporting system for nursing facilities relatively quickly, but there were still gaps in data from the early months of the pandemic, and that data excluded other long-term care settings that also had high rates of cases and deaths. Having robust, comparable data early on could have allowed researchers and policymakers to understand the link between community spread and the spread of the virus in facilities in real-time. In addition, limited data on characteristics of people in LTCFs who were infected or died hindered understanding of those at highest risk. Looking forward, building data systems that can be leveraged during crises to produce timely, detailed, accurate data can be instrumental in targeting policy responses.
The rollout of the long-term care partnership to deliver vaccines to residents and staff, while not perfect, had a nearly immediate effect that was evident in the data. The federal Pharmacy Partnership distributed nearly 8 million doses of the vaccine to LTCF residents and staff from December 2020 – April 2021. Within weeks of the first doses being administered, nursing home cases and deaths dropped while all other cases and deaths increased. Though the partnership experienced challenges (including low rates of staff vaccination and exclusion of some LTC settings), it was ultimately successful in vaccinating a high-risk population to reduce overall mortality due to COVID-19. The success of the partnership can provide a blueprint moving forward for successful public-private partnerships and leveraging pre-existing expertise and infrastructure in large-scale public health efforts.
Lastly, the experience of tracking COVID-19 in LTCFs highlights the importance of targeted or local efforts to understanding data across states. While the federal government eventually published weekly data on cases and deaths in nursing facilities that allowed comparison across all 50 states, data anomalies in this data led to efforts, including those by KFF, to track data directly from state websites. Even this effort yielded inconsistencies. For example, in March 2021, Wisconsin increased its cumulative long-term care death count by over 1,000 deaths with no conceivable explanation. A local news outlet had already reported on this discrepancy and allowed us to understand it was a data correction, and not reflective of what was happening on the ground. This pattern repeated throughout the pandemic: Many states had a few dedicated reporters and news outlets who kept a close eye on their individual state’s long-term care data and, importantly, had contacts in the right state departments. These local news outlets were instrumental in providing insight into data anomalies or state changes that affected data reporting, and effectively created an additional network of data experts for researchers to leverage.
Methodology
This analysis is based on data as of the week of June 27th, 2021 from 42 states plus Washington DC, for a total of 43 states. The remaining eight states were excluded because they do not directly report data on cases and deaths in long-term care facilities, their data is sourced from sporadically released media reports, or there were data quality or availability issues in trending data over time.
This analysis relies on state-reported data instead of federal data since federal data may exclude cases and deaths prior to May 8th, 2020. This exclusion may miss peaks in states such as New York, New Jersey, and Massachusetts. Additionally, the federal data does not include non-nursing home settings. COVID-19 has disproportionately impacted all types of long-term care settings, such as assisted living facilities and group homes. Thus, the state-reported data is more likely to capture the full burden of cases and deaths in long-term care facilities.
Within the 43 states included in this analysis, we were able to trend long-term care cases in 39 states plus DC and deaths in 39 states plus DC. We included states for which we could reliably trend at least six months of data, using the earliest reliable period reported in the state as the starting point for that state’s trend.
Louisiana’s trend stops at April 2021 due to reporting changes in May and June that prevent data from being trended. Florida’s trend stops in May 2021 due to the state halting their reporting of cumulative long-term care cases and deaths in June 2021.
States vary in which facilities they include in LTCF reporting and whether they include residents and staff in case and death counts. For all states, we trended the subset of facilities and populations that provide the longest reliable trend line. For example, our data for Delaware excludes staff cases because that data was not reported consistently; in Michigan, this analysis excludes cases and deaths in Adult Foster Care facilities since these cases and deaths were only added for recent weeks. For this reason, this analysis should not be used to identify state-level or national data on total long-term care cases and deaths. See below for details on how each indicator in the Tables and Appendix were calculated.
Average Weekly Long-Term Care Deaths/Cases Per 100,000 State Residents:
These data represent trends in long-term care deaths and cases in states overtime in the context of total state population. Total state population data is from 2019 estimates from the US Census Bureau. The first week of available long-term care data for each state was not included in this analysis since the first week of data does not reflect a single week of deaths and cases, but rather all deaths and cases that have occurred up to that point. New deaths and cases were calculated for each week thereafter, and then averaged for all of the weeks within the month. Weeks where states reported large increases or any decreases due to reporting changes or data reconciliation were not included in the calculations of monthly averages. These average new deaths and cases were converted to represent deaths and cases per 100,000 state residents to allow for easier comparison across states. Totals for each table were calculated by dividing total new deaths and new cases per month by the total state populations for the states represented in each month of data and converting values to represent totals per 100,000 state residents.
Percent Change In LTCF Deaths/Cases Since December 2020:
Percent change is calculated by taking the difference between average weekly deaths in December 2020 and average weekly deaths in June 2021 and dividing that difference by the average weekly deaths in December 2020.
Appendix
Endnotes
- Florida and Louisiana reported lower declines between December 2020 and the most recent month of data available (58% and 69%); however, these declines were calculated using earlier months of data since they did not report data in June 2021 (see methods for more detail). ↩︎


