What Role Do Immigrants Play in the Rural Workforce?
As of 2023, there were over 47 million immigrants residing in the country, accounting for 14% of the total population, including roughly 1.8 million living in rural America. The Trump administration has undertaken a range of actions aimed at restricting immigration; increasing interior immigration enforcement efforts, including among lawfully present immigrants; and eliminating access to health coverage and care for lawfully present and undocumented immigrants. Research shows that immigrants make significant contributions to the U.S. workforce. Efforts to limit immigration may have negative ramifications for the country’s labor supply and economy, particularly in key occupations such as health care that are already experiencing worker shortages. Research further shows that health care workforce shortages are particularly stark in rural areas, which are also home to larger shares of older residents as well as residents who have worse health conditions as compared to their urban counterparts.
This data note examines the role that immigrants play in the rural workforce, particularly in industries disproportionately filled by immigrants, including health care, agriculture, construction, and service. It is based on KFF analysis of the 2023 American Community Survey 1-year Public Use Microdata Sample (see Methods for more details). It also highlights the socioeconomic and health coverage barriers that immigrant workers in rural areas face. For the purposes of this analysis, rural areas (non-metropolitan) are defined as counties or a group of counties that have a population of at least 10,000 but less than 50,000.
This analysis shows that although immigrants account for a small share of the rural adult population (5%) and rural adult workforce (5%), they play an outsized role in certain occupations in rural areas, including as physicians and surgeons (14%), agriculture workers (28%), and construction workers (10%). Despite having similar rates of employment as their citizen counterparts, noncitizen immigrant workers in rural areas are somewhat more likely to have lower incomes (annual incomes below $20,000) (22% vs. 18% among U.S.-born workers) and to be uninsured (40% vs. 8% among U.S.-born workers).
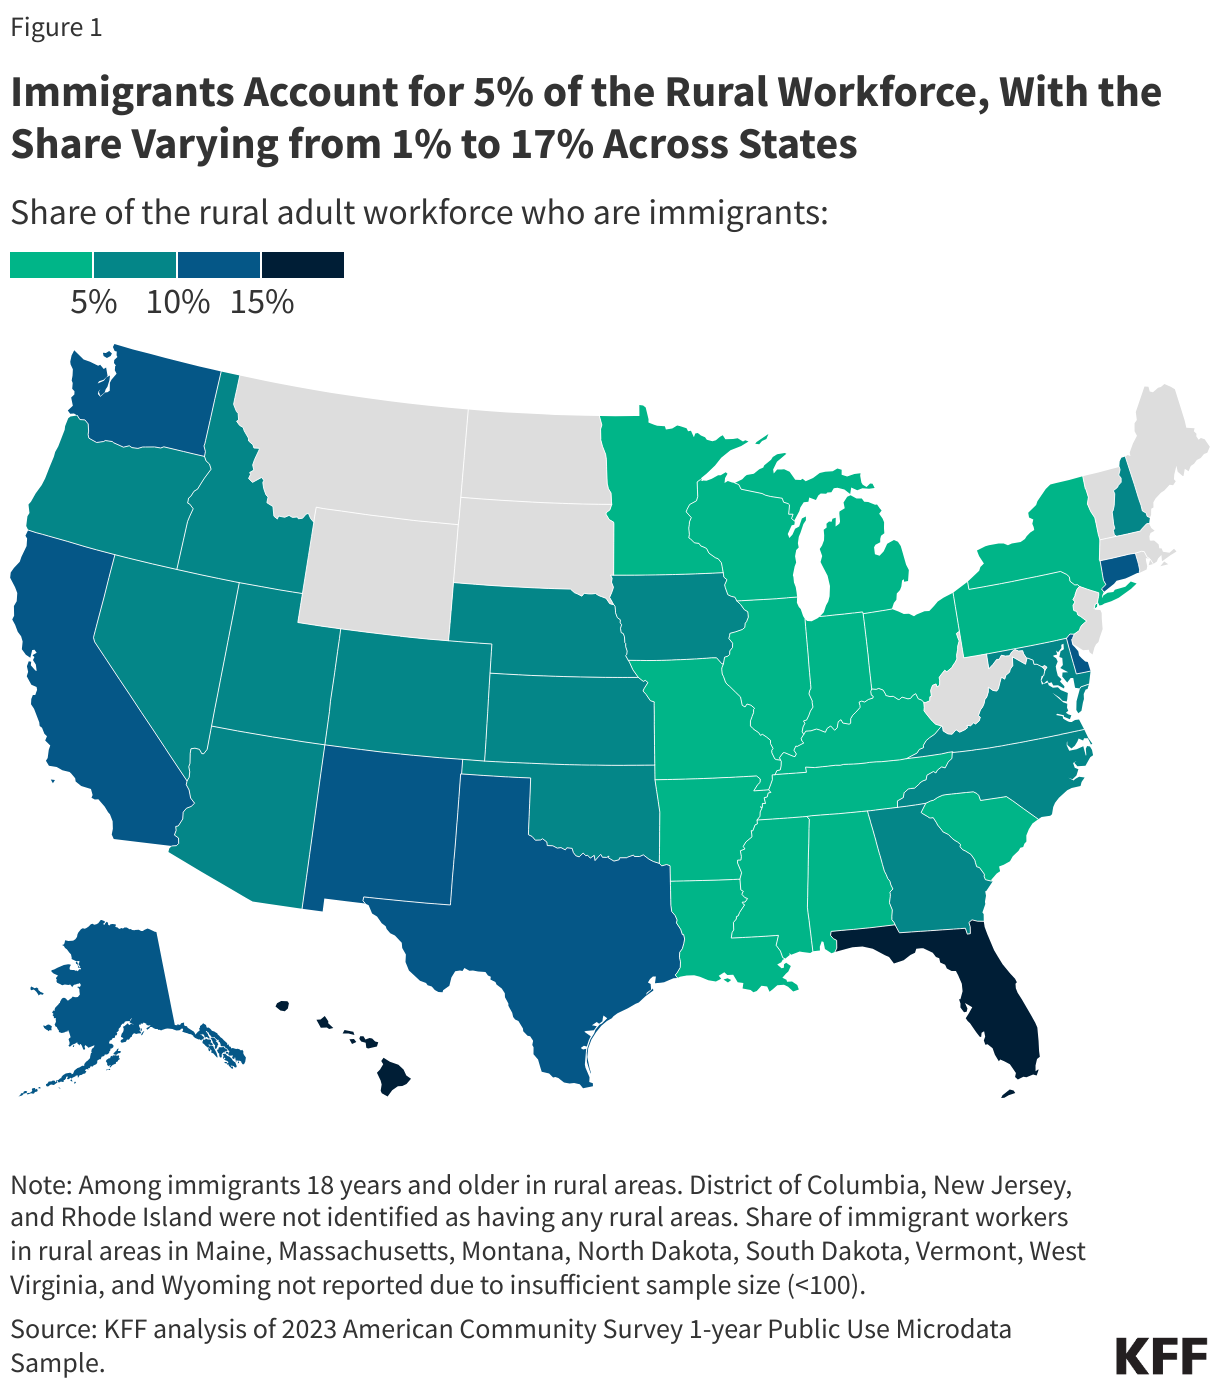
Immigrant adults make up 5% of the rural workforce nationwide, with the share varying from 1% to 17% across states.
Overall, immigrants account for 5% of rural adults and the rural adult workforce. However, their share of the rural workforce ranges from 1% to 17% across the 40 states with sufficient data to examine immigrant workers in rural areas. In nine states (HI, FL, CT, DE, NM, AK, WA, TX, and CA), immigrants account for at least one in ten or more of rural adult workers, including 17% in Hawaii, 15% in Florida, and 14% in Connecticut, reflecting these states generally having higher shares of immigrant adults residing in rural areas and immigrants overall.
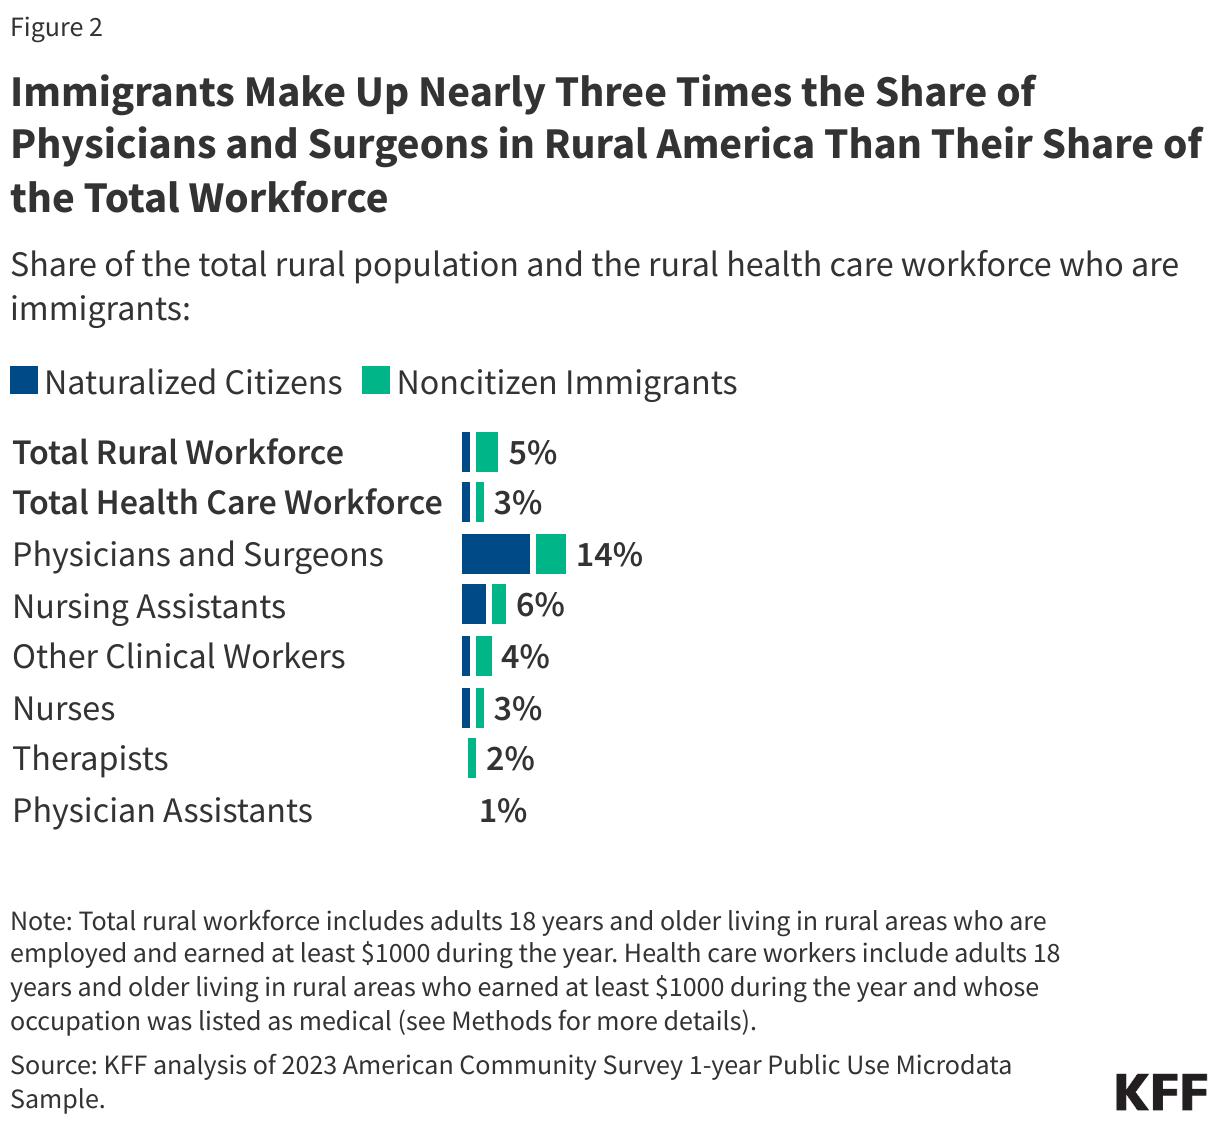
Immigrant adults make up nearly three times the share of physicians and surgeons in rural America than their share of the overall rural workforce (14% vs. 5%).
Immigrant adults account for similar shares of the total rural workforce (5%) and the total rural health care workforce (3%) but make up nearly three times (14%) the share of physicians and surgeons in rural America (Figure 2). These physicians and surgeons include one in ten naturalized citizens and 4% noncitizen immigrants. In addition, immigrant adults account for 6% of nursing assistants, 3% of nurses, 2% of therapists, 1% of physician assistants, and 4% of other clinical workers in rural America.
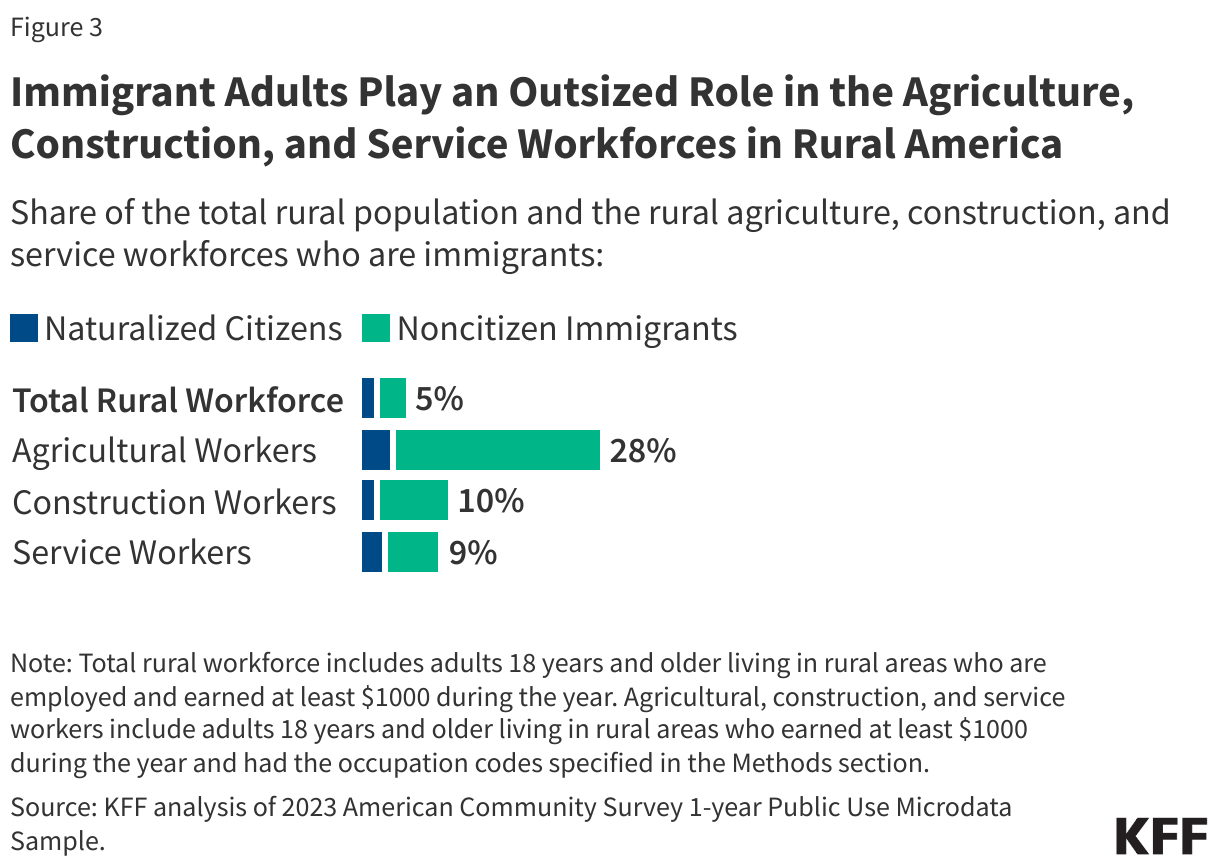
Immigrant adults also play an outsized role in the agriculture, construction, and service workforces in rural America.
In addition to their role as physicians and surgeons, immigrant adults make up significantly higher shares of the agriculture, construction, and service (including restaurant and cleaning) workforces in rural America compared to their share of the total rural workforce (Figure 3). These patterns are similar to the outsized role immigrant adults play in these workforces nationwide. In rural areas, immigrant adults account for nearly three in ten (28%) agricultural workers, including nearly a quarter (24%) who are noncitizen immigrants. Immigrant adults also make up about one in ten construction (10%) and service (9%) workers in rural America, again driven by larger shares of noncitizen immigrants who account for these workers.
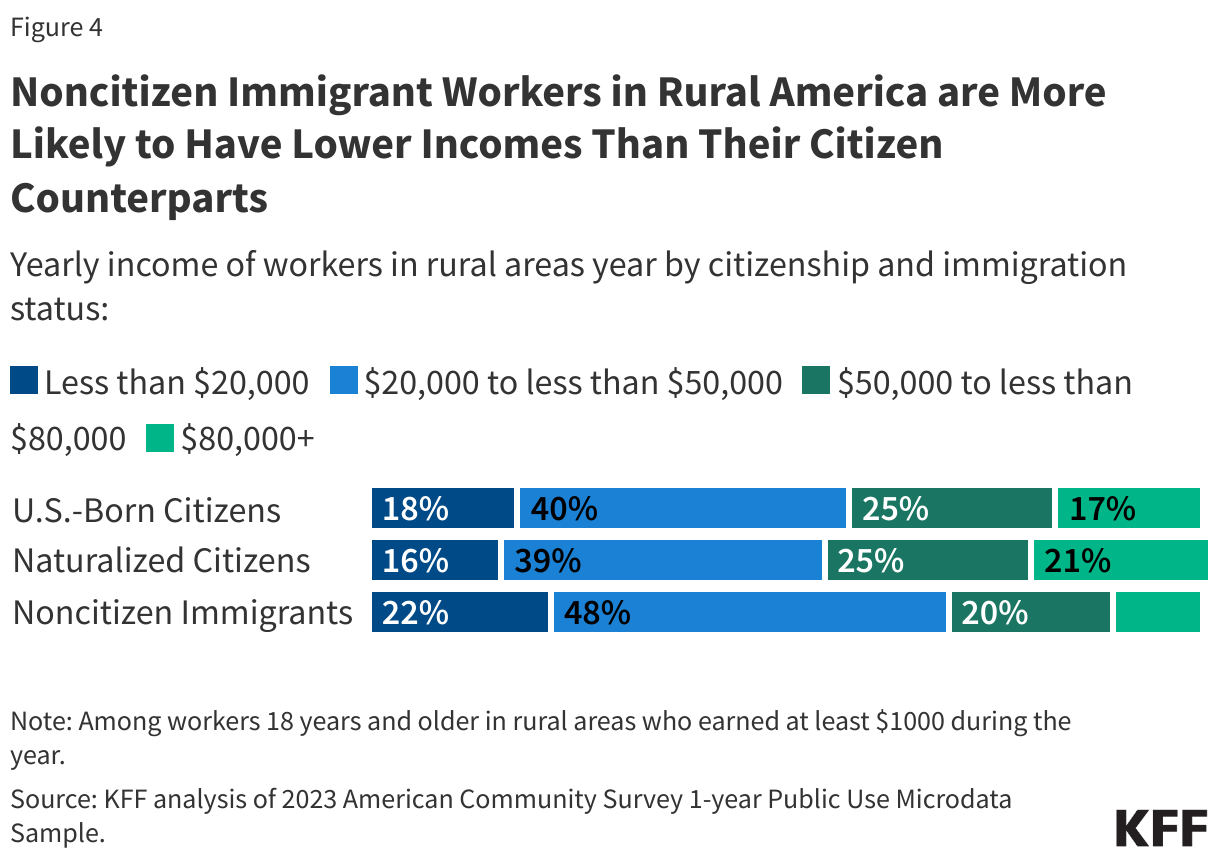
More than one in five noncitizen immigrant workers in rural America earn less than $20,000 a year.
Despite their workforce contributions, noncitizen immigrant workers in rural America are somewhat more likely than their citizen counterparts to earn less than $20,000 a year (Figure 4). More than one in five (22%) of noncitizen immigrant workers earn less than $20,000 a year compared to 18% of U.S.-born citizen and 16% of naturalized citizen workers in rural America. In contrast, about one in six (17%) U.S.-born and one in five (21%) naturalized citizen workers in rural America report earning $80,000 or more per year compared to one in ten noncitizen immigrant workers. This pattern likely reflects noncitizen immigrants’ disproportionate employment in lower-wage jobs such as agriculture, construction, food services, and cleaning services.
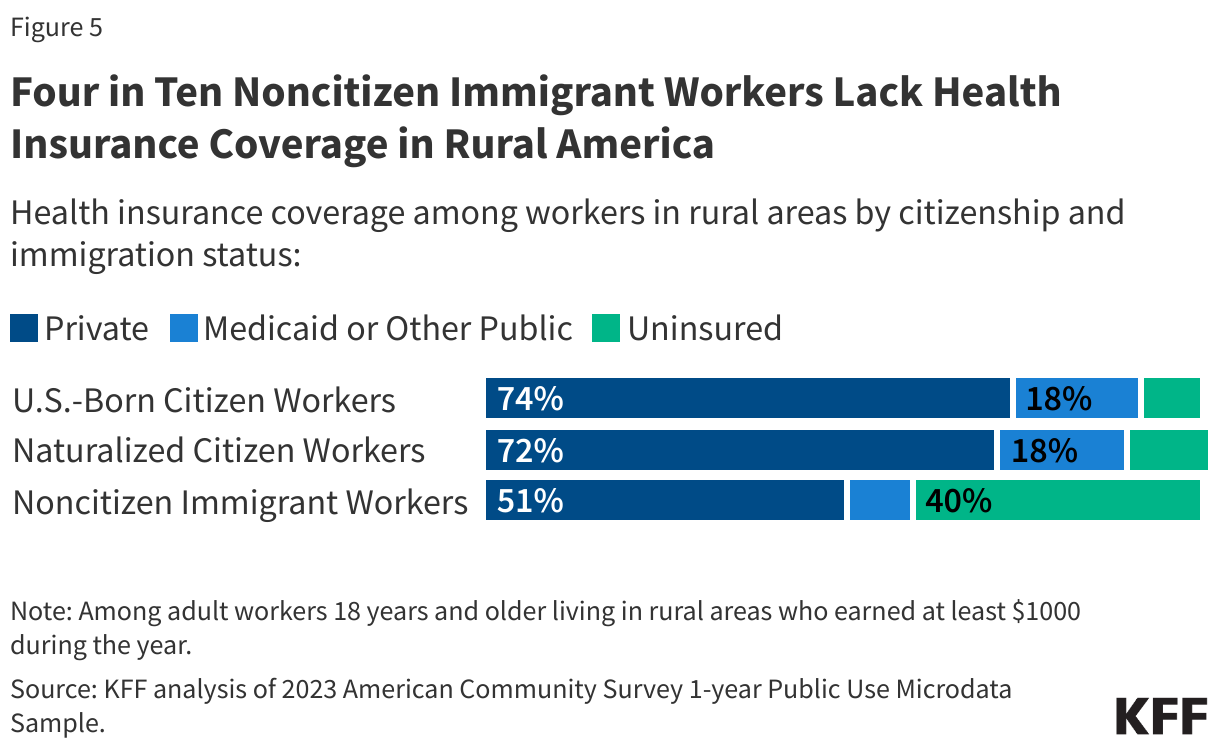
Four in ten noncitizen immigrant workers in rural America are uninsured.
Roughly six in ten of naturalized citizen (60%) and U.S.-born citizen (57%) adults, as well as two in three noncitizen immigrant adults (66%) 18 years and older in rural America are employed. However, noncitizen immigrant workers in rural America are roughly four times more likely to lack health insurance coverage (40%) than their naturalized citizen (11%) and U.S.-born citizen (8%) counterparts (Figure 5). Roughly three in four U.S.-born (74%) and naturalized citizen (72%) workers have private coverage compared to half (51%) of noncitizen immigrant workers. U.S.-born and naturalized citizen (18%) workers also are twice as likely to be covered by Medicaid compared to noncitizen immigrant workers (9%). These patterns reflect noncitizen immigrants’ disproportionate employment in jobs that are less likely to offer employer-sponsored health coverage as well as their limited access to federally funded health coverage. Provisions in the recently passed tax and spending law will further limit access to health coverage for noncitizen immigrants, which could further increase their uninsured rates and result in workforce productivity losses as well as an exacerbation of worker shortages in rural areas.
Methods
Data: These findings are based on KFF analysis of the 2023 American Community Survey 1-year Public Use Microdata Sample (ACS PUMS). The ACS PUMS includes a 1% sample of the U.S. population.
Classification of Rural and Urban Areas: A Public Use Microdata Area (PUMA)-to-county crosswalk was conducted in the 2023 ACS PUMS file after which counties were classified as one of the following: rural (remote) – a non-metro area not adjacent to any large or small metro area; rural (other) – a non-metro area adjacent to a large or small metro area; and urban – a large or small metro area. For the purposes of this analysis, rural (remote) and rural (other) were combined into a single rural category. Non-metro areas are defined as a county or group of counties with a population of at least 10,000 but less than 50,000 people; metro areas are defined as a county or group of counties with a population of 50,000 or more people. For more details on the definition of rural and urban areas, please refer to this Methods section.
Identification of Immigrants: Immigrants are identified as those who report their citizenship status in ACS as a “U.S. citizen by naturalization” or as “not a citizen of the U.S.”. The former are referred to as “naturalized citizens” and the latter as “noncitizen immigrants” in this analysis.
Identification of Health Care Workers: Health care workers are identified as those who have an occupational code (OCCP) in ACS between 3000 and 3655. This group is further broken out into physicians and surgeons (3090, 3100); nurses (3255, 3256, 3258, or 3500); nursing assistants (3603); physician assistants (3110); therapists (3150, 3160, 3200, 3210, 3220, 3230, or 3245); and other clinical workers (all other occupation codes between 3000 and 3655).
Identification of Agricultural Workers: Agricultural workers are identified as those who have an occupational code (OCCP) in ACS of 6005, 6010, 6040, or 6050.
Identification of Construction Workers: Construction workers are identified as those who have an occupational code (OCCP) in ACS between 6200 and 6765.
Identification of Service Workers: Service workers are identified as those who have an occupational code (OCCP) in ACS between 4000 and 4255.