Trends in Employer-Sponsored Insurance Offer and Coverage Rates, 1999-2014
Issue Brief
The majority of nonelderly people get their health coverage through an employer-based plan. This issue brief uses data from the National Health Interview Survey (NHIS) to examine trends in employer-sponsored health insurance (ESI) for different types of people and households.1 While ESI remains the leading source of coverage for nonelderly people (those under age 65), the percentage covered by an employer plan has declined over the last fifteen years. A similar pattern exists with firm offer rates; fewer workers were offered health insurance from their employer in 2014 than in 1999. The decrease in offer and coverage rates has not been universal; families with low and modest incomes have been most affected by the decline. While coverage rates have declined over time, the percentage of the nonelderly population covered by ESI is similar between 2013 and 2014.
Both the percentage of employers who offer insurance and the percentage of people covered will be important to watch as the changes brought about by the Affordable Care Act (ACA) continue to unfold. New coverage provisions and financial assistance provided in the ACA affect employers’ decision to offer coverage and employees’ decisions to take up any coverage they are offered at work. The employer shared responsibility provision, for example, requires employers with 50 or more full-time equivalent employees to offer coverage to full-time employees and their dependent children or face a financial penalty. This provision should tend to expand the number of workers offered coverage in these firms, and, because most individuals are required to have health insurance or pay a penalty (the individual responsibility provision), more workers may take up the coverage offered at work. At the same time, new coverage options and financial assistance available through health insurance marketplaces may encourage some small employers (who are exempt from the employer shared responsibility provisions) to stop offering health benefits if they feel that their employees would be better off getting coverage through the marketplaces.2 Larger employers may also reconsider who they offer coverage to; some may stop offering coverage to part-time workers so those workers are eligible to receive a subsidy on the marketplaces. The percentage of people who received coverage through an employer sponsored plan in 2014 remained similar to the coverage rates in 2010, the year of the ACA’s passage.
Trends in offer rates
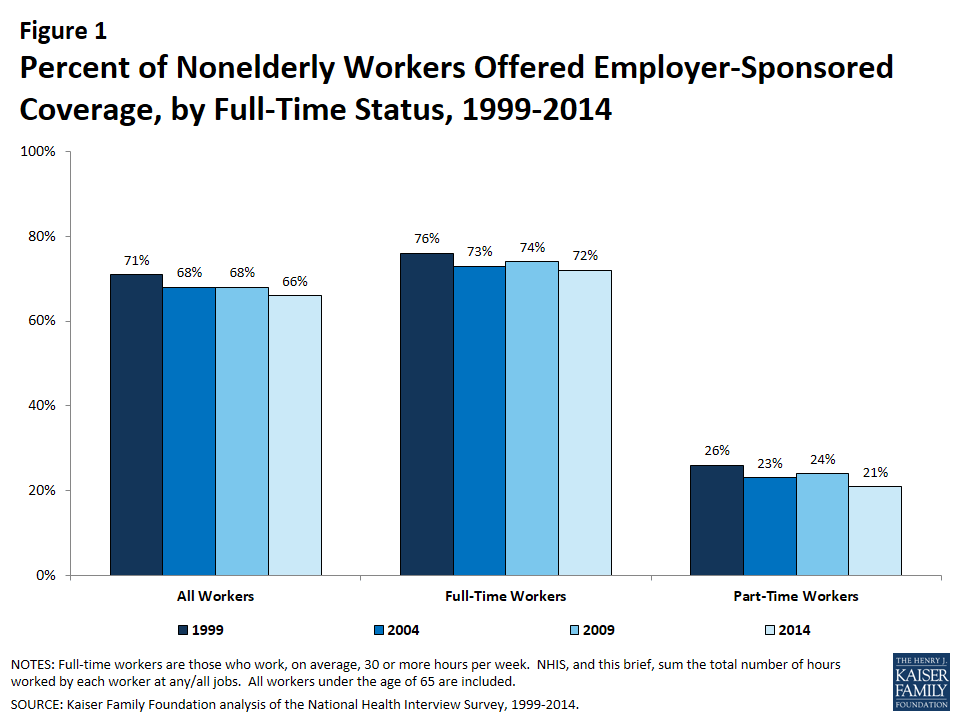
In 2014, 66% of nonelderly workers received an offer of coverage from their employer; less than the 71% offer rate in 1999 (Figure 1). ESI offer rates vary by workers’ full-time status. Employees who worked part time (less than 30 hours a week at all their jobs) were less likely to be offered coverage from their employer than were employees who worked full time (30 or more hours a week) (21% vs. 72%).
Offer rate differences by income
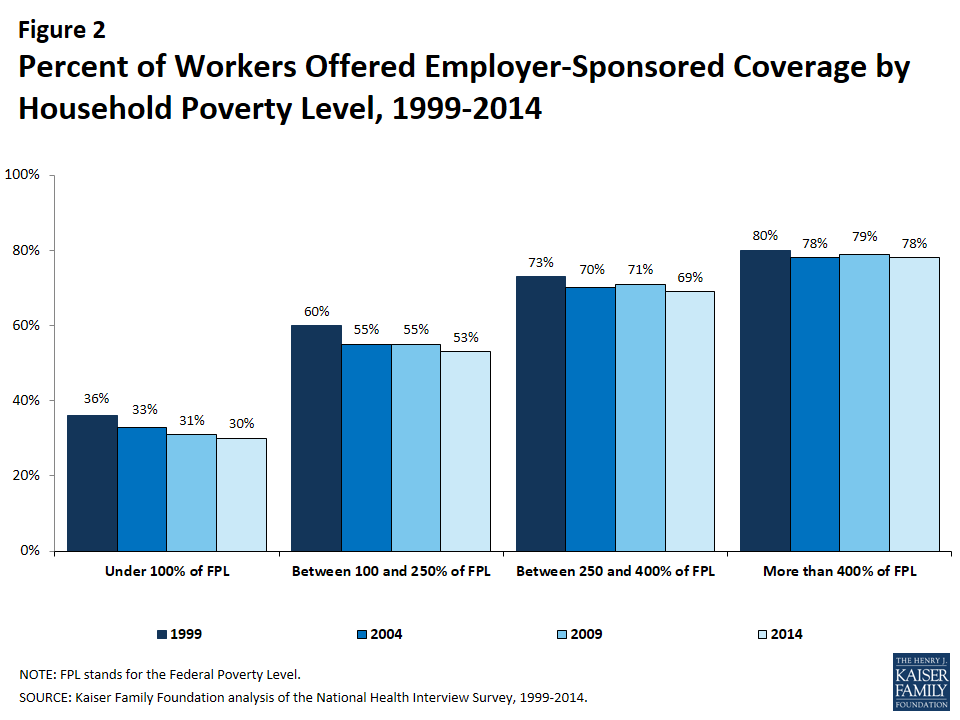
There are differences in ESI offer rates based on household income (Figure 2). Workers in higher income households, (those that earn more than four times the federal poverty level (FPL)) are most likely to receive an offer of ESI (78%), whereas workers in households with lower incomes (those that earn less than the FPL) are least likely to receive an offer of ESI (30%).
Since 2004, offer rates have remained stable for workers in households over 400% of the FPL, but have decreased for households below the poverty line (Figure 2). The percentage of workers offered employer sponsored coverage has decreased from 1999 to 2014 for all income groups.
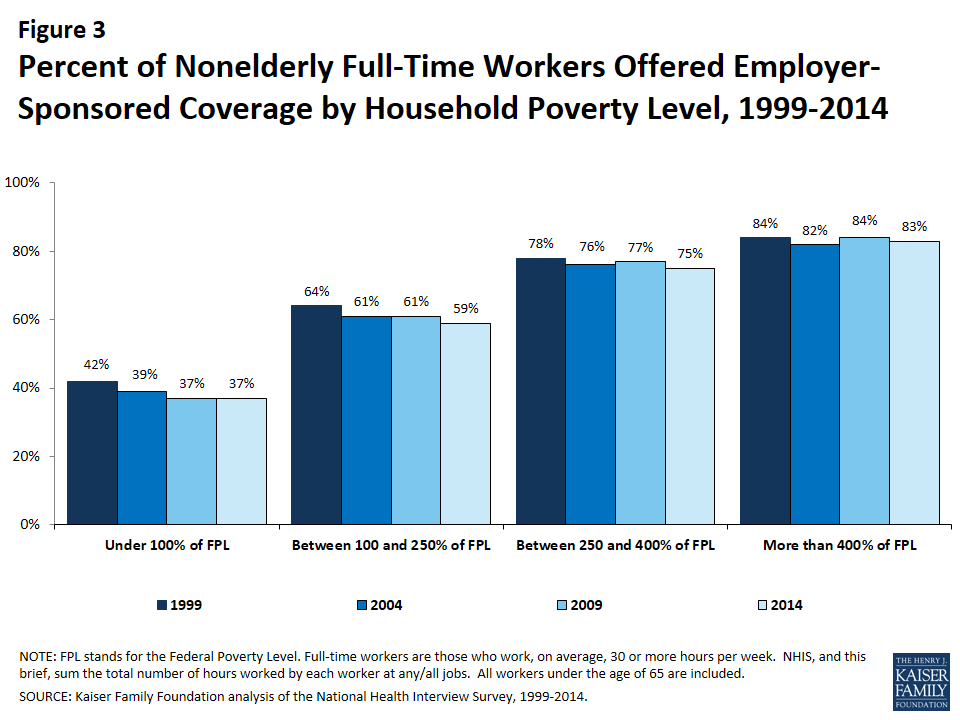
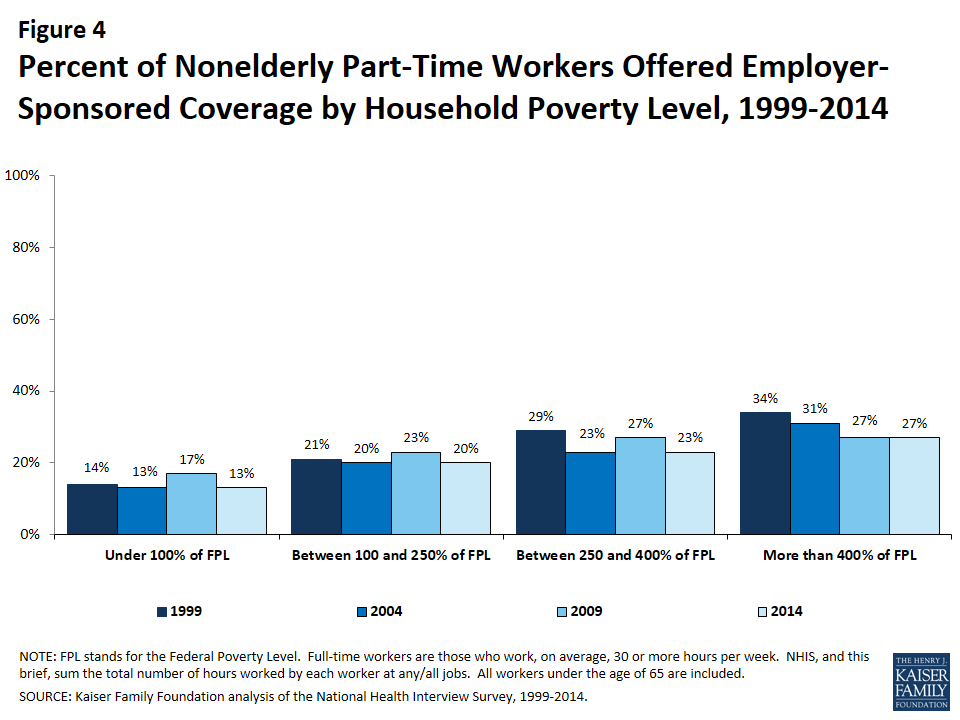
A similar pattern exists for both full-time workers and part-time workers; workers in higher income households are more likely to have an offer of employer coverage than workers in a household earning less than 100% of the FPL (Figures 3 and 4).
Trends in coverage rates
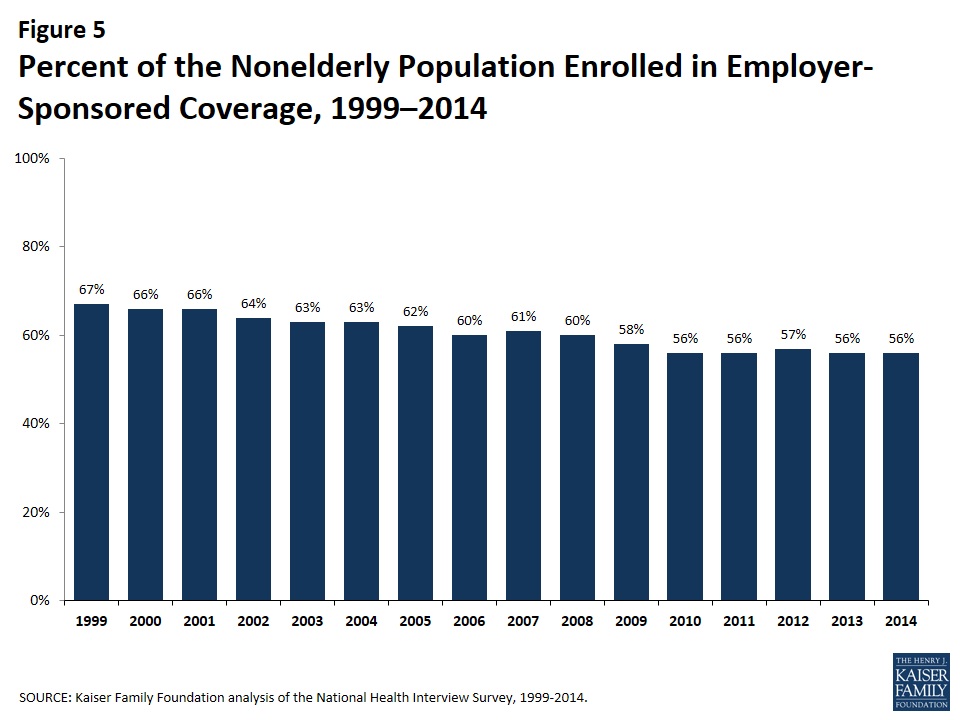
In addition to looking at the percentage of workers who are offered benefits, we can look at the percentage of the nonelderly population that is covered by ESI (Figure 5).3 Not all workers who are offered coverage accept their employer’s benefits, and many nonelderly people (with or without a job) receive coverage as a dependent on a family member’s plan. In 2014, 56% of nonelderly people were covered by ESI, similar to recent years, but a decline from the 67% covered by ESI in 1999. A variety of factors may contribute to this decline. First, changes in the economy and labor market; for example, a decrease in the percentage of people employed, known as the labor market participation rate, will decrease the percentage of individuals eligible for employer coverage.4 ,5 In 2014, people in families with a full-time worker were more likely to be covered by ESI (63%) than those in a family without a full-time worker (26%). In addition to changes in the labor market, employer coverage may also be less prevalent because fewer employers are offering coverage; in 2014, a smaller percentage of firms offered coverage than in 1999 (55% vs. 66%),6 and a smaller percentage of workers at firms offering benefits were covered by those benefits (62% vs. 66%).7
There is considerable interest in how employers and individuals alike will respond to changes brought on by the ACA. Beginning in 2014, millions of individuals enrolled in private health insurance subsidized with premium tax credits. As of yet, the NHIS data do not show that employer coverage is diminishing in its importance. The same percentage of the nonelderly households were covered by ESI in 2014 as in 2010 (56%).
Coverage differences by income
There are important differences in who is covered by ESI based on a household’s income. Employer-sponsored coverage remains the main source of coverage for people in higher-income households while substantially fewer people in lower-income families are covered by an employer (Figure 6). Eighty-three percent of nonelderly people in families that earn more than four times the FPL are enrolled in employer coverage.8 Households at more than four times the FPL earn different incomes depending on a family’s composition; for example, in 2014, a single nonelderly adult would earn about $49,000 and a family of four including two children would earn about $96,000.9
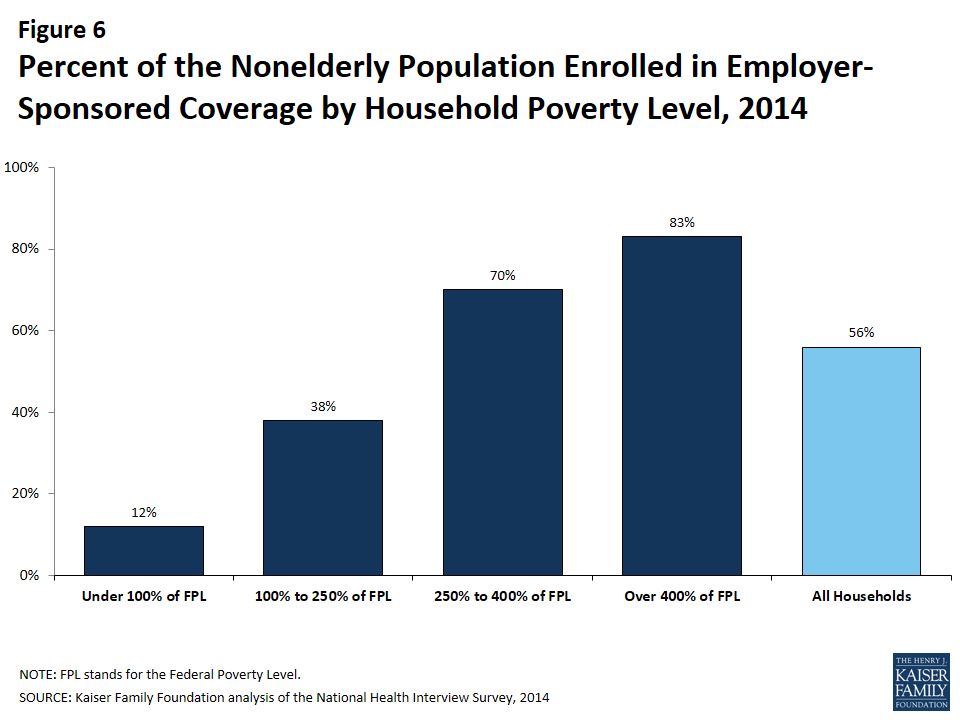
People in families with lower incomes are less likely to be covered by an employer. The ACA aims to provide alternate health coverage options for this population. For example, people who are not offered affordable coverage options and are in families earning between 100 and 400% of the FPL can qualify for premium subsidies through the ACA’s health insurance exchanges.10 Households between 100 and 250% of the FPL are eligible for additional cost-sharing subsidies. Only 38% of people in families earning between 100 and 250% of the FPL are covered by ESI. However, 70% of individuals in families earning between 250 and 400% of the FPL are covered through ESI. Overall, people in families whose income qualifies them for subsidies on the health insurance exchanges are less likely to be covered through an employer plan than those in households whose income does not qualify them for subsidies.11 Among households that earn too little to qualify for any subsides (those making less than 100% of the FPL), 12% of individuals are covered by ESI.12
While the percentage of individuals covered by ESI has decreased, the decline has been more precipitous among lower income families (Figure 7). Comparing 2004 to 2014, there has been no change in the percentage of individuals covered by ESI in families earning more than 400% of the FPL. Alternatively, the percentage of individuals covered by ESI in households earning 100 to 250% of the FPL has decreased from 47% in 2004 to 38% in 2014. Similarly, for those in families between 250 and 400% of the FPL, the percentage covered by ESI has decreased from 74% in 2004 to 70% 2014. These trends indicate that there has been relative stability in ESI enrollment for higher-income households. Since 1999, the decrease in the percentage of nonelderly people covered by ESI has been slower for households above 400% of the FPL than households earning between 100 and 250% or between 250 and 400% of the FPL.
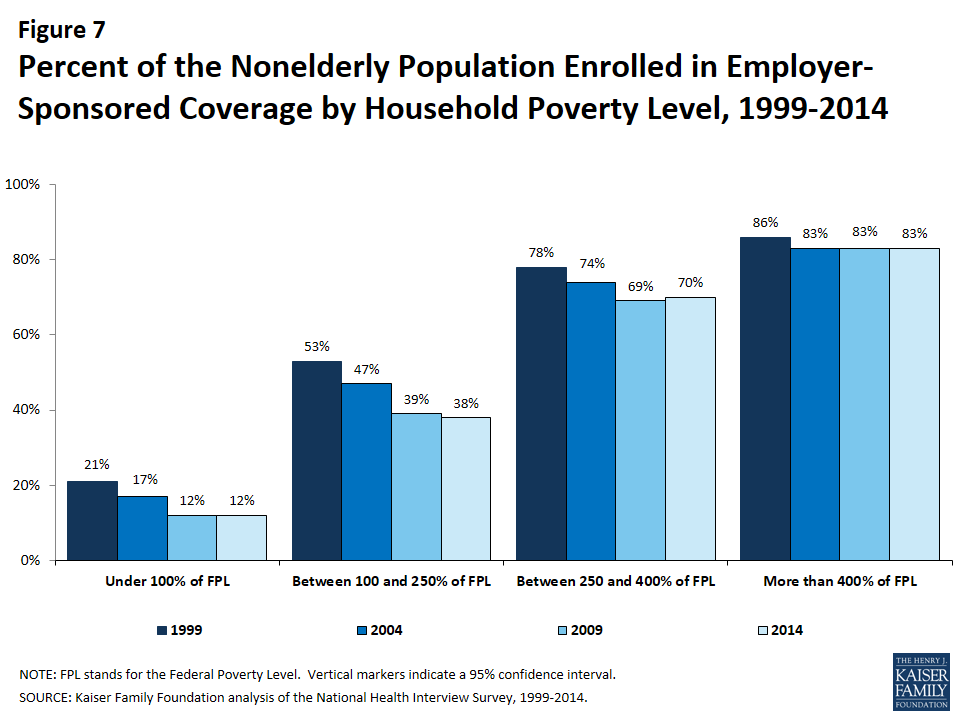
There have not been significant changes recently in the percentage of people covered by ESI based on income; a similar percentage of people have been covered by ESI for households in each of the income groups between 2009 and 2014. Since 2013, there has not been a significant change in the percentage of people covered by ESI within any of the household income groups.
Coverage Differences by Age
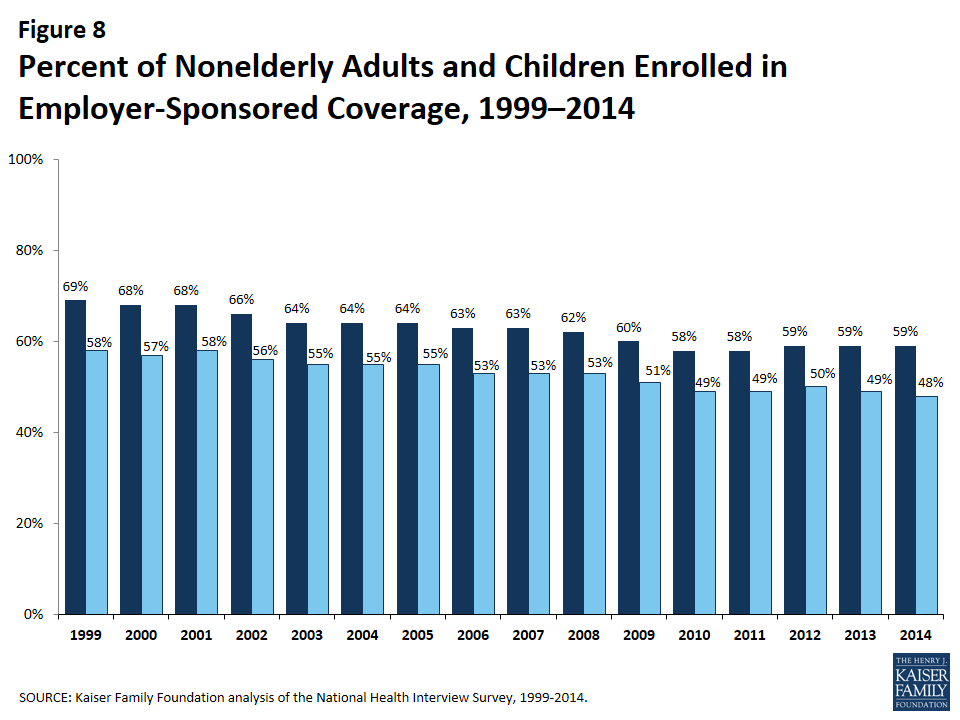
ESI is a more prevalent source of coverage for adults than children (Figure 8). In 2014, 59% of nonelderly adults (ages 19 to 64) were covered by ESI compared to half of children under 19. The percentage of both nonelderly adults and children covered by ESI has decreased since 1999. There are important differences by income; 86% of children in households above 400% of the FPL are covered by employer coverage compared to 6% of children in households under 100% of the FPL and 35% of children between 100 and 250% of the FPL. The percentage of both nonelderly adults and children covered by ESI has decreased since 1999. The growth in public programs, namely State Children’s Health Insurance Program (SCHIP), plays an important role in coverage for children.
Conclusion
Employer-sponsored coverage became the central component of the American health insurance system for a variety of reasons, including the tax preference of employer’s spending on health benefits over wages, as well as the advantages of purchasing coverage as a group rather than as individuals. Many employers and employees continue to believe that offering health benefits is an important way for firms to recruit, retain and value talent. With employers facing rising costs, many commentators are speculating about the long-term stability of the employer-sponsored insurance system.
While employer-sponsored coverage remains the most common source of healthcare coverage, a smaller proportion of people are covered by employers than a decade ago. Estimates from the non-partisan Congressional Budget Office (CBO) suggest that employer coverage will remain the leading source of insurance coverage for nonelderly Americans even after the ACA is fully implemented.13 At the same time, changes in the American workforce and economy will continue to impact employer coverage. Health reform has expanded coverage to the uninsured while providing incentives for employers to continue to offer benefits (such as tax credits for small employers who offer coverage and penalties for large employers who do not). How employers respond to increasing costs and regulatory changes will, in part, determine how people receive coverage in the years to come.
Gary Claxton, Matthew Rae, and Michelle Long are with the Kaiser Family Foundation. Anthony Damico is an independent consultant to the Kaiser Family Foundation.
Endnotes
- The National Health Interview Survey (NHIS) is a national probability survey of American Households sponsored annually by the U.S. Census Bureau and the Center for Disease Control and Prevention (CDC). Although NHIS was started in 1957, the survey was redesigned in 1997; therefore, in most cases, this analysis uses the years 1999 through 2014. For more information on NHIS, please see http://www.cdc.gov/nchs/nhis.htm. ↩︎
- While individuals who are offered coverage that meets minimum value and affordability requirements may purchase coverage on the health insurance exchanges, they are not eligible for advanced premium tax credits or cost-sharing subsidies. ↩︎
- Individuals covered by Tricare are included among those with ESI. Some individuals have multiple types of coverage; individuals who are covered by a Medicaid or Medicare Part B in addition to an employer plan are not included. Individuals who are covered by Medicare Part A and an employer plan are assumed to have ESI as their primary coverage (less than 1% in 2014). Regardless of secondary coverage source, 57% of non-elderly people are covered by ESI. ↩︎
- Reschovsky, James, Strunk, Bradley, and Ginsburg, Paul. “Why Employer-Sponsored Insurance Coverage Changed, 1997–2003.” Health Affairs. May 2006 vol. 25 no. 3774-782. ↩︎
- According to the Bureau of Labor Statistics, the civilian labor force participation rate decreased from 67.2% in January 1999 to 62.9% in January 2014. http://data.bls.gov/timeseries/LNS11300000. During the same periods, the percentage of workers who usually work part-time increased. See the Bureau of Labor Statistics at http://www.frbsf.org/economic-research/publications/economic-letter/2013/august/part-time-work-employment-increase-recession/. ↩︎
- Kaiser Family Foundation, Health Research and Educational Trust. 2014 Employer Health Benefits Survey [Internet]. Menlo Park (CA): KFF; 2014 Sep [cited 2016 Jan 15]. Available from https://modern.kff.org/report-section/ehbs-2014-section-two-health-benefits-offer-rates/. ↩︎
- Kaiser Family Foundation, Health Research and Educational Trust. 2014 Employer Health Benefits Survey [Internet]. Menlo Park (CA): KFF; 2014 Sep [cited 2016 Jan 15]. Available from https://modern.kff.org/report-section/ehbs-2014-section-three-employee-coverage-eligibility-and-participation/. ↩︎
- This analysis uses the U.S. Census Bureau’s definition of families and poverty thresholds. In 2014, the federal poverty threshold was $24,008 for a family of four including two children. “Poverty Thresholds 2014.” U.S. Census Bureau. Social, Economic, and Housing Statistics Division. https://www.census.gov/hhes/www/poverty/data/threshld/. ↩︎
- It is important to note that NHIS uses the Census Bureau’s federal poverty thresholds, while HHS and this portion of the brief use federal poverty guidelines to determine eligibility for some public assistance programs. ↩︎
- Health Insurance Marketplace Calculator. http://modern.kff.org/interactive/subsidy-calculator/. ↩︎
- A person’s family poverty threshold is often, but not always, the same as his or her exchange marketplace eligibility level, which is based on the federal poverty guidelines. ↩︎
- In states that elected to expand Medicaid to the federal maximum, households up to 138% of the FPL will be eligible for Medicaid. Only households between 100 and 400% of the FPL are eligible for exchange subsidies. For more information on premium subsidies please see “Explaining Health Care Reform: Questions About Health Insurance Subsidies.” Kaiser Family Foundation, October 2014. https://modern.kff.org/health-reform/issue-brief/explaining-health-care-reform-questions-about-health/. ↩︎
- Effects of the Affordable Care Act on Health Insurance Coverage: CBO’s March 2015 Baseline, Congressional Budget Office. https://www.cbo.gov/sites/default/files/cbofiles/attachments/43900-2015-03-ACAtables.pdf. ↩︎