Individual Insurance Market Performance in 2019
Issue Brief
The early years of the Affordable Care Act (ACA) exchanges and broader ACA-compliant individual market were marked by volatility. Markets in some parts of the country have remained fragile, with little competition, an insufficient number of healthy enrollees to balance those who are sick, and high premiums as a result. By 2017, however, the individual market generally had begun to stabilize, and by 2018 insurers in the ACA-compliant market were highly profitable, despite the elimination of cost-sharing subsidy payments and expansion of short-term plans. However, 2019 was the first year that the repeal of the individual mandate penalty went into effect, raising concerns that healthy enrollees would forgo coverage, leaving sicker and more expensive enrollees behind and requiring insurers to increase premiums. Nonetheless, Marketplace premiums fell slightly on average going into 2019, as it became clear that some insurers had raised 2018 rates more than was necessary (and premiums dropped again heading into 2020).
In this brief, we analyze data from 2011 through 2019 to examine how the individual insurance market performed under the ACA and, most recently, without the individual mandate in place. We use financial data reported by insurance companies to the National Association of Insurance Commissioners and compiled by Mark Farrah Associates to look at the average premiums, claims, medical loss ratios, gross margins, and enrollee utilization in the individual insurance market, as well as the amount of medical loss ratio rebates insurers expect to issue to 2019 enrollees. These figures include coverage purchased through the ACA’s exchange marketplaces and ACA-compliant plans purchased directly from insurers outside the marketplaces (which are part of the same risk pool), as well as individual plans originally purchased before the ACA went into effect.
We find that, on average, individual market insurers remained profitable through 2019. Further, despite the absence of the mandate penalty, data indicate that the individual market has not become significantly less healthy. These new data from 2019 offer further evidence that the individual market is stable even without a mandate penalty, though several factors – notably the coronavirus pandemic, economic downturn, and ongoing lawsuit seeking to strike down the ACA – cloud expectations somewhat for the future.
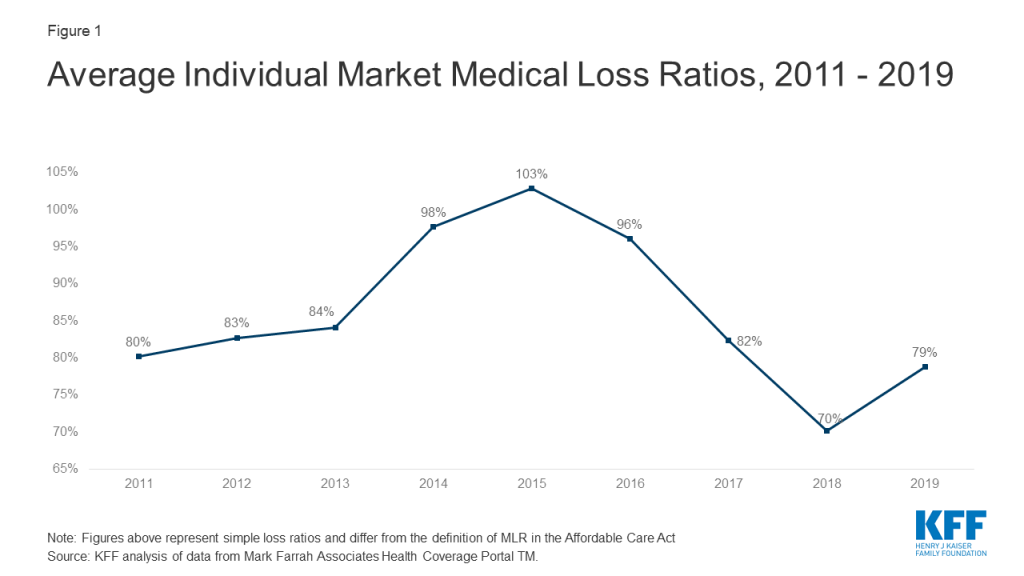
Medical Loss Ratios
As we found in our previous analysis, insurer financial performance as measured by loss ratios (the share of health premiums paid out as claims) worsened in the earliest years of the ACA Marketplaces, but began to improve in recent years. This is to be expected, as the market had just undergone significant regulatory changes in 2014 and insurers had very little information to work with in setting their premiums.
The chart below shows simple loss ratios, which differ from the formula used in the ACA’s MLR provision.1 Loss ratios began to decline in 2016, suggesting improved financial performance. In 2017, following relatively large premium increases, individual market insurers saw significant improvement in loss ratios, a sign that individual market insurers on average were beginning to better match premium revenues to claims costs. Loss ratios continued to decline in 2018, averaging 70%, suggesting that insurers were able to build in the loss of cost-sharing subsidy payments when setting premiums and some insurers over-corrected. With such low ratios, insurers could not justify premium hikes for 2019, and loss ratios rebounded to average 79% in 2019.
Margins
Another way to look at individual market financial performance is to examine average gross margins per member per month, or the average amount by which premium income exceeds claims costs per enrollee in a given month. Gross margins are an indicator of performance, but positive margins do not necessarily translate into profitability since they do not account for administrative expenses.
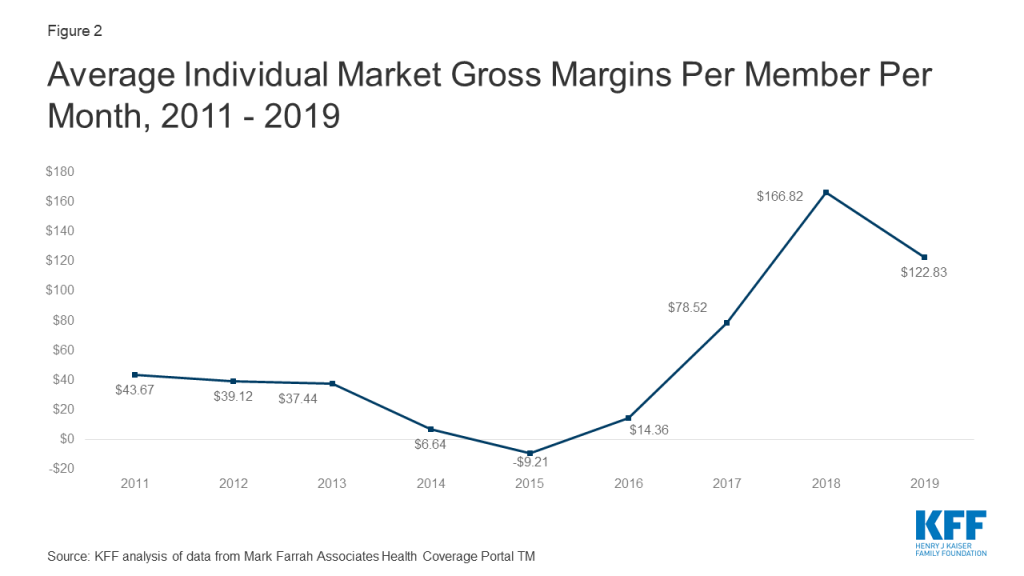
Gross margins show a similar pattern to loss ratios. Insurer financial performance improved dramatically through 2018 (increasing to $167 per enrollee, from a recent annual low of -$9 in 2015). Margins fell an average of $44 per member per month from 2018 to 2019, but they remain higher than all other years before 2018. These data suggest that insurers in this market remain financially healthy, on average.
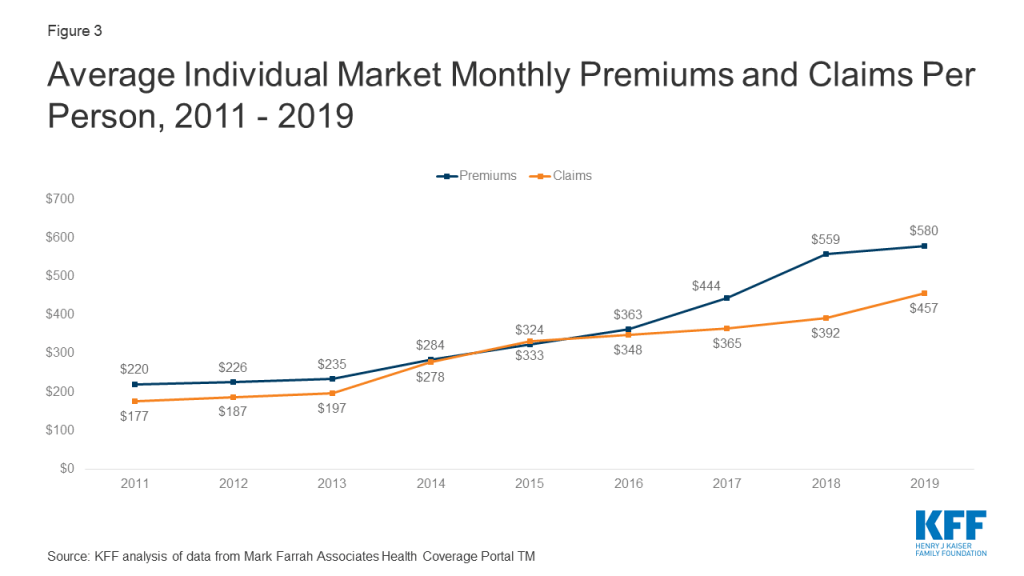
Underlying Trends
Premiums per enrollee rose slightly in 2019 following steep increases in 2018, while per person claims continued to grow modestly. On average, per member per month premiums grew 4% from 2018 to 2019, and per person claims grew 17%.2
One concern about the elimination of the individual mandate penalty was whether healthy enrollees would drop out of the market in large numbers. However, the average number of days individual market enrollees spent in a hospital in 2019 was slightly lower than inpatient days in the previous four years.3
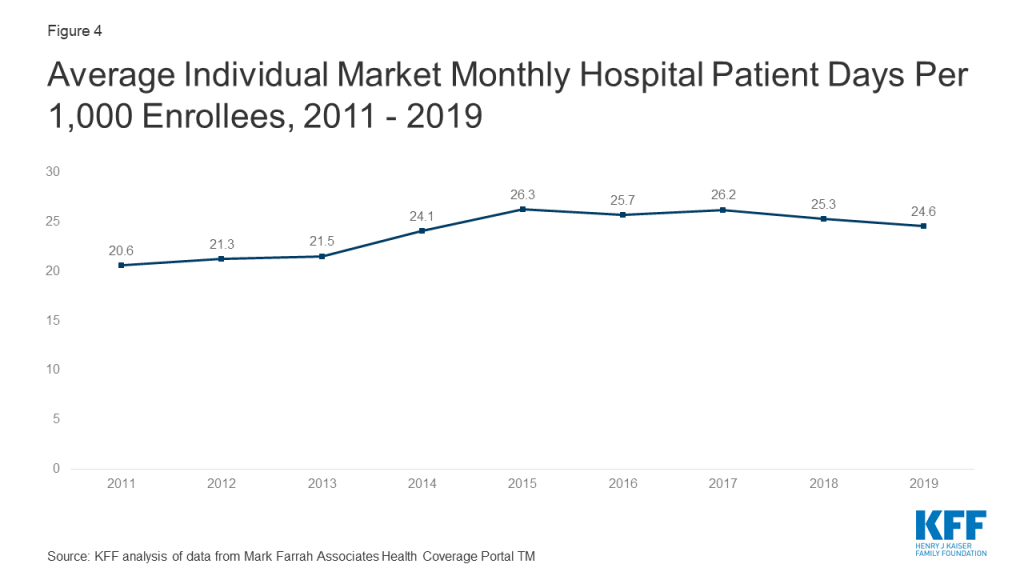
Taken together, these data on claims and utilization suggest that the individual market risk pool is relatively stable, though sicker on average than the pre-ACA market, which is to be expected since people with pre-existing conditions have guaranteed access to coverage under the ACA. Despite concerns that healthier enrollees may be dropping out of the market in recent years, somewhat lower average inpatient days indicate that the individual market did not get sicker, on average, during 2019.
Discussion
Annual results from 2019 suggest that despite the reduction of the individual mandate penalty to $0 the individual insurance market has remained stable. Insurer financial results from 2019 – the first year the repeal of the individual mandate penalty went into effect – reveal yet another favorable year for insurers in the ACA-compliant market. The repeal of the individual mandate penalty and expansion of short-term plans does not appear to have led to a significantly sicker group of enrollees, as hospitalization rates remain stable.
Our recent analysis also finds that individual market insurers expect to pay a record total of nearly $2 billion in rebates to consumers for falling below the ACA medical loss ratio threshold, which requires insurers to spend at least 80% of premium revenues on health care claims or quality improvement activities. This is more than double the amount insurers paid out in rebates last year. In total, across the individual, small group, and large group markets, insurers expect to issue about $2.7 billion in rebates this year based on their 2019 performance, nearly double last year’s previous record high of $1.4 billion.
While markets in some parts of the country have limited insurer participation and high premiums, the individual market on average remains profitable. In the last two years, some insurers have entered the market and others have expanded their footprints, as would be expected in a competitive marketplace. With a continuing legal battle threatening the exchange markets and the ACA as a whole, significant uncertainties remain. While insurers are now locked in to 2020 premiums for ACA-compliant plans, it remains to be seen how continued uncertainty around the coronavirus pandemic, the economic crisis, and the future of the ACA may affect premiums and plan participation in 2021 or beyond.
Methods
We analyzed insurer-reported financial data from Health Coverage Portal TM, a market database maintained by Mark Farrah Associates, which includes information from the National Association of Insurance Commissioners. The dataset analyzed in this report does not include NAIC plans licensed as life insurance or California HMOs regulated by California’s Department of Managed Health Care; in total, the plans in this dataset represent at least 80% of the individual market. All figures in this issue brief are for the individual health insurance market as a whole, which includes major medical insurance plans and mini-med plans sold both on and off exchange. We excluded some plans that filed negative enrollment, premiums, or claims and corrected for plans that did not file “member months” in the annual statement but did file current year membership.
To calculate the weighted average loss ratio across the individual market, we divided the market-wide sum of total incurred claims by the sum of all unadjusted health premiums earned. Medical loss ratios in this analysis are simple loss ratios and do not adjust for quality improvement expenses, taxes, or risk program payments. Gross margins were calculated by subtracting the sum of total incurred claims from the sum of unadjusted health premiums earned and dividing by the total number of member months (average monthly enrollment) in the individual insurance market. Using earned premiums adjusted for taxes and fees to calculate loss ratios and gross margins increases the MLR by 4 percentage points and decreases the gross margin per member by $31 in 2019. On average across all years, using earned premiums adjusted for taxes and fees increases the MLR by 3 percentage points and decreases the gross margin per member by $16.
Endnotes
- The loss ratios shown in this issue brief differ from the definition of MLR in the ACA, which makes some adjustments for quality improvement and taxes, and do not account for reinsurance, risk corridors, or risk adjustment payments. Reinsurance payments, in particular, helped offset some losses insurers would have otherwise experienced. However, the ACA’s reinsurance program was temporary, ending in 2016, so loss ratio calculations excluding reinsurance payments are a good indicator of financial stability going forward. ↩︎
- Average premiums per member per month increased in 2019, even while average unsubsidized premiums for the lowest-cost plans in each metal tier went down, because average premiums per member per month reflect changes in the age and geographic distribution of enrollees, changes in plans selected by enrollees, and changes in subsidy amounts. ↩︎
- Hospital patient days for 2014 are not necessarily representative of the full year because open enrollment was longer that year and a number of exchange enrollees did not begin their coverage until mid-year 2014. ↩︎