Sexually Transmitted Diseases in America: Exposing the Epidemic – Resource List

Published: Nov 1, 1996

Sexually Transmitted Diseases In America:

Exposing the Epidemic

November 20, 1996

Briefing Participants:

Peggy ClarkePresidentAmerican Social Health AssociationP.O. Box 13827Research Triangle Park, NC27709919/361-8400Press contact: Sharon Broom919/361-8416

Jacqueline Darroch Forrest, Ph.D.Vice President for ResearchThe Alan Guttmacher Institute120 Wall StreetNew York, NY 10005Press Contact: Susan Tew212/248-1111 ext. 208

Helene D. Gayle, M.D., M.P.H.Director, National Center forHIV, STD,and TB PreventionCenters for Disease Control and Prevention MSEO71600 Clifton RoadAtlanta, GA 30333Press contact: Melissa Shepard404/639-8890

Penelope Hitchcock, D.V.M., M.S.Chief, STD Branch, NIAIDNational Institutes of HealthRm. 3A21, Solar Building6003 Executive Blvd.Rockville, MD 20892301/402-0443

Azadeh Khalili Executive DirectorHIV/AIDS Technical Assistance Project131 Livingston St.Brooklyn, NY 11201718/935-5606

Felicia H. Stewart, M.D.Director of Reproductive HealthProgramsKaiser Family Foundation2400 Sand Hill RoadMenlo Park, CA 94025Press Contact: Tina Hoff,Communications Program Officer415/ 854-9400, ext. 106

Kathleen Toomey, M.D.State Epidemiologist andDirector, Epidemiology andPrevention BranchDivision of Public HealthDepartment of Human Resources2 Peachtree Street, NWAtlanta, GA 30303404/657-2588Press contact: Joyce Goldberg404/656-4937

Judith Wasserheit, M.D.Director, Division of STD/HIV PreventionCenters for Disease Control and Prevention MSEO21600 Clifton RoadAtlanta, GA 30333404/639-8260Press contact: Melissa Shepard404/639-8890

Other References:

American College of Obstetriciansand GynecologistsDepartment of Public InformationPO Box 96920Washington, DC 20090-6920Media Inquiries: (202)484-3321

Barbara LevineDirector of Government Relations and Affiliate AffairsAmerican Public Health Association1015 15th Street, NWWashington, DC 20005Press office: 202/789-5677Week of 11/17 – 11/19 only:212/261-6365

Marie BassProject Director, Reproductive Health Technologies ProjectBass and Howes1818 N Street, NWSuite 450Washington, DC 20036202/530-2900

Leslie Wolfe, Ph.D.PresidentCenter for Women Policy Studies1211 Connecticut Ave., NWSuite 312Washington, DC 20036202/872-1770

Tom Eng, W.M.D., M.P.H.Study DirectorInstitute of MedicineNational Academy of Sciences2101 Constitution AvenueWashington, DC 20418Press contact: Molly Galvin202/334-2138

Susan Wysocki, R.N.C., M.P.PresidentNational Association ofNurse Practitioners in ReproductiveHealth1090 Vermont Avenue, NWSuite 800Washington, DC 20005202/408-7025

Marilyn KeefeDirector of ServicesNational Family Planningand Reproductive Health Association122 C Street, NWSuite 380Washington, DC 20001202/628-3535

Carolyn PatiernoCo-ChairpersonSTD Prevention PartnershipDirector of Program ServicesSexuality Information andEducation Council of the UnitedStates (SIECUS)130 West 42nd Street, Suite 350New York, NY 10036-7802212-819-9770, ext.305

For information about local/regional spokespeople on STDs, call:Joan CatesAmerican Social Health Association919-361-8417

Return to top

Sexually Transmitted Diseases in the United States: Exposing the Epidemic:Fact Sheet Q & A Resource List

The Kaiser Survey About Public Knowledge and Attitudes About STDs Other Than AIDS

Published: Nov 1, 1996

A summary and toplines from a national survey conducted for the Foundation by Market Facts, Inc. of public knowledge about STDs overall and their attitudes towards policy options to confront the spread of STDs. This survey was released at a briefing on Sexually Transmitted Diseases: Exposing the Epidemic.

Medicaid Update: Expenditures and Beneficiaries in 1994

Published: Oct 30, 1996

Table 1Medicaid Beneficiaries by Group, 1988-1994 United States Beneficiaries (thousands) Average Annual Growth (%) Beneficiary Group 1988 1990 1992 1993 1994 1988-1994 1988-90 1990-92 1992-94 1988-94 All Beneficiaries 22,014 24,066 29,811 32,441 34,183 7.6 4.6 11.3 7.1 9.2

Cash Assistance 15,945 16,144 18,460 19,475 19,847 3.7 0.6 6.9 3.7 4.5

Other Beneficiaries 6,068 7,922 11,351 12,966 14,336 15.4 14.3 19.7 12.4 18.8 Elderly 3,130 3,167 3,547 3,680 3,828 3.4 0.6 5.8 3.9 4.1

Cash Assistance 1,664 1,532 1,573 1,564 1,574 -0.9 -4.1 1.3 0.0 -1.1

Other Beneficiaries 1,466 1,635 1,974 2,116 2,254 7.4 5.6 9.9 6.8 9.0 Blind and Disabled 3,443 3,717 4,471 4,991 5,381 7.7 3.9 9.7 9.7 9.3

Cash Assistance 2,753 2,966 3,517 3,906 4,223 7.4 3.8 8.9 9.6 8.9

Other Beneficiaries 690 750 954 1,085 1,159 9.0 4.3 12.8 10.2 10.9 Adults 5,081 5,696 6,982 7,451 7,860 7.5 5.9 10.7 6.1 9.1

Cash Assistance 3,867 3,865 4,379 4,568 4,571 2.8 0.0 6.4 2.2 3.4

Other Beneficiaries 1,214 1,831 2,603 2,884 3,288 18.1 22.8 19.2 12.4 22.0 Children 10,360 11,486 14,811 16,319 17,115 8.7 5.3 13.6 7.5 10.6

Cash Assistance 7,662 7,781 8,992 9,437 9,479 3.6 0.8 7.5 2.7 4.3

Other Beneficiaries 2,698 3,706 5,820 6,882 7,635 18.9 17.2 25.3 14.5 23.1 Source: Urban Institute calculations based on HCFA 2082 data. Does not include the US Territories. Totals may not add due to rounding. “Cash” refers to beneficiary groups who receive AFDC or SSI. “Other” groups (non-cash, poverty-related) include the medically needy, poverty-related expansion groups, and 1115 waiver eligibles (where identifiable). Beneficiaries are defined as individuals enrolled in the Medicaid program who actually receive medical services.

Uninsured Children in the South

Published: Oct 30, 1996

Over 4 million Southern Children have no Health Insurance

Embargoed for release until: 8:30 am, ET, Monday, December 9, 1996

For more information contact: Chris Ferris (202)347-5270

New Study:

Despite Recent Gains, South Still Home to Disproportionate Share ofNation’s Uninsured Children

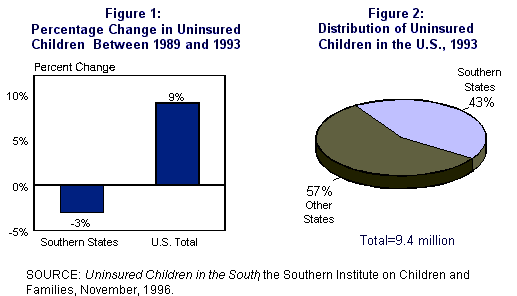
Washington, D.C. — A new report, sponsored by the Kaiser Family Foundation and prepared by the Southern Institute on Children and Families, finds that the South was home to 4.1 million uninsured children in 1993. The number of uninsured children in the South declined 3 percent between 1989 and 1993, at the same time the number of uninsured children in the country on the whole increased 9 percent (Figure 1). Over a third (36 percent) of the nation’ children live in the South, but the region accounted for a disproportionatelyhigh share (43 percent) of America’uninsured children (Figure 2).

1210-uninsured_12.gif

“Although we witnessed a reduction in the number of uninsured children in the South,” said Sarah Shuptrine, principal author of the study, “in some states as many as one in four children are still uninsured.” The proportion of uninsured children in the South ranged from 25 percent in Louisiana to 10 percent in North Carolina and Missouri. Nineteen percent of the children in Texas, the largest state in the region, were without insurance. These 1 million uninsured Texan children accounted for one-fourth of all uninsured children in the South.

The reductions in the number of uninsured children in the South were due in part to changes in federal Medicaid laws that required states to expand income eligibility levels for children and to increase gradually the minimum eligibility age. All but three Southern states expanded eligibility levels beyond the federal requirements, making even more children eligible for coverage under Medicaid.

1210-uninsured_3.gif

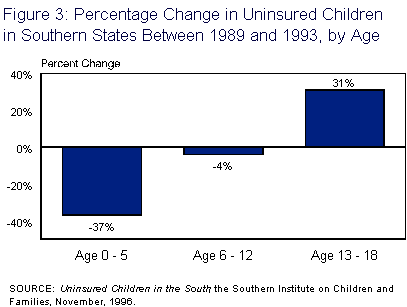
The number of uninsured children under age 6–the focus of Medicaid expansion efforts–decreased by 37 percent in the South during this period. In contrast, the number of uninsured teenagers (age 13-18) increased 31 percent (Figure 3). That more younger children have insurance is closely related to the targeted extension of Medicaid coverage to these age groups.

“The impact of Medicaid expansions is clear when the changes in number of uninsured children between 1989 and 1993 are examined by age groups,” said Diane Rowland, Senior Vice President of the Kaiser Family Foundation. “Medicaid has filled many of the gaps in health insurance for children, but not all children eligible for Medicaid are currently covered.” Lack of information about the availability of Medicaid coverage and eligibility barriers leave many Southern children outside of the program’s reach.

The report suggests steps that states could take to increase enrollment in Medicaid that do not require federal waivers: raising age and income eligibility levels even further; eliminating the Medicaid assets test for children; and engaging in outreach to enroll children already eligible for Medicaid.

The study analyzed 1994 Current Population Survey (CPS) data for 17 Southern states and the District of Columbia. Because of recent revisions to the CPS questionnaire, the 1994 CPS–which provided 1993 data–is the latest that can be reliably compared to earlier years. The report provides estimates of the number of uninsured children in 1993, trends in the number of uninsured children between 1988 to 1993, and 1996 Medicaid eligibility levels for each of the states. Data from the following states, along with the District of Columbia, were included in this report’s analysis: Alabama, Arkansas, Delaware, Florida, Georgia, Kentucky, Louisiana, Maryland, Mississippi, Missouri, North Carolina, Oklahoma, South Carolina, Tennessee, Texas, Virginia, and West Virginia.


The Kaiser Family Foundation, based in Menlo Park, California, is a non-profit, independent national health care philanthropy and is not associated with Kaiser Permanente or Kaiser Industries.

Single copies of Uninsured Children in the South are available by calling the Kaiser Foundation’s publication request line at 1-800-656-4533.

Return to top

Uninsured Children in the South:Press Release Fact Sheet

Medicaid Update: Expenditures and Beneficiaries in 1994 – Policy Brief

Published: Oct 30, 1996

Medicaid Expenditures and Beneficiaries: 1994 Update

October 1998

Medicaid is the nation’s major public financing program for low-income Americans. After several years of rapid increase in the early 1990s, enrollment and spending growth have moderated and returned to historical levels. For the second consecutive year, annual growth in Medicaid spending was under 10 percent. The estimates presented in this policy brief are based on analyses prepared by The Urban Institute and update previous analyses conducted for the Kaiser Commission on the Future of Medicaid.

Medicaid in 1994

In 1994, Medicaid financed health care services for 34.2 million low-income individuals at a cost of $137.1 billion federal and state dollars. Spending including administrative costs and other adjustments totaled $143.7 billion. Medicaid serves multiple roles for the populations it covers. For adults and children in low-income families, it provides health care coverage for medical care. For persons with special needs and disabilities, and for the nursing home elderly, it also finances long-term care assistance. For low-income elderly and disabled Medicare beneficiaries, it pays for Medicare’s premium and cost-sharing requirements and can provide coverage for additional services.

  • Adults and children in low-income families continue to comprise nearly three quarters of Medicaid enrollment, yet account for only 28 percent of program spending.

    In 1994, the Medicaid program covered health care services for 17.1 million children and 7.9 million low-income adults at a cost of $23.3 billion and $15.5 billion, respectively (Figure 1, Tables 1 and 2). This low-income population is generally comprised of adults and children in AFDC families; low-income infants, children and pregnant women; medically needy individuals, and those with coverage extended through Section 1115 Demonstration waivers.

  • Blind and disabled persons comprise 16 percent of Medicaid enrollment, but spending on their acute and long-term care account for one third of program costs.

    In 1994, 5.4 million nonelderly people with developmental disabilities, severe mental illness, and physical disabilities received Medicaid assistance. Because of their complex health care needs, they often require both expensive acute and long-term care assistance. Spending on services for this population was $45.3 billion in 1994.

  • The elderly population accounts for 11 percent of enrollment and 26 percent of program spending.

    Medicaid financed services for 3.8 million elderly persons at a cost of $36.1 billion. In addition to financing acute and long-term care services, Medicaid also pays Medicare’s cost sharing, premiums, and deductibles for approximately 3.7 million low-income Medicare beneficiaries (QMBs and SLMBs).

  • The eligibility groups covered by Medicaid have very different per beneficiary costs because of their diverse health care needs. Average spending per beneficiary was $1,360 per child and $1,974 per low-income adult (Figure 2). In contrast, average spending was $8,421 for blind and disabled persons and $9,437 for elderly people. Because of their often extensive acute care as well as long-term health care needs, per beneficiary spending is considerably higher for the elderly and disabled than for low-income adults and children.

Medicaid pays for a wide spectrum of services including acute medical and long-term care services. It also pays for HMO and Medicare premiums, as well as special payments to hospitals that care for a disproportionately large share of uninsured individuals and Medicaid beneficiaries, known disproportionate share hospitals (DSH).

  • Slightly over half (52%) of Medicaid spending on services for beneficiaries was for acute care.

    Inpatient hospital care spending accounted for 19 percent of spending; prescription drug payments, 6 percent; and physician and outpatient care, 13percent of spending (Figure 3). About 7 percent of Medicaid spending paid for premiums to HMOs and other managed care plans as well as to Medicare.

  • Long-term care services constitute over one third (36 percent) of Medicaid costs.

    In 1994, about 21 percent of spending went to nursing homes and 6 percent covered home care expenses for persons living in the community. Another 7 percent financed care in intermediate care facilities for the mentally retarded (ICF-MR) and the remaining 2 percent covered mental health services.

  • Payments to disproportionate share hospitals accounted for 12 percent of total program spending for services.

    Medicaid spent $16.9 billion on DSH payments in 1994. DSH payments are declining as a share of Medicaid spending.

Recent National Trends

Enrollment

Medicaid enrollment has risen steadily in recent years. Over the past four years, enrollment has increased by 10 million people from 24 million in 1990 to over 34 million in 1994 (Figure 4). From 1990 to 1992, Medicaid enrollment rose an average of 11.3 percent per year. This growth occurred in response to federal and state expansions in eligibility and the economic recession that increased the number of people eligible for Medicaid coverage. Enrollment is growing more slowly, increasing 5.4 percent from 1993 to 1994 compared to an 8.8 percent increase from 1992 to 1993 (Table 1).

  • Medicaid enrollment grew by 1.8 million persons in 1994.

    Two thirds of the new enrollment in 1994 was among children (46 percent) and low-income adults (23 percent). While the number of persons eligible for Medicaid increased, the rate of growth in enrollment has generally slowed (Table 1). Enrollment among the disabled population rose 7.8 percent, marking a reduction from 11.6 percent in 1993. Although low-income children and adults accounted for the majority of the new beneficiaries, enrollment in these populations only rose 5.5 percent and 4.9 percent, respectively.

  • The share of beneficiaries who qualify for Medicaid because they receive Aid to Families with Dependent Children (AFDC) or Supplemental Security Income (SSI) is declining.

    In 1988, nearly three quarters (72 percent) of Medicaid beneficiaries qualified for Medicaid because they received cash assistance (Figure 5). By 1994, this number had fallen to 58 percent. This is occurring because Medicaid was expanded in recent years to extend eligibility to certain populations who are low-income, but do not qualify for cash assistance. Although enrollment in both populations is rising, average annual growth in the cash assistance population was 3.7 percent between 1988 and 1994 compared to 15.4 percent for populations who qualify because of poverty-related eligibility such as pregnant women, infants, young children, and Qualified Medicare Beneficiaries (QMBs), or through the medically needy option.

Costs

The rapid rate of Medicaid spending growth seen in the early 1990s has largely subsided. From 1993 to 1994, Medicaid spending rose only 7.6 percent, substantially lower than earlier projections exceeding 10 percent annual growth. In the early 1990s, growth in Medicaid spending peaked at 28 percent. Earlier Kaiser Commission analyses found that this rapid growth was equally attributable to three major factors: medical price inflation, rapid enrollment growth, and state financing mechanisms that permitted states to receive additional levels of federal support.

  • The rate of Medicaid spending growth has slowed dramatically.

    From 1993 to 1994 , Medicaid spending increased 7.6 percent, rising from $127.4 billion to $137.1 billion (Figure 6). This was the smallest annual net increase in the past four years. Reductions in spending growth reflect federal limits on state use of provider taxes and donations, caps on DSH payments, a slowing in the rate of medical price inflation, and lowered enrollment growth.

  • Payments to disproportionate share hospitals fell nearly 1 percent from 1993 to 1994, dropping from 17.0 billion to 16.9 billion.

    This marks a dramatic departure from 1991 when growth in payments for DSH peaked, increasing over 250 percent in one year (Table 2). Federal legislation enacted in 1991 which capped DSH spending has effectively curtailed the growth in these payments.

  • The relative contribution of the factors that drive growth in spending have changed.

    Growth in Medicaid spending can be attributed to three basic factors: enrollment, the average amount spent per beneficiary, and DSH payments. DSH payments, which had accounted for nearly half of the increase from 1991 to 1992 when growth was fastest, were a negative contributor to growth (-1.3 percent). In other words, if the decline in DSH payments had been the only change in Medicaid, spending would have actually fallen by $125 million. Because DSH payments were down, the relative contribution of enrollment to spending increase was larger at 71 percent, even though actual enrollment growth was only 5.4 percent.

  • The rapid growth in Medicaid managed care enrollment is influencing the distribution of costs.

    From 1993 to 1994, the share of spending growth attributable to hospital inpatient care, hospital outpatient, clinic and physician care either fell or stayed the same. In contrast, payments to HMOs accounted for 18 percent of the total growth in Medicaid spending, up from 10 percent in the prior year. While this may not reflect actual changes in spending, it does represent a shift in how Medicaid accounts for its expenditures. As growth in managed care continues, particularly in capitated payments, it will become increasingly difficult to know how spending is allocated by service.

State Variations: 1992 to 1994

Medicaid is jointly financed by the states and federal government, but states administer the program and have considerable latitude in setting eligibility levels, scope of benefits, and provider payment rates. Consequently, sizable variation is evident in enrollment and spending growth and per beneficiary costs at the state level.

  • The rate of enrollment growth differs considerably from state to state.

    Every state reported an increase in enrollment in the 1992 to 1994 period, but the size of the increase varied measurably. Although the average for the nation was a 7.1 percent increase in the number of beneficiaries, in states such as Tennessee and Montana, enrollment growth exceeded 20 percent (Table 4). In contrast, the rise in enrollment was under 2 percent in Massachusetts and Minnesota, states that already had relatively broad programs.

  • Broad variation is seen in average state spending per beneficiary.

    Average spending per beneficiary is determined in large part by the breadth of the state’s program, the composition of the Medicaid population, and local costs for health care services. Overall, spending per beneficiary was lowest in the South and highest in the Northeast. The US average was $4,011. States ranged from a low of $2,167 per beneficiary in Tennessee to a high of $6,447 per beneficiary in New York.

  • Because states have made different decisions in program structure, there are also large differences in the rate of growth in Medicaid spending.

    Nationally, program spending on services grew at an average annual rate of 9.1 percent between 1992 and 1994, ranging from a high of 20.7 percent in Hawaii and low of a reduction of 0.2 percent in Rhode Island. State policies on scope of benefits, eligibility, provider payment levels, DSH payments, and use of managed care all affect the growth in Medicaid spending.


This policy brief is based on an analysis conducted by the Urban Institute for the Kaiser Commissionon the Future of Medicaid. The full report “Medicaid Beneficiaries and Expenditures: National and State Profiles and Trends, 1988 to 1994” can be obtained from the Kaiser Commission by calling 1-800-656-4533.

The Kaiser Commission on the Future of Medicaid was established by the Henry J. Kaiser Family Foundation in 1991 to serve as a forum for analyzing, debating, and proposing future directions for Medicaid reform. The Commission and the Foundation are wholly separate from The Kaiser Permanante Medical Care Program and the Kaiser Industries.

Return to top

Medicaid Expenditures and Beneficiaries:Policy Brief Tables Chart Pack

Medicaid Update: Expenditures and Beneficiaries in 1994

Published: Oct 30, 1996

This policy brief analyzes Medicaid enrollment and spending in 1994. It examines changes in program enrollment and spending between 1992 and 1994 and explains the factors behind the spending growth. Detailed tables and trend information can be found in Medicaid Expenditures and Beneficiaries: National and State Profiles and Trends, 1984-1994 (#2045).This data book provides extensive informationon Medicaid expenditures and beneficiaries nationally and for each state in 1994. Information is included by type of service and beneficiary group (children, adults, elderly, and disabled). Trend informationon growth in beneficiaries and expenditures in each state is also included, as well as an analyses of the factors contributing to increases in Medicaid expenditures over the 1988-1994 period.

Uninsured Children in the South

Published: Oct 30, 1996


Over 4 million children living in the South have no health insurance coverage. While the South experienced a decrease (3 percent) in the number of uninsured children from 1989 to 1993 — the number of uninsured children nationally increased by 9 percent (Figure 1) — the region accounts for a dispro-portionately high share of uninsured children in America. Over a third (36 percent) of American children live in the South, but the region accounted for 43 percent of America’s uninsured children (Figure 2).

1210-uninsured_12.gif

Uninsured rate varies across States

Overall, 15 percent of children in the South are uninsured, but southern states vary widely in the proportion of their children without health insurance coverage.

  • The uninsured rate in the South ranges from 10 percent in North Carolina and Missouri to 25 percent in Louisiana.
  • At least one in five children in Louisiana, Oklahoma and Arkansas are uninsured.
  • Nineteen percent of the children in Texas, the largest state in the region, were without insurance. These 1 million uninsured Texan children accounted for one-fourth of all uninsured children in the South.

Older children most at risk

Of the 4 million uninsured, 43 percent were between the ages of 13 and 18 years; school age children 6 through 12 accounted for 37 percent; and preschool children under age 6 accounted for 20 percent. In 1993, 1.8 million southern teenagers had no insurance, of whom one third were poor.

1210-uninsured_3.gif

The number of uninsured children under age 6 — the focus of initial Medicaid expansion efforts — decreased by 37 percent in the South between 1989 and 1993 (Figure 3). In contrast, the number of uninsured teenagers increased 31 percent.

Medicaid’s Role

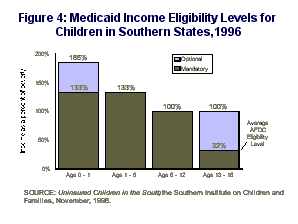
Medicaid is the federal-state health program for the poor. Reductions in the number of uninsured children in the South are largely attributable to changes in federal Medicaid laws that required states to expand income eligibility levels for children and to gradually increase the minimum eligibility age. Recent federal legislation required states to provide Medicaid coverage to children:

1210-uninsured_4.gif
  • under 1 yearwith family incomes up to 133 percent of poverty; states have the option to expand coverage to 185 percent and all southern states except Alabama, Arkansas, Louisiana and Virginia have gone beyond the federal minimum eligibility levels (Figure 4);
  • up to age 6with family incomes up to 133 percent of poverty; and
  • over age 6who are poor ($12,980 for a family of three in 1996). Poor children ages six to 12 are currently covered; states have the option to cover poor children up to age 18 and will be required to cover all poor children by the year 2002. Currently, seven southern states have extended coverage to these children. The remaining 10 states use AFDC eligibility levels, which average 32 percent of poverty, but range from 15 percent in Alabama to 54 percent in Tennessee.

Issues

These findings demonstrate the important role that Medicaid plays in covering children. However, Medicaid’s potential for covering uninsured children in the South is not fully realized, evidenced by the fact that 28 percent of uninsured children are poor. This is in part due to the fact that eligibility levels for teenagers (the ages where federal requirements for coverage of the poor have yet to be phased-in) still vary widely by state. For example, Texas covers only teens living in families who meet its state established AFDC eligibility levels — income below 17 percent of the federal poverty level.

In addition, not all children who are eligible for Medicaid participate in the program. Lack of information about the availability of Medicaid coverage, as well as eligibility barriers affect the ability of many needy families to gain Medicaid coverage for their children. In addition, recent changes in welfare policy and coverage of disabled children have the potential to reduce the number of children covered by Medicaid and to make information about the availability of Medicaid program more difficult to obtain.


Data presented in this factsheet are based on Uninsured Children in the South, prepared by the Southern Institute on Children and Families, November 1996. That study analyzed the 1994 Current Population Survey (CPS) data for 17 southern states and the District of Columbia. Because of recent revisions to the CPS questionnaire, 1994 — which provided 1993 data — is the latest that can be reliably compared to earlier years. Data are included for the District of Columbia and the following states: Alabama, Arkansas, Delaware, Florida, Georgia, Kentucky, Louisiana, Maryland, Mississippi, Missouri, North Carolina, Oklahoma, South Carolina, Tennessee, Texas, Virginia and West Virginia.

The Henry J. Kaiser Family Foundation is an independent national health care philanthropy and is not associated with Kaiser Permanente or Kaiser Industries. Established in 1948 by industrialist Henry J. Kaiser, the Foundation focuses its work on four main areas: health policy, reproductive health, HIV, and health and development in South Africa.

Return to top

Uninsured Children in the South:Press Release Fact Sheet


The Southern Institute on Children and Families: Uninsured Children in the South

Published: Oct 30, 1996

Second Report

The Southern Institute on Children and Families released the first report on Uninsured Children in the South in November 1992. The report provided estimates of uninsured children by state with age and income breakouts related to Medicaid. This is the second report on Uninsured Children in the South. It provides estimates of uninsured children in each southern state from two perspectives: number of uninsured children in 1993 with percent of uninsured children by age and income ranges, and decline or increase in the number of uninsured children between 1989 and 1993. Included in this report are fact sheets for the southern region as a whole and for the 17 southern states and the District of Columbia. The fact sheets contain state specific elegibility levels for Medicaid children. The source of the estimates of uninsured children is the Current Population Survey (CPS). The data were prepared by The Urban Institute using data specifications submitted by the Southern Institute on Children and Families for 1989 and 1993.

Access Uninsured Children in the South, December 2007.

Getting Behind the Numbers on Access to Care – Toplines/Survey

Published: Oct 22, 1996

Getting Behind the Numbers on Access to Care Project Randomly-Selected Verbatim Responses

Harvard School of Public Health, Henry J. Kaiser Family Foundation, National Opinion Research Center at the University of Chicago

October 1996

Methodology Note:

Survey respondents who reported that they were uninsured and/or had problems getting needed medical care or paying medical bills in the past year were asked the following question during their interview:

I would like you to tell me in your own words what happened to you as a result of the problems you have experienced. We are especially interested in the consequences of your [insert: not getting medical care that you thought you needed/time without insurance/problems in paying medical bills] on, for example, your physical or mental health, your family relationships, your employment or your household finances.

They were then asked to rate their consequences as “very serious”, “somewhat serious”, “not very serious”, or “not at all serious”. We have divided responses for the uninsured and insured by type and severity of problem and randomly selected several responses in each category for presentation here. Editorial changes are marked with brackets.

Insurance Status: Uninsured People Problem Group: Getting Needed Medical Care Self-rating of Severity of Consequences: Very or Somewhat Serious Sex Age Response Male 43 There were things that we should [have] gone to the doctor for but we didn’t. My wife has some illness that can’t be identified and now we can’t get medical coverage for her because of it. The doctors don’t seem too interested because of the lack of medical coverage for a pre existing condition. It’s shown me that the care is poor because of that and the lack of interest of doctors in patients that don’t have health insurance. Female 50 I worry because I’m single and I’m pushing 50 and I live alone and if anything would happened how I would get medical attention and I don’t know who would find me. I know I’m limited as to what I can do as far as physical labor. Male 38 It’s not fair to pay taxes to the government and not be able to get insurance for the family when those not working get everything for free when I have to take money out of pocket for medical expenses I don’t [have] money left for the family and other expenses. Female 45 I wanted to have children before my marriage broke up. I was trying to get health insurance to cover my husband who had had colitis and no one would cover him. It effected us more emotionally than any thing. Male 42 Just severe cough, bronchitis. Would have cost me about $300 to get help and I didn’t have it. I’m in pretty fair health so no consequences but at my age, probably coming in the future. [Has] not really affected me in any other way. Female 47 It was a procedure; I got a bad pap smear back and I needed to get another one done; lt was about 300 dollars. I realized that people need insurance because now I have a serious medical problem; I’m diabetic. I knew I was sick; too stubborn to go to doctors office like I was supposed to. Male 50 There was lot of pain [back pains] and I felt very bad. I felt nervous and problems sleeping. My penitentiary record made me lose my job and kept me from getting another one. I finally went to the county hospital. I went long enough just to get out of pain. Female 45 Government agencies have you go out and get $5.00 jobs and then they take away your health insurance. I get paid tomorrow and can I afford to pay health insurance. Mentally it make me mad they can’t understand why these woman won’t go to work, your better off not working than going to work. [Family relations affected?] Yes, but I don’t think you got enough paper to write it down. Female 36 I have a lump in my breast. It makes you scared at times knowing that something serious could happen and you’re not covered. It bothers me from time to time. Male 59 Not having insurance about 3 years ago I have pain in my right leg and I had to go to the county hospital to get a shot. You feel helpless. I had to go to the hospital and it’s so expensive back a little while ago I had food poisoning and I had to go to [personal identifier omitted] that was like $250 for maybe an hour or so I paid it but it took a while.

Insurance Status: Uninsured People Problem Group: Paying Medical Bills Self-rating of Severity of Consequences: Very or Somewhat Serious Sex Age Response Female 31 My two daughters have a problem with eyesight and I don’t have the money to go to the eye doctor and my children have a toothache and I don’t have the money to take them to the dentist. If I pay the doctor I don’t have the money to pay the rent and I won’t have a roof and its important to get food. Female 22 I was in a car accident, I had back and neck injury. I needed to go chiropractic care so I did and my insurance dropped the claim, and because of that I could no longer get chiropractic which makes my back worst than it was originally was. Male 32 Most of it was ’cause I was self employed. Kept tryin’ ’til I got care. Got a little upset then I felt a lot better when I finally did get it. No other effect. Female 49 It put a hardship on me by not allowing me to buy the things I needed like clothing and house notes. Stress and worry if you don’t make a payment they will send you to a collection agency real fast. I asked my brother for the money to pay taxes for my home. Female 45 It took all of my extra money to pay for my medical bills. My husband left me because of all the medical bills we had. Nothing else. Female 20 Really like I said I ain’t got no job and when I get a job I can’t hold on to a job and my mom she’ll help me out a little bit cause she have to pay rent and light bills. The money she gets she has to use for my brother and sister. Male 46 I was hurt from an accident in [personal identifier omitted]. I was off for 3 years and my bills piled up then because I was unable to work, it probably cost me my marriage. No money and being laid up for three years. I never went back to my job, I had to be trained for another job. I have my own business now and I have problems paying for health insurance. Now, health insurance right now is a luxury these days. I need to get my daughter covered now. Male 26 Financial debt for a long time, mentally don’t care too much for the country any more, physically ok [Family relationships?] just fights over money, makes you afraid–makes you afraid to go to the doctor. Female 63 I had to give up my home & move into an apartment. I was pretty upset about moving. Male 36 I have been attempting to get medical insurance and just before my insurance expired, my daughter was operated on and the bill was never sent in. I had some other bills too. After surgery the insurance company had discontinued my coverage, the hospital sent me all the bills, I could not get the insurance company to pay the bills until several months later after receiving bills even though the surgery took place when I was covered. There were follow up bills and check ups that I could not pay for because I was unemployed. I have had trouble getting both of my daughters covered because they have high allergies and need shots, but the insurance companies don’t want to cover them. My employer told me that I will probably get laid off again this summer and I know that I will have trouble again then getting insurance coverage. It was very frustrating and stressful. It also added stress to the family, various reactions caused the girls to break out but we could not do anything about it because we did not have insurance. Public assistance would not grant me any assistance because they claimed that I had too many assets. I had to hold some money in the bank because I was unemployed and I needed to hold some money for expenses.

Insurance Status: Uninsured People Problem Group: Both Problem Getting Needed Medical Care and Paying Bills Self-rating of Severity of Consequences: Very or Somewhat Serious Sex Age Response Female 51 I don’t go for any preventive or regular checkups because I can’t afford it. Arthritis will not let me work, very bad spells where it is impossible to go out and function. I live on a small widow’s pension a few dollars a month. Male 26 I am no longer active because I have to curtail my activities because of my asthma. My wife and baby have to live with my mother

Getting Behind the Numbers on Access to Care

Published: Oct 22, 1996

The Debate About The Uninsured: How serious are their problems?

Embargoed for release until: 9:30 AM, EDT, Tuesday, October 22, 1996

For further information contact: Matt James or Tina Hoff

First National Study Asking People To Describe Health Care Experiences In Own Words: 46 Percent of Uninsured Adults Experienced “Serious” Consequences As a Result of Problems Getting and/or Paying for Health Care

Study Published in This Week’s JAMA

Washington, D.C. — Whenever health care is debated, one of the most hotly contested issues is the seriousness of the problem of the uninsured. A new study conducted by researchers at Harvard University, the Kaiser Family Foundation, and the National Opinion Research Center (NORC) at the University of Chicago finds that among adults who were uninsured at the time of the survey or over the course of the previous year a majority (53%) experienced some problem getting and/or paying for health care. This translates into approximately 20 million adults. The vast majority, or approximately 17 million adults nationwide, said they experienced “serious consequences,” in terms of their physical or mental health, family relationships, employment, and/or household finances, as a result of their problems getting and/or paying for health care. On the other hand, a significant percentage of uninsured adults — 47 percent — reported no problems either getting or paying for health care during the previous year.

Problems associated with getting and paying for health care were not limited to those without health insurance coverage. The survey found that among the insured adult population nearly one out of five (18 percent or 28 million adults) also faced such problems, with the majority, translating into 19 million adults, experiencing serious consequences.

Looking at the impact nationally, the survey suggests that overall nearly 50 million insured and uninsured adults had health care access or payment problems during the previous year, with 36 million experiencing serious consequences. The results of the survey are published in this week’s Journal of the American Medical Association (JAMA).

The survey of 3,993 randomly-sampled adults living in the United States was conducted between February and April 1995. It is the first national study to ask people to describe in their own words what, if any, problems they faced getting or paying for care and what consequences resulted. The survey finds that some 37 million adults were uninsured either at the time of the survey or at sometime during the previous year.

“This study demonstrates that there are real consequences of being without health insurance for tens of millions of Americans each year. The biggest challenge ahead is to figure out how to address this problem and how to pay for it,” said Drew E. Altman, Ph.D., President, Kaiser Family Foundation.

The Uninsured

The uninsured were four times more likely to report an episode of needing but not getting medical care, and three times more likely to report a problem paying health care bills than adults with insurance. The sickest people surveyed were those most likely to report problems: among the uninsured in the poorest health, three out of four (75%) adults reported problems getting care and 67 percent said they had problems paying for care.

“Most strikingly, the sickest people surveyed are most likely to have problems getting the medical care they need. The vast majority of uninsured adults in poor health had difficulty getting care. This finding directly contradicts the conventional wisdom that truly sick people can always get care when they need it,” said Karen Donelan, Sc.D., Harvard University, the study’s principal author.

53 Percent of Uninsured Adults Reported Problems Getting and/or Paying for Health Care During the Previous Year, With Approximately 17 Million of These Adults Nationwide Experiencing Serious Consequences.

  • 28 percent of uninsured adults experienced problems both getting and paying bills, with 90 percent of this group (10 million adults) rating the consequences of these problems as “serious” in terms of their physical and mental health, family relationships, employment, and household finances;
  • Another 17 percent of uninsured adults experienced problems getting care only, with 79 percent of this group (5 million adults) rating the consequences of their access problem as “serious.” Randomly-selected responses about medical conditions regarded as “serious” included “rapid heart rate,” “hypertension,” “coughing, tight breathing,” and “angina;”
  • 8 percent of uninsured adults experienced problems paying bills only, with 67 percent (2 million adults) rating the consequence of their payment problem as “serious;” and
  • 47 percent of the uninsured reported no problems either getting or paying for health care.

Among the uninsured who faced problems paying health care bills (36% of all uninsured adults), 49 percent said they paid more than $1,000 out-of-pocket, and 8 percent, more than $5,000. Two-thirds (63%) still owed money for these bills at the time they were surveyed, with seven out of ten owing more than $1,000; 22 percent, $1,000-$5,000; and 2 percent, $20,000 or more. More than four out of ten (44%) of the uninsured who reported payment problems had been contacted by a collection agency. Only a third (37%) received medical care for free or for a reduced charge in the previous year.

“From a human interest perspective, it’s worth noting that among uninsured adults who have problems paying medical bills, more report they were referred to a collection agency than say they got medical care for free or a reduced charge,” said Robert J. Blendon, Sc.D., Harvard University, a member of the study team.

The survey also found that very few Americans are uninsured by choice: fewer than one out of ten adults said they did not want or need health insurance or just did not think about getting it. The cost of health care coverage was the principal reason they said they did not have insurance.

The Under-Insured

Among the Much Larger Population with Insurance, 18 percent of Adults Reported Problems Getting and/or Paying for Health Care During the Previous Year.

  • 4 percent of insured adults reported problems both with getting health care and paying bills, with 86 percent (5 million adults) rating these problems as serious;
  • Another 7 percent of insured adults reported problems getting health care only, with 62 percent (6 million adults) rating these problems as serious;
  • 7 percent of insured adults reported problems paying bills only, with 75 percent (8 million adults) rating these problems as serious; and
  • 81 percent of insured adults reported no problems either getting or paying for health care.

Randomly-Selected Verbatim Accounts About the Consequences of Problems Getting and/or Paying for Health Care

Respondents Who Said Their Consequences Were “Very Serious” or “Somewhat Serious”

The Uninsured

Problems getting care (female, age 38): “Related to the MS [multiple sclerosis] that I have. I need a specific medicine that lessens the exacerbations of the disease and I can’t afford to get it. Its very frustrating and makes me angry because I’m progressing in my disease without the medicine that could possibly slow it up.”

Problems paying medical bills (female, age 31): “My two daughters have a problem with eyesight and I don’t have the money to go to the eye doctor, and my children have a toothache and I don’t have the money to take them to the dentist. If I pay the doctor, I don’t have the money to pay the rent and I won’t have a roof and its important to get food.”

Both problems (female, age 45): “I needed surgery for cataracts but my doctor couldn’t do the surgery because I didn’t have insurance. The doctor said I had cancer… they gave me a hysterectomy because I had cancer. [Program name] paid almost all of the bill and I paid off the rest in payments. I was unemployed for 6 months. It was hard to meet all the payments of the other bills.”

The Insured

Problems getting care (male, age 36): “Family history of colon cancer, was advised to get a screening every 2 years. It affects my finances because we have not met the deductible. We have a $2,500 deductible. I guess that the only gripe I have is that I pay too much for insurance and they’re raising it again by $100 a month.”

Problems paying medical bills (female, age 67): “I have to pay out of a Social Security check of $362 a month for [insurance company’s name]. They want $500 per month. Something wrong. Medicare doesn’t pay the full cost of hospital or medicine. I don’t take prescriptions then–it costs $100. Other people get food stamps, whatever they want. I was born here, worked here, get nothing.”

Both problems (female, age 46): “One medical problem I do have is depression. [I’m supposed to go to] the doctor every 3 months. Can’t afford it. You get very stressful. It makes the problem worse and you just don’t go… It would be nice to go to the doctor to get antibiotics and not have to worry about bills.”


Methodology

The survey was designed by the Harvard School of Public Health, the Kaiser Family Foundation, and the National Opinion Research Center (NORC). The nationwide survey was conducted by telephone during the period of February 22-April 27, 1995. 3,993 adults were interviewed. 1,234 adults (31% of respondents) had at least one of three key events during the previous year: an episode of being uninsured, a problem getting medical care they thought they needed, or a problem paying medical bills. After answering detailed questions about these events, respondents were asked to tell in their own words about the consequences of those events on physical or mental health, family relationships, employment, or household finances and to rate how severe these consequences were for them. The margin of sampling error for a sample of 3,993 adults is approximately plus or minus 1%, and increases for smaller subgroups of the sample (e.g. a maximum of plus or minus 3% for 1,234 adults, plus or minus 4% for 600 adults, and plus or minus 10% for 100 adults).

The Kaiser Family Foundation, based in Menlo Park, California, is a non