Choices Under the New State Child Health Insurance Program: What Factors Shape Cost and Coverage? – Policy Brief

Published: Dec 30, 1997

Choices Under The New State Child Health Insurance Program: What Factors Shape Cost And Coverage?

January 1998

The State Children’s Health Insurance Program (CHIP), enacted as part of the Balanced Budget Act of 1997, provides over $20 billion in federal funds over five years to cover low-income uninsured children. This program gives states considerable flexibility in designing expanded health insurance coverage for children. The way states design their programs — use of Medicaid or a separate program, scope of benefits, how much families are charged in premiums — will make a considerable difference both to how many children the expansions actually cover and to the costs states incur. States’ design choices will, in turn, be influenced by how they expect various factors to affect both the number (and insurance status) of children that participate and the public costs for each participating child–the two components of an expansion’s total public costs. The purpose of this paper is to lay out these factors — first, those that affect participation; then, those that affect cost per participating child. The goal is to assist state decision-makers in evaluating their options and to enable the broader community to participate in the decision-making process.

How Many Children Will Participate?

Analysis of experience with private and public health insurance programs suggests that a number of design features will influence both how many and what kind (uninsured vs. previously insured, higher income vs. lower income) of children are likely to participate in a new public insurance program.

The income level a state chooses as the basis for eligibility defines the total number (or overall pool) of uninsured children in any state who may participate in the program. But not all children in this pool will choose to participate; some will not sign up and will remain uncovered. Similarly, and simultaneously, eligibility levels will define a pool of currently insured children with incomes below that level who may participate in newly available coverage. Here too, some, but not all, of these currently insured children will substitute the newly available coverage for their existing coverage — that is, the new public program will, to some extent, “crowd out” or substitute for private coverage. In addition, public attention and outreach related to a new program may encourage some children eligible for, but not participating in Medicaid to sign up for coverage.

How much families will have to pay, how easy it will be for them to enroll, and how valuable they perceive the benefits are all factors that will influence how many children actually enroll.

Premium Costs

The extent to which families take advantage of newly available subsidies for insurance will depend in large part on whether and how much they are expected to pay. Under CHIP, whether or not a state can charge depends on whether it relies on Medicaid to expand coverage or creates a new insurance program. If a state chooses a Medicaid approach, it cannot in most cases charge cost-sharing and premiums for children (consistent with current Medicaid law). If the state instead creates a new program, it may charge premiums subject to specific rules. For children with family incomes at or below 150% of poverty they may charge about $15.00 to $19.00 per month per family. They may charge higher premiums for people with incomes above 150% of poverty: up to a maximum of 5% of income for premiums and cost sharing combined. For example, if premiums were the only charge, the family cost would be just over $100 per month for a family of three with income of twice the poverty level, or $26,000.

Analysis of participation in Medicaid and private health insurance programs suggests that the cost of coverage to a family is an important determinant of whether or not they will enroll for coverage. Although higher premiums reduce participation across the income spectrum, the impact is likely to be greatest for families with the lowest incomes, where higher prices absorb a larger share of family income. When coverage is free, participation is similar regardless of income. Once there is a cost attached to coverage, participation drops off substantially, regardless of the uninsured families’ income level.

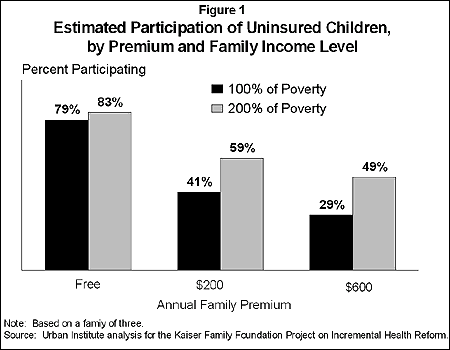
As shown in Figure 1, estimates are that if coverage is free and easy to obtain, an estimated 79% to 83% of uninsured children with incomes from poverty ($13,000 for a family of three) to twice the poverty level ($26,000) would participate. Even with what appears to be a relatively modest premium — about $17 per month or $200 per year (as allowed for children with incomes at or below 150% percent of poverty) — participation drops by an estimated 24 to 38 percentage points, depending upon the income group. Only 41% of the uninsured at poverty and 59% of those with incomes at twice the poverty level are expected to enroll, if the premiums for coverage is $200. At $600, participation for poor children is only expected to be 29%. Not surprisingly, higher premiums — over $50 per month or $600 per year (as allowed under a new program for children with incomes above 150% of the poverty level) — mean even lower rates of participation.

2104-fig1.gif

An additional analysis by the Urban Institute of state health insurance programs in Minnesota, Hawaii and Washington similarly found that higher premiums (measured as a share of income) significantly reduced the likelihood of participation. The higher the share of income required to pay the premium, the lower the participation for people eligible for coverage. While just over half (57%) of the eligible uninsured participated with premiums at 1% of income, only 18% participated with premiums requiring 5% of income.

CHIP allows (but does not require) states to impose premiums if they create a new insurance program. A premium will reduce participation, and the reduction will be greatest for the lowest income uninsured. The higher the premium, the greater these impacts will be.

Ease of/Barriers to Participation.

Even if a new program is free, the likelihood that families will participate will depend on how easy or hard it is to enroll in the program. The Urban Institute estimates that 83 percent of all people eligible for Medicaid participate in the program, with a substantially higher rate of participation for people receiving cash assistance. For children eligible only for Medicaid, participation rates have been significantly lower. Non-participation is generally attributed to the complexity or intrusiveness of the eligibility process — having to enroll in person at a welfare office (particularly when not eligible for cash assistance) and having to provide detailed documentation of income and resources.

Analysts think that families will be more likely to enroll in a new insurance program than in Medicaid, in part because of Medicaid’s historical tie to welfare and the complex eligibility determination process in most states. That outcome is more likely if the enrollment process for the separate program is simple (e.g., relying on mail rather than in-person application) and relatively uncomplicated (e.g., relying on modest rather than extensive documentation of resources). However, as many states have already demonstrated, the Medicaid eligibility process can be simplified, potentially overcoming historical reluctance to participate. Regardless of approach, a key factor in estimating participation is how simple or burdensome the enrollment process actually is.

Value of the Coverage.

Families’ willingness to participate in a new insurance program will depend in part on their perceptions of the value of the insurance being offered. Simply lowering the price of a policy is unlikely to enhance participation if the lower price is associated with lower value. “Value” may be understood as a function of the scope of benefits, level of cost-sharing, and the quality of participating providers.

Medicaid has a broad scope of benefits and limited cost-sharing, features which enhance its perceived value. However, to the extent that Medicaid pays providers and plans low rates and does not provide “mainstream” care, its value is likely to be discounted.

A new insurance program contracting with “mainstream” plans may be perceived as attractive relative to Medicaid, thereby promoting participation. However, this enticement to participation may be offset if the plan’s benefits are limited or, alternatively, its cost-sharing high. Similarly, Medicaid may look more attractive if it relies on “mainstream” plans that offer comprehensive benefits.

Crowd-out of Private Coverage.

Families with insurance, as well as families without insurance, will fall within the income eligibility levels that states establish. Among families with incomes below the poverty level, fewer than 20% have employer-sponsored insurance and only about three percent purchase non-group insurance.

By contrast, in families with incomes between 133% and 185% of the poverty level, just over half have employer-sponsored insurance and about five percent have non-group coverage. For these insured families, as for uninsured families, interest in participation will depend upon cost, barriers, and perceived value. However, currently insured families will make judgments about these factors on a relative basis — comparing what they are paying for and getting from their current insurance plans to what they can get under the new programs.

If the new coverage looks relatively attractive or is easy to get, currently insured families become more likely to substitute the newly available coverage for the coverage they have. For example, low-income families paying a substantial share of premiums in an employer-sponsored plan may find themselves able to obtain coverage at substantially lower out-of-pocket cost in the new program. This financial advantage, however, could be offset if participation in a new program entails a burdensome or intrusive eligibility process or requires a switch to plans perceived as offering lower quality care. Alternatively, if these families find that the new subsidies are easy to get and can be applied toward their employers’ plans, a substantial proportion of the currently insured population is likely to enroll in the new program. This would result in a shift in coverage and costs from private insurance to the new public program, with no increase in the number of children insured.

It is not entirely clear whether “crowd-out” is a good or bad thing. On the one hand, it is important to recognize that currently insured low income families who choose to take advantage of new coverage opportunities do so because it gives them financial relief or better coverage. This relief seems at least as legitimate as the relief recent legislation has provided self-employed families through tax preferences (with no evidence of expanded coverage). Further, denying one group of low income families a benefit awarded to others of similar income seems unfair, especially if the insurance coverage they have entails substantial financial sacrifice.

On the other hand, if dollars are limited, the more that subsidies are used by people who already have coverage, the less they are available to people who lack coverage, impeding achievement of CHIP’s major goal of expanding coverage of children. Even more important, if choices are made that make participation particularly attractive and easy for the already covered population (for example, by allowing the use of subsidies for employer-provided coverage), participation may be skewed in favor of this population and away from the uninsured. Particularly if premiums are charged, the already insured may participate at much higher rates than the uninsured, reducing the likelihood that CHIP will expand coverage for children.

The Urban Institute has estimated that almost two-thirds of the children participating in CHIP will be newly insured, with the other third replacing their previous coverage with coverage under the new legislation. These estimates assumed that subsidies could not be applied to employer-based coverage (which may be possible with a waiver under CHIP). Estimates allowing the use of subsidies toward employer coverage (as in the House-passed version of children’s coverage) dramatically reduced the proportion of covered children who were newly insured.

States may make rules that will affect whether people with insurance will be able to participate (e.g., a requirement that a child be uninsured for a period of time before being eligible for CHIP). Rules will also determine whether the new subsidies can be used for employer plans. Both decisions — along with decisions about premiums, ease of enrollment, and value of coverage — will affect the degree to which “crowd-out” occurs.

Outreach.

The extent of effort at making people aware of the new program will also affect participation. Analysts generally believe that efforts to publicize the program and promote enrollment (particularly by reducing barriers through policies like presumptive eligibility) can enhance participation. Further, they believe that participation will be enhanced not only for newly eligible families, but also for families who are already eligible for Medicaid but not participating. An estimated two to three million uninsured children are believed to fall into this category.

States expanding children’s coverage under CHIP may, therefore, see increases in Medicaid participation for the poorest children at the same time they are pursuing expansions for children who are less poor. How much Medicaid participation rises will undoubtedly be a function of how aggressively and to whom the new program is marketed.

Capped Program Versus an Entitlement.

While the factors described above will affect the number of children who want to participate in a program of expanded health coverage, the amount of federal and state resources available will determine the number of children who can participate. States choosing to expand coverage through a new program may place a cap on the number of participants in the program, while those using Medicaid must provide coverage to any child who is determined to be eligible (i.e., an individual entitlement).

For a state, developing a capped program provides greater predictability in expenses over time. However, it also means that if needs are greater than expected (e.g., the number of uninsured children rises), the resources may not be there to deal with those needs. Under Medicaid or a stand-alone program, the federal government will match state payments under CHIP at a higher rate than they do today under Medicaid, up to a fixed allotment per state. However, under a Medicaid expansion, the federal government would continue to match state expenses — at the normal Medicaid matching rate — even after a state’s allotment of federal CHIP funds were exhausted.

If a program is capped, it may also be important to pay extra attention to issues of crowd out and outreach, in order to assure that limited dollars and coverage are targeted to those with the greatest needs (e.g., children who are uninsured and lowest income).

Estimating Participation.

Predicting how many children, newly insured and previously insured, will actually participate as states expand coverage requires judgments or assumptions about how much impact these various factors will have and how they will interact. For families without insurance, estimators start with a schedule of participation rates (based on observed experience) showing the probability of participation for families without insurance, given premiums as a share of income. These rates are then adjusted to reflect program barriers to participation (for example, enrollment at a welfare office is assumed likely to reduce participation) and the value of coverage (for example, Medicaid-only providers or high deductibles will likely reduce participation). For families with insurance, estimates of who will participate are based on the degree to which families’ enrollment in the new program would lower their out-of-pocket premium costs. If families can get these benefits and stay in their current plans, e.g., by getting a voucher, most are assumed likely to participate. If not, only a modest share is assumed likely to shift to subsidized plans.

What Are The Public Costs Per Covered Child?

As with participation, the question of costs per covered child will be answered differently depending on the choices states make. First and foremost, each state faces the choice of relying on its pre-existing Medicaid program or creating a new program to provide coverage. Imbedded in this choice are decisions about benefits, payments to providers or plans, and administrative investments and expenses. Although, in theory, a state could build its coverage expansion on Medicaid and label it a new program, in practice a new program is likely to reflect a desire to do things differently. Hence, the choices and the cost experience are likely to be different.

Actuarial analysis illustrates both the way various factors will affect costs per covered child in a Medicaid approach as compared to a new program, and how such costs should be estimated.

Benefits.

Under a Medicaid expansion approach for covering uninsured children, federal rules specify that the benefits must be the same as those provided to other Medicaid beneficiaries. Under a separate state program, the federal rules specify that the benefits must be at least as generous as one of three “benchmark” private insurance packages described in the law: the standard Blue Cross/Blue Shield package provided to federal employees, a plan offered to state employees, or the most common benefits package offered by an HMO in the state.

Although there may be variation across states, in general it is likely that the benefits provided through Medicaid are more comprehensive than those in the “benchmark” private packages. For example, Medicaid programs are required to provide Early and Periodic Screening, Diagnosis and Treatment (EPSDT) services, some of which are uncommon in private insurance packages. EPSDT provides a wide range of screening and preventive services, as well as other care identified by a screening exam as necessary.

In choosing Medicaid rather than a new program, then, states are opting for a more expansive and expensive benefit package (all else being equal).

Payment Rates for Providers and Health Plans.

Although somewhat constrained by federal requirements, states have historically established Medicaid fee-for-service and capitation rates on a “take it or leave it basis.” State Medicaid programs have generally been able to attract providers and plans at below-market rates because they are such large purchasers (though in some cases beneficiaries may not have access to a full range of mainstream providers because they are unwilling to participate). Flexibility in setting rates has been enhanced by the Balanced Budget Act, so states will likely be able to continue to pay below-market rates to providers.

In theory, a state could employ a similar approach to a new insurance program for children — using the same plans Medicaid uses and dictating rates. However, if states choose a new program, implicit in that choice may be a decision to use an alternative approach. And, since a stand-alone program will cover fewer people than Medicaid, the state’s purchasing leverage will be more constrained. Under the private insurance approach adopted by California, for example, health plans are free to submit premium bids. This approach would presumably lead to premium levels more similar to those found in the private insurance market, and therefore higher per capita costs than under an expanded Medicaid program.

Administrative Costs.

Regardless of whether a state chooses to rely on Medicaid or develop a new program, administrative costs are likely to be a significant portion of overall program costs. That is because medical service costs for children are significantly lower than the costs for an adult population, while administrative costs per enrollee are similar. For example, if the administrative costs for an adult insurance policy were 15% of the overall premium and the cost of health services for a child were one-third of the cost for an adult, then administrative costs for a child-only insurance policy could be as high as 35% of the overall premium.

Administrative costs will vary with a state’s approach. Because Medicaid has an existing administrative infrastructure in each state, there should be minimal start-up expense for expanding coverage under that program. In addition, extra administrative costs should be on a “marginal” rather than “average” cost basis. In other words, while certain costs associated with processing more applications and claims may go up (e.g., more eligibility workers may be needed), many fixed costs should remain the same. In an analysis of the cost of covering uninsured children in California commissioned by the Kaiser Family Foundation, the Actuarial Research Corporation estimated that the Medicaid administrative cost for each newly covered child would be 60% of the current per child administrative cost (plus a small additional amount for new functions to be performed by the state).

The administrative costs of a new state program will likely be higher than under Medicaid. Significantly, the costs would be on an “average” rather than “marginal” cost basis, since there is no existing infrastructure on which to build. The administrative costs associated with non-group insurance (i.e., where insurance is sold directly to individuals or families rather than through employers) are generally in the range of 15 to 20% of benefits for adults and families (and could be two to three times higher than this for children-only insurance policies). While much of these expenses are for marketing — which could be reduced if a state used a purchasing pool structure that eliminated direct marketing, as under a recently-enacted program in California — it is also quite expensive to collect monthly premium payments from individual families (if they are required).

Adverse Selection.

Under either a Medicaid or a private insurance approach, costs per capita will be higher if families whose children are sick and more likely to need coverage, comprise a relatively large proportion of participants. This is often referred to as “adverse selection.” If all eligible children enroll in the program, then there will be, by definition, no adverse selection. Therefore, the extent of adverse selection will depend on how attractive the new program is and how easy it is to enroll.

No matter how unattractive a program is, the sickest children will likely enroll because coverage of any kind is very important to them. But, if enrollment in the program is difficult, the sicker children may not be joined by a large number of relatively healthy and less expensive children. This low participation rate of healthier children will lead to higher costs per covered child.

Estimating the Costs Per Capita.

It is reasonable to estimate the per capita cost of alternative approaches to covering uninsured children based on the current costs of Medicaid and private insurance, respectively. However, because the cost of covering currently uninsured children may differ from the costs found in existing programs, certain adjustments may be required.

Medicaid currently covers a broad range of children, many of whom have health needs that are very different from those children who are currently uninsured. For example, some children become eligible for Medicaid because they are sick and have incurred high medical expenses. The per capita costs of these children are not likely to be reflective of the costs of the currently uninsured, who are believed to be of roughly “average” health.

Instead, the population of children receiving Medicaid and welfare cash assistance together are likely to be the group most similar to children eligible for an expanded program, since they are not necessarily receiving assistance because they are sick. Similarly, it may be appropriate to exclude the cost of expensive conditions found in infants (e.g., for neonatal intensive care), since most low-income infants with expensive health conditions are probably already being covered through Medicaid.

By contrast, when using the cost of existing private insurance programs to estimate the per capita cost under a new program for children, an upward (rather than downward) adjustment may be necessary. For example, some health plans now offer child-only insurance policies on a non-group basis, but in most states that coverage is subject to “underwriting,” meaning that plans may charge higher premiums to children who are sick or exclude them from coverage altogether. Since federal rules do not permit such underwriting under CHIP, these current private sector premiums would have to be adjusted upward to reflect the cost under a new state program.

In an analysis prepared for the Kaiser Family Foundation, the Actuarial Research Corporation estimated how the cost per child under a Medicaid expansion would compare with a stand-alone private insurance program for uninsured children in California (Figure 2).

2104-fig2.gif

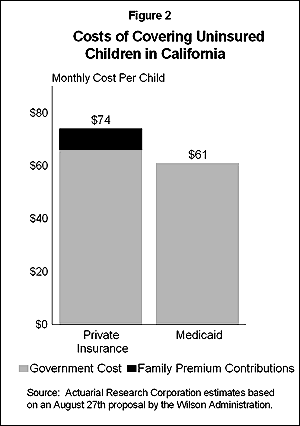
The analysis found that creating a new private insurance program to cover all of the estimated 580,000 low-income uninsured children in California — assuming no adverse selection — would cost $74.39 per month (including an average per family premium contribution of $8.00). Covering uninsured children through Medicaid would cost 18% less than the private insurance approach ($60.65 per child).

Conclusion

The cost of a new health coverage program for children will depend on a variety of factors, influencing both how many children participate and the cost of coverage per child. Thoughtful assessments of costs require a clear articulation of what these factors are, a review of the evidence on their likely effects, and, in light of this evidence, judgments about their impact. Even careful estimates, well-grounded in evidence, cannot give us certainty about results. But they allow us to compare and evaluate how the effects of different policy choices will vary. The better all parties understand the dynamics of cost estimates, the greater the likelihood that decisions will be based on informed analysis rather than predispositions.


Methodology

This policy brief was prepared for for the Kaiser Commission on the Future of Medicaid by Judith Feder from Georgetown University and Larry Levitt from the Kaiser Family Foundation. The information in this policy brief draws heavily from analysis by researchers at Georgetown University and The Urban Institute for the Kaiser Family Foundation’s Incremental Health Reform Project. It also draws from the Actuarial Research Corporation’s estimates of costs of covering uninsured children in California, commissioned by the Foundation. For additional information on the State Children’s Health Insurance Program or other Kaiser Family Foundation publications, please call the publications request line at (800) 656-4KFF.

Return to top

Choices Under The New State Child Health Insurance Program:What Factors Shape Cost And Coverage?Policy Brief

Encuesta Nacional de Kaiser Family Foundation sobre los Latinos y el VIH/SIDA

Published: Dec 30, 1997

En encuestas anteriores, la atencion se ha concentrando en captar las impresiones de la poblacion general, incluyendo sus opiniones sobre la epidemia; su preocupacion personal en cuanto a infectarse con el VIH; sus conocimientos sobre la transmision, curso y tratamiento del VIH y el SIDA; sus experiencias con la prueba de anticuerpos; su punto de vista sobre los esfuerzos nacionales y locales para detener la epidemia; y sus fuentes de informacion sobre el VIH/SIDA. En este informe, presentamos en primer lugar los hallazgos de la muestra general de encuestas a latinos, para despues considerar en detalle a varios subgrupos de latinos.La Encuesta de Kaiser Family Foundation sobre Latinos y el VIH/SIDA esta concebida para informar y estimular un mayor dialogo acerca del VIH/SIDA en las comunidades latinas para proporcionar una mejor comprension de las perspectivas que los latinos tienen en cuanto al VIH/SIDA y a todos aquellos que trabajan para reducir los costes sociales, economicos e individuales de la epidemia del SIDA.

  • Report: Encuesta Nacional sobre los Latinos y el VIH/SIDA

Emerging Issues in Reproductive Health: A Briefing Series for Journalists

Published: Dec 30, 1997

Teen Sex, Contraception and Pregnancy

  • Fact Sheet: Teen Sex, Contraception and Pregnancy

Covering Mental Health: A Resource Guide for Reporters and Editors

Published: Dec 30, 1997
  • Resource List: Covering Mental Health: A Resource Guide for Reporters and Editors

Medicare Beneficiaries & HMO’s:  A Case Study of the Los Angeles Market

Published: Dec 30, 1997

Medicare Beneficiaries & HMO’s: A Case Study of the Los Angeles Market

Note: This publication is no longer in circulation. However, a few copies may still exist in the Foundation’s internal library that could be xeroxed. Please email order@kff.org if you would like to pursue this option.

The Medicare Program: Servicios De Salud Administrados Por Medicare

Published: Dec 30, 1997

Panorama General: Medicare proporciona servicios de salud a casi 39 millones de norteamericanos, incluyendo aproximadamente a 34 millones de ancianos y a 5 millones de discapacitados. La gran mayoria de estas personas cubren sus gastos medicos directamente mediante el programa tradicional de “pago por servicio,” mientras que el 15 porciento restante (mas de 5 millone de beneficiarios) estan cubiertos bajo algun plan de servicio medico contratado con Medicare, principalmente las organizaciones de administracion de la salud (HMO por sus siglas en ingles).

  • Fact Sheet: Servicios De Salud Administrados Por Medicare

Child Health Facts:  National and State Profiles of Coverage

Published: Dec 30, 1997

Child Health Facts: National and State Profiles of Coverage

Appendix 2

Medicaid Enhanced Matching Rate Matching Rate Alabama 69.3% 78.5% Alaska 59.8% 71.9% Arizona 65.3% 75.7% Arkansas 72.8% 81.0% California 51.2% 65.9% Colorado 52.0% 66.4% Connecticut 50.0% 65.0% Delaware 50.0% 65.0% District of Columbia 70.0% 79.0% Florida 55.7% 69.0% Georgia 60.8% 72.6% Hawaii 50.0% 65.0% Idaho 69.6% 78.7% Illinois 50.0% 65.0% Indiana 61.4% 73.0% Iowa 63.8% 74.6% Kansas 59.7% 71.8% Kentucky 70.4% 79.3% Louisiana 70.0% 79.0% Maine 66.0% 76.2% Maryland 50.0% 65.0% Massachusetts 50.0% 65.0% Michigan 53.6% 67.5% Minnesota 52.1% 66.5% Mississippi 77.1% 84.0% Missouri 60.7% 72.5% Montana 70.6% 79.4% Nebraska 61.2% 72.8% Nevada 50.0% 65.0% New Hampshire 50.0% 65.0% New Jersey 50.0% 65.0% New Mexico 72.6% 80.8% New York 50.0% 65.0% North Carolina 63.1% 74.2% North Dakota 70.4% 79.3% Ohio 58.1% 70.7% Oklahoma 70.5% 79.4% Oregon 61.5% 73.0% Pennsylvania 53.4% 67.4% Rhode Island 53.2% 67.2% South Carolina 70.2% 79.2% South Dakota 67.8% 77.4% Tennessee 63.4% 74.4% Texas 62.3% 73.6% Utah 72.6% 80.8% Vermont 62.2% 73.5% Virginia 51.5% 66.0% Washington 52.2% 66.5% West Virginia 73.7% 81.6% Wisconsin 58.8% 71.2% Wyoming 63.0% 74.1%

Return to top

Child Health Facts: National and State Profiles of Coverage

Report Chart Pack

Table A2 Table One Table Two Table Three Table Four Table Five Table Six Table Seven Table Eight Table Nine Table Ten Table Eleven Table Twelve Table Thirteen Table Fourteen Table Fifteen Table Sixteen Table Seventeen Table Eighteen Table Nineteen Table TwentyTable A1 Table A3 Table A4

Child Health Facts: National and State Profiles of Coverage

Published: Dec 30, 1997

Child Health Facts: National and State Profiles of Coverage

Nearly 10 million children in the United States lack health insurance coverage and over two-thirds of them or low-income. This databook provides baseline data on how many children are uninsured today and on the extent of Medicaid coverage. It provides astarting point to monitor and assess state efforts to reach and insure more children.

Native Americans and Medicaid: Coverage and Financing Issues

Published: Dec 30, 1997

Native Americans and Medicaid:Coverage and Financing Issues

Prepared by Andy Schneider and JoAnn Martinez, The Center on Budget and Policy Priorities for The Kaiser Commission on the Future of Medicaid

December 1997

Table 1: Medicaid Eligibility Thresholds

Pregnant Women, Infants and Children (Effective October 1997) Other Eligibility Categories State Pregnant Women and Infants Children Under Age Six Children Ages Six and Older Upper Age Limit Asset Test Required Supplemental Security Income, 1996 Max. AFDC Payments (7/16/96) Medically Needy, 1996 (Percent of Federal Poverty Level) (Percent of Federal Poverty Level) Alabama 133 133 100 14 No 75 15 N/A Alaska 133 133 100 14 No 75 76 N/A Arizona 140 133 100 14 No 75 32 N/A Arkansas (a) (133) (200) 200 200 17 Yes 75 19 25 California 200 133 100 14 No 75 56 86 Colorado (b) 133 133 100 14 No 75 39 N/A Connecticut 185 185 185 16 No 75 81 71 Delaware 185 133 100 18 No 75 31 N/A District of Columbia N/A N/A N/A N/A No 75 N/A N/A Florida 185 133 100 14 No 75 28 28 Georgia 185 133 100 19 No 75 39 35 Hawaii (c,d) 300 300 300 19 No 67 57 57 Idaho 133 133 100 14 No 75 29 N/A Illinois (c) 133 133 100 14 No 48 35 45 Indiana (c,e) 150 133 100 18 No 73 27 N/A Iowa 185 133 100 14 Yes 75 39 52 Kansas 150 133 100 17 No 75 40 44 Kentucky 185 133 100 14 No 75 49 28 Louisiana 133 133 100 18 No 75 18 N/A Maine 185 133 125 19 No 75 51 42 Maryland (d) 185 185 185 14 No 75 34 40 Massachusetts 185 133 133 17 No 75 52 72 Michigan 185 150 150 16 No 75 45 52 Minnesota (c,d) 275 275 275 20 No 71 49 86 Mississippi 185 133 100 14 No 75 34 N/A Missouri (c) 185 133 100 18 No 71 27 N/A Montana 133 133 100 14 No 75 41 46 Nebraska 150 133 100 14 No 75 34 45 Nevada 133 133 100 14 Yes 75 32 N/A New Hampshire (c) 185 185 185 19 No 74 51 60 New Jersey 185 133 100 14 No 75 41 52 New Mexico 185 185 185 19 No 75 36 N/A New York (f) 185 133 100 14 No 75 61 76 North Carolina (c) 185 133 100 18 No 41 50 34 North Dakota (c) 13 133 100 18 Yes 62 40 47 Ohio (c) 133 133 100 14 No 63 32 N/A Oklahoma 150 133 100 14 Yes 75 28 42 Oregon 133 133 100 19 No 75 43 57 Pennsylvania 185 133 100 14 No 75 39 43 Rhode Island (d) 250 250 250 17 No 75 51 69 South Carolina 185 150 150 18 No 75 18 N/A South Dakota 133 133 100 19 No 75 47 N/A Tennessee (d) 400 400 400 17 No 75 54 23 Texas 185 133 100 14 No 75 17 25 Utah 133 133 100 18 No 75 53 53 Vermont (g) (200) (225) 225 225 17 No 75 59 81 Virginia 133 133 100 19 No 75 22 33 Washington (g) (185) (200) 200 200 19 No 75 50 62 West Virginia 150 133 100 19 No 75 24 27 Wisconsin 185 185 100 14 No 75 48 64 Wyoming 133 133 100 14 No 75 55 N/A

return to reference

Source: National Governors’ Association.Washington, DC. 1996 and 1997.

N/A Not applicable.

Note: The 1997 Federal poverty guideline for a family of three was $13,330; for Alaska $16,670 and Hawaii $15,330.

(a) In Arkansas pregnant women are covered up to 133 percent and infants are covered up to 200 percent of poverty.

(b) Colorado has dropped the asset test for pregnant women only.

(c) indicates state with a 209 (b) waiver, which permits it have different eligibility criteria for the Supplemental Security Income program.

(d) Hawaii, Maryland, Minnesota, Rhode Island, and Tennessee operate under 1115 waivers. Some populations receive fully

subsidized premiums while others are required to pay a portion of the premium and may have a different benefits package.

(e) Indiana is planning to reinstate the asset test for pregnant women.

(f) Payment standards in New York state vary across counties. The figures shown are for New York City.

(g) In Vermont pregnant women are covered up to 185 percent of poverty and infants are covered to 225 percent of poverty.

In Washington pregnant women are covered up to 185 percent of poverty and infants to 200 percent.

Table 2: Medicaid Managed Care Enrollment, by State (As of June 1996)

Total Medicaid Enrollment Medicaid Managed Care Managed Care Penetration Approved Medicaid Births, 1995 (b) State Enrollment Total Full-Risk PCCM (a) Full-Risk PCCM 1115 Waiver Number of Medicaid Births Percent of Total Births United States 32,176,785 11,721,807 7,711,275 4,010,532 24 12 19 states 1,213,943 39 Alabama 498,006 56,929 0 56,929 0 11 Yes 27,867 46 Alaska 87,550 0 0 0 0 3,282 32 Arizona 443,302 381,485 381,485 0 86 0 Yes 31,567 44 Arkansas 371,047 143,232 0 143,232 0 39 16,606 47 California 5,415,207 1,141,857 1,141,857 0 21 0 Yes 229,158 42 Colorado 259,949 136,462 71,419 65,043 27 25 17,277 32 Connecticut 311,884 186,837 186,837 0 60 0 10,931 25 Delaware 73,798 57,256 57,256 0 78 0 Yes 3,145 31 District of Columbia 125,000 69,200 37,650 31,550 30 25 n/a n/a Florida 1,538,007 980,371 390,286 590,085 25 38 Yes 79,969 45 Georgia 968,008 309,503 3,363 306,140 0 32 58,680 52 Hawaii 163,000 131,000 131,000 0 80 0 Yes n/a n/a Idaho 84,618 31,049 0 31,049 0 37 6,608 37 Illinois 1,399,372 179,863 179,863 0 13 0 Yes 65,000 35 Indiana 432,558 135,510 51,171 84,339 12 19 32,686 39 Iowa 226,701 93,791 27,293 66,498 12 29 11,892 32 Kansas 192,188 60,863 8,539 52,324 4 27 n/a n/a Kentucky 531,728 282,813 0 282,813 0 53 Yes n/a n/a Louisiana 801,930 44,772 0 44,772 0 6 34,863 53 Maine 157,881 1,316 0 1,316 0 1 n/a n/a Maryland 466,114 274,276 96,666 177,610 21 38 Yes 23,000 32 Massachusetts 654,000 378,183 87,288 290,895 13 44 Yes 17,335 21 Michigan 1,148,115 790,388 288,889 501,499 25 44 43,986 33 Minnesota 477,000 158,449 158,449 0 33 0 Yes 20,645 33 Mississippi 510,226 35,137 0 35,137 0 7 25,184 61 Missouri 637,897 214,896 207,701 7,195 33 1 29,318 42 Montana 79,000 46,891 635 46,256 1 59 4,266 38 Nebraska 144,305 39,651 22,129 17,522 15 12 6,819 29 Nevada 64,712 0 0 0 0 0 6,890 27 New Hampshire 72,158 11,828 11,828 0 16 0 2,099 21 New Jersey 706,812 302,618 302,618 0 43 0 n/a n/a New Mexico 331,808 147,767 0 147,767 0 45 14,276 53 New York 2,750,000 629,093 625,365 3,728 23 0 Yes 103,516 38 North Carolina 818,364 264,272 3,724 260,548 0 32 44,756 44 North Dakota 46,566 25,442 0 25,442 0 55 1,913 23 Ohio 741,910 239,306 239,306 0 32 0 Yes 56,940 40 Oklahoma 333,613 64,631 64,631 0 19 0 Yes 19,103 42 Oregon 383,334 290,479 290,479 0 76 0 Yes 14,865 35 Pennsylvania 1,612,905 852,265 516,299 335,966 32 21 n/a n/a Rhode Island 113,891 71,367 71,367 0 63 0 Yes 4,170 33 South Carolina 390,561 0 0 0 0 0 Yes 21,859 47 South Dakota 62,539 40,636 0 40,636 0 65 3,581 34 Tennessee 1,180,449 1,180,449 1,180,449 0 100 0 Yes 34,639 47 Texas 1,985,550 71,606 23,914 47,692 1 2 151,614 47 Utah 113,000 88,177 75,087 13,090 66 12 12,306 31 Vermont 82,650 0 0 0 0 0 Yes 2,615 39 Virginia 681,313 461,720 258,952 202,768 38 30 n/a n/a Washington 696,658 377,085 377,085 0 54 0 31,978 42 West Virginia 307,503 93,619 0 93,619 0 30 21,158 55 Wisconsin 463,142 147,218 140,395 6,823 30 1 24,025 36 Wyoming 38,956 249 0 249 0 1 2,737 44

return to reference

Sources: Urban Institute analysis of data from Health Care Financing Administration’s website.

Liska, D et al. “Medicaid Expenditures and Beneficiaries, 1990-1995.” Kaiser Commission on the Future of Medicaid. Washington, DC. 1997.

(a) PCCM refers to primary care case management plans.

Note: Includes managed care for a full-range of acute care services only. Does not include limited service plans such as mental health or dental only plans.

n/a Data not available.

Return to top

Native Americans and Medicaid: Coverage and Financing IssuesReport Part Four Report One Report Two Report Three

Native Americans and Medicaid: Coverage and Financing Issues – Report

Published: Dec 30, 1997

Native Americans and Medicaid:Coverage and Financing Issues

Prepared by Andy Schneider and JoAnn Martinez, The Center on Budget and Policy Priorities for The Kaiser Commission on the Future of Medicaid

December 1997

Table Of ContentsHighlights ii I: Background On Native American Health Care 1 II: Medicaid’s Role For Native Americans 4 1. Medicaid as a Source of Health Coverage 4 2. Medicaid as a Source of Revenue for Hospitals and Clinics 6 3. Medicaid and Managed Care 10 4. Medicaid as Medicare Premium Assistance 14 5. Medicaid as a Source of Long-Term Care Coverage 15 III: Policy Issues For Native Ameircans In Managed Care 16 1. Policy Issues 16 2. Conclusion 18 Endnotes 20 Tables 22 Highlights

There are an estimated 2.3 million Native Americans — American Indians and Alaska Natives — in the U.S. About half of the Native American population lives on or near reservations; the other half resides in other rural areas and in urban areas. The Native American population includes 554 tribes recognized by the federal government as well as other tribes, largely in California, that do not have federal recognition.

Medicaid plays several significant roles for Native Americans. The Medicaid program acts as:

  • An insurance program covering physician, hospital, and other basic health care services for eligible Native Americans, especially families with children;
  • A source of revenue for Indian Health Services (IHS) and tribally-operated clinics and hospitals;
  • A purchaser of managed care products;
  • A source of financial assistance for low-income elderly and disabled Native Americans to meet Medicare premium and cost-sharing obligations; and
  • A source of coverage for nursing home care and other long-term care services for frail elderly and disabled Native Americans.

All Native Americans that are members of federally recognized tribes are eligible to receive services from the IHS. Because of high rates of poverty among Native Americans, Medicaid is an important publicly funded health program for Native Americans. In 1996, it is estimated that Medicaid covered nearly 40 percent of the Native American population.

Medicaid as a Source of Revenue

Medicaid is an important source of revenue for Native American health facilities. In fiscal year 1997, IHS and tribally operated facilities were projected to receive $184.3 million in Medicaid reimbursements. This amount is equal to about 10 percent of the $1.8 billion appropriated for IHS and tribally-provided health services that year. Medicaid is an open-ended entitlement program. In contrast, the IHS receives funding through the domestic appropriations which are subject to broad caps over the next five years. As a result, Medicaid payments will become an increasingly important source of funding for many IHS, tribal, and urban programs.

The structure of the Medicaid program provides financial incentives for states to encourage beneficiaries to use tribal health facilities. Medicaid is a matching program under which the federal government contributes money to the states to pay for covered services on behalf of Medicaid beneficiaries. The federal government’s share of these costs ranges from 50 percent in wealthier states to nearly 80 percent in the poorest states. On average, the federal government pays 57 percent of a state’s Medicaid costs. In contrast, the cost of services provided to Medicaid beneficiaries by a hospital, clinic, or other facility of the IHS or by a tribe or tribal organization is matched by the federal government at a 100 percent rate in a Memorandum of Agreement (MOA) between IHS, the Health Care Financing Administration (HCFA), December 19th 1996. Thus, the state is fully reimbursed by the federal government and is not required to contribute any of its own funds toward the cost of care. This provision does not apply to urban Indian programs.

Medicaid and Managed Care

Over the past few years, Medicaid in many states has been shifting from a predominantly fee-for-service program to a program that purchases services from managed care organizations (MCOs) or primary care case management organizations (PCCMs). This shift presents critical policy issues for the IHS, tribal health programs, and urban Indian health programs. Provisions in the Balanced Budget Act of 1997 will accelerate these changes.

  • Mandatory Beneficiary Enrollment in Managed Care. Under the Balanced Budget Act, states have the authority to require most Medicaid beneficiaries to enroll in MCOs or PCCMs. States can only require Native Americans in Medicaid to receive services through an MCO or PCCM if the MCO or PCCM is the IHS, a tribally operated program, or an urban Indian health program. States do not have authority to require Medicaid-eligible Native Americans to enroll in MCOs that are not operated by the IHS, a tribe, or an urban Indian organization. States do have the authority to require such enrollment under “section 1115” demonstration waivers or under “section 1915(b)” program waivers. Native Americans, who are eligible for Medicaid, have the choice of enrolling in any participating, Medicaid MCO operating in their area.
  • Capitation Payments under Medicaid Managed Care. The December 1996 MOA does not expressly address payments to MCOs. Presumably, the 100 percent federal matching rate is payable to MCOs or PCCMs operated by the IHS or tribes. This interpretation would be consistent with the clear policy for fee-for-service arrangements.
  • Strategic Choices for Native American Health Facilities. Managed care dramatically affects the strategic choices available to Native American health facilities.
    • IHS facilities can establish their own MCO or PCCM and seek to contract with the state to enroll Indian and non-Indian Medicaid beneficiaries; subcontract with a private MCO or PCCM and provide services to the Indian and non-Indian enrollees of that MCO or PCCM; or continue to be reimbursed by Medicaid on a fee-for-service basis and remain unaffiliated with any Medicaid MCO or PCCM.
    • Tribally owned and operated services face similar choices with two important differences. If they are also a Federally Qualified Health Center (FQHC), then they have additional financial protections until 2003. Second, they may be able to assume financial risk, allowing them the option of becoming an MCO.
    • Because urban Indian facilities are historically underfunded and do not benefit from the 100 percent matching rate, they face considerably greater challenges in adapting to the managed care environment. Their most viable option is to attempt to subcontract with an MCO or PCCM although there are no guarantees that this approach will be successful.

Native Americans and Medicaid: Coverage And Financing Issues

Traditionally, Native Americans have relied upon the facilities and programs of the Indian Health Service (IHS) for access to health care. Although the IHS remains the primary source of health care delivery and financing for most Indian tribes, public programs such as Medicare and Medicaid are playing a larger and larger role in the financing of care for Native Americans living on or near reservations as well as those in urban areas. Because of the high incidence of poverty among American Indians and Alaska Natives, Medicaid – the federal-state health care program for low-income people – is of particular importance.

Medicaid plays several different roles of significance to Native Americans. Medicaid is an insurance program, offering coverage for physician, hospital, and other basic health care services to eligible Indians, especially families with children. It is a source of revenue for IHS and tribally-operated clinics and hospitals that deliver those basic services. Through its purchase of managed care products, Medicaid is reshaping the health care delivery system for many Native Americans and other underserved low-income populations. Medicaid also assists low-income elderly and disabled Indians who are eligible for Medicare in meeting their premium and cost-sharing obligations. Finally, Medicaid offers coverage for nursing home care and other long-term care services needed by frail elderly and disabled Native Americans.

This Policy Brief provides an overview of Medicaid from the standpoint of Native Americans with an emphasis on Medicaid as an insurance program and a purchaser of managed care. This Brief supplements other Policy Briefs and background materials on Medicaid issued by the Commission.1 It incorporates the changes to Medicaid made by the Balanced Budget Act of 1997.2 This Policy Brief focuses on those federal policies common to all state Medicaid programs and does not review the details of any particular state program. Because Medicaid is administered by states within broad federal guidelines, Medicaid programs vary significantly from state to state with respect to benefits, eligibility, provider payment, and administration. However, the information contained in this Policy Brief is the starting point for understanding the Medicaid program in any particular state.

I: Background On Native American Health Care

There are an estimated 2.3 million Native Americans – American Indians and Alaska Natives – in the U.S. About half of the Native American population lives on or near reservations; the other half resides in other rural areas and in urban areas. The Native American population includes 554 tribes recognized by the federal government as well as other tribes, largely in California, that for various reasons do not have federal recognition. The federally recognized tribes vary in size from less than 100 to more than 100,000 members. The economic status of these tribes varies substantially; some are wealthy, but many face conditions of high unemployment and high rates of poverty. Indians in urban areas, who are frequently not enrolled members of federally-recognized tribes, are often unemployed.

The driving force for many of the health status and health coverage problems facing Native Americans as a whole is poverty. Not all Indians are poor, but a very large proportion of them are. U.S. Census data indicate that in 1996, 30.9% of Native Americans as a whole had family incomes below the poverty line, in comparison with 13.8% for the U.S. population as a whole.

The health status of Native Americans is significantly lower than that of the rest of the U.S. population. 3 According to the Indian Health Service (IHS) of the Department of Health and Human Services, the age-adjusted mortality rate for American Indians and Alaska Natives residing in the areas served by the IHS was 594.1 (per 100,000 population) for calendar years 1991-1993, compared to a rate of 504.2 for the entire U.S. population in 1992. ,4 In some IHS areas, the rate is double that of the total U.S. population. For instance, in the South Dakota, North Dakota, Nebraska and Iowa area the rate for calendar years 1991-1993 was 1,045.9.

Although there are significant variations from area to area, Native Americans as a whole have higher rates of death and injury caused by accidents and violence (including suicide and homicide) than the U.S. population generally. For the same 1991-1993 period, the IHS service area population had an accident mortality rate of 83.4 (per 100,000 population), compared with a rate of 29.4 for the entire U.S. population in 1992. Many of these deaths are related to the high incidence of alcohol abuse in a number Indian communities. Native Americans have higher rates of mortality from alcoholism than the U.S. population generally. The alcoholism mortality rate for the IHS service area population was 38.4 (per 100,000 population) over the 1991-1993 period compared to a rate of 6.8 among the entire U.S. population in 1992. Finally, the incidence of diabetes among Native Americans is significantly higher than that among the U.S. population generally. The diabetes mellitus mortality rate for the IHS service area population was 31.7 (per 100,000 population) over the 1991-1993 period, in comparison with the rate of 11.9 among the entire U.S. population in 1992.

The agency responsible for providing or paying for the provision of health services to most American Indians and Alaska Natives is the Indian Health Service (IHS). The IHS estimates its 1996 patient population – i.e., those eligible for health care services provided through or paid by the IHS – at 1.4 million Native Americans, most of whom live on reservations. This represents about three-fifths of the 2.3 million Native Americans in the U.S. Eligibility for IHS care is determined under federal statute and regulation and depends largely (but not exclusively) upon membership in a federally-recognized tribe and residence on or near a reservation. Federal recognition of a tribe is generally predicated on treaty or federal statute or both.

The IHS delivers care directly to Indians who meet IHS eligibility criteria through 40 hospitals, 64 health centers, 5 school health centers, and 50 smaller health stations located in 17 states. The IHS also makes arrangements, through contracts or “compacts,” directly with Indian tribes to deliver care to their own members. Currently tribes operate 9 hospitals, 116 outpatient health centers, 5 school health centers, 56 smaller health stations, and 171 Alaska village clinics under these arrangements. Finally the IHS funds 34 urban Indian programs ranging from outreach and referral programs to outpatient health clinics. Specialized and/or expensive diagnostic and treatment services that the IHS (or tribes) cannot offer directly through their own facilities in a particular area may, subject to the availability of funds, be purchased from non-IHS (or non-tribal) providers on a fee-for-service basis through the “contract health services” (CHS) program. Urban Indian programs do not have access to CHS funds.

In 1997, 57.2 percent of the $1.8 billion appropriated to IHS for services was spent on IHS direct operations, 41.5 percent was spent on tribally-operated hospitals and clinics, and 1.4 percent was spent on urban Indian programs. Of the $1.1 billion appropriated to IHS for direct services, $235 million, or 22 percent, took the form of contract health services purchased from non-IHS providers. The comparable CHS figure for tribal providers was $133.4 million, or 18 percent of the total $750 million in fiscal year 1997 appropriations allocated to tribal providers.

II: Medicaid’s Role For Native Americans

Medicaid as a Source of Health Coverage

In part because of high rates of poverty and unemployment, Native Americans are less likely than other Americans to have employer-sponsored or other types of private health insurance coverage. In addition, Native Americans are less likely to be enrolled in public health insurance programs like Medicare and Medicaid. According to U.S. Census data for 1996, 18.1 percent of Native Americans had no health insurance while 47.7 percent had private insurance, 39 percent were enrolled in Medicaid, 10.1 percent were enrolled in Medicare, and 4.1 percent were covered through the Civilian Health and Medical Programs of the Uniformed Services (CHAMPUS).5 The IHS data base indicates that, as of August 12, 1997, of the 1,784,000 individuals registered as IHS patients, 466,000, or 26 percent, were eligible for Medicaid.6

Nationally, Medicaid is the second largest health insurance program after Medicare. The Congressional Budget Office estimates that in 1998 Medicaid will cover 44 million individuals, half of whom are children. Each of these individuals is entitled to have payment made on his or her behalf for covered services received from participating hospitals, physicians, and other providers. Medicaid benefit packages vary from state to state, but they all include physician services; laboratory and x-ray services; inpatient and outpatient hospital services; early and periodic screening, diagnostic, and treatment (EPSDT) services for children; and services provided by federally qualified health centers (FQHCs).

Individual Entitlement

Individuals who meet Medicaid eligibility standards are entitled to coverage. This applies to Native Americans as it does to other American citizens. Historically, some state and local officials viewed the health coverage of American Indians and Alaska Natives as exclusively a federal responsibility and sought to exclude Native Americans from Medicaid coverage.7 Although Medicaid is administered and financed in part by the states, Native Americans who meet the Medicaid eligibility requirements of the state in which they reside are, as a matter of law,8 entitled to Medicaid coverage.9 This is true whether a Native American lives on or near a reservation or in an urban area, and whether or not a Native American is eligible for IHS services.10

Eligibility Requirements

To qualify for Medicaid in any particular state, an individual must be a resident of that state. In addition, regardless of the state in which an individual resides, an individual must meet both categorical eligibility requirements and financial eligibility requirements. Categorical eligibility requirements relate to the age or characteristics of an individual: children, pregnant women, elderly, and disabled are among the categories of individuals that may qualify for Medicaid. Financial eligibility requirements relate to the amount of income or assets an individual is permitted to have (standards), and how those amounts are calculated (methodologies). Individuals who do not meet the categorical requirements – for example, non-elderly adults who are not disabled and do not have children – may not qualify for Medicaid no matter how poor they are. There are exceptions to this general rule. Some states cover poor single adults under “section 1115” demonstration waivers granted by the Secretary of Health and Human Services. 11

States have flexibility within broad federal guidelines to establish eligibility rules for their Medicaid programs, but there are certain groups of individuals that any state receiving federal Medicaid matching funds must cover. For example:

  • with respect to children, states must at a minimum cover all infants up to age one (and pregnant women) with family incomes at or below 133 percent of the poverty level ($17,729 per year for a family of three in 1997), all children under age six with family income at or below 133 percent of the federal poverty line, and all children under age 14 with family income below 100 percent of the federal poverty line ($13,330 per year for a family of three in 1997). Many states have elected to set higher Medicaid eligibility thresholds for children under regular Medicaid law or under demonstration waivers.
  • with respect to elderly and disabled individuals, states must at a minimum cover those individuals receiving benefits under the Supplemental Security Income (SSI) program. The exception to this rule is that states may use eligibility standards that were in effect in 1972 in determining eligibility for elderly or disabled individuals; 11 states have opted to do so.

Table 1 shows the Medicaid income eligibility thresholds in effect in each state as of October, 1997, for pregnant women, children, and aged and disabled individuals. These data, which were made available by the National Governors’ Association, describe the thresholds as a percentage of the federal poverty level.

Return to top

Native Americans and Medicaid: Coverage and Financing IssuesReport Part One Report Two Report Three Report Four