Poll Finding

Survey of Americans on Gender

Published: Feb 27, 1998

This Washington Post/Kaiser/Harvard University survey examines Americans’ opinions, perceptions and attitudes regarding gender and interactions between the sexes. A series of five related surveys were used to paint an up-to-date picture of gender issues in work place and on the home front, including sexual harassment, the division of household tasks, parenting roles, and the joys and challenges of marriage today. The surveys find that the rules of the game are changing, both at work and at home, but increased gender equality brings both gains and challenges for men and women today. The findings were presented by The Washington Post in a five part series, beginning Sunday, March 22, 1998.

Understanding Individual Health Insurance Markets

Published: Feb 27, 1998

: Structure, Practices, and Products in Ten States

New Study of Individual Health Insurance Market: Major Barriers Identified in Individual Health Insurance Market for People with Health Problems. Rates and Regulations Vary Across Ten States Studied

Denials, Waiting Periods, and High Premiums Pose Problems for Pre-Medicare Population

For Immediate Release Tuesday, March 17, 1998

Washington, DC – For many people who have health problems or who are approaching the age of retirement, coverage through the individual health insurance market may be priced out of reach or may be denied altogether, according to a new study prepared by the Alpha Center for the Kaiser Family Foundation. The study assesses policies sold in the individual market in ten states which range in size of population as well as scope of insurance regulation. According to the authors of the report:

  • Coverage in the individual market is often denied to people with health problems. Six of the ten states studied – California, Florida, Louisiana, Montana, North Dakota, and Pennsylvania – allow insurers to deny coverage to applicants with a history of such health problems as rheumatoid arthritis, chronic headaches, kidney stones, angina, heart disease, or stroke.
  • Premiums in the individual market vary significantly based on the age of the applicant. Premiums charged to a 60-year-old may be two to four times the premium charged to a 25-year-old. Nine out of the ten states – all except New York, the only state with community rating – allow insurers to base premiums on the applicant’s age. For example, in Washington state a healthy 25-year-old who buys insurance independently would pay $57 per month for one HMO policy, while a healthy 60-year-old would pay $205 for the same policy.
  • Insurers often increase premiums or add riders for people in the individual market with pre-existing health conditions or risk factors. These increases, called “rate-ups,” can range from 20 to 80 percent above the base rate depending on the applicant’s medical history. For example, someone who has a history of heart disease may face a premium increase or be denied coverage altogether. Seven out of the ten states – all but New York, North Dakota, and Washington state – allow insurers to set premiums based on the applicant’s health status.

“In most states, insurers who sell individual policies deny coverage to people with health problems or charge them high premiums,” said Deborah J. Chollet, Ph.D., lead author of the report.

New York’s community rating ensures that individuals are charged the same rate regardless of age or health status. For example, a 25-year-old New Yorker would pay about $210 per month for HMO coverage, the same rate as would be charged to a 60-year-old. In a state without community rating, premiums can vary significantly. In California, for example, a healthy 25-year-old would be charged about $89 per month for a policy through one of the Preferred Provider Organizations (PPOs) in the state, while a healthy 60-year-old woman would pay $250, close to three times as much. If she has high blood pressure her base premium would increase by 25 percent for her pre-existing condition. She might have to purchase additional coverage (known as a “rider”) to cover prescription drugs, which range from $8 to $27 per month; she could pay a total of about $340 per month.

This study comes at a time when the number of Americans without health insurance continues to grow and policymakers are considering raising the age of Medicare eligibility to 67, which could require more older Americans to turn to the individual insurance market for coverage. And, at the same time the President is proposing an early Medicare buy-in for the under 65 population to help address the insurance access problems faced by many pre-Medicare uninsured people.

“The study shows why the individual insurance market – as it looks today – is not the answer for most of America’s uninsured,” said Drew E. Altman, Ph.D., President of the Kaiser Family Foundation. “This is especially true for people who are low-income or already sick, for whom coverage can be priced out of reach, or denied outright.”

The Individual Insurance Market and the Uninsured.

People under 65 who do not have job-based coverage and are not eligible for Medicaid or Medicare often have no option but the individual insurance market for their health coverage. These health insurance policies are purchased directly by people, often through an insurance agent or broker. Some 16 million Americans received health insurance in 1996 through the individual insurance market; 41 million people remain uninsured, two-thirds of whom live in families with incomes of less than $30,000. Pre-Medicare age seniors – those under 65 – who do not have insurance face some of the greatest difficulties obtaining coverage since they are more likely than younger people to have health problems.

The Health Insurance Portablity and Accountability Act of 1996 – often known as the Kassebaum-Kennedy Law after its principal sponsors – made it easier for people with job-based health coverage to purchase insurance in the individual market after leaving their jobs. A recent study by the General Accounting Office found that insurance is still inaccessible for many individuals covered by the law because some insurers are charging very high premiums and discouraging agents from selling policies. A Congressional hearing is scheduled for Thursday, March 19 to look at implementation of HIPAA.

The study also found that people with HIV/AIDS, in particular, face unique insurance challenges when trying to obtain coverage through the individual insurance market. While five of the ten states studied – New York, North Dakota, Iowa, California, and Washington – require that HIV be treated the same as other illnesses, the remaining five allow insurers to limit coverage for this disease. Where permitted by law, health plans may impose lifetime caps on coverage ranging from $10,000 to $25,000 for people with HIV/AIDS. Some states also limit prescription drug benefits. For example, in California many insurers limit prescription coverage to $2,500 a year even though the newest drug therapies available for HIV can cost up to $10,000 annually.


Methodology

was conducted by the Alpha Center for the Kaiser Family Foundation. The study documents rates, regulations, and policies in ten states: California, Florida, Iowa, Louisiana, Montana, North Dakota, New York, Pennsylvania, Utah, and Washington. The states were selected to represent varying geographic regions, market sizes, urban/rural populations, and state regulations with regard to the individual insurance market. The health plans reviewed in each state were limited to those that sold more than $500,000 in coverage in 1995. The rates cited in the report are from 1998. Information presented in this report is based on population surveys, insurer filings with states, and interviews with independent insurance agents.

The Kaiser Family Foundation, based in Menlo Park, California, is a nonprofit, independent, national health care philanthropy and is not associated with Kaiser Permanente or Kaiser Industries. The Foundation’s work is focused on four main areas: health policy, reproductive health, and HIV in the United States, and health and development in South Africa.

Copies of the study are available by calling the Kaiser Family Foundation’s publication request line at 1-800-656-4533 (Ask for #1376). Other Foundation documents are available on this website. Return to top

Poll Finding

For-Profit Health Care Companies: Trends and Issues – Fact Sheet

Published: Feb 11, 1998

The rapid growth of managed care has brought with it a growing connection between the stock market and health care organizations. Health care services have evolved from being delivered by physicians and tax exempt institutions to a market-driven industry attracting investment capital from numerous sources. The market capitalization, or total stock value, of the relatively young HMO industry grew from a little over $3 billion in 1987 to almost $39 billion in 1997 – an almost twelve-fold increase – while the stock market as a whole grew about four-fold to a total of $10.5 trillion. However, recent health plan earnings announcements indicating companies’ difficulties in managing medical costs have led some equity analysts and investors to question whether these health sector stocks will offer growth potential in the future.

Some health care providers, policy-makers, and consumer advocates question whether it is appropriate that profit motives and goals to maximize stock values drive changes in the health care system. They argue that the types of decisions that ensure shareholder value are not necessarily the same as those that would guarantee quality health care. On the other hand, many industry representatives and investors credit market incentives and for-profit companies with fundamentally restructuring health services in a manner that has promoted efficiency and entrepreneurship in an industry in need of change.

The Growing Influence of For-Profit Organizations

jmf_chart1.gif

The increased corporate influence in health care is especially evident in the growing prevalence of for-profit companies within the HMO sector. Between 1981 and 1997, for-profit HMOs grew from representing 12% to 62% of total HMO enrollees, and from 18% to 75% of plans (Interstudy). Among hospitals, on the other hand, for-profit companies have increased their role, but nonprofit organizations continue to dominate the industry. Between 1981 and 1995, for-profit companies grew from representing 9% to 12% of community hospital beds, and from 13% to 14% of community hospitals (American Hospital Association data).

Total market capitalization of HMOs grew from $3.3 billion in January 1987 to $38.9 billion as of the end of November 1997, an almost twelve-fold increase.The growing role of for-profit companies in the HMO and hospital sectors has resulted from a combination of the emergence and growth of for-profit companies, as well as conversion of not-for-profit companies to for-profit status. One implication of these conversions is the establishment of charitable foundations designed to preserve the charitable missions and assets of the formerly not-for-profit organizations. As of September 1, 1997, there were 81 conversion foundations in the U.S., with assets totaling $9.3 billion. Health plan conversions represented the source of only 12 of the foundations, but these foundations hold almost half of the total assets (Grantmakers in Health).

Stock Trends

Many for-profit health services and HMO companies have tapped the stock market for financing. According to an analysis prepared for the Kaiser Family Foundation by Securities Data Company, there were 233 initial public offerings (IPOs) of stock of health services and HMO companies between 1987 and 1997.

The total stock value (or market capitalization) of publicly traded health services and HMO companies has increased dramatically over the past decade. Total market capitalization of HMOs grew from $3.3 billion in January 1987 to $38.9 billion as of the end of November 1997, an almost twelve-fold increase. For companies classifying themselves as health services, capitalization grew from $16.3 billion to $112.7 billion over the same time frame. In comparison, the overall stock market grew a little over four-fold during this time period. Wall Street’s growing interest and role in health care companies is also evidenced by the increased number of investment analysts following health care stocks – from 152 in 1987 to 559 in 1997, according to Nelson’s Directory of Investment Research.

jmf_chart2c.gif

Over the last decade, HMO stocks have generally out-performed the market as a whole, although these companies experienced significant price declines between March and August 1995, between April and July 1996, and between July and November 1997. Health services companies have tracked somewhat above the market through much of the decade, but the ten-year return for the overall market and health services companies is equal. Using a University of Chicago index that measures the market-weighted return of stocks, a 1987 investment of $100 in the market as a whole or in health services companies would have grown to $492 by the end of November 1997. In comparison, an investment of $100 in HMOs would have grown to $821.

Recently, average annual returns for health services and HMO companies have suffered relative to the overall market. While the market has achieved record levels, these health companies have experienced some notable difficulties.

jmf_chart3a.gif

Recent Events

Recent public announcements highlight anxiety among those on all sides of the question about the appropriate role for the stock market within the health services industry. Investors who were bullish on health care stocks in the past voted with their portfolios after being surprised by recent bad news from some of the largest and best-performing publicly traded health care companies. The largest publicly traded HMO, Aetna/U.S. Healthcare, suffered a greater than 10% decline in its stock price in December 1997 over the two days following an announcement that its chief financial officer would be stepping down amid rumored problems in managing the post-merger operations of U.S. Healthcare.

jmf_chart4.gif

Oxford Health Plan lost 75% of its stock market value between late October 1997 and the end of the year, when the company disclosed a charge to earnings stemming from accounting and computer problems affecting estimates of medical care costs and payments due to providers. Some also point to Oxford

National AIDS Treatment Information Project

Published: Feb 1, 1998
natip.gif

Viral Load Testing

What does viral load mean?

Viral load (or viral burden) refers to a measurement of the number of HIV particles. The total viral load is the amount of HIV in your blood, lymph nodes, spleen, and other parts of your body. If your viral load measurement is high, it indicates that HIV is reproducing and that the disease will likely progress faster than if your viral load is low.

What is viral load testing?

Viral load testing measures the number of HIV particles in your blood. These tests detect a kind of protein strand called RNA, which is a part of HIV containing the genes of the virus. Each HIV particle contains two copies of a molecule called RNA that carries the HIV genes. The viral load test determines the number of copies of HIV RNA molecules in a sample of blood.

There are three laboratory techniques that have been developed for viral load testing: quantitative polymerase chain reaction (PCR), branched-chain DNA (bDNA), and nucleic acid sequence-based amplification (NASBA). While the viral load test actually measures only the level of virus circulating in your blood, there is evidence that this value is a good indicator of the amount of virus in your entire body.

How is viral load testing helpful?

Your viral load test result provides important information that is used in conjunction with your CD4 cell (“T-cell”) count to monitor the status of HIV disease, to guide recommendations for therapy, and to predict its future course. While the CD4 count is a marker of the health of your immune system (high value is better), viral load testing directly measures the number of HIV particles circulating in your blood (low value is better). There is good evidence that keeping the viral load titer “as low as possible for as long as possible” will decrease the likelihood of developing complications of HIV disease and will prolong life.

What do the results of a viral load test mean?

Viral load tests are reported as the number of HIV “copies” in a milliliter of blood. Results can generally be classified as high, low, and intermediate. General guidelines for understanding the results follow:

  1. High viral load: greater than 5,000 to 10,000 (five thousand toten thousand) copies. This result indicates a higher risk for HIVdisease progression. High viral load titers may range as high asone million copies or more.
  2. Low viral load:
  3. less than 200 to 500 (two hundred to fivehundred) copies depending upon assay used. This result indicatesthat HIV is not actively replicating and that the risk of diseaseprogression is low. It is important to realize that an”undetectable” test result does not mean that HIV infection iscured. Rather it indicates that the level of virus in the blood islower than the test can measure.

Viral load titer results between these values (less than 5,000 to10,000 but greater than 200 to 500) are considered intermediate.

How is viral load testing used in managing HIV disease?

Doctors and researchers are still trying to determine how viral load testing should be best used for patient care. Most believe that viral load tests can be used to determine when to begin antiretroviral (anti-HIV) therapy and whether the drugs you are receiving are effective. In general, antiretroviral therapy is recommended in persons with high viral load titers regardless of their CD4 count results or whether they have any symptoms. In persons with intermediate viral load titers, either starting drug therapy or monitoring them off therapy may be reasonable options. If well tolerated, antiretroviral drugs are continued as long as they suppress the viral load titer.

When and how often should viral load testing be performed?

Recommendations about how to use viral load testing probably will change as researchers learn more about the test and doctors gain more experience with it. The following are general guidelines:

BaselineInitially it is a good idea to have two viral load tests performed at separate visits. This will give a reliable measure of the baseline HIV level. If your viral load is low and CD4 count is normal, your doctor may not recommend antiretroviral therapy. If your viral load is high, your doctor will recommend that you start antiretroviral therapy.

Evaluating therapyTo determine if antiretroviral therapy is effective, you should have a viral load test performed along with a CD4 count about four weeks after starting it. In general, effective therapy should result in a significant drop in your viral load titer over this time period. This is defined as at least a factor of three-fold (for example from 10,000 to less than 3,000). Your doctor will review the results with you and discuss the significance of the change in viral load titer.

Monitoring therapyYou should have a viral load test along with a CD4 count performed every three to four months to confirm that the antiretroviral drugs you are receiving continue to keep your viral level low. To provide accurate comparisons, your doctor will send all the viral load tests to the same laboratory and have your blood samples analyzed by the identical technique. In general, viral load testing should not be performed during a new illness or soon after a vaccination, as both of these may temporarily affect the results.

Teen Pregnancy: Key Statistics

Published: Jan 31, 1998

The Henry J. Kaiser Family Foundation

header.gif

girlin.gifwidespread.gif
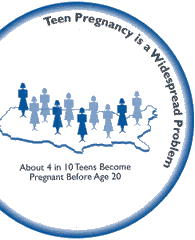
How widespread is teen pregnancy in the U.S.? More than four in 10 young women become pregnant at least once before they reach the age of 20 – nearly one million a year. increase.gif
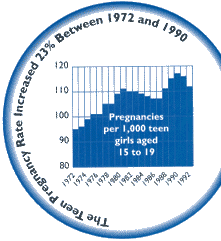
Are more teens getting pregnant today than two or three decades ago? The pregnancy rate among all teen girls aged 15-19 rose 23 percent between 1972 and 1990, and then fell slightly in 1992. This increase occurred because of a rise in the proportion of teenagers who have had sexual intercourse. During the same time, the pregnancy rate among sexually experienced teen girls decreased 19 percent, largely due to the fact that many more teens use contraception today than did in the past. Most (71%) sexually active teens use contraception.

Are most teen pregnancies planned?No. The overwhelming majority-78 percent-of pregnancies to 15-19 year old teen girls are not planned. Among younger teens, 15-17 year olds, 83 percent of pregnancies are unplanned. Back Next

Return to top

“The More You Know About Teen Pregnancy Prevention”Press Release Teen Pregnancy Key Statistics

Poll Finding

Kaiser Family Foundation Survey of Americans about Health Care and the Stock Market

Published: Jan 31, 1998

A survey on Americans’ perceptions of healthcare stocks and the differences between for-profit and nonprofit healthcare organizations. A fact sheet including data on financial trends from the past decade is included. This survey was released at a briefing held jointly by the Kaiser Family Foundation and the National Press Foundation for journalists on February 11 entitled Do Falling Stocks Mean Failing Care? Trends and Implications of Wall Street’s Declining Healthcare Stocks. The event is part of an ongoing series: MarketWatch: A Briefing Series for Journalists on Changes in the Health Care System.

National Campaign to Prevent Teen Pregnancy: The More You Know About Teen Pregnancy Prevention Campaign Information

Published: Jan 31, 1998

The Henry J. Kaiser Family Foundation

header.gif

subway.gifcouple.gifsources.gifWhen are teens most likely to get pregnant? Pregnancy risk is high right from the beginning of sexual activity: half of all first teen pregnancies occur in the first six months after sexual activity begins. mostpregnant.gif

mostteen.gif

What are the outcomes of most teen pregnancies?Half (54%) of pregnancies among teen girls, 15-19 years old, end in birth. A third of teen pregnancies end in abortion (32%) and 14 percent end in miscarriage. Who are teen mothers?Three quarters (76%) of teen mothers are unmarried and 60 percent are 18-19 years old.

What do teens say they need to know about preventing pregnancy?Most teens say information about sex and pregnancy prevention often comes “too late” and doesn’t have enough basic facts about contraception.

Do other countrieshave as many teen pregnancies and births as we do? No. The teen pregnancy rate in the United States is the highest of any industrialized democracy, nearly twice that of Great Britain and 10 times that of Japan.

usrate.gif

Back Return to top

“The More You Know About Teen Pregnancy Prevention”Press Release Teen Pregnancy Key Statistics

Medicare Beneficiaries and HMOs: Highlights of Los Angeles and New York City Medicare HMO Markets

Published: Jan 30, 1998

A growing number of Medicare beneficiaries are enrolling in Medicare HMOs as an alternative to the traditional Medicare program. However, Medicare HMO enrollment has not grown uniformly in market areas across the country. Case studies conducted by researchers at Mathematica Policy Research, Inc. for The Kaiser Family Foundation describe the evolution of Medicare managed care in the two largest markets in the United States: Los Angeles County and New York City. The reports also discuss the impact of the shift to Medicare managed care on Medicare beneficiaries, plans, and providers in each of the respective markets.

Setting Capitation Rates for HIV/AIDS Care:  A Primer for Ryan White CARE Act Title IV Project

Published: Jan 30, 1998

Setting Capitation Rates for HIV/AIDS Care: A Primer for Ryan White CARE Act Title IV Project

  • Report: Setting Capitation Rates for HIV/AIDS Care: A Primer for Ryan White CARE Act Title IV Projects