Two National Surveys: Views of Americans and Health Care Providers on Medical Abortion

Published: Aug 31, 1998

Will 1999 Be The Year For Mifepristone (RU-486)?And, An Update on Women’s Other Options for Very Early Abortion

September 16, 1998

Briefing Participants:

Janet Benshoof PresidentCenter for Reproductive Law & Policy120 Wall Street, 18th FloorNew York, NY 10005Press Contact: Margie Kelly212/514-5534

Jacqueline E. Darroch, PhDSenior Vice PresidentThe Alan Guttmacher Institute120 Wall StreetNew York, NY 10005

Vanessa Northington Gamble, MD, PhDAssociate ProfessorHistory of Medicine and Family Medicine, and DirectorCenter for the Study of Race and Ethnicity in MedicineUniversity of Wisconsin-Madison Medical School1300 University AvenueMadison, WI 53706-1532608/265-5996

Elizabeth Newhall, MDPartnerEverywoman’s Health, P.C., and Medical DirectorDowntown Women’s Center401 North Graham, #445Portland, OR 97227503/284-5220

Felicia H. Stewart, MDDirector of Reproductive Health ProgramsKaiser Family Foundation2400 Sand Hill RoadMenlo Park, CA 94025Press Contact: Tina Hoff,650/854-9400, ext. 210

Carolyn Westhoff, MD, MSAssociate Professor of Clinical Obstetrics and Gynecology and Public HealthNew York Presbyterian HospitalColumbia Presbyterian CampusColumbia University630 West 168th Street, Room 16-80New York, NY 10032Press Contact: Karin Eskenazi212/305-5587

Beverly Winikoff, MDSenior Medical AssociateThe Population CouncilOne Dag Hammarskjold PlazaNew York, NY 10017Press Contact: Sandra Waldman212/339-0525

Other Resources:

Mifepristone and Methotrexate Research

Mitchell D. Creinin, MDDirector of Family Planning & Family Planning ResearchDepartment of OB/GYN & Reproductive ScienceUniversity of Pittsburgh School of MedicineMagee-Women’s Hospital300 Halket StreetPittsburgh, PA 15213-3180412/641-1440

David Grimes, MDVice President of Biomedical AffairsFamily Health InternationalPO Box 13950Research Triangle Park, NC 27709-3950919/544-7040

Richard Hausknecht, MDMedical DirectorPlanned Parenthood of New York City208 East 72nd StreetNew York, NY 10021212/369-1116

Mifepristone Clinical Trials

Lawrence LaderPresidentAbortion Rights Mobilization51 Fifth Avenue, 10th FloorNew York, NY 10003212/255-0682

Eric Schaff, MDAssociate ProfessorDepartment of Family MedicineUniversity of Rochester885 South AvenueRochester, NY 14620716/442-7470

Methotrexate Clinical Trials

Michael Burnhill, MDVice President of Medical AffairsPlanned Parenthood Federation of America810 Seventh AvenueNew York, NY 10019-5818Press Contact: Steve Plever212/261-4310

Manual Vacuum Aspiration Research

Paul Blumenthal, MDAssociate ProfessorJHU Department of OB/GYNJohns Hopkins Bay View Medical Center4940 Eastern AvenueBaltimore, MD 21224410/550-0335

Forrest C. Greenslade, PhDPresidentIPASPO Box 100Carrboro, NC 27510919/967-7052

Patients’ Experiences With Medical Abortion

S. Marie Harvey, DrPHCo-DirectorPacific Institute for Women’s Health2999 Overland Avenue, Suite 111Los Angeles, CA 90064310/842-6828

Provider Training

Jodi MageeExecutive DirectorPhysicians for Reproductive Choice & Health1780 Broadway, 10th FloorNew York, NY 10019Press Contact: Ciara Wilson212/765-2322

Vicki SaportaExecutive DirectorNational Abortion Federation1755 Massachusetts, NW, Suite 600Washington, DC 20036Press Contact: Stephanie Mueller202/667-5881

Policy And Politics

Elizabeth CavendishLegal DirectorNational Abortion & Reproductive Rights Action League (NARAL)1156 15th Street, NW, Suite 700Washington, DC 20005202/973-3000

Marie BassProject DirectorReproductive Health Technologies Project1818 N Street, NW, Suite 450Washington, DC 20036202/530-2900

Return to top

Will 1999 Be The Year For Mifepristone (RU-486)?
Press Release Fact Sheet Q&A Resource List

Will 1999 Be The Year For Mifepristone (RU-486) And, An Update on Women’s Other Options for Very Early Abortion – Fact Sheet

Published: Aug 31, 1998

Abortion in the U.S.

  • Most abortions in the U.S. today are performed surgically, typically using vacuum aspiration (VA).
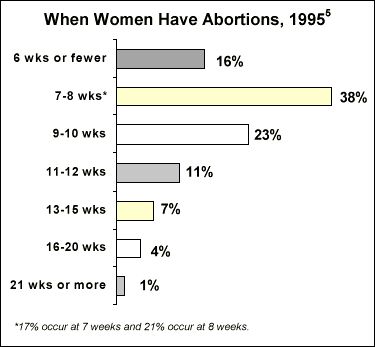
  • 9 in 10 abortions occur within the first 12 weeks of pregnancy.5
  • Surgical abortions can be performed as early as pregnancy is first detected, using electric VA or manual vacuum aspiration (MVA).21
  • Medical abortions are procedures using medications to induce abortion, such as mifepristone (also called RU-486) or methotrexate in combination with misoprostol.

Unintended Pregnancy And Surgical Abortion

  • Almost half (49%) of the 6.3 million pregnancies each year are unintended; 54% of unintended pregnancies end in abortion.
  • In 1994, there were about 1.43 million abortions in the United States; the abortion rate was 24.2 per 1,000 women aged 15-44.10
  • The U.S. abortion rate and the percent of pregnancies ending in abortion have declined slightly but steadily since 1980. Since 1990, all measures of abortion, including the annual incidence, have declined.6
  • About 15,000 women have abortions each year because they became pregnant after rape or incest.6
  • 48% of women 15*44 have at least one unplanned pregnancy sometime in their lives; 28% have one or more unplanned births, 30% have one or more abortions and 11% have both.9
  • An estimated 43% of women will have an abortion by the time they are 45, given current abortion rates.9

Who Has Abortions

  • 55% of women having abortions are younger than 25; 33% are aged 20-24 and 22% are teenagers.8
  • Six in 10 abortions occur to white women; however, their abortion rate is below that of minority women. Black women are nearly 3 times as likely as white women to have an abortion and Hispanic women are about twice as likely.8
  • Two-thirds of all abortions are to never-married women.8
1432-fig1.gif

Who Provides Surgical Abortions

  • 93% of abortions take place in clinics or doctors’ offices.6
  • The number of known current abortion providers (hospitals, abortion clinics, family planning clinics that offer surgical services, and physicians’ offices) declined by 8% between 1988 and 1992 (from 2,582 to 2,380).6
  • In 1992, just 12% of all ob/gyn residency programs provided routine first-trimester abortion training; three in 10 programs offered no first-trimester training.12
  • According to a national survey of ob/gyns in 1997, 36% of ob/gyns say they “ever perform” surgical abortions.18

Barriers & Access To Surgical Abortion Services

  • 84% of all U.S. counties lacked an abortion provider in 1992.6V52% of all abortion facilities provide services only through the 12th week of pregnancy.7
  • In 1992, 4 in 10 clinics and physicians’ practices would not perform surgical abortions before 6 weeks since the beginning of a woman’s last menstrual period (LMP). Another quarter of facilities do not perform abortions until even later in pregnancy.7
  • One-quarter of women who have non-hospital abortions travel at least 50 miles from their home to the abortion facility.7
  • From 1996 to 1997, the number of arsons doubled and bombings tripled against abortion providers.13

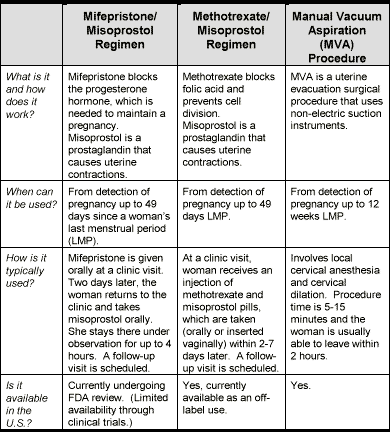
Very Early Abortion Methods3,14,21

1432-fig2.gif

Medical Abortion

  • Among women participating in the U.S. clinical trials who underwent an abortion within 49 days (7 weeks) LMP, the use of mifepristone (with misoprostol) was 92% effective in terminating pregnancy.16
  • Two percent of women who had a mifepristone abortion 49 days LMP in clinical trials required hospitalization, surgical intervention, and/or intravenous-fluid administration.16
  • Several published studies on the use of methotrexate (with misoprostol) for abortion have found the drug to be up to 96% effective in terminating pregnancy within 63 days LMP.1,2,4
  • Of 178 women who underwent pregnancy termination with methotrexate within 63 days LMP in one study, 7 required surgical intervention.1
  • A review of 12 international published studies conducted between 1979 and 1993 of patient attitudes and reactions to early first-trimester medical abortion found that 60-70% of women chose medical abortion when offered a choice between surgical and medical abortion.19
  • Over 2,000 U.S. women, who had a medical abortion with mifepristone and misoprostol during the U.S. clinical trials (1994-1995), found the method highly acceptable: 96% would recommend it to others, 91% would choose it again and 88% found it very or moderately satisfactory.20

Who Pays For Surgical Abortions

  • In 1993, the average amount paid for a non-hospital abortion at 10 weeks was $296; however, the cost ranged from $140 to more than $1,700.7
  • About 13% of all abortions are paid for with public funds, virtually all of which are state funds. Currently, 16 states pay for all or some abortions for poor women.15
  • In the private sector, over two-thirds of typical fee-for-service and managed care plans routinely cover abortions.17

Provider & Public Opinion On Medical Abortion

  • As of 1997, most providers said they were at least somewhat familiar with mifepristone; fewer were familiar with methotrexate.18
  • About half of all ob/gyns (54%) said they would offer mifepristone abortions if approved in the U.S., including 35% of ob/gyns who do not perform surgical abortions.18
  • Among providers familiar with mifepristone, most said they considered it safe (96% of ob/gyns) and effective (94% of ob/gyns).18
  • As of 1997, 43% of women and 51% of men had heard of either mifepristone or methotrexate; among women who had heard of the methods, 72% knew they could be used to end a pregnancy.18

References

1. Creinin M, Darney P. “Methotrexate and Misoprostol for Early Abortion.” Contraception. 1993; 48:339-348.

2. Creinin M. “Methotrexate for Abortion at 42 Days Gestation.” Contraception. 1993; 48:519-525.

3. Expanding Options For Early Abortions Packet. Overview and Fact Sheets. Reproductive Health Technologies Project, Washington D.C.: 1998.

4. Hausknecht R. “Methotrexate and Misoprostol to Terminate Early Pregnancy.” The New England Journal of Medicine. 1995;333:537-540.

5. Henshaw S. “Abortion Services in the United States, 1995-1996.” Family Planning Perspectives. (Forthcoming, Nov/Dec 1998).

6. Henshaw S, Van Vort J. “Abortion Services in the United States, 1991 and 1992.” Family Planning Perspectives. 1994; 26:100-106, 112.

7. Henshaw S. “Factors Hindering Access to Abortion Services.” Family Planning Perspectives. 1995; 27:54-59, 87.

8. Henshaw S, Kost K. “Abortion Patients in 1994-1995: Characteristics and Contraceptive Use.” Family Planning Perspectives. 1996; 28:140-147, 158.

9. Henshaw S. “Unintended Pregnancy in the United States.” Family Planning Perspectives. 1998; 30:24-29.

10. “Induced Abortion.” Facts in Brief. Jan. 1997, New York, N.Y. The Alan Guttmacher Institute.

11. Forrest JD. “Timing of Reproductive Life Stages.” Family Planning Perspectives. 1993; 82.

12. MacKay H, Trent MacKay A. “Abortion Training in Obstetrics and Gynecology Residency Programs in the United States, 1991-1992.” Family Planning Perspectives. 1995; 27:112-115.

13. National Abortion Federation Website (http://www.prochoice.org)

14. Schaff E, Eisinger S, Franks P, Kim S. “Methotrexate and Misoprostol for Early Abortion.” Fam Med. 1996;28:198-203.

15. Sollom T, Gold R, Saul R. “Public Funding for Contraceptive, Sterilization and Abortion Services, 1994.” Family Planning Perspectives. 1996; 28:166-173.v

16. Spitz I, Benton L, Bardin W, Robbins A. “The Safety and Efficacy of Early Pregnancy Termination with Mifepristone and Misoprostol: Results from the First Multicenter U.S. Trial.” The New England Journal of Medicine. 1998; 338:1241-1247.

17. Uneven & Unequal: Insurance Coverage and Reproductive Health Services. 1994, New York, N.Y. The Alan Guttmacher Institute.

18. Views of Americans and Health Care Providers on Medical Abortion: What They Know, What They Think, and What They Want.. 1998, Menlo Park, CA. Kaiser Family Foundation.

19. Winikoff B. “Acceptability of Medical Abortion in Early Pregnancy.” Family Planning Perspectives. 1995;27:142-148 & 185.

20. Winikoff B, Ellertson C, Elul B, Sivin I. “Acceptability and Feasibility of Early Pregnancy Termination by Mifepristone-Misoprostol.” Archives of Family Medicine. 1998; 7:360-366.

21. Winkler J, Blumenthal P, Greenslade F. “Early Abortion Services: New Choices for Providers and Women.” Advances in Abortion Care. 1996; 5. Carrboro, NC. IPAS.

Will 1999 Be The Year For Mifepristone (Ru-486)? And, An Update on Women’s Other Options for Very Early Abortion

Published: Aug 31, 1998

National Survey of Women’s Health Care Providers on Medical Abortion

September 16, 1998

One in Two Ob/Gyns Say They are Likely to Offer Mifepristone (RU-486) If Approved by FDA, And Almost Half Who Do Not Now Provide Abortions Say They Would Provide the Medical Alternative

Many Family Practice Physicians, Nurse Practitioners and Physician AssistantsAlso Report Interest

Menlo Park, CA – In the coming year, the Food and Drug Administration (FDA) is expected to complete its review of mifepristone (sometimes referred to as RU-486 or the “French abortion pill”), a medical alternative to early surgical abortion. If approved, a national survey of obstetrician/gynecologists (ob/gyns) finds that more than half (54%) say they are “very” or “somewhat” likely to prescribe the drug for patients seeking abortions, including almost as many (35%) who do not now provide surgical abortions.

In addition, many family practice physicians (45%) and nurse practitioners and physician assistants (54%) also express interest in offering mifepristone if approved, potentially significantly expanding the number of providers offering some form of abortion. In this survey, 3 percent of family practice physicians, and 2 percent of nurse practitioners and physician assistants, reported “ever performing” surgical abortion.

Available in France, England and Sweden for much of the last decade, mifepristone has been used by more than one half million women in Europe. In the United States, it has so far only been available to a limited number of women participating in clinical trials. Methotrexate, a FDA approved cancer drug which has also been found effective in ending pregnancy, is currently available in the United States, although information about how widely it is being offered is limited.

“The level of provider interest in mifepristone, especially among those not now providing abortions, could mean expanded access for women,” says Felicia H. Stewart, MD, Director of Reproductive Health Programs, Kaiser Family Foundation.

The survey findings are being presented today at a briefing in New York that provides an update on the availability of mifepristone and other medical alternatives to surgical abortion in the U.S. The briefing is part of an ongoing series, Emerging Issues in Reproductive Health, sponsored by The Henry J. Kaiser Family Foundation, The Alan Guttmacher Institute, and the National Press Foundation.

When this survey was conducted in the Spring of 1997, fewer providers expected to offer methotrexate over the coming year, even though it is already available here, than said they would likely prescribe mifepristone if approved: 19 percent of ob/gyns, 11 percent of family practice physicians, and 13 percent of nurse practitioners and physician assistants. In fact, more providers say if a choice were available they would choose mifepristone over methotrexate for their patients.

A companion survey of Americans between the ages of 18-44 conducted at the same time as the survey of providers finds that about half have heard of either mifepristone or methotrexate (43% of women, 51% of men). Among women of “reproductive age” who are aware of the medications, 72 percent know they can be used to end a pregnancy.


Methodology

The Kaiser Family Foundation’s National Survey of Health Care Providers on Medical Abortion is a national random-sample telephone survey of 756 health care providers, including 305 obstetrician/gynecologists, 238 family practice physicians, and 229 nurse practitioners and physician assistants practicing in the United States. It was designed by staff at the Kaiser Family Foundation and Fact Finders, Inc. and conducted by Fact Finders, Inc. between March 5 and June 12, 1997. The margin of error ranges from plus or minus two to seven percent for particular questions.

The Kaiser Family Foundation’s National Survey of Americans on Medical Abortion is a random-sample telephone survey of 1,000 women and 300 men aged 18-44 years old living in the continental United States. It was designed by staff at the Foundation and Princeton Survey Research Associates (PSRA) and conducted by PSRA between May 13 and June 8, 1997. The margin of sampling error is plus or minus three percent for women and plus or minus six percent for men.

A summary report on the findings, including the questionnaire and top line data, are available by calling the Kaiser Family Foundation’s publication request line at 1-800-656-4533 (Ask for #1431).

Kaiser/Harvard Survey of Americans on the Consumer Protection Debate

Published: Aug 31, 1998

The survey was designed and analyzed by researchers at the Kaiser Family Foundation and Harvard University; and was conducted by telephone by Princeton Survey Research Associates with 1,200 adults, 18 years or older, nationwide, between August 6 and August 20, 1998.

Sex in the 90s: 1998 National Survey of Americans on Sex and Sexual Health 1

Published: Aug 30, 1998

30. Are you currently involved in a sexual relationship?

Based on those not currently married or living as married; n=479

38 Yes 60 No 2 Don’t know/Refused 100

CURRENT RELATIONSHIP STATUS (Q29, Q30):60 Married/Living as 15 Unmarried and involved 24 Unmarried and not involved 1 Don’t know/Refused 100

31. How long have you (been married /been together with this person)?

Based on those married, living as married, or involved in a sexual relationship; n=916

20 2 years or less 25 3 to 9 years 20 10 to 19 years 35 20 years or more * Don’t know/Refused 100

32. These next few questions are about your sexual health and behavior. Please keep in mind that all of your answers are private. First, have you had sexual intercourse within the last TWELVE months?

75 Yes 25 No 5 Don’t know/Refused 100

33. Have you ever had sexual intercourse?

98 Yes 2 No * Don’t know/Refused 100

34. When you were growing up, did you have sex education courses in school?

Based on those currently or ever married, n=910

66 Yes 30 No 4 Don’t know/Refused 100

35. Since you become sexually active, about how many sexual partners have you had? Would you say more than twenty, eleven to twenty, seven to ten, three to six, two or one?

29 One 11 Two 24 3 to 6 11 7 to 10 10 11 to 20 9 More than 20 6 Don’t know/Refused 100

36. How often (do you and your spouse /do you and your partner/did you and your most recent partner) have sex . . .

9 Everyday or almost everyday 33 Several times a week 28 About once a week 11 About once a month 10 Less often than that 9 Don’t know/Refused 100

37. In general, how do think you compare with most of Americans your AGE…

a. Are you MORE comfortable talking about sexual issues than most Americans your AGE, LESS comfortable, or about as comfortable?

34 More comfortable 10 Less comfortable 51 About as comfortable 5 Don’t know/Refused 100

a. Do you think (you and your spouse have/you and your partner have/you and your most recent partner had) a BETTER sex life than most of Americans your age, NOT as good as sex life, or about the same?

Based on those who have had intercourse (excluding widows and widowers not currently involved in a relationship); n=1109

29 Better 9 Not as good 53 About the same 9 Don’t know/Refused 100

38. How often do you think the average American couple your AGE has sex . . .

7 Everyday or almost everyday 28 Several times a week 36 About once a week 10 About once a month 4 Less often than that 15 Don’t know /Refused 100

39. Thinking about (your SEXUAL relationship with your spouse, how often do you feel that the SEXUAL relationship is/your SEXUAL relationship with your partner, how often do you feel that the SEXUAL relationship your most recent SEXUAL relationship, how often did you feel that the SEXUAL relationship was) (INSERT) always, often, sometimes, or hardly ever?

Based on those who have had intercourse (excluding widows and widowers not currently involved in a relationship); n=1109

Always Often Sometimes Hardly ever Never (VOL.) DK/Ref. a. Loving 62 17 12 4 1 4 =100 b. Passionate 40 26 21 6 1 6 =100 c. Routine 10 13 32 32 6 7 =100 d. Creative 19 22 37 12 2 8 =100

40. How often (do you and your spouse/do you and your partner/did you and your most recent partner) (INSERT) very often, often, sometimes, or hardly ever?

Based on those who have had intercourse (excluding widows and widowers not currently involved in a relationship); n=1109

Always Often Sometimes Hardly ever Never (VOL.) DK/Ref. a. Do romantic things like eat by candlelight 8 18 35 30 6 3 =100 b. Act out your fantasies together 4 10 28 39 12 7 =100 c. Based on women; n=564Wear sexy lingerie 9 10 28 35 12 6 =100 d. Try different sexual positions 11 19 35 23 4 8 =100 e. Read books or watch videos about improving your sex life 2 3 14 52 26 3 =100 f. Go out on special evenings or “dates” or go away for weekends alone 11 22 37 22 5 3 =100

41. Still thinking about (your sexual relationship with your spouse, your sexual relationship with your partner/your most recent sexual relationship) please tell me whether each of the following topics is something you would (like/have liked) to talk about MORE, something you (talk/talked) about enough, or something that you (don”t/didn”t) need to talk about at all?

Based on those who have had intercourse (excluding widows and widowers not currently involved in a relationship); n=1109

More Enough No need to talk about DK/Ref. a. Concerns about AIDS or HIV or othersexually transmitted diseases 12 34 51 3 =100 b. Birth Control 8 27 62 3 =100 c. Your sex life generally 19 44 33 4 =100 d. Your sexual wants and desires 21 45 30 4 =100

READ: Now I have just a few more questions so we can learn more about the people who took part in our survey . . . 42. RECORD RESPONDENT”S GENDER

48 Male 52 Female 100

43. And, what is your age?

23 18-29 21 30-39 19 40-49 14 50-59 22 60 plus 1 Refused 100

44. What is the LAST grade or class you completed in school?

4 None, or grade 1 to 8 13 High school incomplete (Grades 9 – 11) 34 High school graduate (Grade 12), GED 3 Business, technical or vocational school after high school 23 Some college, no four-year degree 14 College graduate, four-year degree 8 Post-graduate or professional schooling, after college 1 Don’t know/Refused 100

45. Are you, yourself, of Hispanic or Latino background, such as Mexican, Puerto Rican, Cuban, or some other Spanish background?

7 Yes 92 No 1 Don’t know/Refused 100

46. What is your race? Are you white, black or African American, Asian or some other race?

84 White 11 Black 1 Asian 3 Other or Mixed race 1 Don’t know/Refused 100

47. Last year, that is in 1997, what was your total family income from all sources, BEFORE taxes? Just stop me when I get to the right category.

6 Less than $10,000 12 $10,000 to under $20,000 18 $20,000 to under $30,000 16 $30,000 to under $40,000 18 $40,000 to under $60,000 13 $60,000 to under $100,000 6 $100,000 or more 11 Don’t know/Refused 100

READ: Thank you very much for taking the time to answer the questions on this survey. We really appreciate it. Have a nice day/evening.

Return to top

Sex In The 90s:Kaiser Family Foundation/ABC Television 1998 National Survey of Americanson Sex and Sexual Health:Survey Part One Part Two Part Three ABC Television

Poll Finding

Sex in the 90s: 1998 National Survey of Americans on Sex and Sexual Health

Published: Aug 30, 1998

This survey takes an in-depth look at Americans’ attitudes about sex and sexual health issues in the 90s, including sex education, sex in the media, sexually transmitted disease and unintended pregnancy, and how we talk (or not) about sexual issues with children and partners.

Privatization of Public Hospitals

Published: Aug 30, 1998

This report examines the trends in the closure of public hospitals and their conversion to private ownership. It also provides case studies of communities where major privatizations have occurred.

Report (.pdf)

Summary of Findings (.pdf)

Report and Summary of Findings

Published: Aug 30, 1998

Privatization of Public Hospitals

Full Report available in PDF format.Summary available in PDF format.Return to top

Privatization of Public HospitalsReport

How Well Does the Employment-Based Health Insurance System Work for Low-Income Families?

Published: Aug 30, 1998

This paper describes the nature of employer coverage; its decline, especially among low-wage workers and low-income families; and the factors that are undermining its reach.

How Well Does the Employment-Based Health Insurance System Work for Low-Income Families?

Published: Aug 30, 1998

Part 2

Even when insurance is offered to low-wage workers, its costs to these workers may be substantial, and, for some, a barrier to coverage. In 1996, workers had to contribute an average of $1,615 per year for family coverage, or about 30% of the total premium.5 Thus, a worker who earned $10 an hour in 1996, with annual wages of about $20,000, would have had to spend 8% of earnings to buy family coverage.* A worker who earned just $7 an hour would have had to spend 12% of earnings on health insurance.

* Annual earnings are estimated based on 40 weekly hours worked and 50 weeks of work per year.

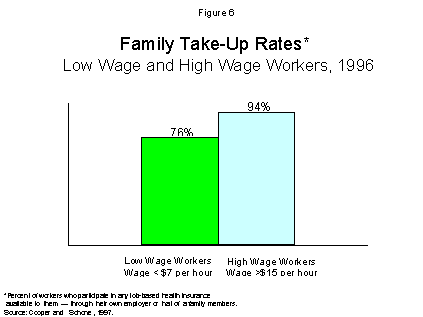
Despite substantial costs, the large majority of low-wage workers take up insurance when it is available to them. High-wage workers, though, are more likely than low-wage workers to participate in employer plans. In 1996, 76% of workers who earned less than $7 an hour participated in employer plans to which they had access (either through their own employer or through a family member’s employer), compared to 94% of workers who earned more than $15 per hour [Figure 6].6

2107-fig6.gif

These data do not provide much support for the view that low-income families lack coverage because they are turning down coverage that is available to them. Although high-wage workers are more likely to take up insurance, the limited impact of participation differences for low-wage workers is apparent in the following example. If low-wage workers increased their participation in any job-based plan offered to them from the current rate, 76 percent, to a rate comparable to that of high-wage workers, 94 percent, their coverage rate would only increase from 42 to 51 percent, still far below the rates found among higher wage workers.* In other words, closing the gap in participation would not close the gap in coverage between high-wage and low-wage workers. The primary reason low-income families lack coverage is not failure to participate, it is because they work for employers who do not offer them health benefits.

The Decline in Employer Coverage

The limits to employer coverage, especially for low-wage workers, are widely recognized. The deterioration of that coverage–again, especially for low-wage workers–is a pattern of even greater concern.

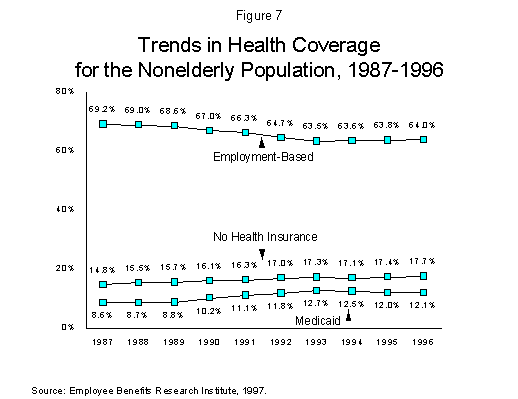
Between 1987 and 1996, the proportion of Americans under age 65 with employer coverage declined from 69.2% to 64%. Although partially offset by an increase in the proportion of the nonelderly population with Medicaid coverage (mostly for children), the proportion of the population without insurance grew from 14.8% in 1987 to 17.7% in 1996 [Figure 7].

* The coverage rate is equal to the participation rate multiplied by the proportion of workers with access to health coverage. Assuming access remains unchanged and 55% of low wage workers have access to employment-related health benefits, the coverage rate would increase from 42% (76% * 55%) to 51% (94% * 55%) if participation rates rose.

2107-fig7.gif

These changes in coverage–the drop in employer coverage and the rise in Medicaid– were most pronounced between 1988 and 1993. Since 1993, the deterioration in employer coverage appears to have stabilized, remaining at about 64 percent,7 while the Medicaid coverage rate dropped from 12.7% in 1993 to 12.1% in 1996, and the proportion of uninsured Americans under age 65 continued to rise, despite economic growth and relatively low unemployment.

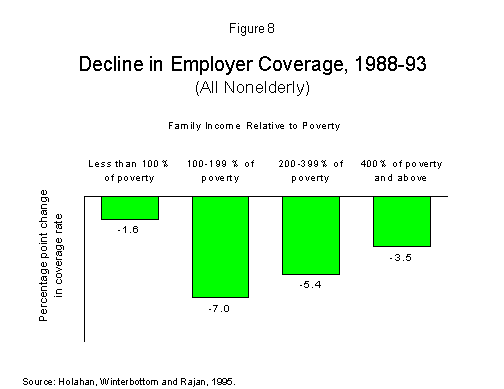
Although the deterioration of employer coverage has affected workers and families across all income levels, the impact has varied with income, with near-poor and modest income families showing the greater losses. From 1988 to 1993, the rate of employer coverage for the near-poor (with incomes between 100-199% of poverty) fell seven percentage points–from 50.9% to 43.9% [Figure 8]. Among individuals in families with incomes between 200 and 399% of poverty, the coverage rate fell from about 77.8 to 72.3 percent, and for those in families with incomes above 400% of poverty, the proportion with employer coverage dropped from 86.0% to 82.4 percent.8

2107-fig8.gif

Table 1 illustrates the same phenomenon over a longer period of time, focusing on workers differentiated by a variety of characteristics. Looking first at wages, coverage rates declined across all wage levels, but the drop in coverage was concentrated among low-wage workers. Coverage for workers in the bottom fifth of the wage distribution dropped 13 percentage points from 40% in 1979 to 27% in 1993. That drop is much larger than for workers in the top fifth of the wage distribution. The top wage earners were unaffected by the coverage declines in the early 1980s, but saw a small decline (of 3 percentage points) between 1988 and 1993. The fall in coverage by education level follows a similar pattern: large declines among less educated workers, with some decline in coverage in the most educated groups. Coverage rates fell more among men than women, and although employer coverage declined similarly among blacks and whites, Hispanics suffered a much larger drop.

Table 1

Change in Private Sector Employer-Provided Health Insurance Coverage, Wage and Salary Workers, 1979-1993

Health Insurance Coverage Percentage Point Change

Group*

1979

1988

1993

1979-93

All Workers

71%

69%

64%

-7

Wage (by wage fifth)

Lowest

40

32

27

-13

Second

66

62

59

-7

Middle

79

76

71

-8

Fourth

87

83

80

-7

Top

90

90

87

-3

Gender

Men

76

74

68

-8

Women

61

62

58

-3

Race

White

72

71

66

-6

Black

66

64

61

-5

Hispanic

63

56

47

-16

Education

Less Than High School

63

55

45

-18

High School Graduate

70

67

62

-8

Some College

72

68

63

-9

College

81

82

75

-6

More Than College

80

85

79

-1 *Private wage and salary workers ages 18 to 64, with at least 20 weekly hours and 26 weeks of work. Source: Mishel, Bernstein and Schmitt, 1997.

Return to top

Policy Brief Part 1 Part 2 Part 3Library Index