Sex in the 90s: 1998 National Survey of Americans on Sex and Sexual Health 1

Published: Aug 30, 1998

30. Are you currently involved in a sexual relationship?

Based on those not currently married or living as married; n=479

38 Yes 60 No 2 Don’t know/Refused 100

CURRENT RELATIONSHIP STATUS (Q29, Q30):60 Married/Living as 15 Unmarried and involved 24 Unmarried and not involved 1 Don’t know/Refused 100

31. How long have you (been married /been together with this person)?

Based on those married, living as married, or involved in a sexual relationship; n=916

20 2 years or less 25 3 to 9 years 20 10 to 19 years 35 20 years or more * Don’t know/Refused 100

32. These next few questions are about your sexual health and behavior. Please keep in mind that all of your answers are private. First, have you had sexual intercourse within the last TWELVE months?

75 Yes 25 No 5 Don’t know/Refused 100

33. Have you ever had sexual intercourse?

98 Yes 2 No * Don’t know/Refused 100

34. When you were growing up, did you have sex education courses in school?

Based on those currently or ever married, n=910

66 Yes 30 No 4 Don’t know/Refused 100

35. Since you become sexually active, about how many sexual partners have you had? Would you say more than twenty, eleven to twenty, seven to ten, three to six, two or one?

29 One 11 Two 24 3 to 6 11 7 to 10 10 11 to 20 9 More than 20 6 Don’t know/Refused 100

36. How often (do you and your spouse /do you and your partner/did you and your most recent partner) have sex . . .

9 Everyday or almost everyday 33 Several times a week 28 About once a week 11 About once a month 10 Less often than that 9 Don’t know/Refused 100

37. In general, how do think you compare with most of Americans your AGE…

a. Are you MORE comfortable talking about sexual issues than most Americans your AGE, LESS comfortable, or about as comfortable?

34 More comfortable 10 Less comfortable 51 About as comfortable 5 Don’t know/Refused 100

a. Do you think (you and your spouse have/you and your partner have/you and your most recent partner had) a BETTER sex life than most of Americans your age, NOT as good as sex life, or about the same?

Based on those who have had intercourse (excluding widows and widowers not currently involved in a relationship); n=1109

29 Better 9 Not as good 53 About the same 9 Don’t know/Refused 100

38. How often do you think the average American couple your AGE has sex . . .

7 Everyday or almost everyday 28 Several times a week 36 About once a week 10 About once a month 4 Less often than that 15 Don’t know /Refused 100

39. Thinking about (your SEXUAL relationship with your spouse, how often do you feel that the SEXUAL relationship is/your SEXUAL relationship with your partner, how often do you feel that the SEXUAL relationship your most recent SEXUAL relationship, how often did you feel that the SEXUAL relationship was) (INSERT) always, often, sometimes, or hardly ever?

Based on those who have had intercourse (excluding widows and widowers not currently involved in a relationship); n=1109

Always Often Sometimes Hardly ever Never (VOL.) DK/Ref. a. Loving 62 17 12 4 1 4 =100 b. Passionate 40 26 21 6 1 6 =100 c. Routine 10 13 32 32 6 7 =100 d. Creative 19 22 37 12 2 8 =100

40. How often (do you and your spouse/do you and your partner/did you and your most recent partner) (INSERT) very often, often, sometimes, or hardly ever?

Based on those who have had intercourse (excluding widows and widowers not currently involved in a relationship); n=1109

Always Often Sometimes Hardly ever Never (VOL.) DK/Ref. a. Do romantic things like eat by candlelight 8 18 35 30 6 3 =100 b. Act out your fantasies together 4 10 28 39 12 7 =100 c. Based on women; n=564Wear sexy lingerie 9 10 28 35 12 6 =100 d. Try different sexual positions 11 19 35 23 4 8 =100 e. Read books or watch videos about improving your sex life 2 3 14 52 26 3 =100 f. Go out on special evenings or “dates” or go away for weekends alone 11 22 37 22 5 3 =100

41. Still thinking about (your sexual relationship with your spouse, your sexual relationship with your partner/your most recent sexual relationship) please tell me whether each of the following topics is something you would (like/have liked) to talk about MORE, something you (talk/talked) about enough, or something that you (don”t/didn”t) need to talk about at all?

Based on those who have had intercourse (excluding widows and widowers not currently involved in a relationship); n=1109

More Enough No need to talk about DK/Ref. a. Concerns about AIDS or HIV or othersexually transmitted diseases 12 34 51 3 =100 b. Birth Control 8 27 62 3 =100 c. Your sex life generally 19 44 33 4 =100 d. Your sexual wants and desires 21 45 30 4 =100

READ: Now I have just a few more questions so we can learn more about the people who took part in our survey . . . 42. RECORD RESPONDENT”S GENDER

48 Male 52 Female 100

43. And, what is your age?

23 18-29 21 30-39 19 40-49 14 50-59 22 60 plus 1 Refused 100

44. What is the LAST grade or class you completed in school?

4 None, or grade 1 to 8 13 High school incomplete (Grades 9 – 11) 34 High school graduate (Grade 12), GED 3 Business, technical or vocational school after high school 23 Some college, no four-year degree 14 College graduate, four-year degree 8 Post-graduate or professional schooling, after college 1 Don’t know/Refused 100

45. Are you, yourself, of Hispanic or Latino background, such as Mexican, Puerto Rican, Cuban, or some other Spanish background?

7 Yes 92 No 1 Don’t know/Refused 100

46. What is your race? Are you white, black or African American, Asian or some other race?

84 White 11 Black 1 Asian 3 Other or Mixed race 1 Don’t know/Refused 100

47. Last year, that is in 1997, what was your total family income from all sources, BEFORE taxes? Just stop me when I get to the right category.

6 Less than $10,000 12 $10,000 to under $20,000 18 $20,000 to under $30,000 16 $30,000 to under $40,000 18 $40,000 to under $60,000 13 $60,000 to under $100,000 6 $100,000 or more 11 Don’t know/Refused 100

READ: Thank you very much for taking the time to answer the questions on this survey. We really appreciate it. Have a nice day/evening.

Return to top

Sex In The 90s:Kaiser Family Foundation/ABC Television 1998 National Survey of Americanson Sex and Sexual Health:Survey Part One Part Two Part Three ABC Television
Poll Finding

Sex in the 90s: 1998 National Survey of Americans on Sex and Sexual Health

Published: Aug 30, 1998

This survey takes an in-depth look at Americans’ attitudes about sex and sexual health issues in the 90s, including sex education, sex in the media, sexually transmitted disease and unintended pregnancy, and how we talk (or not) about sexual issues with children and partners.

Privatization of Public Hospitals

Published: Aug 30, 1998

This report examines the trends in the closure of public hospitals and their conversion to private ownership. It also provides case studies of communities where major privatizations have occurred.

Report (.pdf)

Summary of Findings (.pdf)

Report and Summary of Findings

Published: Aug 30, 1998

Privatization of Public Hospitals

Full Report available in PDF format.Summary available in PDF format.Return to top

Privatization of Public HospitalsReport

How Well Does the Employment-Based Health Insurance System Work for Low-Income Families?

Published: Aug 30, 1998

This paper describes the nature of employer coverage; its decline, especially among low-wage workers and low-income families; and the factors that are undermining its reach.

How Well Does the Employment-Based Health Insurance System Work for Low-Income Families?

Published: Aug 30, 1998

Part 2

Even when insurance is offered to low-wage workers, its costs to these workers may be substantial, and, for some, a barrier to coverage. In 1996, workers had to contribute an average of $1,615 per year for family coverage, or about 30% of the total premium.5 Thus, a worker who earned $10 an hour in 1996, with annual wages of about $20,000, would have had to spend 8% of earnings to buy family coverage.* A worker who earned just $7 an hour would have had to spend 12% of earnings on health insurance.

* Annual earnings are estimated based on 40 weekly hours worked and 50 weeks of work per year.

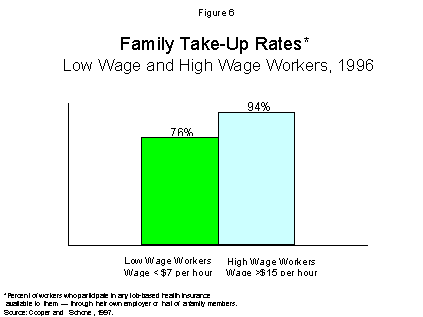
Despite substantial costs, the large majority of low-wage workers take up insurance when it is available to them. High-wage workers, though, are more likely than low-wage workers to participate in employer plans. In 1996, 76% of workers who earned less than $7 an hour participated in employer plans to which they had access (either through their own employer or through a family member’s employer), compared to 94% of workers who earned more than $15 per hour [Figure 6].6

2107-fig6.gif

These data do not provide much support for the view that low-income families lack coverage because they are turning down coverage that is available to them. Although high-wage workers are more likely to take up insurance, the limited impact of participation differences for low-wage workers is apparent in the following example. If low-wage workers increased their participation in any job-based plan offered to them from the current rate, 76 percent, to a rate comparable to that of high-wage workers, 94 percent, their coverage rate would only increase from 42 to 51 percent, still far below the rates found among higher wage workers.* In other words, closing the gap in participation would not close the gap in coverage between high-wage and low-wage workers. The primary reason low-income families lack coverage is not failure to participate, it is because they work for employers who do not offer them health benefits.

The Decline in Employer Coverage

The limits to employer coverage, especially for low-wage workers, are widely recognized. The deterioration of that coverage–again, especially for low-wage workers–is a pattern of even greater concern.

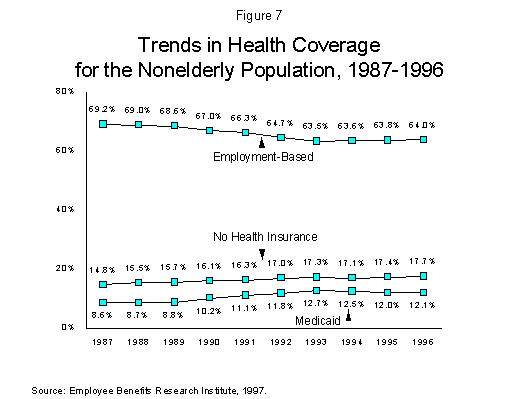
Between 1987 and 1996, the proportion of Americans under age 65 with employer coverage declined from 69.2% to 64%. Although partially offset by an increase in the proportion of the nonelderly population with Medicaid coverage (mostly for children), the proportion of the population without insurance grew from 14.8% in 1987 to 17.7% in 1996 [Figure 7].

* The coverage rate is equal to the participation rate multiplied by the proportion of workers with access to health coverage. Assuming access remains unchanged and 55% of low wage workers have access to employment-related health benefits, the coverage rate would increase from 42% (76% * 55%) to 51% (94% * 55%) if participation rates rose.

2107-fig7.gif

These changes in coverage–the drop in employer coverage and the rise in Medicaid– were most pronounced between 1988 and 1993. Since 1993, the deterioration in employer coverage appears to have stabilized, remaining at about 64 percent,7 while the Medicaid coverage rate dropped from 12.7% in 1993 to 12.1% in 1996, and the proportion of uninsured Americans under age 65 continued to rise, despite economic growth and relatively low unemployment.

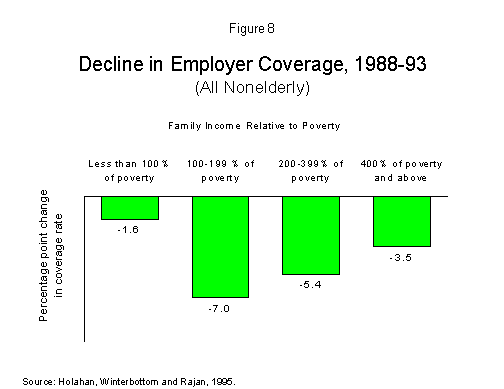
Although the deterioration of employer coverage has affected workers and families across all income levels, the impact has varied with income, with near-poor and modest income families showing the greater losses. From 1988 to 1993, the rate of employer coverage for the near-poor (with incomes between 100-199% of poverty) fell seven percentage points–from 50.9% to 43.9% [Figure 8]. Among individuals in families with incomes between 200 and 399% of poverty, the coverage rate fell from about 77.8 to 72.3 percent, and for those in families with incomes above 400% of poverty, the proportion with employer coverage dropped from 86.0% to 82.4 percent.8

2107-fig8.gif

Table 1 illustrates the same phenomenon over a longer period of time, focusing on workers differentiated by a variety of characteristics. Looking first at wages, coverage rates declined across all wage levels, but the drop in coverage was concentrated among low-wage workers. Coverage for workers in the bottom fifth of the wage distribution dropped 13 percentage points from 40% in 1979 to 27% in 1993. That drop is much larger than for workers in the top fifth of the wage distribution. The top wage earners were unaffected by the coverage declines in the early 1980s, but saw a small decline (of 3 percentage points) between 1988 and 1993. The fall in coverage by education level follows a similar pattern: large declines among less educated workers, with some decline in coverage in the most educated groups. Coverage rates fell more among men than women, and although employer coverage declined similarly among blacks and whites, Hispanics suffered a much larger drop.

Table 1

Change in Private Sector Employer-Provided Health Insurance Coverage, Wage and Salary Workers, 1979-1993

Health Insurance Coverage Percentage Point Change

Group*

1979

1988

1993

1979-93

All Workers

71%

69%

64%

-7

Wage (by wage fifth)

Lowest

40

32

27

-13

Second

66

62

59

-7

Middle

79

76

71

-8

Fourth

87

83

80

-7

Top

90

90

87

-3

Gender

Men

76

74

68

-8

Women

61

62

58

-3

Race

White

72

71

66

-6

Black

66

64

61

-5

Hispanic

63

56

47

-16

Education

Less Than High School

63

55

45

-18

High School Graduate

70

67

62

-8

Some College

72

68

63

-9

College

81

82

75

-6

More Than College

80

85

79

-1 *Private wage and salary workers ages 18 to 64, with at least 20 weekly hours and 26 weeks of work. Source: Mishel, Bernstein and Schmitt, 1997.

Return to top

Policy Brief Part 1 Part 2 Part 3Library Index

Poll Finding

Summary of Findings: Privatization of Public Hospitals

Published: Aug 30, 1998

This Summary presents background, findings, and data from the Economic and Social Research Institute’s (ESRI) full report, Privatization of Public Hospitals. Section I provides background about public hospital conversions, including the role of public hospitals, reasons for conversion, the mechanisms of conversion and new ownership entities, and analysis of national and regional public hospital data. Section II provides a discussion of the five case studies of public hospital conversions and the key findings from the case studies. Attachment A is a table of public hospital conversions and closures by region and state.

Medicaid Eligibility for Families and Children

Published: Aug 30, 1998

This paper provides an overview of Medicaid eligibility policy and examines two groups of Americans in particular – low-income children and nondisabled adults under 65 – and summarizes the statutory and regulatory pathways to Medicaid eligibility available to them as individuals. The paper concludes with a discussion of policy options available to states under current law for increasing Medicaid eligibility for these two groups.

Sex in the 90s: 1998 National Survey of Americans on Sex and Sexual Health 2

Published: Aug 30, 1998

16. Do you think sex education courses should ONLY teach abstinence — that is NOT having sex until marriage — OR should courses teach about BOTH abstinence AND give teens enough information to help them prevent unplanned pregnancies and the spread of sexually transmitted diseases if they DO decide to have sex?

18 Only abstinence 81 Both 8 Don’t know/Refused 100

17. Do you think that HIGH SCHOOL health clinics should provide young people with condoms and other forms of birth control if students ask for them?

57 Yes 40 No 3 Don’t know/Refused 100

18. In general, at what age do you think most young people have sexual intercourse for the first time?Teens = (13-18) Perceptions Fall 1997 Survey* 15 12 or younger 2 11 13 5 15 14 12 21 15 18 17 16 29 6 17 16 5 18 or older 14 10 Don’t Know/Refused 4 100 100

*PSRA for The Kaiser Family Foundation and YM Magazine

19. When you were growing up, did you have sex education courses in school?

41 Yes 59 No * Don’t know/Refused 100

20. Still thinking back to when you were growing up, would you say you got a lot of information about sex from (INSERT), some, only a little or no information at all?

A lot Some Only a little No info. at all DK/Ref. Did not have sex education in school (Q19) a.Sex education in school Based on total 6 17 16 1 1 59 =100 Based on those who had sexed. in school; n=510 15 43 39 2 1 NA =100 b.Your parents 13 22 27 38 * NA =100

21. Thinking about your (AGE) year old, have you ever talked with him or her about…

Based on parents with at least one child age 8 to 18, (target child chosenrandomly for those with more than one child in age range); n=329

Yes No DK/Ref. a. The basics of reproduction — that is “the birds and bees” 79 21 0 =100 b. HIV/AIDS and other sexually transmitted diseases 80 20 0 =100 c. Issues about relationships and becoming sexually active 63 37 * =100 d. The importance of using protection, such as condoms, to preventpregnancy or disease if they become sexually active 52 48 0 =100

22. When you were growing up did your parents talk with YOU about (INSERT) or not?

Yes No DK/Ref. a. The basics of reproduction — that is “the birds and bees” 41 58 1 =100 b. Sexually transmitted diseases 21 78 1 =100 c. Issues about relationships and becoming sexually active 31 68 1 =100 d. The importance of using protection, such as condoms, to prevent pregnancy or disease if you became sexually active 25 75 * =100

23. Compared to your parents when you were growing up, do you think, (you were/you are/you would be) more open with your child(ren) about sex and sexual issues in general, less open, or about as open as your parents were with you?

79 More open 2 Less open 17 About as open 2 Don’t know/Refused 100

24. Americans have different views about sexual issues. For each of the following statements, please tell me if you strongly agree, somewhat agree, somewhat disagree, or strongly disagree. (First/Next)

Strongly agree Somewhat agree Somewhat disagree Strongly disagree DK/Ref. a. Americans overall are uptight aboutsex and sexual issues 27 36 21 14 2 =100 b. I personally have a hard time talking aboutsex and sexual issues 11 22 25 41 1 =100 c. If Americans were more OPEN talking aboutsex there would be LESS of a problem with unplanned pregnancy and sexually transmitted diseases in this country 41 27 16 14 2 =100 d. Sexual issues are private and should only bediscussed among intimate couples 26 25 25 23 1 =100

25. When you were growing up, did you have sex education courses in school?

85 Long-term monogamous relationships 9 Several relationships with different partners over a life time 6 Don’t know/Refused 100

26. What is your opinion about a married person having sexual relations with someone other than their marriage partner–is it always wrong, almost always wrong, wrong only sometimes, or not wrong at all?

January 1991* 79 Always 71 12 Almost always 17 6 Sometimes 10 2 Not wrong at all 1 1 Don’t Know/Refused 1 100 100

*PSRA for Troika Productions and Lifetime Television

27. For each of the following statements, please tell me if you strongly agree, somewhat agree, somewhat disagree, or strongly disagree.

Strongly agree Somewhat agree Somewhat disagree Strongly disagree DK/Ref. a. In general Americans have a hard timetalking about sex and sexual issues 27 39 19 13 2 =100 b. Making sex a forbidden subject only encouragesyoung people to want to have sex 36 29 18 16 1 =100 c. Sometimes it is harder for couples to TALKabout sexual issues like birth control and sexually transmitted diseases than to HAVE sex 29 38 17 13 3 =100

READ: Now some questions about you . . .

28. How would you rate your SEX life these days? Please use a ten point scale, where ten means great and one means terrible.

15 10 7 9 18 8 11 7 7 6 11 5 1 4 2 3 2 2 8 1 10 Not applicable/Abstinent (VOL.) 100 6.77 Mean 7.00 Median

29. Are you currently married, LIVING AS married, widowed, divorced, separated, or have you never been married?

56 Married 4 Living as married 8 Widowed 10 Divorced 3 Separated 19 Never married * Gay(VOL.) 0 Refused 100

Return to top

Sex In The 90s:Kaiser Family Foundation/ABC Television 1998 National Survey of Americanson Sex and Sexual Health:Survey Part One Part Two Part Three ABC Television
Sex in the 90s: 1998 National Survey of Americans on Sex and Sexual Health – Toplines/Survey

Published: Aug 30, 1998

Sex In The 90s:Kaiser Family Foundation/ABC Television 1998 National Survey of Americans on Sex and Sexual Health

Methodology:The Kaiser Family Foundation and ABC Television 1998 National Survey of Americans on Sex and Sexual Health is a random-sample telephone survey of 1,204 adults 18 and older living in the United States. It was designed by staff at the Foundation and Princeton Survey Research Associates (PSRA) and conducted by PSRA between April 24 and May 10, 1998. The margin of sampling error is plus or minus 3 percentage points.

Questionnaire and Toplines

INTRODUCTION: Hello, my name is _______ and I’m calling for Princeton Survey Research of Princeton, New Jersey. We are conducting a national opinion survey about some important social issues, like health and family.

First, I have some questions about some social issues in this country . . .

1. Unplanned pregnancy and sexually transmitted diseases are bigger problems in the United States than in many other Western countries, and people have many different explanations for why this is so. Please tell me whether YOU think each of the following contributes a lot, some, only a little or not at all to these problems in the U.S.

A lot Some Only a little Not at all DK/Ref. a. A lack of openness about sex and sexual issues 35 34 15 12 4 =100 b. Poverty and poor education 46 29 15 8 2 =100 c. A decline in moral values 65 20 8 5 2 =100 d. Too much casual sex in the movies and on TV 55 25 13 6 1 =100 e. Inadequate sex education in the schools 32 32 20 13 3 =100 2. Do you think the way TV programs show sex and nudity tends to ENCOURAGE irresponsible sexual behavior, DISCOURAGE irresponsible sexual behavior, or don’t you think it has much effect on people’s sexual behavior?

74 Encourages irresponsible sexual behavior 3 Discourages irresponsible sexual behavior 20 No effect 3 Don’t know/Refused 100 3. In your opinion, if TV characters in entertainment programs are talking about or engaging in sexual activity, should they talk about condoms or make other references to “safer sex,” or NOT?

77 Should 18 Should not 5 Don’t know/Refused 100

4. How well do you think the way sex is usually shown on TV and in the movies reflects your own sex life?Would you say . . .

3 Very well 16 Somewhat well 23 Not too well 50 Not well at all 8 Don’t know/Refused 100

5. To what extent do you think TV and movies send the message that. . . (INSERT). Do you think TV and movies send this message a lot, somewhat, only a little, or not at all?

A lot Some Only a little Not at all DK/Ref. a. To have a great sex life you must changepartners often 41 29 14 14 2 =100 b. You can have spontaneous sex without worryingabout the consequences 53 25 11 9 2 =100 c. Only thin, beautiful people can have great sex 53 22 8 14 3 =100 d. Older adults can have great sex 14 31 33 19 3 =100 e. To have a “normal” sex drive means alwaysbeing in the mood for sex 41 31 13 12 3 =100 READ: On a different topic . . .

6. Do you have any children — either adult children or children who are still growing up?

70 Yes, have children 30 No children * Refused 100

7. Are any of your children age 18 or under?

40 Yes, have children age 18 or under 30 No children under 18 0 Don’t know/Refused 30 Have no children at all/DK/Ref 100

8. Starting with the older, please tell me the ages of your children who are age 18 or under.RESULTS NOT REPORTED

AGE OF TARGET CHILD:

49 8-12 51 13-18 100 READ: Please answer the next few questions thinking about your (AGE) year old . . .

9. Have you ever had a conversation about a sexual issue with your (AGE) year old because of something one or both of you saw . . .

Based on parents with at least one child age 8 to 18, (target child chosen randomly for those with more than one child in age range); n=329

Yes No DK/Ref. a. On the news 63 36 1 =100 b. On a television show 70 30 0 =100

10. Thinking about the last time you had a conversation because of something you saw on television, which comes closer to how you felt …

Based on parents who had a conversation about a sexual topic with target child because of something on TV; n=257

65 It was a good opportunity for you and your child to talk about sexual issues 31 It raised a sexual issue you did not want to talk about with your child at that time 4 Don’t know/Refused 100 11. Thinking about sexual content on television. . . Have you ever (INSERT) because of sexual content you saw (on TV)?

Yes No DK/Ref. a. Q11a based on parents with at least one child age 18 or under; n=491Not allowed (one of your children/your child) to watch a certain show 76 24 * =100 b. Q11b-f based on totalTurned off the television 60 39 1 =100 c. Talked to a health care provider about a sexual topic 46 52 2 =100 d. Talked to a health care provider about a sexual topic 9 91 0 =100 e. Had a conversation with a sexual partner about a sexual topic 44 54 2 =100 f. Tried something new sexually 13 85 2 =100

READ: Next I have some questions about sex education . . .

12. In general would you say that young people today get information about sex and birth control at…

22 About the right time 24 Too soon 47 Too late 7 Don’t know/Refused 100

13. In general do you SUPPORT or OPPOSE sex education courses being taught to . . .

Support Oppose DK/Ref. a. High school age students — that is children age 15 to 18 85 12 3 =100 b. Junior high school age students — that is children age 12 to 14 76 21 3 =100 c. Elementary school age students — that is children 6 to 12 35 60 5 =100

14. If sex education is taught in HIGH SCHOOLS, do you think it should or should not…

Should Should Not DK/Ref. Sex education should not be taught at all a. Tell young people NOT to have sexualintercourse before marriage? 68 27 4 1 =100 b. Tell young people who ARE sexually activeto use protection, such as condoms, to prevent against pregnancy and disease? 92 5 2 1 =100 c. Teach the basic facts of human reproduction? 94 4 4 1 =100 d. Discuss how to know when you are readyto have sex? 74 19 6 1 =100 e. Discuss how to talk about sex with a partner? 74 21 4 1 =100

15. Some people believe that whether or not young people are sexually active, they should be given information to protect themselves from unplanned pregnancies and sexually transmitted diseases. Others believe that telling young people about birth control and sexually transmitted diseases only encourages them to have sex. Which come closer to your view?

83 They should be given information 14 Information only encourages them to have sex 3 Don’t know/Refused 100

Return to top

Sex In The 90s:Kaiser Family Foundation/ABC Television 1998 National Survey of Americanson Sex and Sexual Health:Survey Part One Part Two Part Three ABC Television