The Washington Post/Kaiser Family Foundation Survey of Long-Term Prescription Painkiller Users and Their Household Members

Authors: Bianca DiJulio, Bryan Wu, and Mollyann Brodie
Published: Dec 9, 2016

Overview

This partnership poll from The Washington Post and the Kaiser Family Foundation examines the long-term use of prescription painkillers by exploring the views and experiences of adults 18 and over who they themselves have taken strong prescription painkillers for a period of two months or more at some time in the past two years, other than to treat pain from cancer or terminal illness. The survey, conducted at a time when the nation is struggling to address the ongoing prescription painkiller and heroin epidemic, takes a closer look at long-term users of prescription painkillers to better understand how they started taking these drugs, their interactions with medical providers, their concerns and experiences with addiction, and their views of efforts to stem the abuse of painkillers. In addition, the survey also included household members of long-term users in order to capture their unique insight into how the drug use has impacted the individual.

This survey is the 30th in a series of surveys dating back to 1995 that have been conducted as part of The Washington Post/Kaiser Family Foundation Survey Project.

Read The Washington Post’s Coverage

One-third of long-term users say they’re hooked on prescription opioids

Opioid drugs make pain tolerable, most long-term users say

An opioid epidemic is what happens when pain is treated only with pills

Editorial: The great opioid epidemic

The doctor you see in the ER may put you on a path toward long-term opioid use

Executive Summary

As the nation struggles to address the ongoing prescription painkiller and heroin abuse and overdose epidemic, The Washington Post and Kaiser Family Foundation Survey of Long-Term Prescription Painkiller Users and Their Household Members takes a closer look at those who are long-term users of prescription painkillers to better understand from their perspective what some of the drawbacks and benefits of the drugs are, as well as how they have impacted their lives. The survey explores how these long-term users started taking the drugs, their interactions with medical providers, their concerns and experiences with addiction, and their views of efforts to stem the abuse of painkillers. The survey was conducted among adults 18 and over who they themselves have taken strong prescription painkillers for a period of two months or more1  at some time in the past two years, other than to treat pain from cancer or terminal illness. In addition, the survey also included household members of long-term users in order to capture their unique insight into how the drug use has impacted the individual. Some of the key findings from this survey are noted below.

Long-Term Users Say They Started for Medical Reasons and Discussed Risks with Providers

  • Nearly all long-term users of prescription painkillers say they started the painkillers with a prescription from a doctor and that they started taking them for chronic pain (44 percent), for pain after a surgery (25 percent) or for pain after an accident or injury (25 percent).
  • Majorities say their doctor talked to them about the possibility of addiction or dependence, avoiding alcohol or other medications, and other ways to manage pain, but 61 percent say there was no discussion about a plan for getting off the painkillers. Still, a large majority (75 percent) say they think their doctor provided enough information on the risk of addiction and other side effects associated with prescription painkillers.

Disability and Poor Health Are Common Among Long-Term Users, Most Say Drugs Have Improved Life and Are Concerned About Crackdown

  • They are a group that reports significant health issues such as a debilitating disability or chronic disease (70 percent), only fair or poor physical health (42 percent), or taking four or more prescription drugs (57 percent).
  • A majority of long-term prescription painkiller users (57 percent) say it has made their quality of life better, but one in six (16 percent) say it has made it worse.
  • With the recent attention prescription painkillers have received in light of the epidemic of abuse and overdose, two-thirds (67 percent) of long-term users say they are concerned that efforts to decrease the number of people abusing prescription painkillers will make it more difficult for them to access them.

Some Report Non-Medical Use, Addiction or Dependence, or Other Misuse

  • While nearly all long-term users say they use the drugs to relieve pain, some also report that a major reason they take them is “for fun or to get high” (20 percent), “to deal with day-to-day stress” (14 percent), or “to relax or relieve tension” (10 percent). Only three percent of long-term users say that when they started, it was for recreational reasons.
  • Sizeable shares also report:
    • being physically dependent or addicted to the painkillers (34 percent) (a group explored in detail in Section 2),
    • they have taken prescription painkillers that were not prescribed specifically for them since starting on painkillers (17 percent),
    • they have given their painkillers to a family member or friend (14 percent), and
    • they have known or suspected someone was using, taking, or selling their painkillers (20 percent).

Household Members Generally Report More Negative Impacts

  • Interviews with people living in the same household as a long-term prescription painkiller user provide another angle of insight into these individuals, be it their spouse, parent, or another household member.
  • Household members are more likely to report they think the user is or was addicted or dependent and that their use has had a negative impact on their finances, personal relationships, and their health.

Views of the Painkiller Epidemic

  • Majorities of people personally using prescription painkillers as well as people in their household say that people who use painkillers and doctors who prescribe painkillers deserve at least some of the blame for the painkiller addiction epidemic.
  • When asked about a number of efforts what would be effective in reducing the abuse of prescription painkillers, long-term users point to efforts such as increasing pain management training for medical students and doctors (82 percent), increasing access to addiction treatment programs (80 percent), and increasing research about pain and pain management (81 percent).

Report: Introduction

Currently, the nation is struggling with an ongoing epidemic of prescription painkiller and heroin abuse and overdose, driven at least in part by a recent increase in the number of prescriptions written.2  Recognizing the role physicians play in prescribing strong painkillers, the Centers for Disease Control and Prevention recently released guidelines for prescribing these medications and note the limited evidence of the efficacy of long-term use of prescription painkillers and concerns that the risks of addiction and adverse effects may outweigh their benefits.3  However, many people rely on prescription painkillers to provide relief from acute or chronic pain. As policymakers, medical professionals, and families weigh how to handle the ongoing epidemic and in order to better understand how long-term users came to use these drugs and their experiences while taking them, The Washington Post and the Kaiser Family Foundation conducted a survey of adults who they themselves, or a household member, have taken strong prescription painkillers for a period of two months or more at some time in the past two years, other than to treat pain from cancer or terminal illness. A time period of two months or more was selected to focus on those whose use may be at odds with current government guidelines around prescription painkiller use. We estimate that about 7 percent of adults in the U.S. fall into this category (5 percent), or have a household member who does (2 percent). What follows is a close look at their views and experiences with these painkillers, and how they view ongoing efforts to quell the epidemic.

Report: Section 1: Views And Experiences Of Long-term Users Of Prescription Painkillers

Why Did They Start Taking Strong Prescription Painkillers?

The vast majority of those taking strong prescription painkillers for two months or more report starting them with a prescription from a doctor (97 percent). More than four in ten of long-term users say they started taking them for chronic pain (44 percent), while 25 percent say they started due to pain after a surgery and another 25 percent say they started for pain after an accident or injury. Very few say they initially got the painkillers some way other than a doctor (3 percent) or that they started for recreational use (3 percent).

Many have been taking the painkillers for quite some time. Half (52 percent) of those personally using prescription painkillers say they have taken them for two years or more, but there are big differences depending on if they are still taking them or not. Most of those who say they no longer take them say they took them for 6 months or less (48 percent) and that they started them for pain after surgery (34 percent) or an accident or injury (27 percent). Seven in ten of those currently taking them have been on them for two years or more, and most started taking them for chronic pain (55 percent).

Table 1: Length of Use and Reason for Starting Varies by Current Usage
AMONG THOSE PERSONALLY USING PRESCRIPTION PAINKILLLERS LONG-TERM:TotalCurrently taking prescription painkillers (55%)No longer taking prescription painkillers (45%)
How long (have you been taking/did you take) these painkillers?
         6 months or less28%12%48%
         More than 6 months but less than 1 year7410
         At least 1 year but less than 2 years131412
         2 years or more527030
Which of the following comes closest to the reason you began taking painkillers?
         Pain after surgery25%18%34%
         Pain after an accident or injury252327
         Chronic pain445532
         Recreational use324
NOTE: Started for some other reason (vol.) and Don’t know/Refused responses not shown.

Those no longer personally taking them point to a number of different reasons why they stopped, including that they no longer needed them for pain (60 percent of those not currently taking them), they were worried about becoming addicted (50 percent), they didn’t like the side effects (45 percent), and their prescription ended (34 percent).

Reasons for Taking Prescription Painkillers

While about nine in ten long-term prescription painkiller users report that relieving physical pain is a ‘major reason’ why they take the painkillers, some report taking the painkillers for other reasons as well. One in five say a major reason they take them is “for fun or to get high,” followed by 14 percent who say “to deal with day-to-day stress” and 10 percent who say “to relax or relieve tension.”
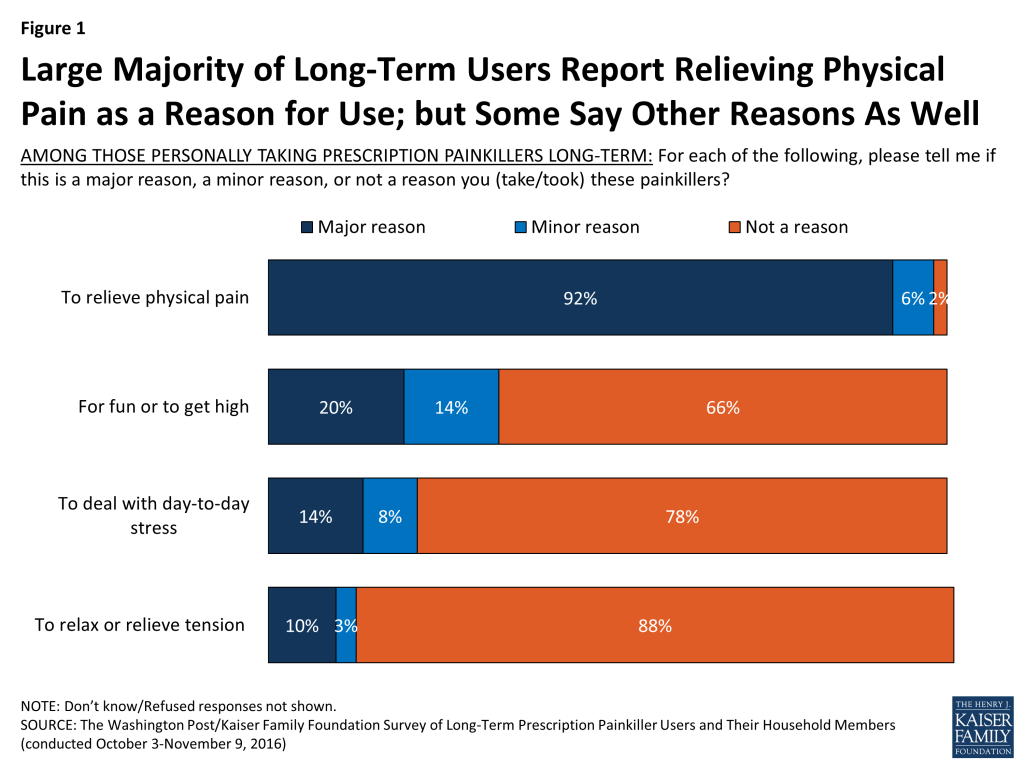
Figure 1: Large Majority of Long-Term Users Report Relieving Physical Pain as a Reason for Use; but Some Say Other Reasons As Well

Many Users Report a Disability and Multiple Prescriptions

Many personally taking prescription painkillers report being sick and disabled, such as saying they have a debilitating disability or chronic disease (70 percent) or that their physical health is only fair or poor (42 percent). More than half (57 percent) also say they take four or more prescription drugs, including 32 percent who report taking seven or more. These shares are significantly larger than for the general public. For example, 19 percent of the public reports having a chronic disease or disability4  and 18 percent say they are in fair or poor health.5 
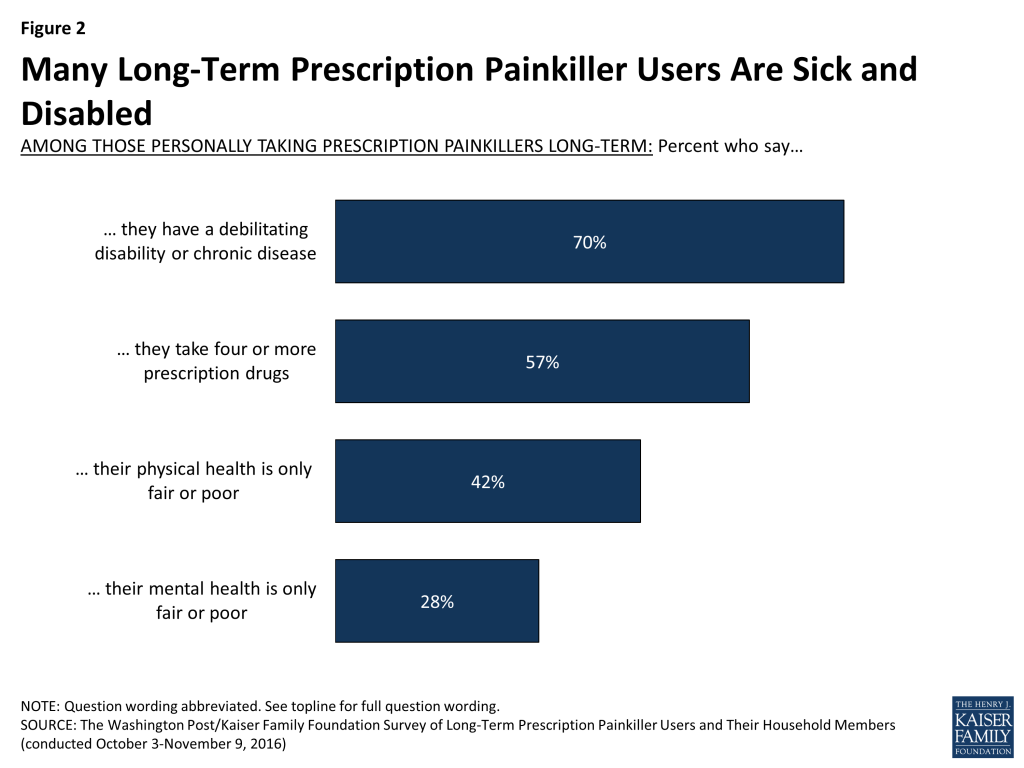
Figure 2: Many Long-Term Prescription Painkiller Users Are Sick and Disabled

Compared to the general public, long-term users skew middle aged (59 percent between 40-64 versus 43 percent). Relatively few long-term users report working full-time (23 percent) or part time (8 percent) with more long-term users saying they are on disability (33 percent) or retired (20 percent). In comparison, six in ten of the general public report being employed, 18 percent say they’re retired, and 7 percent say they are on disability and can’t work.6 

Interactions with Doctors

Most personally taking prescription painkillers long-term report that when their doctor first prescribed these medications, their doctor talked to them about:

  • avoiding alcohol or certain medications while taking painkillers (78 percent);
  • possible side effects associated with these painkillers (70 percent);
  • keeping the medications in a safe place so they’re not misused by others (68 percent);
  • the possibility of addiction or dependence (65 percent); and
  • other ways to manage pain besides these painkillers (62 percent).

On the other hand, 61 percent say there was no discussion about a plan for getting off the painkillers when the doctor first prescribed them, while a third (33 percent) say there was.
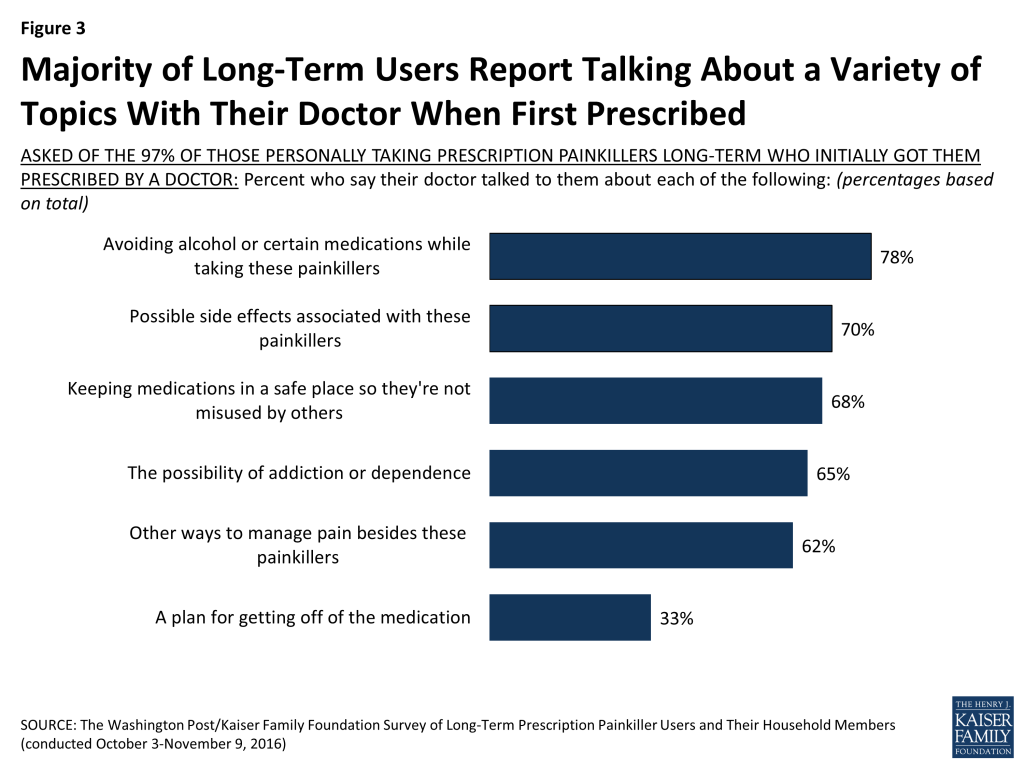
Figure 3: Majority of Long-Term Users Report Talking About a Variety of Topics With Their Doctor When First Prescribed

In addition, 75 percent of long-term prescription painkiller users say they think their doctor provided enough information on the risk of addiction and other side effects associated with prescription painkillers. Still, one in five (19 percent) say their doctor did not provide enough information. For the most part, long-term users say that their doctor has not changed their dose (56 percent) or how often they take them (71 percent) since they started taking them. However, about two in ten (21 percent) say a doctor has increased their dose, and one in ten (10 percent) say their doctor has told them to take them more frequently.

Impact on Life

Overall, long-term users report mostly positive effects of using painkillers. Virtually all long-term users (92 percent) say the painkillers have reduced their pain at least somewhat well. And, a majority of long-term prescription painkiller users (57 percent) say their use of the medications has made their quality of life better, particularly those who say they started the painkillers for chronic pain (69 percent), but one in six (16 percent) say it has made it worse.

In terms of the impact their use of the painkillers has had on certain aspects of their lives, most long-term users report that their use of the drugs has had no impact on their finances (74 percent) however more say the impact has been negative than say positive (17 percent versus 8 percent). But when it comes to their impact on their physical health or their ability to do their job, more say the impact has been positive than say negative (42 percent vs. 20 percent and 23 percent vs. 14 percent, respectively). Most say there has been no impact on their mental health or personal relationships, but for those that do, similar shares say the impact has been positive as say negative.
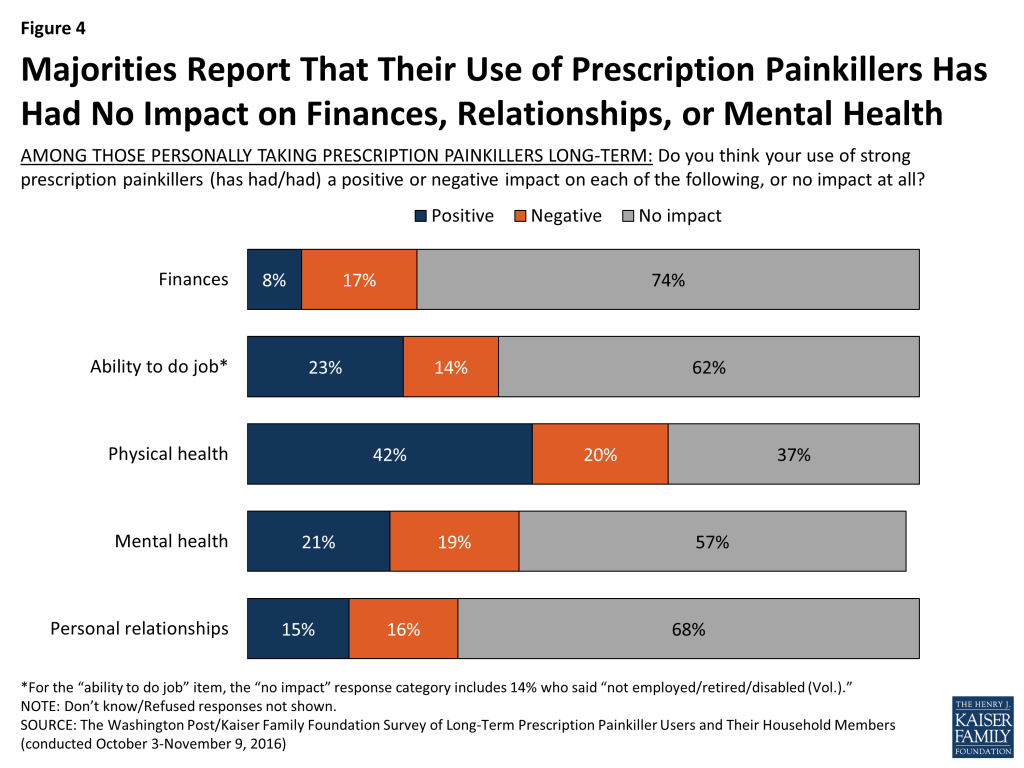
Figure 4: Majorities Report That Their Use of Prescription Painkillers Has Had No Impact on Finances, Relationships, or Mental Health

Reports of Addiction, Dependence and Misuse

In addition to some reporting negative impacts on their lives, 34 percent report that they think they are or were physically dependent or addicted to the painkillers (this group is profiled in Section 2). Few (9 percent) say they have sought treatment for addiction and 2 percent say they have considered seeking addiction treatment. Additionally, a quarter (26 percent) say that a friend or family member has suggested they stop taking them.

There are also a number of indications of misuse among long-term users, including 17 percent who say they have taken prescription painkillers that were not prescribed specifically for them since starting on painkillers and 14 percent who say they have given their painkillers to a family member or friend. In addition, 20 percent say they have known or suspected someone was using, taking, or selling their painkillers, rising to nearly three in ten (28 percent) of long-term users in rural areas, compared to 10 percent of those in urban areas.

Figure 5: One in Three Long-Term Prescription Painkiller Users Think They Are Addicted or Dependent; Some also Report Misuse

Risky Use

Many are taking other drugs that could put them more at risk for an overdose or other complications. About half (52 percent) of long-term users say that while taking their prescription painkillers they were taking other prescription medications for anxiety, depression, or sleep problems. And, 18 percent say that while taking their prescription painkillers they have consumed alcohol.

Perceptions of Risk

Two-thirds (68 percent) of those personally using prescription painkillers long-term say that the benefits of pain relief outweigh the risk of addiction. However, nearly half (46 percent) acknowledge that using them makes a person more likely to use heroin or other illegal drugs and 40 percent say prescription painkillers are as addictive as heroin.

Compared to those personally using strong painkillers, the general public is more split on the risks and benefits of using prescription painkillers for more than a week, and are more likely than those personally using to say prescription painkiller use makes a person more likely to use heroin or other illegal drugs or that prescription painkillers and heroin are equally addictive.

Table 2: Long-Term Users’  and General Public’s Perceptions of Prescription Painkiller Risk
Personally taking prescription painkillers long-termU.S. Adults
Which comes closer to your view on using prescription painkillers for more than a week to treat pain?
          The risk of addiction outweighs the benefits of pain relief25%47%
          The benefits of pain relief outweigh the risk of addiction6844
          Don’t know/Refused69
Do you think prescription painkiller abuse makes a person more likely or less likely to use heroin or other illegal drugs, or do you think it doesn’t make much of a difference?
          More likely46%58%
          Less likely42
          Doesn’t make much of a difference4336
          Don’t know/Refused74
Which do you think is more addictive, prescription painkillers or heroin, or do you think they are about equally addictive?
          Prescription painkillers3%6%
          Heroin4529
          Equally addictive4060
          Don’t know/Refused126
SOURCE: National comparison of U.S. adults from Kaiser Health Tracking Poll (conducted November 15-21, 2016)

Access to Prescription Painkillers: Users’ Troubles and Concerns

Reports of Problems Accessing Painkillers

Some of those personally using prescription painkillers long-term report trouble accessing them, including trouble affording them (18 percent), getting a pharmacy to fill a prescription (16 percent), getting refill from doctors (16 percent), and getting insurance to cover it (12 percent). Overall, 41 percent of long-term users report at least one of these issues. With the recent attention prescription painkillers have received in light of the epidemic of abuse and overdose, two-thirds (67 percent) of long-term users say they are concerned that efforts to decrease the number of people abusing prescription painkillers will make it more difficult for them to access them; a share that increases to nearly eight in ten (78 percent) of those who started to treat chronic pain, including 56 percent who say they are very concerned.

Six in ten (60 percent) long-term users say it is easy for people to get painkillers that were not prescribed to them, while a similar share (59 percent) say it is difficult for people who need the drugs for medical purposes to get them. Majorities of the general public say it is easy to get drugs in both scenarios, although a larger share say it’s easy for people to get drugs not prescribed to them than say the same about those who need them for medical purposes.

Table 3: Perceptions of Prescription Painkiller Accessibility Among Long-Term Users and the General Public
How easy or difficult do you think it is for people…Personally taking prescription painkillers long-termU.S. Adults
… to get access to prescription painkillers that were NOT prescribed to them?
Easy (NET)60%71%
          Very easy3637
          Somewhat easy2433
Difficult (NET)2727
          Somewhat difficult1417
          Very difficult1410
Don’t know/Refused133
… who need prescription painkillers for medical purposes to get access to them?
Easy (NET)36%62%
          Very easy1628
          Somewhat easy2034
Difficult (NET)5935
          Somewhat difficult3024
          Very difficult2912
Don’t know/Refused53
SOURCE: National comparison of U.S. adults from Kaiser Health Tracking Poll (conducted November 15-21, 2016)

Side Effects

Prescription painkillers are known for causing certain side effects, and among long-term users, reports of side effects are quite common. Seven in ten (72 percent) of those personally using prescription painkillers report experiencing at least one of the following side effects: constipation (55 percent), indigestion, dry mouth, or nausea (50 percent) or breathing problems (15 percent). While many have experienced side effects, half (50 percent) say they have not taken medications specifically to treat side effects. However, one in five (21 percent) say they have.

Half (49 percent) of those personally using painkillers say they are at least somewhat concerned about side effects, including one in four (27 percent) who say they are very concerned, and nearly half of those who no longer take the painkillers say that the side effects are at least a minor reason they stopped (45 percent, or 20 percent of long-term users overall). Still, large majorities say their doctor discussed possible side effects when they initially prescribed the painkillers (70 percent) and feel their doctor provided enough information about the risk of addiction and other side effects (75 percent).

Views and Experiences from Household Members of Prescription Painkiller Users

Interviews with people living in the same household as a long-term prescription painkiller user provide another angle of insight into this group. For most, the user is a spouse (43 percent), followed by a parent (25 percent), a child (9 percent), or some other person in their household (21 percent).

Household Members Report Negative Impacts, Concerned About Addiction

In general, household members are more likely to report issues with addiction or dependence and negative experiences than those who are personally taking the painkillers. For example, 54 percent of household members say they think the person is or was addicted or dependent and 43 percent report that a friend or family member has suggested the user stop.
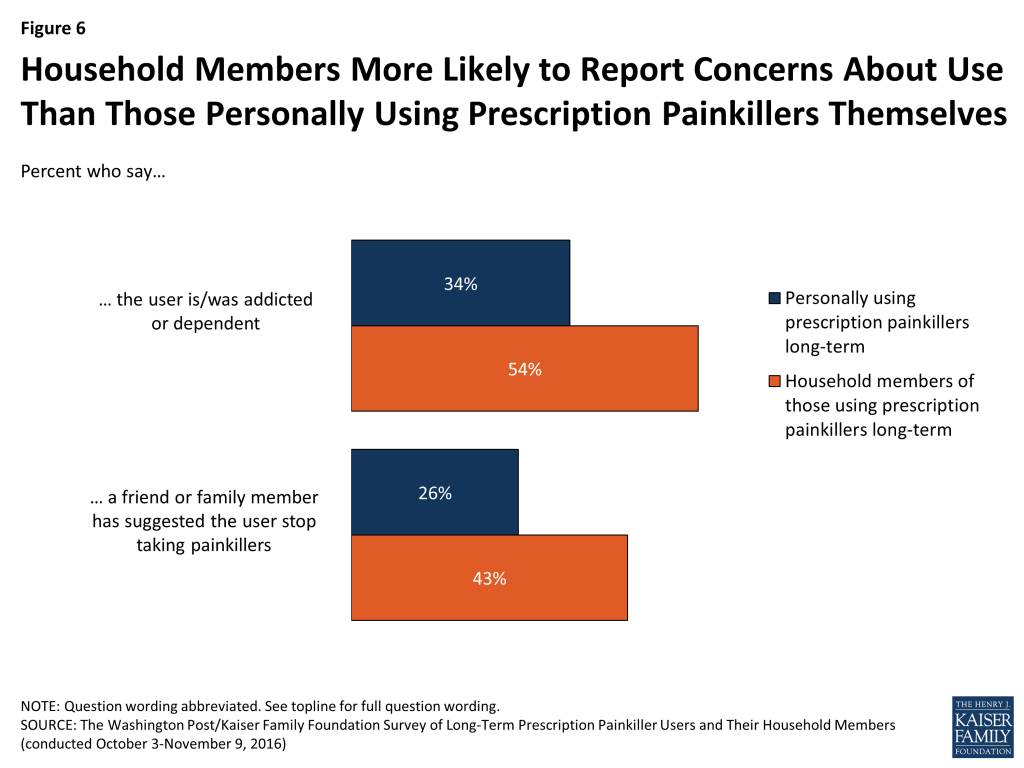
Figure 6: Household Members More Likely to Report Concerns About Use Than Those Personally Using Prescription Painkillers Themselves

In addition, household members are roughly twice as likely as those personally using prescription painkillers to say the drugs have had a negative impact on the user’s finances (37 percent versus 17 percent), the user’s personal relationships (34 percent versus 16 percent), the user’s physical health (39 percent versus 20 percent), the user’s mental health (39 percent versus 19 percent), and the user’s ability to do their job (27 percent versus 14 percent).

Report: Section 2: A Focus On Those Reporting They Are Physically Dependent Or Addicted

Of those personally using prescription painkillers, about a third (34 percent) say they think they are or were addicted or physically dependent on them,7  which accounts for about 2 percent of adults in the U.S. This section examines their views and experiences more closely. Like long-term prescription painkiller users generally, many who say they are or were addicted or dependent say they started for chronic pain (47 percent), a quarter (25 percent) say they started for pain after a surgery, and 19 percent say they started after an injury or accident. Six percent say they started using recreationally.

Nearly all (95 percent) of those saying they’re addicted or dependent say that relieving physical pain is a reason they’re taking the drugs. However, they are much more likely than others to say they’re taking them for other reasons as well, such as for fun or to get high (47 percent versus 27 percent), to deal with day-to-day stress (38 percent versus 14 percent), or to relax or relieve tension (30 percent versus 3 percent).

Figure 7: Long-Term Users Who Say They Are Addicted or Dependent Are More Likely to Report Taking Painkillers for Other Reasons

Not surprisingly, those who say they are or were dependent or addicted also are more likely than others to report being concerned about addiction (49 percent versus 25 percent) and to report misuse, such as taking painkillers not prescribed to them (30 percent versus 10 percent) or giving them to a family member or friend (21 percent versus 11 percent). They are also more likely than others to say they know or suspect someone has taken their pills (28 percent versus 15 percent) and to report that a family or friend has suggested they stop taking the medication (40 percent versus 18 percent).

About a quarter (24 percent) of those who report being addicted or dependent say they think their quality of life is worse after taking these medications, compared to 12 percent of those who do not say they are addicted or dependent. They’re also more likely than those not reporting addiction or dependence to say it’s had a negative impact on their finances, their personal relationships, their employment, their physical health, and their mental health.
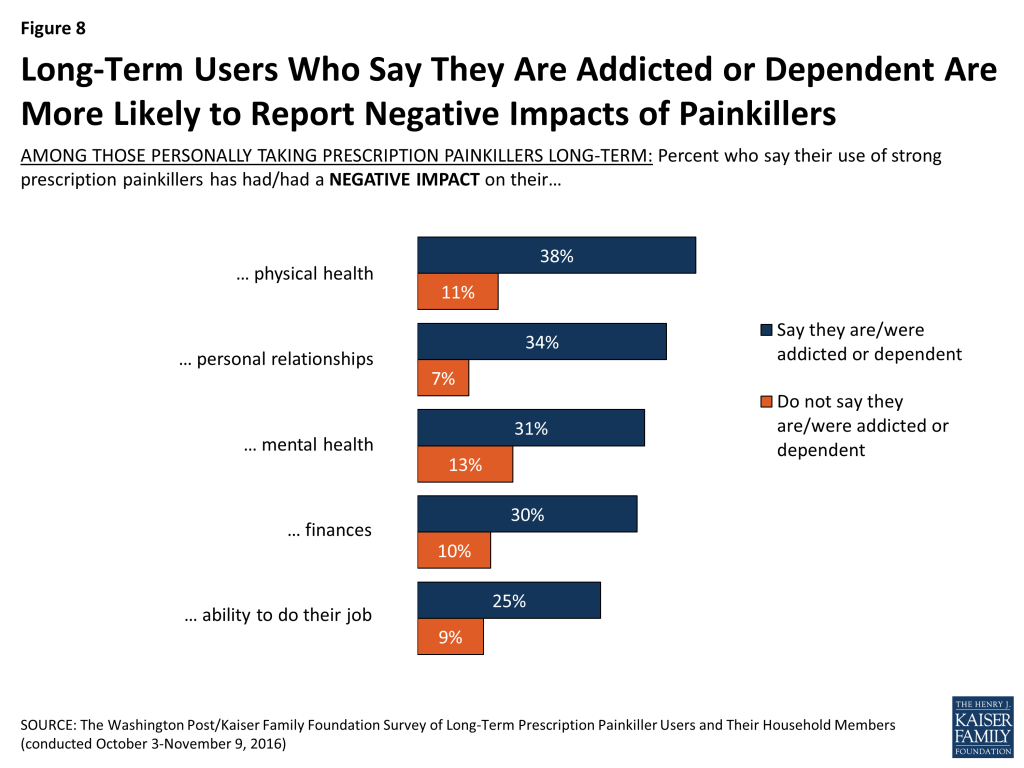
Figure 8: Long-Term Users Who Say They Are Addicted or Dependent Are More Likely to Report Negative Impacts of Painkillers

Among those who say they are or were addicted or dependent, three in ten (31 percent) feel their doctor did not provide enough information about the risk of addiction and other side effects, but they are similar to others in terms of reporting that their doctor talked to them about the possibility of addiction or dependence or a plan to get off medications. They’re more likely than others to say they have had trouble with at least one of the following: getting a prescription written or filled, affording the drugs, or getting insurance to pay for them (58 percent versus 33 percent). Eight percent say they have a prescription for Narcan or Naloxone at home, a drug that can reverse the effects of prescription painkillers and prevent overdose.

Controlling for factors such as income and region, younger adults (18-39), Hispanics, and those who report taking the painkillers for two or more years are more likely than their counterparts to report being addicted or dependent on the drugs.


Report: Section 3: Views Of Prescription Painkiller Epidemic

Prescription Painkiller Abuse Is One of Many Serious Health Issues

For those personally using prescription painkillers long-term, the abuse of painkillers ranks last on a list of health issues facing the country today. Those personally using in the South (73 percent) are more likely to say opioid abuse is a very serious problem than those in the Midwest (60 percent) or West (41 percent).

Table 4: Abuse of Prescription Painkillers Ranks Low Among Several Health Issues, But Majorities Say Abuse Is a Very Serious Problem
Percent who say each health issue is a VERY SERIOUS problem in this country:Personally taking prescriptionpainkillers long-termU.S. Adults
Cancer87%82%
Heart Disease7570
Heroin Abuse7472
Diabetes7468
Alcohol Abuse6752
Obesity6463
Abuse of Strong Prescription Painkillers6266
NOTE: Some items asked of half samples. Question wording abbreviated. See topline for full question wording.SOURCE: National comparison of U.S. adults from Kaiser Health Tracking Poll (conducted November 15-21, 2016)

Who’s To Blame For Epidemic?

Majorities of people personally using prescription painkillers as well as people in their household say that people who use painkillers and doctors who prescribe them deserve at least some of the blame for the ongoing epidemic. In addition, two-thirds (65 percent) of opioid users’ household members say they blame drug companies and half (49 percent) say they blame the government. Ranking lower on the list for both groups are law enforcement and pharmacies and pharmacists.

Table 5: Views of Long-Term Users, Their Household Members, and the General Public onWho Is to Blame for the Prescription Painkiller Addiction Epidemic
Percent who say each of the following deserve A LOT or SOME blame for the prescription painkiller addiction epidemic:Personally taking prescription painkillers long-termHousehold members of those using prescription painkillers long-termU.S. Adults
People who use painkillers61%65%68%
Doctors who prescribe painkillers546669
Drug companies476560
The government404944
Hospitals274443
Law enforcement171428
Pharmacies and pharmacists151928
NOTE: Some items asked of half samples of the general public.SOURCE: National comparison of U.S. adults from Kaiser Health Tracking Poll (conducted November 15-21, 2016)

Effective Strategies for Combatting the Epidemic

When asked what would be effective in reducing the abuse of prescription painkillers, eight in ten of those personally taking opioids say increasing pain management training for medical students and doctors (82 percent), increasing research about pain and pain management (81 percent), and increasing access to addiction treatment programs (80 percent). Large majorities also say encouraging people who were prescribed painkillers to dispose of any extras once they no longer medically needed them (73 percent), public education and awareness programs (72 percent), and monitoring doctors’ prescribing habits (69 percent) would be effective. Roughly half say reducing the social stigma around addiction (54 percent), putting warning labels about addiction on drug bottles (50 percent), and government limits on the amount of drugs that can be produced (47 percent). These responses are generally similar to what the public feels would be effective. The general public is somewhat more likely than those personally using to say the following would be effective: public education and awareness programs (86 percent vs. 72 percent), monitoring doctors’ prescription painkiller prescribing habits (83 percent vs. 69 percent), and increasing pain management training for medical students and doctors (89 percent vs. 82 percent).

Methodology

The Washington Post/Kaiser Family Foundation Survey Project is a partnership combining survey research and reporting to better inform the public. The Post-Kaiser Survey of Long-Term Prescription Painkiller Users and Their Household Members, the 30th in this series was conducted by telephone October 3 – November 9, 2016, among a representative random national sample of 809 adults age 18 and over who they themselves, or a household member, have taken strong prescription painkillers for a period of two months or more8  at some time in the past two years, other than to treat pain from cancer or terminal illness. Interviews were administered in English and Spanish, combining random samples of both landline (n=266) and cellular telephones (n=543).

Sampling, data collection, weighting and tabulation were managed by SSRS in close collaboration with The Washington Post and Kaiser Family Foundation researchers.

The SSRS Omnibus survey (detailed below) estimates that about seven percent of adults in the U.S. have either themselves used strong prescription painkillers in the past two years for two months or more, other than to treat pain from cancer or terminal illness (five percent), or have a household member that has (two percent). Due to the low-incidence of this study population, the sampling was designed to increase efficiency in reaching this group by using the following sample sources:

  1. Cell and Landline Phone Random Digit Dialing (RDD) (n=354): The dual frame landline and cellular phone sample was generated by Marketing Systems Group (MSG) using RDD procedures. Interviewers calling landline phone numbers asked to speak with an adult currently at home on a random rotation. Interviews calling cellular phones interviewed the person answering the phone after verifying eligibility.
  2. Respondents Previously Completing Interviews on the SSRS Omnibus Survey (n=455). Weekly, RDD landline and cellular phone surveys of the general public were used to identify eligible respondents. Individuals who had previously indicated on the SSRS omnibus survey that they fit the eligibility criteria for this study were re-contacted.

Regardless of the sample source, all respondents were screened to verify that they have taken a strong prescription painkiller for a period of two months or more in the past two years or have a household member who has, other than to treat pain from cancer or terminal illness. If a respondent indicated that both themselves and a household member qualified, they completed the questionnaire about their own personal use. The screening questions are identified at the beginning of this document as S3 through S5.

A multi-stage weighting design was applied to ensure an accurate representation of the population of long-term strong prescription drug users and their household members. The first stage of weighting involved corrections for sample design, including accounting for non-response for the re-contact sample. In the second weighting stage, demographic adjustments were applied to account for systematic non-response along known population parameters. No reliable administrative data were available for creating demographic weighting parameters for this group. Therefore, demographic benchmarks were derived by compiling a sample of all respondents interviewed on the SSRS Omnibus survey between August 18, 2016 and November 9, 2016 (N=15,944) and weighting this sample to match the national adult population based on the 2016 U.S. Census Current Population Survey March Supplement parameters for age, gender, education, race/ethnicity, region, phone status, and population density. This sample was then filtered to include respondents qualifying for the current survey (N=1,122), and the weighted demographics of this group were used as post-stratification weighting parameters for the total sample (including age by gender, education, race/ethnicity, region, population density, self or household member prescription painkiller user, and phone status).

All sampling error margins and tests of statistical significance have been adjusted to account for the survey’s design effect, which is 1.6 for this survey. The design effect is a factor representing the survey’s deviation from a simple random sample, and takes into account decreases in precision due to sample design and weighting procedures. Sample sizes and margin of sampling errors for key groups are shown below; other subgroups are available by request. Note that sampling error is only one of many potential sources of error in this or any other public opinion poll.

Table 6: Sample Size and Margin of Sampling Error
GroupN (unweighted)Margin of sampling error (percentage points)
Total809±4
Interview type
Personal user622±5
Household interview187±9
Among personal users
Report being addicted or dependent200±9
Do not report being addicted or dependent422±6

This questionnaire was administered with the exact questions in the exact order as appears in this document. If a question was asked of a reduced base of the sample, a parenthetical preceding the question identifies the group asked. Current users were asked the questions in the present tense, indicated where applicable in the first part of the parenthetical text within the question. Past users were asked the questions in the past tense and read the language in the second half of the parentheses. In addition, those personally using were asked the questions directly about their use, whereas household members were asked about the user in most cases, as indicated in the questions.

Since some of the questions could be sensitive and due to the nature of the survey content, interviewers were given specific instructions on how to cope with respondents who seemed agitated or distressed by the questions, including offering resources to which respondents could turn for support.

The Washington Post and the Kaiser Family Foundation each contributed financing for the survey, and representatives of each organization worked together to develop the survey questionnaire and analyze the results. Each organization bears the sole responsibility for the work that appears under its name. The project team from the Kaiser Family Foundation included: Mollyann Brodie, Ph.D., Bianca DiJulio, and Bryan Wu. The project team from The Washington Post included: Scott Clement and Emily Guskin. Both The Washington Post and the Kaiser Family Foundation public opinion and survey research are charter members of the Transparency Initiative of the American Association for Public Opinion Research.


Endnotes

  1. A time period of two months or more was selected to focus on those whose use may be at odds with current government guidelines around prescription painkiller use. ↩︎
  2. Frieden, T. and Houry, D. “Reducing the Risks of Relief – The CDC Opioid-Prescribing Guideline,” The New England Journal of Medicine, April, 2016, http://www.nejm.org/doi/full/10.1056/NEJMp1515917. ↩︎
  3. Dowell, D., Haegerich, T., and Chou, R. “CDC Guideline for Prescribing Opioids for Chronic Pain- United States, 2016,” JAMA, April, 2016, available at http://jamanetwork.com/journals/jama/fullarticle/2503508. ↩︎
  4. Kaiser Family Foundation, Kaiser Health Tracking Poll, August 2016, https://modern.kff.org/global-health-policy/poll-finding/kaiser-health-tracking-poll-august-2016/ ↩︎
  5. Kaiser Family Foundation, Kaiser Health Tracking Poll, November 2016, https://modern.kff.org/global-health-policy/poll-finding/kaiser-health-tracking-poll-november-2016/ ↩︎
  6. Kaiser Family Foundation, Kaiser Health Tracking Poll, November 2016, https://modern.kff.org/global-health-policy/poll-finding/kaiser-health-tracking-poll-november-2016/ ↩︎
  7. We use a combined measure of those who say they are or were addicted OR physically dependent on prescription painkillers. We chose to use this combined measure given people’s potential for misunderstanding ‘dependence’ or their potential unwillingness to say they’re addicted due to social desirability reasons. The 34 percent who say they are addicted or dependent is comprised of 21 percent who say they are both addicted and dependent, 11 percent who say they’re only dependent, and 2 percent who say they’re only addicted. Overall, responses are similar for those saying they’re addicted and those saying they’re dependent. ↩︎
  8. A time period of two months or more was selected to focus on those whose use may be at odds with current government guidelines around prescription painkiller use. ↩︎

Improving the Affordability of Coverage through the Basic Health Program in Minnesota and New York

Authors: Jennifer Tolbert, Larisa Antonisse, and Stan Dorn
Published: Dec 8, 2016

Executive Summary

To date, Minnesota and New York are the only states to have adopted a Basic Health Program (BHP), an option in the Affordable Care Act (ACA) that permits state-administered coverage in lieu of marketplace coverage for those with incomes below 200% of the federal poverty level (FPL) who would otherwise qualify for marketplace subsidies. BHP covers adults with incomes between 138-200% of FPL and lawfully present non-citizens with incomes below 138% FPL whose immigration status makes them ineligible for Medicaid. States implementing BHP receive 95% of what the federal government would have spent on subsidies if BHP enrollees had received marketplace coverage. Both states covered much of the BHP-eligible population prior to the ACA, which facilitated their adoption of BHP. Minnesota, in particular, adopted BHP to retain this prior coverage while saving state dollars. Based on semi-structured interviews with key stakeholders and policymakers in each state as well as reviews of policy documents and reports, this brief examines implementation of the BHP as of Summer 2016. It assesses the impact of BHP on consumers, the marketplaces, and state costs and financing. Although the 2016 election results create uncertainty around the future of the ACA (including BHP), BHP implementation provides important lessons about structuring coverage programs for low-income uninsured consumers for consideration in future reforms. Key findings include the following.

BHP programs in both Minnesota and New York provide coverage with lower premiums and cost-sharing compared to subsidized marketplace coverage. In New York, BHP enrollees with incomes at or below 150% FPL do not pay premiums while those with incomes between 150 and 200% FPL pay $20 per month. Sliding-scale premiums in Minnesota are higher than in New York but lower than for subsidized marketplace plans. According to stakeholders, an important feature of both programs is the absence of deductibles. Copayments are also generally lower than for QHPs. Both programs cover services in addition to essential health benefits for all or some BHP enrollees.

More affordable coverage led to increased enrollment in New York. When New York adopted the BHP in 2016, enrollment rose by 42% among those whose eligibility shifted from federally-subsidized QHPs to BHP. Enrollment increased by only 4% among subsidy-eligible adults unaffected by BHP implementation. Officials and stakeholders attributed the enrollment growth to BHP’s lower premiums and out-of-pocket cost-sharing compared to subsidized QHP coverage. Minnesota officials and stakeholders reached similar conclusions about the impact of affordability on enrollment. In both states, new enrollees attracted by more affordable coverage were described as relatively young and healthy. According to stakeholders, consumers also reported preferring the greater simplicity and predictability of BHP, compared to the marketplace.

BHP did not appear to affect marketplaces’ stability. New York officials reported that BHP implementation did not affect marketplace stability or carrier interest. Minnesota officials felt that the instability experienced in the state’s marketplace resulted from factors other than BHP; however, carriers suggested that BHP may have contributed by shrinking the marketplace’s size.

Most BHP insurers also participated in Medicaid and/or the marketplace. Minnesota conducted a joint procurement for Medicaid and BHP; carriers wishing to participate in one program had to join both, and many offered QHPs as well. In New York, 11 of 13 BHP plans participated in all three programs. This overlap helped consumers retain continuous coverage arrangements when income changes moved them between programs.

BHP enrollees whose incomes rose above 200% FPL experienced steep cost increases when they moved to QHPs. BHP’s more affordable coverage for enrollees ended at 200% FPL, so costs increased for those whose income rose above 200% FPL. Minnesota is exploring ways to smooth this “cliff” by expanding BHP eligibility above 200% FPL. Advocates in New York have called for a similar discussion of policy options.

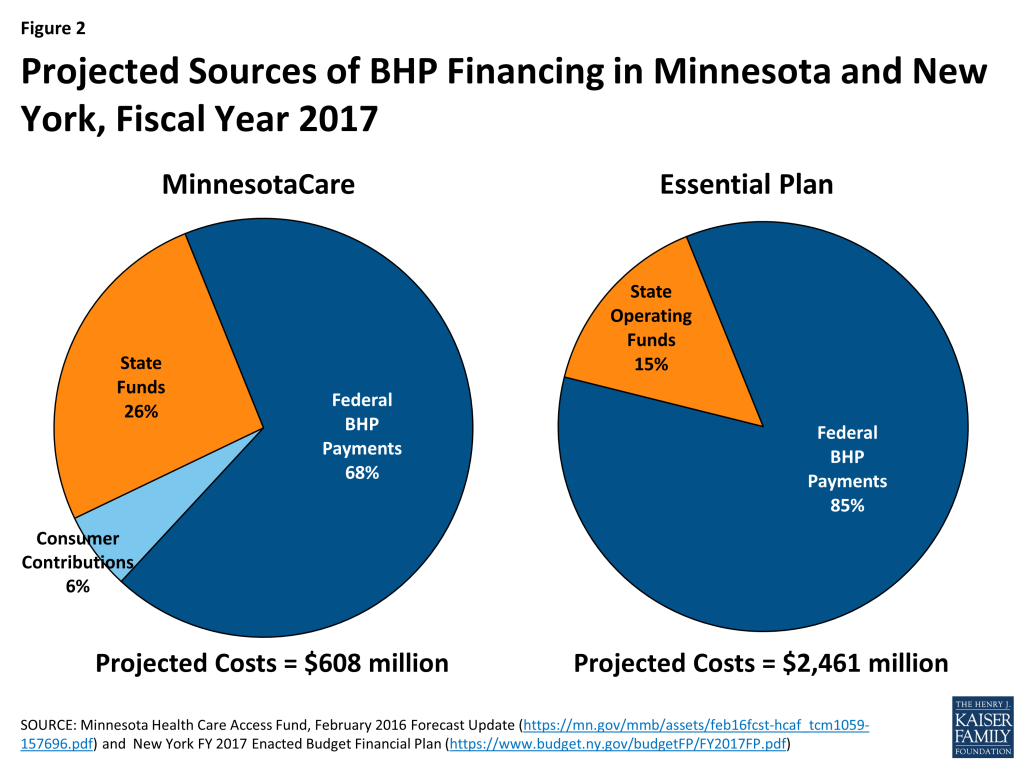
Both states experienced fiscal gains from BHP, but state financing was needed. Both states achieved administrative efficiencies by using existing state agencies to run BHP. Both states also realized significant net savings by using BHP to fund populations previously covered with state funds—lawfully present immigrants in New York, who had been receiving Medicaid funded entirely by the state; and the general BHP population in Minnesota, which previously covered them through a Medicaid waiver with standard federal matching rates. However, the federal BHP payments did not fully cover program costs in either state, requiring the states to finance a share of the costs. For fiscal year 2017, Minnesota expects to pay 26% of BHP costs while New York will fund 15%.

While the outcome of the 2016 election has created uncertainty around the future of the ACA, including BHP, the experiences of Minnesota and New York with BHP suggest broader lessons about coverage for low-income consumers. Chief among these lessons is the importance of affordability, both in terms of premiums and out-of-pocket costs. New York’s natural experiment shows with particular clarity that affordability improvements can yield significant enrollment gains and risk-pool improvements among the lowest-income consumers qualifying for marketplace subsidies. In addition, stakeholders reported that many consumers preferred the simplicity of state-administered coverage that offered consistency in premiums, cost-sharing, and benefits across participating plans over the complexity of marketplace plans. Encouraging a common set of plans and providers to participate across programs, including public programs and the private market, can promote continuity of coverage and care for consumers who move between programs when household circumstances change. Finally, relying on existing infrastructure to administer new coverage programs creates efficiencies and can help to avoid duplication.

Issue Brief

Introduction

The Basic Health Program (BHP) gives states the option of providing state-administered coverage in lieu of coverage through health insurance marketplaces to certain individuals with incomes at or below 200% of the federal poverty level (FPL). Soon after the enactment of the Affordable Care Act (ACA), the BHP was broadly viewed as giving states the flexibility to provide more affordable coverage to low-income consumers and providing consumers with incomes up to 200% FPL with access to the same set of health plans. Because federal BHP regulations were delayed, states could not implement BHP until 2015. To date, two states, Minnesota and New York, have adopted BHP.

To learn about these states’ experiences with BHP, in Spring and Summer 2016 the Kaiser Family Foundation and the Urban Institute conducted semi-structured phone interviews with policymakers and stakeholders in Minnesota and New York. Interviewees included Medicaid and marketplace officials, consumer advocates, in-person assisters, and representatives from health plans and community health centers (CHCs). We also reviewed state policy documents and reports. This work builds on previous analyses that described federal regulations for the BHP and provided a roadmap to states interested in implementing the BHP for estimating the number of BHP-eligible people and approximate federal BHP payments.

This brief reviews Minnesota’s and New York’s approaches to BHP and assesses BHP’s impact on consumers, marketplaces, and state costs. Although there is uncertainty around the future of the ACA (including BHP) following the 2016 election, BHP implementation offers important lessons for consideration in future reforms about structuring coverage programs for low-income uninsured consumers.

Background

Federal BHP Rules

States can adopt the BHP to cover consumers with incomes up to 200% FPL who would otherwise qualify for subsidies in the marketplace. BHP is available to two groups of such consumers: those with incomes between 138-200% FPL; and lawfully present non-citizens with incomes at or below 138% FPL whose immigration status disqualifies them from federally-funded Medicaid (often because of lawful residence for less than five years). Coverage through BHP must be as comprehensive and affordable as subsidized coverage in the marketplace, though states can provide coverage beyond the essential health benefits and lower consumer costs. States implementing BHP receive 95% of what the federal government would have spent to subsidize BHP enrollees had they received marketplace coverage. While the ACA authorized states to implement BHP beginning January 2014, delays in issuing BHP regulations prevented states from implementing the program until January 2015.

Prior State Coverage in Minnesota and New York

In New York and Minnesota, state health programs predating the ACA made BHP a particularly appealing option. Before the ACA, both Minnesota and New York had health programs, funded in whole or in part by state dollars, that served much of the BHP-eligible population. These programs furnished more affordable and, in some cases, more comprehensive coverage than what federally subsidized qualified health plans (QHPs) offer in health insurance marketplaces under the ACA. BHP let states maintain such pre-ACA coverage while achieving fiscal gains by replacing state dollars with federal BHP funds.

Minnesota’s pre-existing coverage program, MinnesotaCare (MNCare), was originally created in 1992 to provide working people with access to affordable health coverage.1  By 2011, the program served children, parents, and pregnant women up to 275% FPL and childless adults with incomes up to 250% FPL through a Medicaid Section 1115 waiver.2  Prior to 2015 the program was funded by a state tax on medical providers and health plans (covering 48% of costs in 2012), federal medical assistance matching dollars (44%), and sliding-scale premiums paid by enrollees (8%).3  Anticipating a switch to BHP, the state authorized changes to the program in 2013. These changes included limiting adult’s eligibility to 200% FPL and adding lawfully present non-citizens with incomes below 138% FPL as well as eliminating asset limits and a cap on covered hospital services.4  BHP implementation meant that, instead of standard federal matching funds, the state would receive 95% of the amount that BHP consumers would otherwise have received in marketplace subsidies, which was expected to yield significant state budget savings.

New York provided state-funded coverage to lawfully present immigrants ineligible for federal Medicaid. The 2001 New York Court of Appeals decision in Aliessa v. Novello required the state to provide Medicaid to otherwise eligible lawfully present immigrants for whom the state was denied federal Medicaid funds. Some had been lawful residents for less than five years, others were Permanently Residing Under Color of Law in categories outside those qualifying for federal Medicaid funding.5  New York covered this population with state-only dollars before it implemented BHP. Following the implementation of BHP, the federal government, through BHP payments, assumed much of the cost of covering this population.6  These savings were anticipated to provide significant state budget gains even as BHP offered coverage substantially more affordable than subsidized QHPs to adults with incomes between 138% and 200% FPL.

Overview of BHP in Minnesota and New York

Minnesota was the first state to adopt the BHP. Minnesota converted MNCare to BHP effective January 1, 2015. The primary effect was financial—the source of federal funding shifted from Medicaid to BHP. Consumers were able to remain in the same plans and received the same benefits and cost-sharing protections as before. Regardless of the health plan they choose, MNCare enrollees pay premiums and cost-sharing on the same sliding scale, beginning at 35% FPL, and all enrollees receive the same benefits.

New York provided BHP, termed “the Essential Plan (EP),” to immigrants starting in April 2015, adding adults between 138-200% FPL effective January 1, 2016. New York offers four EP products—known as EPs 1, 2, 3, and 4. EP 1 and 2 are for those with incomes 151%-200% FPL (EP 1) and 139%-150% FPL (EP 2). EP 3 and 4 serve immigrants between 100-138% FPL (EP 3) and under 100% FPL (EP 4).7  Benefits and cost-sharing vary across the four EP categories, though within each category all health plans offer the same coverage at the same cost to consumers. For immigrants, the 2015 move to EP involved financial accounting, without affecting consumers’ coverage. In 2016, benefits and cost-sharing remained largely unchanged, but immigrants were moved from Medicaid to EP plans. In some cases, immigrants needed to choose a new health plan. Adults with incomes 138%-200% FPL who were previously enrolled in QHPs transitioned into EP during the 2016 open enrollment period (OEP).

Table 1 describes key aspects of BHP in each state.

Table 1: Key BHP Features in Minnesota and New York
Minnesota (MinnesotaCare)New York (Essential Plan)
Overall Approach
Program Structure
  • Single product, regardless of income or immigration status
  • Premiums and cost sharing above 35% FPL, with exceptions
  • 4 products: EP 1 and 2 for 138-200% FPL; EP 3 and 4 for immigrants at or below 138% FPL
  • Benefits, premium, and cost-sharing requirements vary between EP programs, but within each program are the same for all health plans
Premiums, Cost-sharing, and Benefits
Premiums
  • Premiums on a sliding scale, 35-200% FPL: $4/month to $80/month
  • No premiums for those under age 21, American Indians and family members, military members completing a tour of active duty within last 24 months
  • No premiums at or below 150% FPL
  • $20/month premium for between 151% and 200% FPL
Cost-sharing
  • No deductible; (statutory $2.95 monthly deductible waived by all insurers)
  • Modest co-payments
  • No copays for those under age 21 and American Indians
  • No deductibles
  • Modest co-payments above 100% FPL
Benefits
  • Essential health benefits
  • Dental care, vision, and enhanced behavioral health services covered
  • EP 1 and 2: Essential health benefits covered
  • Enrollees in EP 1 and 2 can purchase dental and vision coverage at full cost
  • EP 3 and 4: Additional benefits approximate Medicaid coverage
Enrollment/Disenrollment
Enrollment Policy
  • Enrollment open year round
  • Enrollees must report changes in circumstance within 30 days
  • Enrollment open year round
  • Enrollees must report changes in circumstance
Grace Period
  • 30-day grace period; can avoid coverage gap by paying past-due and current premiums by the end of the grace month
  • 90-day lock-out period if enrollees fail to pay past-due and current premiums; after 90 days, can re-enroll without penalty
  • 30-day grace period; can avoid coverage gap by paying past-due and current premiums by the end of the grace month
Health Plan Contracting
Approach to contracting
  • Joint procurement with Medicaid
  • Marketplace issues Invitation to Participate to insurers; rates set by Medicaid agency (> Medicaid rates)
Health plan overlap
  • Plans must serve both Medicaid and MNCare
  • At least one Medicaid/MNCare plan in each county also participates in the marketplace
  • 1 of 13 plans offering EP coverage also participate in Medicaid and the marketplace
Provider networks
  • Provider networks broader in MNCare compared to QHPs
  • Generally, 85% overlap between EP and QHP provider networks.
  • In some areas, EP provider networks narrower than Medicaid
Program Administration
Administration
  • Administered by Medicaid agency; some responsibilities shared with marketplace
  • Program operations shared between Medicaid and the marketplace
Financing
Costs
  • Projected FY2017 costs: $608 million
  • Projected FY2017 costs: $2,461 million
Source of funding
  • Federal BHP payments: 68%; State funds: 26%; Consumer premiums: 6%
  • Federal BHP payments: 85%; State funds: 15%

Key Findings

Program Design

Premiums, Cost-Sharing, and Benefits

BHP programs in Minnesota and New York provide coverage without deductibles and with lower premiums than what consumers would pay for subsidized marketplace plans. In New York, EP premiums were set by the state legislature at $20 per individual for those with incomes above 150% FPL and at or below 200% FPL. Enrollees with incomes up to 150% FPL do not pay premiums.8  In contrast, enrollees in MNCare pay premiums on a sliding scale from 35% FPL to 200% FPL,9  except for specified exempt groups.10  In both states, BHP premium payments are less than what consumers would have paid for the second-lowest-cost silver plan in the marketplace (Table 2).11  BHP enrollees face no deductibles in either state. Although the Minnesota statute provides for a $2.95 monthly MNCare deductible, all BHP plans waive the deductible. Stakeholders noted that consumers greatly valued the absence of deductibles in both states’ BHP programs.

Table 2: 2016 Monthly Premiums for BHP and QHPs
IncomeMinnesotaCareEssential PlanQHP Benchmark Planwith Premium Tax Credits
35% FPL$4$0$7
140% FPL$25$0$48
151% FPL$37$20$61
200% FPL$80$20$126
SOURCE: Minnesota Department of Human Services, MinnesotaCare Premium Estimator Table, (Minnesota Department of Human Services, 2015); New York State of Health, Attachment F – BHP Product Offering and Cost-Sharing (New York State of Health, 2015); Kaiser Family Foundation, 2016 Health Insurance Marketplace Calculator (QHP premiums calculated based on US average premium for single-person household).NOTE: BHP is called “MinnesotaCare” and “Essential Plan” in Minnesota and New York, respectively. 

In New York, other BHP cost-sharing is also lower than for subsidized marketplace plans. EP plans 1 and 2 have actuarial values (AV) above 95% while EP plans 3 and 4 mirror cost-sharing in Medicaid. A plan’s AV is the percentage of the cost of covered services the plan is expected to pay on average for a typical group of enrollees. Thus, a higher AV plan will lower the share of costs borne by enrollees. Consumers with income at or below 250% FPL are eligible for cost-sharing reductions (CSR) in the marketplaces, which raise the AV of standard QHPs. However, BHP coverage in New York pays a higher proportion of out-of-pocket costs than QHPs with these CSRs. For consumers with incomes up to 150% FPL, QHPs with CSRs offer 94% AV, and for those with incomes between 151-200% FPL, QHPs with CSRs provide 87% AV. Stakeholders noted that when consumers with incomes between 138% and 200% FPL enrolled in New York QHPs, they were charged copayments above BHP levels for office visits, hospital utilization, and prescription drugs, and those with incomes between 150% and 200% FPL also faced $250 deductibles (Table 3). New York advocates pushed hard for low cost-sharing in BHP and were happy with the state’s decisions.

Table 3: For New York Consumers Between 138-200% FPL, Cost-Sharing in BHP vs. QHPs with CSRs
 138-150% FPL151-200% FPL
BHPQHP with CSRsBHPQHP with CSRs
Deductible (single)$0$0$0$250
Max out-of-pocket limit (single)$200$1,000$2,000$2,000
Copayments
PCP$0$10$15$15 (after deductible)
Specialist$0$20$25$35 (after deductible)
Inpatient hospital$0$100 per admission$150 per admission$250 per admission (after deductible)
ER Visit$0$50$75$75
Tier 1 drugs$1$6$6$9
Tier 2 drugs$3$15$15$20
Tier 3 drugs$3$30$30$40
SOURCE: 2017 Invitation for Participation in New York State of Health, Attachment F – BHP Product Offering and Cost-Sharing, NY State of Health, 2015.NOTE: New York refers to BHP as the “Essential Plan,” or EP. Cost-sharing and premiums vary between EP 1, which serves consumers between 151-200% FPL, and EP 2, which covers consumers at 138-150% FPL. QHPs with CSRs are from the 2015 New York marketplace.

Minnesota increased BHP premiums and cost-sharing in 2015, but the resulting amounts are still lower than what consumers would have faced in the marketplace. In 2015, the Minnesota legislature increased MNCare premiums for enrollees with incomes 150%-200% FPL. The amount of the increase was scaled to income, with a 28% rise for those with incomes between 150%-159% FPL increasing to a 60% boost for those with incomes at 200% FPL. However, as shown in Table 2, these amounts are still lower than the premiums consumers would have been charged in the marketplace for subsidized QHPs with benchmark premiums. The legislature also lowered the AV of MNCare plans from 98% to 94%, bringing cost-sharing in line with marketplace coverage for those with incomes at or below 150% FPL. The resulting cost-sharing remained under the amounts charged in the marketplace for those between 150% FPL and 200% FPL, who in non-BHP states are offered QHPs with 87% AV.12  Minnesota’s premium and cost-sharing increases went into effect in August 2015 and January 2016, respectively, and were expected to yield an estimated $27.8 million in additional revenue over 23 months.13 

Table 4: MinnesotaCare Premium and Cost-Sharing Changes
Cost-Sharing ChangesThrough Dec. 31, 2015Effective Jan. 1, 2016
Deductible$0$0
Nonpreventive office visits$3$15
Mental health visits$0$0
ER visits (does not apply if admitted)$3.50$50
Inpatient hospital admission$0$150
Prescription drugs (generic)$3$6
Prescription drugs (brand name)$3$20
Prescription drug OOP monthly maximumNone$60
SOURCES: Minnesota Department of Human Services, Bulletin: Legislative Changes to Medical Assistance and MinnesotaCare, Minnesota Department of Human Services, July 2015, http://www.dhs.state.mn.us/main/groups/publications/documents/pub/dhs16_195870.pdfRandall Chun. MinnesotaCare Information Brief, Research Department of the Minnesota House of Representatives, updated January 2016, http://www.house.leg.state.mn.us/hrd/pubs/mncare.pdfNOTE: Minnesota statute provides for $2.95 monthly deductibles in MNCare, but all plans waive those deductibles. BHP is called “MinnesotaCare” in Minnesota.  

For many BHP enrollees, benefits are broader than with QHPs. MNCare consumers receive, in addition to what QHPs offer, oral health services, vision services, and enhanced behavioral health coverage. In New York, EP 1 and 2 offer the same benefits as QHPs. EP 3 and 4 approximate Medicaid benefits by covering non-prescription drugs, orthotic devices, orthopedic footwear, adult vision care, adult dental care, and non-emergency transportation (administered by the Department of Health), in addition to QHP services.14  EP 1 and 2 do not cover adult vision and dental care as part of the standard benefit package; to obtain those benefits, consumers must pay the additional premium from insurers that offer coverage for such services.15 

Contracting with Health Plans

Most BHP insurers also participate in Medicaid and/or the marketplace. In both states, officials sought to have the same plans and provider networks available in Medicaid, BHP, and QHP. Such an overlap promotes continuity of care when consumers’ income changes and they move between programs. In Minnesota, the state conducted a joint procurement for Medicaid and BHP; plans wishing to join one program had to participate in both. In each county, consumers can choose between two or three Medicaid/MNCare plans, at least one of which also offers marketplace coverage.16  In New York, 13 insurers offer EP, 11 of which participate in all three programs.17  State officials reported that, in 2016, EP consumers have a choice of plans in all but two rural counties. For 2017, state officials indicated that all counties will have a choice of plans.

BHP health plan payments were based on Medicaid rates then adjusted for the BHP population. State officials in Minnesota reported that the capitation rates for Medicaid and MNCare were similar in 2016. However, the joint procurement for both programs included rebidding prior managed care contracts. By leveraging Medicaid participation, and because BHP enrollees proved healthier than the historical MNCare population, the state was able to negotiate MNCare capitation rates that were 15% lower than expected. In New York, the rates for EP 3 and 4 were set at the Medicaid rate, while rates for EP 1 and 2 were based on the Medicaid rates then adjusted to reflect differences between Medicaid and EP utilization patterns, covered benefits, and cost-sharing rules. These adjustments raised rates for EP 1 and 2 20% above Medicaid levels.

Provider Networks

In Minnesota, provider networks are broader in BHP than the marketplace; the picture is more varied in New York. According to state officials, despite lower provider payments in BHP than the marketplace, Minnesota’s BHP plans offered broader networks; BHP plans included all Medicaid providers, while QHPs used narrow networks to restrain premiums. The greater breadth of Medicaid/BHP networks over QHP networks was particularly significant with dental care, behavioral health care, and Mayo Clinic providers. In New York, the picture was more complex; some consumers who moved from QHPs to BHP lost access to previous providers. In most cases, New York insurers used their Medicaid provider networks for BHP; however, some insurers’ BHP networks were more limited than their Medicaid provider networks. A number of stakeholders saw this as a transitional effect that would likely diminish or disappear over time.

Having similar provider networks across the three coverage programs facilitated New York consumers’ transition to EP. Beginning in January 2016, consumers previously enrolled in QHPs were transitioned to new EP plans. State officials reported that consumers could automatically renew in “sister” EP plans, those that were offered by the same carrier and that had at least 85% of their providers participating in both plans. Consumers had the option to change insurers for the 2016 plan year, rather than auto-renew. Some consumers whose QHPs were not offered by an EP-participating carrier could not auto-enroll and had to affirmatively select an EP plan.

Impact on Consumers

BHP enrollment

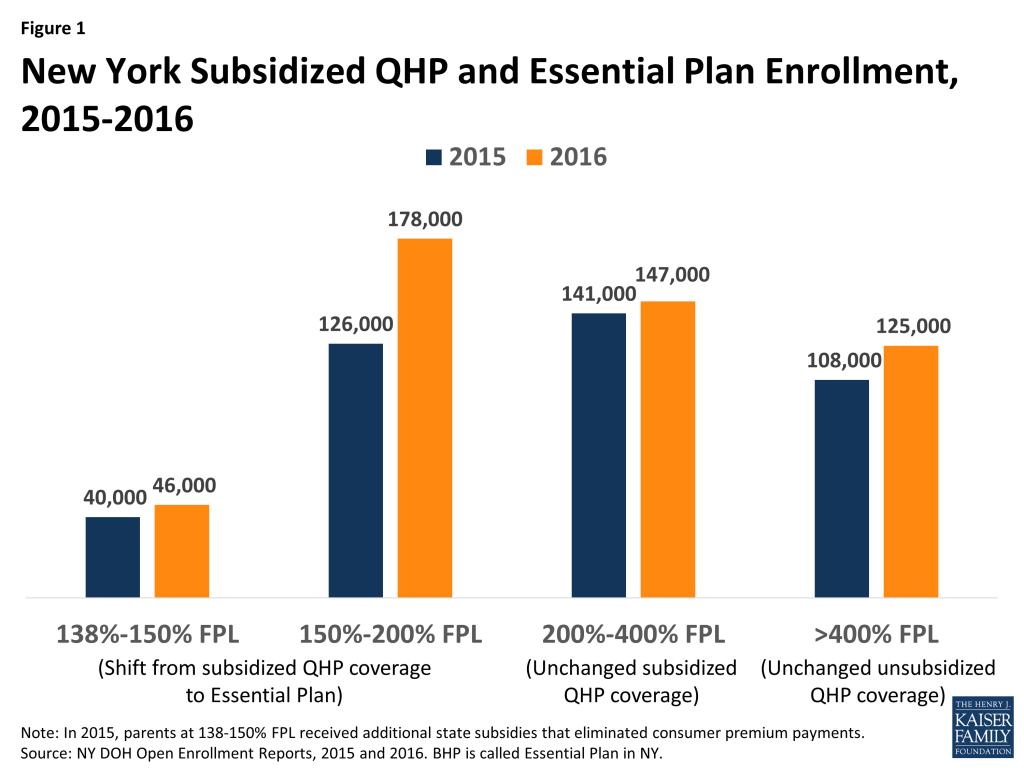
Enrollment increased substantially following BHP implementation in New York. Implementation of EP in New York in 2016 provided a natural experiment testing the impact of increased affordability on enrollment. Among adults with incomes 150-200% FPL—all of whom moved from federally-subsidized QHPs to EP—enrollment grew by 42% between 2015 and the end of the 2016 open enrollment period (OEP), an increase of 52,000 enrollees. By contrast, enrollment increased by only 4% among adults with incomes 200-400% FPL, whose subsidy eligibility was unaffected by BHP implementation (Figure 1).18  Overall, enrollment among those with incomes from 138% – 200% FPL, who moved from the marketplace into BHP, rose 35% (from 166,000 to 224,000). Compared to those with incomes 150%-200% FPL, enrollment growth among BHP enrollees with incomes 138%-150% FPL was less pronounced. In 2015, nearly half of those in the latter group (19,000 out of 40,000) were parents who received supplemental state subsidies that paid the full QHP premium.19  As a result, the affordability improvements from moving to BHP were much lower in magnitude for many in this group than for those with incomes between 150%-200% FPL.

Figure 1: New York Subsidized QHP and Essential Plan Enrollment, 2015-2016

In New York, those eligible for BHP were more likely to enroll than those determined eligible for subsidized QHP coverage. Among people who applied for 2016 coverage and qualified for BHP in New York, 98% continued through the enrollment process to select a plan.20  Only 58% did so among applicants who were found eligible for subsidized and unsubsidized QHPs, combined.21  Stakeholders reported that BHP increased participation because of both reduced premiums and the absence of deductibles. Lower out-of-pocket cost-sharing in BHP also appeared to improve consumers’ receipt of primary care, according to some stakeholders. According to state analyses, consumers enrolled in BHP averaged $1,100 in savings compared to what they would have paid for subsidized QHP coverage.22  Similar estimates were not available for Minnesota.

Stakeholders reported that MNCare’s greater affordability increased enrollment. Minnesota did not offer a comparable natural experiment to New York, since eligibility for BHP and subsidized QHP coverage did not change from 2014 through 2016. However, stakeholders believed that BHP’s lower premiums and out-of-pocket cost-sharing, compared to subsidized QHP coverage, contributed to enrollment growth following ACA implementation. Monthly MNCare enrollment increased from 79,000 in September 2014 to nearly 101,000 in September 2016.23  State officials noted that enrollment dipped slightly from 2015 to 2016 as systems issues that had delayed the renewal process were resolved and those who were no longer eligible transitioned off coverage.

BHP enrollees were reportedly younger and healthier than those in QHPs. Although detailed data enabling a comparison of demographic characteristics were not publicly available, carriers in New York reportedly were pleased that younger and healthier members signed up for EP, though officials noted that one year’s experience is a limited basis for generalization. Minnesota officials described BHP members as younger and healthier than both the Medicaid population and QHP enrollees. Officials in both states attributed these effects to the greater affordability of BHP compared to subsidized marketplace coverage.

Year-round BHP enrollment improved consumers’ access to coverage without harming the risk pool. Because of BHPs’ low premiums, stakeholders observed that consumers had little or no incentive to delay enrollment until illness or injury created a need for coverage. Carriers in both states thus report that year-round enrollment has not led to detectable adverse selection. The impact of year-round enrollment on total coverage levels may be significant. For example, New York State officials project that, between the end of the 2016 OEP and 2017, BHP enrollment will grow from nearly 380,000 to roughly 600,000.

Stakeholders reported that consumers valued the increased predictability and simplicity of BHP coverage, compared to marketplace plans. According to consumer groups and enrollment assisters, consumers appreciated the greater predictability and understandability of premiums, cost-sharing, plan networks, and benefits offered by BHP’s state-defined coverage, which remained constant from plan to plan. Consumers had no need to reengage with a rapidly changing and complex marketplace at open enrollment each year. That said, changes occur in state-administered systems, as illustrated by Minnesota’s increases in 2016 premiums and cost-sharing.24  Stakeholders noted that while some consumers complained about these changes, particularly increased out-of-pocket costs, coverage remained relatively affordable and understandable; enrollment thus did not decline.

Coverage Transitions

The two states varied in the integration of their eligibility systems. In both New York and Minnesota, the marketplace provides an online enrollment pathway for Medicaid, CHIP, BHP, and the marketplace. New York’s system determines eligibility for all programs and lets consumers complete the enrollment process online, preventing breaks in coverage both following the initial application and when consumers move between programs. However, a few thousand immigrants who were still in the state’s “legacy” Medicaid system had to be transferred manually. Minnesota’s marketplace system also provides eligibility determinations for Medicaid and MNCare; however, if verification or further follow-up is needed, the application is sent to counties to complete Medicaid enrollment or the state Department of Human Services (DHS) to complete MNCare enrollment. Stakeholders expressed concern that breakdowns can occur with the information transfer, leading to enrollment delays for some consumers and the possibility of some consumers not getting coverage. They noted that problems and delays are more likely to occur for families in which some members are eligible for Medicaid and others qualify for MNCare.

BHP enrollees whose incomes rise above 200% FPL experience steep cost increases when they move to QHPs. In federally subsidized QHPs, these enrollees face both higher premiums and higher cost-sharing, including deductibles, which BHP plans do not charge. Compared to Minnesota, the cliff is steeper in New York because BHP coverage is less costly to consumers; but in both states, stakeholders indicated that the combination of higher premiums along with deductibles of $1,500 or more for consumers moving into QHPs poses real financial challenges. They further noted that the cliff existed prior to BHP implementation when consumers moved from Medicaid to QHP coverage; however, it was not as steep because the marketplace subsidies are more generous at 139% FPL than 200% FPL. While stakeholders expressed concern over this cliff, they felt that this highlighted the importance of BHP as a more affordable coverage option.

Minnesota is exploring ways to expand BHP coverage beyond the current eligibility levels. To address affordability concerns above 200% FPL and to lessen the severity of the current “cliff,” a multi-stakeholder task force in Minnesota recommended expanding BHP to 275% FPL. Advocates in New York have called for a similar discussion of options to improve affordability for higher income marketplace enrollees.

Impact on the Marketplace

BHP did not appear to harm administrative funding for marketplaces. In Minnesota, financing for the state’s marketplace, MNsure, comes from a 3.5% assessment on QHP premiums sold through the marketplace.25  By covering consumers with incomes under 200% FPL who would have otherwise enrolled in the marketplace, BHP reduced this assessment revenue. However, Minnesota applies standard federal cost-allocation principles to marketplace activities, including eligibility determination, application assistance, and public education, that benefit Medicaid and BHP. As a result, MNsure receives payments from DHS to support marketplace operations. State officials reported that these cost-allocation payments for Medicaid and BHP consumers provided the marketplace with adequate and stable administrative funding. New York finances its marketplace through a broad-based assessment on plans inside and outside the marketplace. Consequently, adopting the BHP did not affect New York marketplace revenues.

BHP did not appear to affect marketplace stability. In New York, officials who worried about marketplace effects before program implementation reported that, after implementation, those worries proved unwarranted as marketplace stability remained unaffected. In Minnesota, the marketplace has experienced significant upheaval, with many carriers reporting losses, some high-profile plan exits, and significant premium increases (particularly for 2017). State officials and most stakeholders believed that BHP was not responsible for those problems. They attributed the marketplace’s challenges to carriers’ initial underpricing of QHP premiums; the state’s high-risk pool ending in 2015, which shifted many high-cost consumers to QHPs; federal underfunding of risk-corridor payments; and other causes unrelated to BHP. However, carriers suggested that the reduced size of the marketplace due to BHP may have made its risk pool more vulnerable to enrollment by relatively few high-cost consumers. In New York and Minnesota, BHP had a minimal impact on overall risk levels and premiums in the individual market, according to officials.

Impact on State Administration and Financing

BHP Administration

Existing state agencies administer BHP in both states. In both New York and Minnesota, the Medicaid program assumes most administrative responsibilities for BHP, with the marketplace taking on some tasks. According to stakeholders, because MNCare was once a Medicaid waiver program, the Medicaid agency assumes overall programmatic responsibility for BHP. In New York responsibilities are shared between Medicaid and the marketplace, both of which are housed in the state’s Department of Health. For example, Minnesota’s Medicaid agency both contracts with BHP plans and sets BHP rates; and in New York the marketplace contracts with plans, while the Medicaid program sets payment rates. Relying on existing infrastructure for BHP administration reduced administrative costs. Stakeholders in New York also noted that using existing agencies helped create a smoother launch with BHP than had been observed with other new health programs. According to stakeholders, neither state covered BHP administrative costs through premium assessments on BHP plans. Based on guidance from the Centers for Medicare and Medicaid Services, such assessments can be funded through federal BHP allotments, since fees and taxes are absorbed into BHP premiums.26 

Coordination among state agencies is generally effective in both states, though there have been some challenges. Given the shared responsibilities for BHP program administration between Medicaid and the marketplaces, stakeholders noted that strong communication and coordination between the agencies was essential. Officials in both states reported having good working relationships with their sister agencies and felt the administrative structure supported effective program administration. Operationally, stakeholders in Minnesota noted some challenges related to the state’s multiple eligibility systems. They felt that better coordination around business processes might help to lessen enrollment delays some consumers face as they move between programs.

BHP Costs and Financing

The study states achieved significant savings by moving individuals from older coverage programs into BHP. According to state officials, New York saved an estimated $1 billion in state fiscal year (SFY) 2016 by using federally-funded BHP to cover approximately 250,000 lawfully present immigrants who had previously received state-funded Medicaid. Even though the state incurred new costs for non-immigrant BHP enrollees, the state still realized more than $800 million in net savings. Minnesota likewise anticipated fiscal gains from transitioning consumers out of a Medicaid waiver program, for which the state paid nearly 50% of all costs, into BHP. However, the state did not experience anticipated financial relief in 2015. Federal BHP payments are based on QHP premium levels, and the state’s unexpectedly low initial QHP premiums reduced 2015 federal BHP funding below projected levels. Higher QHP premiums in 2016 increased federal BHP funding. In addition, legislatively-mandated increases in premium and cost-sharing requirements along with a healthier-than-expected BHP population, both of which are discussed above, lowered BHP program expenditures. As a result of these combined factors, Minnesota’s BHP provided budget gains in 2016 that were greater than originally anticipated.

State contributions are required to cover a portion of BHP costs in both states. For several reasons, including federal BHP payments provide only 95% of what the federal government would have spent on subsidies had BHP enrollees received marketplace coverage; BHP coverage in both Minnesota and New York is more generous than federally-subsidized QHP coverage; and BHP pays plans more than Medicaid, federal financing does not fully cover BHP program costs. In New York, projected EP costs for FY 2017 are $2,461 million. Federal BHP payments are expected to pay 85% of the costs, and state general operating funds will cover 15%, or $377 million.27  In Minnesota, projected costs for MNCare for FY 2017 are $608 million. Federal BHP payments are projected to cover 68% of these costs; consumer premium contributions will finance 7%; and the state will contribute 26% (Figure 2).28  Stakeholders in Minnesota expressed concern about future funding for BHP. The state relies on a 2% provider tax to finance BHP, among other programs. Originally, the provider tax paid many costs, such as for the state’s high-risk pool, that are no longer needed following ACA implementation. In 2014, the state legislature repealed the provider tax effective December 2019, but did not establish an alternative financing mechanism for BHP. While near-term funding will be available, and BHP enjoys widespread support among policymakers and stakeholders, the long-term implications for the program are unclear. Stakeholders in both Minnesota and New York believed that stable funding sources for both the marketplace and BHP were critical to ensuring the programs’ future. An important open question is how much the rise in QHP premiums for 2017 and beyond, which will increase federal BHP payments, will lower state BHP costs.

Figure 2: Projected Sources of BHP Financing in Minnesota and New York, Fiscal Year 2017

Lessons Learned

Following the outcome of the 2016 elections, the future of BHP and other Affordable Care Act provisions is unclear. Despite this uncertainty, the experiences of Minnesota and New York with BHP suggest broader lessons about effective coverage programs for low-income consumers.

Substantial enrollment gains and an improved risk pool can result when low-income consumers are offered coverage much more affordable than federally subsidized marketplace plans. New York’s “natural experiment” with BHP demonstrates the significant enrollment gains, including among the relatively young and healthy, that can be achieved by reducing this group’s premiums below subsidized QHP levels and eliminating deductibles.

Many consumers preferred the stability and simplicity of state-defined coverage to the marketplace’s complexity and unpredictability. Stakeholders reported that many low-income consumers found marketplace coverage confusing and hard to negotiate, preferring the consistency of state-administered coverage in which premiums, cost-sharing, and benefits were the same across participating plans. Consumers likewise appreciated the ability to stay in the same BHP plan without the need to “shop” each year to avoid large premium increases.

Encouraging plans and providers to participate across all coverage programs can promote continuity of care. Overlap of plans and networks promotes continuity of provider relationships and care when consumers move between programs because of changing household circumstances. In addition, Minnesota found that conducting joint procurement for Medicaid and BHP achieved savings in both public programs, broadened BHP provider networks beyond QHP levels, and increased the state’s leverage to implement delivery-system and payment reforms.

Relying on existing infrastructure to administer new coverage programs can create efficiencies and avoid duplication. Both Minnesota and New York administered BHP primarily through the Medicaid agency, thereby lowering BHP administrative costs. Neither state created new administrative structures to run BHP.

Conclusion

When federal officials announced that regulatory delays prevented states from implementing BHP until 2015, all states considering BHP put that option aside, except for Minnesota and New York. The latter states’ experiences highlight the potential for BHP to make coverage more affordable for those with incomes between 138-200% FPL. Both states set premiums and cost-sharing levels below those in the marketplace. Significant enrollment gains resulted when New York transitioned consumers from subsidized QHPs to BHP. Moreover, notwithstanding marketplace instability in Minnesota that most observers attribute to other factors, BHP does not appear to be a major factor undermining marketplace viability in either state.

Although the 2016 election results create uncertainty around the future of the ACA (including BHP), BHP implementation provides important lessons about structuring coverage programs for low-income uninsured consumers for consideration in future reforms. Significant enrollment gains and risk-pool improvements can result when low-income consumers are offered insurance that is substantially more affordable than federally subsidized marketplace coverage. Moreover, many consumers prefer the simplicity and predictability of a state-administered program, with uniform costs and benefits, to the changing, complex coverage offered in a health insurance marketplace.


Endnotes

  1. Minnesota Budget Project, Basic Health Plan Offers a Chance to Provide Comprehensive Health Care Coverage for Low-Income Minnesotans (St. Paul, MN: Minnesota Budget Project, January 2012), http://www.mnbudgetproject.org/research-analysis/economic-security/basic-health-plan ↩︎
  2. Minnesota Department of Health Services, Prepaid Medical Assistance Project Plus (PMAP+) Section 1115 Waiver Evaluation Plan 2014 (Minnesota Department of Health Services, 2014), http://dhs.state.mn.us/main/groups/healthcare/documents/pub/dhs16_194875.pdf ↩︎
  3. Editorial Board, “A next-generation model for MinnesotaCare,” Star Tribune, (May 2013), http://www.startribune.com/a-next-generation-model-for-minnesotacare/208894751/ ↩︎
  4. Ibid. ↩︎
  5. New York State of Health. NY State of Health Essential Plan Webinar, (New York State of Health, November 16, 2015), http://info.nystateofhealth.ny.gov/sites/default/files/Essential%20Plan,%2010-7-15.pdf ↩︎
  6. “State Moves Forward with BHPs,” Greater New York Hospital Association, (August 2015), http://www.gnyha.org/PressRoom/Publication/f4baa92a-cec4-4f90-a945-c6e2aa2f6198/ ↩︎
  7. New York requires insurers to follow the BHP naming convention in naming their products to ensure that consumers can easily identify BHP plans. “Essential Plan 1” is the product for individuals with incomes between 150 and 200% FPL, “Essential Plan 2” is the product for individuals with incomes between 138 and 150% FPL, “Essential Plan 3” is the product for individuals with incomes between 100 and 138% FPL who are not eligible for Medicaid due to immigration status, and “Essential Plan 4” is the product for individuals with incomes at or below 100% FPL who are not eligible for Medicaid due to immigration status. ↩︎
  8. 2017 Invitation for Participation in New York State of Health, Attachment F – BHP Product Offering and Cost-Sharing (New York State of Health, 2015), http://info.nystateofhealth.ny.gov/sites/default/files/Attachment%20F%20-%20BHP%20-%20Benefits%20and%20Cost-Sharing,%205-15-15.pdf ↩︎
  9. Minnesota Department of Human Services, MinnesotaCare Premium Estimator Table, (Minnesota Department of Human Services, 2015), https://edocs.dhs.state.mn.us/lfserver/Public/DHS-4139A-ENG ↩︎
  10. Individuals under age 21, American Indians and Alaska Natives and their family members are exempt from premiums, and members of the military who have completed a tour of active duty within 24 months and their family members are exempt from premiums for 12 months. Medicaid.gov, Minnesota’s Basic Health Program Blueprint, (Medicaid.gov, April 2016), https://www.medicaid.gov/basic-health-program/downloads/minnesota-bhp-blueprint.pdf ↩︎
  11. Because neither Minnesota nor New York enrolled BHP individuals into the marketplace in 2016, a direct comparison of what those individuals would have paid in premiums is not possible. The estimates included in the Table are based on a household size of 1. While the estimates were calculated based on the US average premium for a single adult age 40, the actual consumer costs at the applicable income levels are based entirely on family income when consumers purchase benchmark-priced coverage. Source: Kaiser Family Foundation, 2016 Health Insurance Marketplace Calculator, https://modern.kff.org/interactive/subsidy-calculator-2016/ ↩︎
  12. Randall Chun, MinnesotaCare Information Brief, (St. Paul, MN: Research Department of the Minnesota House of Representatives, January 2016), http://www.house.leg.state.mn.us/hrd/pubs/mncare.pdf ↩︎
  13. Minnesota Department of Human Services, Bulletin: Legislative Changes to Medical Assistance and MinnesotaCare, Minnesota Department of Human Services, July 2015, http://www.dhs.state.mn.us/main/groups/publications/documents/pub/dhs16_195870.pdf ↩︎
  14. New York State of Health, Invitation and Requirements for Insurer Certification and Recertification for Participation in 2016 (NY State of Health, May 2015), http://info.nystateofhealth.ny.gov/sites/default/files/2016%20Invitation%20to%20Participate%20in%20NYSOH%2C%205-15-15.pdf ↩︎
  15. New York State of Health, Invitation and Requirements for Insurer Certification and Recertification for Participation in 2016 (NY State of Health, May 2015), http://info.nystateofhealth.ny.gov/sites/default/files/2016%20Invitation%20to%20Participate%20in%20NYSOH%2C%205-15-15.pdf ↩︎
  16. Minnesota Department of Human Services, MinnesotaCare Health Plan Choices by County (Minnesota Department of Human Services, January 2016) https://edocs.dhs.state.mn.us/lfserver/Public/DHS-4326-ENG ↩︎
  17. The NY State of Health: Official Health Plan Marketplace, 2016 Open Enrollment Report, (August 2016) http://info.nystateofhealth.ny.gov/sites/default/files/NYSOH%202016%20Open%20Enrollment%20Report%282%29.pdf ↩︎
  18. Authors’ calculations, The NY State of Health: Official Health Plan Marketplace, 2016 Open Enrollment Report, (August 2016) http://info.nystateofhealth.ny.gov/sites/default/files/NYSOH%202016%20Open%20Enrollment%20Report%282%29.pdf; The NY State of Health: Official Health Plan Marketplace, 2015 Open Enrollment Report, (July 2015), http://info.nystateofhealth.ny.gov/sites/default/files/2015%20NYSOH%20Open%20Enrollment%20Report.pdf ↩︎
  19. Peter Newell and Nikhita Thaper. New York’s Temporary Premium Subsidies: Meeting Immediate Goals and Yielding Useful Lessons. United Health Fund, June 2016. https://www.uhfnyc.org/assets/1492 ↩︎
  20. The NY State of Health: Official Health Plan Marketplace, 2016 Open Enrollment Report, (August 2016), http://info.nystateofhealth.ny.gov/sites/default/files/NYSOH%202016%20Open%20Enrollment%20Report%282%29.pdf ↩︎
  21. Ibid. ↩︎
  22. Ibid. ↩︎
  23. Minnesota Department of Human Services, Managed care enrollment figures, available at: http://www.dhs.state.mn.us/main/idcplg?IdcService=GET_DYNAMIC_CONVERSION&RevisionSelectionMethod=LatestReleased&dDocName=dhs16_141529#. ↩︎
  24. Randall Chun, MinnesotaCare Information Brief, (St. Paul, MN: Research Department of the Minnesota House of Representatives, January 2016), http://www.house.leg.state.mn.us/hrd/pubs/mncare.pdf ↩︎
  25. MNsure, MNsure FY 2017 Preliminary Budget—Explanation of Funding Sources and Expenditures, (St. Paul, MN: MNsure, March 2016), https://www.leg.state.mn.us/docs/2016/mandated/160417.pdf ↩︎
  26. Centers for Medicare and Medicaid Services. “Basic Health Program: State Administration of Basic Health Programs; Eligibility and Enrollment in Standard Health Plans; Essential Health Benefits in Standard Health Plans; Performance Standards for Basic Health Programs; Premium and Cost Sharing for Basic Health Programs; Federal Funding Process; Trust Fund and Financial Integrity.” Federal Register. Vol. 79, No. 48 (March 12, 2014): 14112-14151 at 14133, http://www.gpo.gov/fdsys/pkg/FR-2014-03-12/pdf/2014-05299.pdf, as discussed in Stan Dorn and Jennifer Tolbert, The ACA’s Basic Health Program Option: Federal Requirements and State Trade-Offs, (Kaiser Commission on Medicaid and the Uninsured and the Urban Institute, November 2014), https://modern.kff.org/health-reform/report/the-acas-basic-health-program-option-federal-requirements-and-state-trade-offs/ ↩︎
  27. Andrew M. Cuomo and Robert F. Mujica Jr., FY 2017 Enacted Budget Financial Plan, (New York State of Opportunity, May 2016) https://www.budget.ny.gov/budgetFP/FY2017FP.pdf. ↩︎
  28. Minnesota Management and Budget, Health Care Access Fund, February 2016 Forecast Update, (Minnesota Management and Budget, February 2016), https://mn.gov/mmb/assets/feb16fcst-hcaf_tcm1059-157696.pdf ↩︎
News Release

What’s at Stake in a Potential Repeal of the ACA Medicaid Expansion?

Published: Dec 7, 2016

President-elect Trump and Republican leaders in Congress have vowed to repeal the Affordable Care Act (ACA) and replace it with an alternative plan. There are now 32 states (including DC) that have adopted the ACA’s Medicaid expansion. While the details of a repeal-and-replace plan are not yet available to assess its impact, a new brief reveals what’s potentially at stake for Medicaid in the debate by examining the changes in health coverage and financing that have occurred since the Medicaid expansion took effect in January 2014.

Key findings:

  • By 2015, an estimated 11 million Medicaid enrollees nationally were adults who were made newly eligible by the expansion. They were part of a larger net increase in Medicaid enrollment since the implementation of the ACA.  (State-level Medicaid enrollment data as of 2015, including enrollment of those newly eligible in expansion states, is available in Appendix Table 2.)
  • The Medicaid enrollment gains contributed to a big decline in the uninsured rate among nonelderly individuals in the U.S., which fell from 16.6 percent in 2013 to a historic low of 10 percent in 2016.
  • Medicaid expansion states received $79 billion from January 2014 to June 2015 in new federal funding (with little or no state match) to help cover newly eligible enrollees. Under current law, federal funding will cover 95 percent of Medicaid expansion costs in 2017 and will phase down to 90 percent for 2020 and beyond.

What Coverage and Financing is at Risk Under a Repeal of the ACA Medicaid Expansion?

Authors: Robin Rudowitz, Samantha Artiga, and Katherine Young
Published: Dec 6, 2016

Issue Brief

As discussion about repeal of the Affordable Care Act (ACA) unfolds, questions emerge about how a repeal may affect Medicaid. The specific effects would depend on many factors that are currently unknown, including whether there is a replacement for the ACA, what happens to federal Medicaid expansion funding, and whether broader changes to the underlying financing structure of the Medicaid program are made. While it is difficult to quantify the specific effects of a repeal given these unknowns, this issue brief examines the changes in coverage and financing that have occurred under the Medicaid expansion to provide insight into the potential scope of coverage and funding that may be at risk under a repeal. It finds:

  • In 2015, an estimated 11 million enrollees were adults made newly eligible by the expansion who could be at risk for losing Medicaid coverage. However, the scope of coverage losses among this group would depend on the specifics of the repeal and any replacement plan as well as actions by individual states. The Medicaid expansion made many parents and other adults newly eligible for the program, as there was no option for states to cover most adults without children through Medicaid before the expansion. This eligibility expansion, along with outreach and enrollment efforts associated with the ACA, led to large increases in Medicaid enrollment. Between Summer 2013, just prior to the ACA, and September 2016, there was a net increase in Medicaid and CHIP enrollment of 15.7 million people. In 2015, an estimated 11 million Medicaid enrollees were adults made newly eligible by the expansion. This number has likely continued to grow since 2015 as enrollment has continued to increase and additional states have expanded, including Louisiana and Montana.
  • Loss of Medicaid coverage could reverse the progress in reducing the uninsured. The Medicaid enrollment gains contributed to a fall in the uninsured rate among nonelderly individuals, which declined from 16.6% in 2013 to a historic low of 10% in 2016.
  • As a result of the enhanced federal funding for expansion, expansion states have received $79 billion in federal funding from January 2014 through June 2015. The ACA Medicaid expansion provides enhanced federal funding for newly eligible adults with no or little state matching dollars. Alaska, Louisiana and Montana, had not claimed spending for the expansion group during this period.

Why did the ACA Expand Medicaid?

The ACA’s coverage provisions built on and attempted to fill gaps in an insurance system that left many without affordable coverage. This system had built up over time and included employer-based coverage for many—but not all—workers and their families, Medicaid coverage for certain categories of low-income people, directly-purchased coverage for a small number of people who bought policies on the non-group market, and Medicare for most people over age 65 as well as some younger people with disabilities. Under this system, many were ineligible for coverage or could not afford coverage that was available. In 2013, 44 million nonelderly people were uninsured. The majority who lacked coverage were poor and low-income adults (28% of the non-elderly uninsured had incomes below poverty and 62% had incomes below 200% of poverty in 2013). The main reason that most people said they lacked coverage was cost.1 

The ACA Medicaid expansion was designed to fill gaps in coverage for low-income adults. Prior to the ACA, Medicaid eligibility for adults was very limited resulting in large numbers of uninsured poor adults. Income eligibility limits for parents were very low in most states, often below half the poverty level, and other non-disabled adults generally were not eligible regardless of their income. The ACA expanded Medicaid eligibility for parents and other adults to 138% FPL (about $16,000 for an individual or $28,000 for a family of three). Through this expansion and other changes, the ACA intended to establish a national minimum eligibility threshold in Medicaid of 138% FPL for nearly all individuals under age 65, making Medicaid the base of coverage for low-income people within the ACA’s broader coverage system. As enacted, this expansion was to occur nationwide beginning in January 2014. However, a 2012 Supreme Court ruling effectively made the expansion a state option.

In designing the ACA, expanding Medicaid was determined to be the most efficient and cost effective way to extend coverage to very poor adults. Medicaid had an existing role for the low-income population, and was already an operating program that could be extended rather than newly developed. Medicaid programs had experience providing coverage with low cost-sharing and comprehensive benefits suitable for a very low-income population. In addition, per capita spending in Medicaid is lower compared to private insurers after adjusting for the greater health needs of Medicaid enrollees.2 

What Coverage is at Risk Under a Repeal of the Medicaid Expansion?

Under a repeal, many low-income parents and other adults could potentially lose eligibility for Medicaid. As of December 2016, 32 states including the District of Columbia implemented the ACA Medicaid expansion to adults. By January 2017, half (16) of the expansion states will have a Republican governor (Figure 1). Prior to the Medicaid expansion most states limited Medicaid eligibility for parents to less than the poverty level, and there was no option available to states within to cover other non-disabled adults within Medicaid (Appendix Table 1). As such, in expansion states, median eligibility increased from 91% to 138% FPL for parents ($27,821 for a family of three) and from 0% to 138% FPL for other adults ($16, 394 for an individual) (Figure 2 and Appendix Table 1 for state by state eligibility levels). In contrast, in non-expansion states, median eligibility for parents remains below half the poverty level and at 0% FPL for other adults.3  What would happen to eligibility levels would depend on the specifics of changes to federal eligibility rules under a repeal, including whether states would still have an option to cover adults, as well as other state choices. If states returned to their pre-ACA 2013 eligibility levels or lower, many parents and other adults would lose Medicaid eligibility in expansion states.

Figure 1: Expansion states are split between Republican and Democratic governors as of January 2017.
Figure 2: Medicaid eligibility increased for parents and other adults in expansion states under the ACA.

Decreases in eligibility would lead to declines in Medicaid enrollment, particularly in expansion states. Since the ACA coverage expansions were implemented starting in 2014 through September 2016, net Medicaid and CHIP enrollment has increased by 15.7 million, or 28% with the majority of growth occurring in expansion states. This growth included enrollment of newly eligible adults as well as children and adults who were previously eligible but not enrolled. Most growth was in large states in the West that expanded Medicaid (Figure 3). States that expanded Medicaid had over three times greater enrollment growth compared to non-expansion states (36% vs. 12%), although there was variation across states. If parents and adults were to lose eligibility for Medicaid, there would be declines in Medicaid enrollment, and most of these declines would likely be in areas that experienced the largest growth under expansion.

Figure 3: Most of the growth in Medicaid enrollment was in expansion states and the West from Summer 2013 to September 2016.

About 11 million Medicaid enrollees who were made newly eligible by the ACA Medicaid expansion would be at risk for losing Medicaid coverage if states no longer have an option to extend Medicaid eligibility to low-income adults and if federal enhanced financing is withdrawn under a repeal. The majority (82%) of Medicaid enrollees are eligible through pathways that existed prior to the ACA (e.g. children, pregnant women, elderly and individuals with disabilities). In addition, a small share of enrollees in the expansion group were eligible for Medicaid through pre-ACA expansions to adults.4  However, in 2015, about 11 million enrollees were adults in the expansion group who were made newly eligible by the ACA Medicaid expansion, accounting for 14% of all Medicaid enrollees (Figure 4 and Appendix Table 2 for state by state enrollment). Since 2015, this number has likely grown as enrollment has continued to increase and additional states have expanded, including Louisiana and Montana. Moreover, as of January 2016, an estimated 6.4 million adults were eligible for Medicaid but not enrolled, which include many newly eligible adults.5 

Figure 4: About 11 million Medicaid enrollees in 2015 were newly eligible adults in the expansion group.

Uninsured rates could rise due to losses in Medicaid coverage, but, the extent of such losses would depend on what other coverage options may be available. Medicaid enrollment gains have played a significant role in decreasing the uninsured rate. Since implementation of the ACA, the uninsured rate among the nonelderly has fallen from 16.6% to a historic low of 10% in early 2016.6  Over 17 million more people have health coverage in 2016 compared to 2013, as the number of nonelderly uninsured dropped from 44 million to 27 million. Because the ACA coverage expansions mostly target adults, who have historically had higher uninsured rates than children, nearly the entire decline in the number of uninsured people has occurred among adults. Moreover, the decline in the uninsured rate for adults was larger among Medicaid expansion states compared to non-expansion states (Figure 5).

Figure 5: Uninsured rate drops more between 2013 and 2016 in states that adopted the Medicaid expansion.

What Financing is at Risk Under a Repeal of the Medicaid Expansion?

The law provided enhanced federal funding for states to implement the Medicaid expansion. Under current law, Medicaid provides a guarantee to states for federal matching payments. The federal share of Medicaid is determined by a formula set in statute that is based on a state’s per capita income. The formula is designed so that the federal government pays a larger share of program costs in poorer states. The federal share (FMAP) varies by state from a floor of 50% to a high of 74% in 2016, and states may receive higher FMAPs for certain services or populations. The ACA provided states 100% federal funding for the costs of adults made newly eligible under the Medicaid expansion from 2014-2016 with the federal share phasing down to 95% in 2017 and to 90% by 2020 and beyond.

Under a repeal, states could potentially lose access to the enhanced federal funding made available for the Medicaid expansion. From January 2014 through June 2015, spending for the new adult group was $84 billion for the expansion group, accounting for about 12% of total Medicaid spending across all states over the period (Figure 6 and Appendix Table 3 for state by state spending). Nearly all expenditures for the new adult group ($79 billion out of $84 billion) were paid for with federal funds, reflecting the enhanced federal match for newly eligible adults.7  In contrast, federal funds comprised 58% of the costs for the traditional Medicaid population over the same period. Some states that implemented the expansion after January 2014, including Alaska, Louisiana and Montana, had not claimed spending for the expansion group during the data collection period.

Figure 6: From January 2014 – June 2015, spending for the expansion group totaled $84 billion ($79 billion in federal funds).

Broader economic gains states have realized as a result of the Medicaid expansion could be affected. National, multi-state, and single-state studies show that states expanding Medicaid under the ACA have realized budget savings, revenue gains, and overall economic growth despite Medicaid enrollment growth initially exceeding projections in many states.8  Studies show that states have achieved net positive economic impacts from increased employment; increased revenues to hospitals, physicians, and other providers; decreases in uncompensated care; and savings in other states programs, such as state-funded behavioral health or corrections.

Conclusion

As a new Administration and Congress debate a repeal of the ACA, it is important context to note that many Americans have favorable opinions of many individual provisions in the ACA with 8 in 10 (and two-thirds of Trump voters) who have a favorable opinion of giving states the option of expanding their existing Medicaid program to cover more low-income uninsured.9  Thirty-two states have implemented the Medicaid expansion, and as of January 2017, 16 of these states will have Republican governors. While it is difficult to quantify the specific effects of a repeal of the ACA Medicaid expansion given the many uncertainties that remain at this time, examining the changes in coverage and financing that have occurred under the Medicaid expansion provides insight into the potential scope of coverage and funding that may be at risk under a repeal. Experience to date suggests that under a repeal of the Medicaid expansion, many low-income parents and other adults would be at risk for potentially losing eligibility for Medicaid, which might contribute to increases in the number of uninsured, depending on what coverage options are available under a repeal. Moreover, states could lose access to the enhanced federal funding made available for newly eligible adults under the Medicaid expansion and face increased costs associated with rises in uncompensated care and spending in state programs for the uninsured.

Appendix

Appendix Table 1:  Medicaid Eligibility Limits for Parents and Other Adults as a Percent of the Federal Poverty Level
StateParents(in a family of three)Other Adults(for an individual)
2013 (Pre-ACA)20162013 (Pre-ACA)2016
Federal Poverty Level$19,530$20,160$11,490$11,880
Alabama23%18%0%0%
Alaska78%143%0%138%
Arizona106%138%100%138%
Arkansas16%138%0%138%
California106%138%0%138%
Colorado106%138%20%138%
Connecticut191%155%70%138%
Delaware120%138%110%138%
District of Columbia206%221%211%215%
Florida56%34%0%0%
Georgia48%37%0%0%
Hawaii138%138%100%138%
Idaho37%26%0%0%
Illinois139%138%0%138%
Indiana24%139%0%139%
Iowa80%138%0%138%
Kansas31%38%0%0%
Kentucky57%138%0%138%
Louisiana24%138%0%138%
Maine200%105%0%0%
Maryland122%138%0%138%
Massachusetts133%138%0%138%
Michigan64%138%0%138%
Minnesota215%138%75%138%
Mississippi29%27%0%0%
Missouri35%22%0%0%
Montana54%138%0%138%
Nebraska58%63%0%0%
Nevada84%138%0%138%
New Hampshire47%138%0%138%
New Jersey200%138%0%138%
New Mexico85%138%0%138%
New York150%138%100%138%
North Carolina47%44%0%0%
North Dakota57%138%0%138%
Ohio96%138%0%138%
Oklahoma51%44%0%0%
Oregon39%138%0%138%
Pennsylvania58%138%0%138%
Rhode Island181%138%0%138%
South Carolina89%67%0%0%
South Dakota50%52%0%0%
Tennessee122%101%0%0%
Texas25%18%0%0%
Utah42%45%0%0%
Vermont191%138%160%138%
Virginia30%39%0%0%
Washington71%138%0%138%
West Virginia31%138%0%138%
Wisconsin200%100%0%100%
Wyoming50%57%0%0%
NOTES: The Federal Poverty Level (FPLs) is for the 48 contiguous states and DC. Alaska and Hawaii have separate FPLs. Eligibility limits are for full Medicaid benefits; waiver programs that provide more limited benefits or state-funded programs are not included. Parent limits are based on a family of three; other adults are based on an individual. For parent limits that are based on a dollar threshold, the reported values are FPL equivalents. 2013 levels take states’ earnings disregards, when applicable, into account.  2016 limits include a disregard equal to five percentage points of the FPL.SOURCE: Based on results from national surveys conducted by the Kaiser Commission on Medicaid and the Uninsured and the Georgetown University Center for Children and Families, updated to reflect Medicaid expansion decisions as of November 2016.
Appendix Table 2: Medicaid Enrollment (rounded to nearest 100), 2015
StateExpanded Medicaid by December 31, 2015Medicaid EnrollmentExpansion Group EnrollmentExpansion Group- Newly Eligible EnrollmentExpansion Group- Not Newly Eligible Enrollment
AlabamaNo1,055,900000
Alaska*Yes130,0008,5008,5000
ArizonaYes1,873,400413,000105,700307,200
ArkansasYes1,183,700291,600266,70039,500
California^Yes13,381,7003,466,1003,466,1000
ColoradoYes1,209,900347,800346,2001,600
ConnecticutYes840,600201,000187,00019,600
DelawareYes212,20061,30010,10051,600
District of ColumbiaYes249,00062,00062,0000
FloridaNo4,080,200000
GeorgiaNo1,868,200000
HawaiiYes313,800107,50034,30074,100
IdahoNo303,300000
IllinoisYes3,014,000671,100654,40025,200
Indiana*Yes1,247,400361,700222,400141,400
IowaYes587,100146,300136,10010,300
KansasNo383,300000
KentuckyYes1,283,800439,000439,0000
Louisiana*No1,462,800000
MaineNo279,000000
MarylandYes1,186,300260,200260,2000
MassachusettsYes2,037,600410,9000410,900
MichiganYes2,311,500613,800579,40037,400
MinnesotaYes1,194,200208,500207,700900
MississippiNo746,200000
MissouriNo962,000000
Montana*No139,000000
NebraskaNo237,000000
NevadaYes566,400187,100187,1000
New HampshireYes188,00049,00048,800400
New JerseyYes1,633,900532,900532,9000
New MexicoYes840,100235,400235,4000
New YorkYes6,657,7002,276,900285,6001,993,000
North CarolinaNo1,975,200000
North Dakota^YesN/AN/AN/AN/A
OhioYes3,078,200665,900618,20047,600
OklahomaNo760,800000
OregonYes1,113,800546,400474,80071,600
PennsylvaniaYes2,670,400603,300548,00055,400
Rhode IslandYes279,90059,30059,3000
South CarolinaNo1,219,600000
South DakotaNo109,800000
TennesseeNo1,654,200000
TexasNo4,338,400000
UtahNo327,700000
VermontYes207,10060,700060,700
VirginiaNo992,800000
WashingtonYes1,813,800592,100577,40015,600
West VirginiaYes554,600175,000175,0000
WisconsinNo1,213,000000
WyomingNo72,600000
Total30 expanded by 12/31/1576,041,00014,054,10010,728,2003,363,900
NOTES: *Medicaid expansion column reflects if states expanded Medicaid by December 31, 2015.  Alaska and Indiana expanded mid-2015 (Alaska on 9/1/15 and Indiana on 2/1/15). Louisiana and Montana have since expanded Medicaid (Louisiana on 7/1/16 and Montana on 1/1/16). ^California and North Dakota data were unavailable from CMS. California data were obtained from California Department of Health Report. This report does not distinguish newly eligible and not newly eligible adults, but because California did not provide full benefits to the new eligibility group prior to expansion, we classified all California beneficiaries as newly eligible.Enrollment from both MBES and CA DHCS report is reported for each month. In an effort to take into account that some beneficiaries are enrolled for only part of the year, maximum monthly enrollment for each state is used to estimate total annual enrollment.Due to rounding, state totals may not sum to national total.SOURCE: Kaiser Commission on Medicaid and the Uninsured analysis of Medicaid spending and enrollment data collected from the Medicaid Budget and Expenditure System (MBES), Centers for Medicare and Medicaid Services (accessed November 2016) and California Department of Health Care Services report “Medi-Cal Monthly Enrollment Fast Facts, June 2016”. https://www.medicaid.gov/medicaid/program-information/medicaid-and-chip-enrollment-data/enrollment-mbes/index.html. http://www.dhcs.ca.gov/dataandstats/statistics/Documents/Fast_Facts_June_2016_ADA.pdf. State expansion status available at “Status of State Action on the Medicaid Expansion Decision,” KFF State Health Facts, https://www.kff.org/health-reform/state-indicator/state-activity-around-expanding-medicaid-under-the-affordable-care-act
Appendix Table 3: Medicaid Spending (in millions), January 2014-June 2015
StateTotal Medicaid SpendingTraditional Medicaid- Federal SpendingTraditional Medicaid- State SpendingExpansion Group -Federal SpendingExpansion Group -State Spending
Alabama$7,816$5,418$2,398N/AN/A
Alaska*$2,400$1,408$992N/AN/A
Arizona$14,613$8,211$3,542$2,512$349
Arkansas$8,018$4,516$1,829$1,673$0
California$105,621$42,732$41,637$21,252$0
Colorado$9,977$4,191$4,039$1,743$4
Connecticut$11,320$4,816$4,650$1,817$37
Delaware$2,680$1,143$957$469$111
District of Columbia$3,609$2,198$944$464$3
Florida$31,790$19,127$12,662N/AN/A
Georgia$14,720$9,964$4,756N/AN/A
Hawaii$2,986$1,230$1,110$599$47
Idaho$2,600$1,869$731N/AN/A
Illinois$26,478$11,832$11,224$3,370$52
Indiana*$13,992$8,904$4,345$610$133
Iowa$6,573$3,226$2,359$967$21
Kansas$4,409$2,516$1,894N/AN/A
Kentucky$12,591$6,415$2,687$3,488$0
Louisiana*$10,956$6,861$4,095N/AN/A
Maine$3,765$2,351$1,414N/AN/A
Maryland$14,465$6,117$5,943$2,405$0
Massachusetts$22,980$10,465$10,100$1,858$556
Michigan$21,984$12,507$6,354$3,081$42
Minnesota$14,821$6,476$6,310$2,034$2
Mississippi$7,689$5,682$2,007N/AN/A
Missouri$13,861$8,793$5,067N/AN/A
Montana*$1,741$1,179$562N/AN/A
Nebraska$2,776$1,509$1,266N/AN/A
Nevada$4,124$2,004$1,092$1,029$0
New Hampshire$2,278$1,060$1,020$198$1
New Jersey$20,607$8,795$8,229$3,583$0
New Mexico$6,983$3,693$1,560$1,730$0
New York$86,485$37,759$36,143$9,265$3,317
North Carolina$18,669$12,379$6,290N/AN/A
North Dakota$1,273$557$535$179$2
Ohio$31,119$17,554$9,809$3,676$79
Oklahoma$7,388$4,750$2,638N/AN/A
Oregon$11,559$5,284$2,717$3,559$0
Pennsylvania$33,939$17,677$15,479$757$26
Rhode Island$3,659$1,518$1,481$660$0
South Carolina$8,809$6,240$2,569N/AN/A
South Dakota$1,204$689$515N/AN/A
Tennessee$12,895$8,443$4,452N/AN/A
Texas$48,556$28,854$19,702N/AN/A
Utah$3,266$2,311$955N/AN/A
Vermont$2,382$1,162$877$276$68
Virginia$11,685$5,936$5,750N/AN/A
Washington$16,420$5,914$5,702$4,751$52
West Virginia$5,349$3,282$1,311$755$0
Wisconsin$11,569$6,895$4,675N/AN/A
Wyoming$817$418$399N/AN/A
Total$748,267$384,829$279,775$78,761$4,902
NOTE:  *Alaska and Indiana expanded mid-2015 (Alaska on 9/1/15 and Indiana on 2/1/15). Louisiana and Montana have since expanded Medicaid (Louisiana on 7/1/16 and Montana on 1/1/16).  Due to rounding, spending amounts may not sum to subtotals or national total.SOURCE: Kaiser Commission on Medicaid and the Uninsured analysis of Medicaid spending data collected from the Medicaid Budget and Expenditure System (MBES), Centers for Medicare and Medicaid Services (accessed November 2016). https://www.medicaid.gov/medicaid/financing-and-reimbursement/state-expenditure-reporting/expenditure-reports/index.html

Endnotes

  1. Rachel Garfield, Melissa Majerol, Anthony Damico, and Julia Foutz, The Uninsured: A Primer – Key Facts about Health Insurance and the Uninsured in the Wake of National Health Reform (Washington, DC:  Kaiser Commission on Medicaid and the Uninsured, November, 2016), https://modern.kff.org/uninsured/report/the-uninsured-a-primer-key-facts-about-health-insurance-and-the-uninsured-in-the-wake-of-national-health-reform/ ↩︎
  2. Lisa Clemans-Cope, Urban Institute, John Holahan, and Rachel Garfield, Medicaid Spending Growth Compared to Other Payers: A Look at the Evidence (Washington, DC:  Kaiser Commission on Medicaid and the Uninsured, April, 2016), https://modern.kff.org/medicaid/issue-brief/medicaid-spending-growth-compared-to-other-payers-a-look-at-the-evidence/ ↩︎
  3. Changes between 2013 and 2016 reflect the conversion to use of Modified Adjusted Gross Income to determine financial eligibility under the ACA. In addition, a number of non-expansion states tie parent eligibility to a dollar value that does not regularly adjust. As such, its value as a percent of the FPL erodes over time as the FPL increases each year. ↩︎
  4. California data from “Medi-Cal Monthly Enrollment Fast Facts, June 2016,” California Department of Health Care Services, http://www.dhcs.ca.gov/dataandstats/statistics/Documents/Fast_Facts_June_2016_ADA.pdf. All ACA expansion adults are included as newly eligible in KCMU analysis. ↩︎
  5. Rachel Garfield, Anthony Damico, Cynthia Cox, Gary Claxton, and Larry Levitt, Estimates of Eligibility for ACA Coverage among the Uninsured in 2016. (Kaiser Family Foundation, October, 2016), https://modern.kff.org/uninsured/issue-brief/estimates-of-eligibility-for-aca-coverage-among-the-uninsured-in-2016/ ↩︎
  6. Robin A. Cohen, Ph.D., Michael E. Martinez, M.P.H., M.H.S.A., and Emily P. Zammitti, M.P.H., Health Insurance Coverage: Early Release of Estimates From the National Health Interview Survey, January–March 2016 (National Health Interview Survey Early Release Program, September 2016), http://www.cdc.gov/nchs/data/nhis/earlyrelease/insur201609.pdf ↩︎
  7. In some states that had expanded coverage to adults prior to the ACA, the new adult group includes some adults that were previously eligible through these pre-ACA expansions.  These adults may be matched at a rate lower than the 100% rate for 2014-2016. ↩︎
  8. Larisa Antonisse, Rachel Garfield, Robin Rudowitz, and Samantha Artiga, The Effects of Medicaid Expansion under the ACA: Findings from a Literature Review, (Washington, DC: Kaiser Commission on Medicaid and the Uninsured, June 2016), https://modern.kff.org/medicaid/issue-brief/the-effects-of-medicaid-expansion-under-the-aca-findings-from-a-literature-review/. ↩︎
  9. Ashley Kirzinger, Elise Sugarman, and Mollyann Brodie, Kaiser Health Tracking Poll: November 2016, (Kaiser Family Foundation, December, 2016), https://modern.kff.org/health-reform/poll-finding/kaiser-health-tracking-poll-november-2016/ ↩︎
News Release

New State Data: ACA Marketplace Enrollees Receiving Estimated $32.8 Billion in Tax Credits, Which Would be Eliminated Under Repeal of the ACA

Published: Dec 5, 2016

New state data from the Kaiser Family Foundation estimate that 9.4 million Americans who bought health plans through Affordable Care Act marketplaces will receive a total of about $32.8 billion in premium tax credits for 2016.

The data include estimates of the total amount of tax credits received in each state for 2016, based on the average tax credit per person and the number of ACA marketplace enrollees receiving tax credits as of March 31.

Under the health law, people with low or moderate incomes are eligible for tax credits that reduce monthly payments for insurance plans purchased through ACA marketplaces. A repeal of the health law would eliminate these subsidies.

Estimated Total Premium Tax Credits Received by Marketplace Enrollees (as of 3/31/2016)

estimated-total-premium-tax-credits-received-by-marketplace-enrollees-the-henry-j-kaiser-family-foundation


View state map of 2016 total premium tax credits received by ACA marketplace enrollees.

News Release

After the Election, the Public Remains Sharply Divided on Future of the Affordable Care Act

Published: Dec 1, 2016

Among Those Who Favor Repeal, Arguments About Loss of Coverage for Those with Pre-Existing Conditions Can Sway Some Opinions

Many Obamacare Provisions Remain Broadly Popular Across Party Lines, But Not its Mandate

The first Kaiser Health Tracking Poll since the 2016 election finds that Americans are largely divided on the future of the Affordable Care Act even though many of the law’s major provisions remain quite popular across party lines.

The new survey finds that one fourth (26%) of Americans want to see President-elect Donald Trump and the next Congress repeal the entire law, and an additional 17 percent want them to scale back what the law does. This compares to 30 percent of the public who want to see the law expanded and 19 percent who want to see lawmakers move forward with implementing the law as it is.

november-poll1

The poll captures a slight uptick in the share of Americans who want lawmakers to scale back the law as well as a decrease in the share who want lawmakers to repeal the entire law.  This is largely driven by Republicans: About half (52%) of Republicans now say they want to see the Affordable Care Act repealed, down from 69 percent in October. At the same time, a quarter (24%) of Republicans now want to see the law scaled back, up from 11 percent in October.

Among the quarter (26%) of Americans that want to see the Affordable Care Act repealed, 31 percent want to see the health care law just repealed and not replaced. About two-thirds wants lawmakers to repeal the health care law and replace it with a Republican-sponsored alternative, with 42 percent wanting lawmakers to wait to repeal it until the details of a replacement plan have been figured out and 21 percent wanting lawmakers to repeal it immediately and figure out a replacement plan later.

Among those who want the law repealed, 38 percent (or 10% of the public overall) change their opinion after hearing the argument that repealing the ACA would mean that insurance companies could deny coverage to people with pre-existing conditions. A slightly smaller share change their opinion after hearing that more than 20 million Americans could lose their coverage.

Public supports many specific Obamacare provisions, but not the individual mandate

While President-elect Donald Trump and Republican leaders in Congress work on a replacement to the Affordable Care Act, the new poll finds many of the law’s specific provisions remain popular even among President-elect Trump’s supporters, potentially complicating the path ahead.

For example, majorities of Republicans, Democrats and independents alike say they favor:

  • Allowing young adults to stay on their parents’ insurance plans until age 26 (85% of the public, including 82% of Republicans);
  • Eliminating out-of-pocket costs for many preventive services (83% of the public, including 77% of Republicans);
  • Providing financial help to low- and moderate-income Americans who don’t get insurance through their jobs to help them purchase coverage (80% of the public, including 67% of Republicans);
  • Giving states the option of expanding their existing Medicaid programs to cover more uninsured low-income adults (80% of the public, including 67% of Republicans); and
  • Prohibiting insurance companies from denying coverage because of a person’s medical history (69% of the public, including 63% of Republicans).

In contrast, a third (35%) of the public says they favor the law’s provision requiring that nearly all Americans have health coverage or pay a fine (63% have an unfavorable view).  A majority of Democrats (57%) favor this provision but far fewer independents (30%) and Republicans (21%) do.

november-poll2

Support for the law’s requirement that employers with at least 50 workers offer health insurance or pay a fine is more mixed, with a majority of the public (60%) supporting it, including majorities of Democrats and independents. In contrast, just 45 percent of Republicans favor this provision.

Overall attitudes towards the Affordable Care Act are largely unchanged following the election: 45 percent of the public has an unfavorable view and 43 percent has a favorable view. In addition, the poll finds health care played a limited role in voters’ 2016 election decisions, with 8 percent of voters saying health care was the biggest factor in their vote.

As many say repeal would worsen their family’s health care costs as say it would improve

Americans are divided on how repeal would affect health care costs for them and their family, with nearly equal shares saying repealing the law would make costs worse (30%) as saying it would make costs better (27%). Another four in 10 say their health care costs would be about the same. Most also say that, under repeal, they would expect their quality of care and access to health insurance to remain about the same.

Importantly, Trump voters are much more likely to say repeal would help them personally. Half (52%) of those who supported Trump say the cost of health care for them and their family will get better under repeal, and many say the quality of their health care (39%) and their ability to get and keep health insurance (35%) would get better.

The poll also probes the public’s views of whether President-elect Trump’s health care policies would be bad or good for different groups of Americans. The public is more likely to predict “bad” results for the uninsured (43%), lower-income Americans (43%) and women (36%), and more likely to predict “good” results for wealthy Americans (39%).

Designed and analyzed by public opinion researchers at the Kaiser Family Foundation, the poll was conducted from November 15-21 among a nationally representative random digit dial telephone sample of 1,202 adults. Interviews were conducted in English and Spanish by landline (422) and cell phone (780). The margin of sampling error is plus or minus 3 percentage points for the full sample. For results based on subgroups, the margin of sampling error may be higher.

Poll Finding

Kaiser Health Tracking Poll: November 2016

Authors: Ashley Kirzinger, Elise Sugarman, and Mollyann Brodie
Published: Dec 1, 2016

Findings

KEY FINDINGS:

  • The November Kaiser Health Tracking Poll, conducted one week after the 2016 presidential election, finds health care played a limited role in voters’ 2016 election decisions, with larger shares of voters saying the biggest factor in their vote was the direction of the country (31 percent), Donald Trump’s personal characteristics (15 percent), jobs and the economy (15 percent), or Hillary Clinton’s personal characteristics (12 percent), than who say the same about health care (8 percent).
  • While health care was not a leading factor in voters’ presidential decisions, President-elect Trump and Republican lawmakers have made it clear that one of their top priorities is the repeal of the 2010 health care law. Americans are divided on what they want to see lawmakers do to the ACA with one-fourth of Americans (26 percent) wanting to see President-elect Donald Trump and the next Congress repeal the entire law while an additional 17 percent want them to scale back what the law does. This is compared to 30 percent of the public who want to see the law expanded and 19 percent who want to see lawmakers move forward with implementing the law as it is. Among Trump voters, 50 percent want to see the law repealed and 29 percent want to see it scaled back.
  • While President-elect Trump and Republican members of Congress work on a replacement to the ACA, this month’s survey finds that many of the law’s major provisions continue to be quite popular, even across party lines. The notable exception is the requirement that nearly all Americans have health insurance or else pay a fine.
  • Among Trump voters, 52 percent say the cost of their health care will get better, 39 percent say the quality of their health care will get better, and 35 percent say their ability to get and keep health insurance will get better if the 2010 health care law is repealed. In general, the majority of Trump voters say President-elect Trump’s health care policies will be good for the country as a whole (71 percent) and good for them and their families (59 percent).

Health Care in the 2016 Election

Many factors were important to voters’ choices in the 2016 presidential election, with over two-thirds of voters stating that the direction the country is headed (82 percent), jobs and economy (75 percent), and health care (68 percent) were a “major factor” in their vote. Majorities also cite foreign policy (63 percent), terrorism (61 percent), immigration (58 percent), and candidates’ personal characteristics (56 percent for Clinton’s and 54 percent for Trump’s) as “major factors.” When voters are asked to select the “biggest factor” in their vote for president, the direction of the country (31 percent), Donald Trump’s personal characteristics (15 percent), jobs and the economy (15 percent), and Hillary Clinton’s personal characteristics (12 percent) rank above health care (8 percent).

Figure 1: The Most Important Factors to Voters in the 2016 Presidential Election

Biggest Factor for Trump Voters and Clinton Voters

Among voters who supported Republican nominee Donald Trump, four in ten (38 percent) say the direction the country is headed was the “biggest factor” in their vote while about one-third of Clinton voters say Trump’s personal characteristics was the “biggest factor.” For both Trump and Clinton voters, it appears health care is a second-tier issue, with about one in ten saying it was the “biggest factor” (7 percent and 10 percent, respectively).

Figure 2: Biggest Factor in Vote for Trump: Direction Country Is Headed; Biggest Factor in Vote for Clinton: Trump

President-elect Trump and Health Care

While health care was not a leading factor in voters’ decisions in the 2016 presidential election, President-elect Trump and Republican lawmakers in Congress have said they would like to move quickly in 2017 on several health care issues – including most notably, the repeal and replacement of the Affordable Care Act.

The November survey, conducted after the 2016 election, finds overall public opinion towards the 2010 health care law is stable from previous months, with similar shares of the public saying they have an unfavorable opinion (45 percent) as say they have a favorable opinion (43 percent) of the law.

Figure 3: Public Divided on View of the Health Care Law

Repealing the Affordable Care Act

During the past six years, Republican lawmakers in Congress have voted to repeal parts or all of the 2010 health care law more than fifty times1 , only to have efforts blocked by either Democrats or President Obama. Now, with Republicans controlling both the executive branch and Congress, lawmakers have reaffirmed their commitment to repealing the Affordable Care Act. One-fourth (26 percent) of Americans want to see President-elect Trump and Congress repeal the entire law, and an additional 17 percent want them to scale back what the law does. This is compared to 30 percent of the public who want to see the law expanded and 19 percent who want to see lawmakers move forward with implementing the law as it is.

Figure 4: Americans Divided on ACA Next Steps
Vast Majority of Trump Voters Have Unfavorable Views of ACA, Half Want Law Repealed

Focusing specifically on voters who supported Republican nominee Donald Trump, the majority have an unfavorable view of the health care law with 63 percent having a “very unfavorable” opinion and an additional 18 percent having a “somewhat unfavorable” opinion. This is compared to 79 percent of Clinton voters who have a favorable view of the law (40 percent have a “very favorable” and 39 percent have a “somewhat favorable” view).

Table 1: Voters’ Attitudes Towards the ACA
As you may know, a health reform bill was signed into law in 2010. Given what you know about the health reform law, do you have a generally favorable or generally unfavorable opinion of it?All votersTrump votersClinton voters
Favorable (NET)45%15%79%
          Very favorable20540
          Somewhat favorable251039
Unfavorable (NET)508118
          Very unfavorable33635
          Somewhat unfavorable171813
Don’t know/Refused544

In addition, half of Trump voters want to see the law repealed, three in ten (29 percent) want President-elect Trump and the next Congress to scale back what the law does, 5 percent want lawmakers to move forward with implementing the law as it is, and one in ten want them to expand what the law does.

Figure 5: Half of Trump Voters Want to See ACA Repealed

Republicans May Be Shifting Attitudes on ACA from Repeal to Scale Back

The November Kaiser Health Tracking Poll finds a slight uptick in the share of Americans who want lawmakers to scale back the law (17 percent compared to 9 percent last month) as well as a decrease in the share who want lawmakers to repeal the entire law (26 percent compared to 32 percent in October).

The shift in attitudes is largely driven by Republicans, with about half (52 percent) of Republicans saying they want the ACA to be repealed this month, down from 69 percent in October. At the same time, there was a corresponding increase in the share of Republicans who want lawmakers to scale back what the law does, from 11 percent to 24 percent.

Figure 6: Since Election, Fewer Republicans Say They Want ACA Repealed While More Say They Want It Scaled Back

Republican-Sponsored Alternative to the ACA

Republican members of Congress, including House Speaker Paul Ryan, have suggested alternative health reform plans to the ACA. Among those who want to see the ACA repealed (26 percent of total population), 31 percent want to see the health care law just repealed and not replaced. Two-thirds want lawmakers to repeal the health care law and replace it with a Republican-sponsored alternative, including 42 percent who want lawmakers to wait to repeal until the details of a replacement plan have been figured out and 21 percent who want them to repeal the law immediately and figure out a replacement plan later.

Figure 7: Among Those Who Want ACA Repealed, Two-Thirds Want It Replaced with Republican-Sponsored Alternative

These results are similar among Trump voters who want lawmakers to repeal the law, with about two-thirds wanting lawmakers to repeal the health care law and replace it with a Republican-sponsored alternative.

Among Those Who Want to See ACA Expanded or Repealed, Some Attitudes Are Malleable

Among Americans who have the most polarized attitudes towards the ACA – those who want to see it expanded or repealed – some attitudes can be swayed after hearing arguments for or against repeal or expansion of the law. Among those who want to see the ACA repealed, 38 percent (meaning 10 percent of the public overall) change their opinion after hearing the argument made by proponents that repealing the ACA would mean that insurance companies would be able to deny coverage to people with pre-existing conditions. A slightly smaller share (19 percent of those who wanted to see the law repealed, 5 percent, overall) change their opinion after hearing that more than 20 million Americans who have gotten health insurance through the health care law could lose their coverage if the law was repealed. Trump voters react similarly, with a larger share changing their opinion after hearing that repealing the ACA would mean that insurance companies would be able to deny coverage to people with pre-existing conditions (27 percent) than changing their opinion after hearing that more than 20 million Americans could lose their coverage (8 percent).

Figure 8: Among the 26 Percent Who Want the ACA Repealed, Some Attitudes Are Malleable

On the other hand, among those who want to see the ACA expanded, one-fifth change their opinion after hearing that federal health care spending in the U.S. would increase if the law was expanded (6 percent, overall).

Figure 9: Among the 30 Percent Who Want the ACA Expanded, One-Fifth Can Be Swayed

Americans Have Favorable Attitudes towards Some ACA Provisions

While President-elect Trump and Republican members of Congress make efforts to repeal the ACA, many of the law’s major provisions continue to be quite popular, even across party lines.

Table 2: Americans’ Opinions of ACA Provisions
Percent who say they have a FAVORABLE opinion of each of the following provisions of the law:TotalDemocratsIndependentsRepublicans
Allows young adults to stay on their parents’ insurance plans until age 2685%90%85%82%
Eliminates out-of-pocket costs for many preventive services83898377
Closes the Medicare prescription drug “doughnut hole” so people on Medicare will no longer be required to pay the full cost of their medications81868969
Creates health insurance exchanges where small businesses and people can shop for insurance and compare prices and benefits80908072
Provides financial help to low- and moderate-income Americans who don’t get insurance through their jobs to help them purchase coverage80918167
Gives states the option of expanding their existing Medicaid program to cover more low-income, uninsured adults80907967
Prohibits insurance companies from denying coverage because of a person’s medical history69756563
Increases the Medicare payroll tax on earnings for upper-income Americans69826363
Requires employers with 50 or more employees to pay a fine if they don’t offer health insurance60836045
Requires nearly all Americans to have health insurance or else pay a fine35573021
Note: Some items asked of half samples. Question wording abbreviated. See topline for full question wording.

For example, large shares of Americans – including at least eight in ten overall and at least eight in ten Democrats, Republicans, and independents – have a favorable view of the fact that the law allows young adults to stay on their parents’ insurance plans up to age 26.

Figure 10: Across Party Lines, Americans Favor Allowing Those Under 26 to Stay on Their Parents’ Insurance

In addition, at least seven in ten Democrats, Republicans, and independents have a favorable view of the provisions that eliminate out-of-pocket costs for preventive services and create health insurance exchanges or marketplaces where small businesses and people who don’t get coverage through their employers can shop for insurance and compare prices and benefits.

Other provisions of the ACA including those that close the Medicare “doughnut hole” for prescription drug coverage, provide financial help to low- and moderate-income Americans to help them purchase coverage, and give states the option of expanding Medicaid are favored by the vast majority of Democrats and independents, and at least six in ten Republicans. Fewer, but still a majority of Democrats, Republicans, and independents, favor the fact that the law prohibits insurance companies from denying coverage based on pre-existing conditions and establishes the Medicare payroll tax on earnings for upper-income Americans.

The provision that requires employers with 50 or more employees pay a fine if they do not offer health insurance to their employees is favored by a majority of Democrats and independents (83 percent and 60 percent, respectively) but by fewer than half of Republicans (45 percent). The glaring exception to the popularity of individual provisions of the law is the requirement that nearly all Americans have health insurance or pay a fine, which is viewed unfavorably by about two-thirds of the public.

Figure 11: Majority of Republicans and Independents Have Unfavorable View of ACA’s Individual Mandate

Majority of Trump Voters Have Favorable Attitudes Towards Many ACA Provisions

Many of the ACA’s major provisions are also quite popular among Trump voters, with more than seven in ten having favorable attitudes towards the provisions that allow young adults to stay on their parents’ insurance plans up to age 26 and eliminate out-of-pockets costs for preventive services. In addition, at least two-thirds of Trump voters also favor the fact that the law creates health insurance exchanges or marketplaces where small businesses and people who don’t get coverage through their employers can shop for insurance and compare prices and benefit (72 percent), closes the Medicare prescription drug coverage gap (71 percent), provides financial help to low- and moderate-income Americans to buy health insurance (68 percent), and gives states the option of expanding Medicaid to cover more low-income, uninsured adults (66 percent).

Figure 12: Majority of Trump Voters Have Favorable Opinion of Many ACA Provisions

Perceived Impact of Health Care Changes on Americans

Most Say Changes to Health Care Law Will Not Impact Them, But Some Concern For How Trump’s Health Care Policies Could Affect At-Risk Populations

When asked how a repeal of the 2010 health care law would affect the quality of and access to health care, most Americans say the quality of their own health care as well as their own ability to get and keep health insurance would stay about the same (57 percent and 55 percent, respectively). Americans are more divided on how a repeal of the ACA would affect health care costs for them and their family with 30 percent saying the cost of their health care would get worse, 27 percent saying it would get better, and 40 percent saying it would stay about the same.

Figure 13: Most Say ACA Repeal Will Not Affect Their Health Care Access or Quality of Care

Among Trump voters, 52 percent say the cost of their health care will get better, 39 percent say the quality of their health care will get better, and 35 percent say their ability to get and keep health insurance will get better if the 2010 health care law is repealed.

Some Concern That President-elect Trump’s Health Care Policies Will be Bad for Women, Uninsured, and Lower-Income Americans

A large share of Americans do not think that President-elect Trump’s health care policies will make much of a difference to many groups (wealthy Americans, men, and them and their family). The public is less positive about how other groups – including the uninsured, lower-income Americans, and women – will fare. About four in ten Americans think President-elect Trump’s health care policies will be “bad” for the uninsured (43 percent), lower-income Americans (43 percent), and women (36 percent). Attitudes are more split on how individuals with a pre-existing condition, seniors, middle-class Americans, and the country as a whole will fare, with similar shares saying Trump’s health care policies will be good, bad, or not make much of a difference to these groups.

Figure 14: Americans Vary in Views on How President-Elect Trump’s Health Care Policies Will Affect Certain Groups

The majority of Trump voters say President-elect Trump’s health care policies will be good for the country as a whole (71 percent) and good for them and their families (59 percent). This is compared to 7 percent of Clinton voters who say his health care policies will be good for the country as a whole and 5 percent who say his policies will be good for them and their families.

Figure 15: Majority of Trump Voters Say His Health Care Policies Will Be Good for Country and for Them and Their Families

Kaiser Health Policy News Index: November 2016

The November Kaiser Health Tracking Poll finds the Republican nominee Donald Trump’s election as the 45th president of the United States dominated the public’s attention during the past month with eight in ten Americans (82 percent) closely following news about his presidential campaign win. Other stories that captured the attention of Americans include the conflict involving ISIS in Mosul, Iraq (71 percent) and the top health policy story this month – Republican plans to repeal the ACA (70 percent). Fewer Americans report following three additional health policy stories: news about rising prescription drug costs (59 percent), reports about rising ACA health insurance premiums (55 percent), and the ACA’s fourth open enrollment period (45 percent).

Figure 16: Kaiser Health Policy News Index: November 2016

Methodology

This Kaiser Health Tracking Poll was designed and analyzed by public opinion researchers at the Kaiser Family Foundation (KFF). The survey was conducted November 15-21, 2016, among a nationally representative random digit dial telephone sample of 1,202 adults ages 18 and older, living in the United States, including Alaska and Hawaii (note: persons without a telephone could not be included in the random selection process). Computer-assisted telephone interviews conducted by landline (422) and cell phone (780, including 467 who had no landline telephone) were carried out in English and Spanish by Princeton Data Source under the direction of Princeton Survey Research Associates International (PSRAI). Both the random digit dial landline and cell phone samples were provided by Survey Sampling International, LLC. For the landline sample, respondents were selected by asking for the youngest adult male or female currently at home based on a random rotation. If no one of that gender was available, interviewers asked to speak with the youngest adult of the opposite gender. For the cell phone sample, interviews were conducted with the adult who answered the phone. KFF paid for all costs associated with the survey.

The combined landline and cell phone sample was weighted to balance the sample demographics to match estimates for the national population using data from the Census Bureau’s 2014 American Community Survey (ACS) on sex, age, education, race, Hispanic origin, and region along with data from the 2010 Census on population density. The sample was also weighted to match current patterns of telephone use using data from the July-December 2015 National Health Interview Survey. The weight takes into account the fact that respondents with both a landline and cell phone have a higher probability of selection in the combined sample and also adjusts for the household size for the landline sample. All statistical tests of significance account for the effect of weighting.

The margin of sampling error including the design effect for the full sample is plus or minus 3 percentage points. Numbers of respondents and margins of sampling error for key subgroups are shown in the table below. For results based on other subgroups, the margin of sampling error may be higher. Sample sizes and margins of sampling error for other subgroups are available by request. Note that sampling error is only one of many potential sources of error in this or any other public opinion poll. Kaiser Family Foundation public opinion and survey research is a charter member of the Transparency Initiative of the American Association for Public Opinion Research.

GroupN (unweighted)M.O.S.E.
Total1202±3 percentage points
Half Sample A599±5 percentage points
Half Sample B603±5 percentage points
Voters in the 2016 Election
   Total Voters948±4 percentage points
   Trump Voters364±6 percentage points
   Clinton Voters408±6 percentage points
Party Identification
   Democrats403±6 percentage points
   Republicans316±6 percentage points
   Independents346±6 percentage points

Endnotes

  1. USA Today, Obama vetoes GOP attempt to repeal Obamacare, January 2016. http://www.usatoday.com/story/news/politics/2016/01/08/obama-vetoes-gop-attempt-repeal-obamacare/78506800/     ↩︎

Paying a Visit to the Doctor: Current Financial Protections for Medicare Patients When Receiving Physician Services

Author: Cristina Boccuti
Published: Nov 30, 2016

Issue Brief

Under current law, Medicare has several financial protections in place that are designed to safeguard Medicare beneficiaries—seniors and people with permanent disabilities—from unexpected and confusing charges when they seek care from doctors and other practitioners.  These protections include the participating provider program, limitations on balance billing, and conditions on private contracting.  This issue brief describes these three protections, explains why they were enacted, and examines the implications of modifying them for beneficiaries, providers, and the Medicare program.

Main Findings

  • The participating provider program was enacted in 1984 for two purposes: (1) to assist Medicare patients with identifying and choosing providers who charge Medicare-approved rates; and (2) to encourage providers to accept these rates. Given this program’s strong provider incentives, the number of participating providers grew rapidly across all states and today, the vast majority (96%) of eligible physicians and practitioners are “participating providers”—agreeing to charge Medicare’s standard fees when they see beneficiaries.
  • The Congress instituted limitations on balance billing in 1989, in conjunction with implementation of the Medicare physician fee schedule. This financial protection limits the amount that “non-participating” providers may charge beneficiaries through balance billing—whereby beneficiaries are responsible for the portion of the provider’s charge that exceeds Medicare’s fee-schedule rate. Total out-of-pocket liability from balance billing has declined significantly over the past few decades dropping from $2.5 billion in 1983 ($5.65 billion in 2011 dollars) to $40 million in 2011.
  • In 1997, the Congress codified several conditions for private contracting that apply to physicians and practitioners who “opt out” of Medicare and see beneficiaries only under individual private contracts. These restrictions were instituted to ensure that beneficiaries are aware of the financial ramifications of entering into these private contracts, and to safeguard patients and Medicare from fraud and abuse.  In general, private contracting is relatively rare with only 1 percent of practicing physicians opting out of Medicare.

Background: Current Provider Options for Charging Medicare Patients

Under current law, physicians and practitioners have three options for how they will charge their patients in traditional Medicare.  They may register with Medicare as (1) a participating provider, (2) a non-participating provider, or (3) an opt-out provider who privately contracts with each of his or her Medicare patients for payment (Figure 1).  This issue brief describes these three options and then examines three current provisions in Medicare that provide financial protections for Medicare beneficiaries.

Participating providers:  Physicians and practitioners who register with Medicare as participating providers agree to “accept assignment” for all of their Medicare patients. Accepting assignment entails two conditions: agreeing to accept Medicare’s fee-schedule amount as payment-in-full for a given service and collecting Medicare’s portion directly from Medicare, rather than the patient. Therefore, when Medicare patients see participating providers, they can be certain that these providers will not charge fees higher than Medicare’s published fee-schedule amount and that they will not face higher out-of-pocket liability than the maximum 20-percent coinsurance for most services. The vast majority (96%) of providers who provide Medicare-covered services are participating providers.

Non-participating providers:  Non-participating providers do not agree to accept assignment for all of their Medicare patients; instead they may choose—on a service-by-service basis—to charge Medicare patients higher fees, up to a certain limit. When doing so, their Medicare patients are liable for higher cost sharing to cover the higher charges. This arrangement is called “balance billing” and means that the Medicare patient is financially responsible for the portion of the provider’s charge that is in excess of Medicare’s assigned rate, in addition to standard applicable coinsurance and deductibles for Medicare services.  When non-participating providers do not accept assignment, they may not collect reimbursement from Medicare; rather, they bill the Medicare patient directly, typically up front at the time of service. Non-participating providers must submit claims to Medicare on behalf of their Medicare patients, but Medicare reimburses the patient, rather than the nonparticipating provider, for its portion of the covered charges.  A small share (4%) of providers who provide Medicare-covered services are non-participating providers.

Opt-out providers, privately contracting:  Physicians and practitioners who choose to enter into private contracts with their Medicare patients “opt-out” of the Medicare program entirely. These opt-out providers may charge Medicare patients any fee they choose. Medicare does not provide any reimbursement—either to the provider or the Medicare patient—for services provided by these providers under private contracts. Accordingly, Medicare patients are liable for the entire cost of any services they receive from physicians and practitioners who have opted out of Medicare. Several protections are in place to ensure that patients are clearly aware of their financial liabilities when seeing a provider under a private contract.  An extremely small portion of physicians (less than 1% of physicians in clinical practice) have chosen to “opt-out” of the Medicare program, of whom 42 percent are psychiatrists.

These provider options have direct implications on the charges and out-of-pocket liabilities that beneficiaries face when they receive physician services (Figure 2).  They also play a major role in several financial protections in current law—namely, the physician participation program, limitations on balance billing, and conditions for private contracting—which help beneficiaries understand the financial implications of their provider choices and encourage providers to accept Medicare’s standard fees.

Figure 1: Physician/Practitioner Billing Options in Traditional Medicare
Figure 2: Medicare reimbursement and beneficiary cost-sharing for a $100 fee-schedule service

Medicare’s Participating Provider Program

Medicare’s participating provider program includes several incentives (both financial and nonfinancial) to encourage physicians and practitioners to “accept assignment” for all of their Medicare patients.  When providers accept assignment, they agree to accept Medicare’s fee-schedule amount as payment-in-full for a given service and are allowed to bill Medicare directly for its portion of the reimbursement.  Physicians and practitioners who agree to accept assignment on all services that they provide to Medicare patients are “participating providers” and are listed in Medicare provider directories.  Beneficiaries who select a participating provider are assured that, after meeting the deductible, their coinsurance liability will not exceed 20 percent of the charge for the services they receive (Figure 2).

Congress established the participating provider program in the 1984 Deficit Reduction Act (DEFRA) to address two main concerns: confusion among beneficiaries about the fees they were being charged when they saw a doctor and escalating rates of balance billing from charges that exceeded Medicare’s established “usual, customary, and reasonable” rates for their area.1  At that time, aside from Medicaid-eligible beneficiaries, Medicare had no limits on the amount that physicians and practitioners could balance bill for their services. Surveys conducted by the Physician Payment Review Commission (PPRC), a congressional advisory body and predecessor of the Medicare Payment Advisory Commission (MedPAC), revealed that prior to the participating provider program, beneficiaries often did not know from one physician to the next whether they would face extra out-of-pocket charges due to balance billing and how much those amounts might be.2   By 1984, beneficiaries’ payment for balance billing reached 27 percent of total Medicare Part B out-of-pocket liability and was jeopardizing their access to affordable physician services.3 

The establishment of the participating provider program in Medicare instituted multiple incentives to encourage providers to accept assignment for all their patients and become participating providers.  For example, Medicare payment rates for participating providers are 5 percent higher than the rates paid to non-participating providers.  Also, participating providers may collect Medicare’s reimbursement amount directly from Medicare, in contrast to non-participating providers who may not collect payment from Medicare and typically bill their Medicare patients upfront for their charges.  (Non-participating providers must submit claims to Medicare so that their patients are reimbursed for Medicare’s portion of their charges.) Participating providers also gain the benefit of having electronic access to Medicare beneficiaries’ supplemental insurance status, such as their Medigap coverage. This information makes it considerably easier for providers to file claims to collect beneficiary coinsurance amounts, as well as easing the paperwork burden on patients.  Additionally, Medicare helps beneficiaries in traditional Medicare seek and select participating providers by listing them by name with their contact information on Medicare’s consumer-focused website (www.Medicare.gov).

Given the strong incentives of the participation program, combined with limits on balance billing (discussed in the next section), it is not surprising that the share of physicians and practitioners electing to be participating providers has risen to high levels across the country. Overall, the rate of providers with participation agreements has grown to 96 percent in 2011, up considerably from about 30 percent in 1986, two years after the start of the participating provider program (Figure 3).4   As a result, across all states, most beneficiaries now encounter predictable expenses for Medicare-covered services, and are never responsible for Medicare’s portion of the fee (Appendix 1).

Figure 3: Strong incentives in Medicare have led to a high rate of “participating providers”

Medicare’s Balance Billing Limitations

Despite the incentives to become participating providers, a small share (4%) of physicians and practitioners who are registered with Medicare are non-participating providers. These providers can—on a service-by-service basis—charge patients in traditional Medicare higher fees than Medicare’s fee-schedule amount, up to a specified maximum. When charging higher fees, beneficiaries are responsible for the difference between Medicare’s approved amount and the providers’ total charge—essentially the balance of the bill remaining after accounting for Medicare’s reimbursement. This higher cost-sharing arrangement is called “balance billing” and means that the Medicare patient is financially liable for not only the applicable coinsurance and deductible, but also for any amount in which the provider’s charge exceeds Medicare’s assigned rate. Providers may not balance bill Medicare beneficiaries who also have Medicaid coverage.5 

When non-participating providers balance bill, they bill the beneficiary directly, typically for the full charge of the service—including Medicare’s share, applicable coinsurance and deductible, and any balance billed amount.  Non-participating providers are then required to submit a claim to Medicare, so that Medicare can process the claim and reimburse the patient for Medicare’s share of the charge.  Two Medigap insurance policies, which beneficiaries may purchase to supplement their Medicare coverage, include coverage for balance billing.6   Balance billing is prohibited for Medicare-covered services in the Medicare Advantage program, except in the case of private fee-for-service plans.

In traditional Medicare, the maximum that non-participating providers may charge for a Medicare-covered service is 115 percent of the discounted fee-schedule amount. (Medicare’s fee-schedule rates for non-participating physicians are reduced by five percent.)  Accordingly, non-participating providers may bill Medicare patients up to 9.25 percent more than participating providers (i.e., 1.15 x 0.95= 109.25).  If the non-participating physician or practitioner balance bills the maximum amount permitted (not including any unmet deductible), total beneficiary liability for Medicare-covered services is about 33 percent of Medicare’s regular fee schedule amount (Figure 2).

Balance billing limitations were implemented in conjunction with the institution of Medicare’s physician fee-schedule in the Omnibus Budget Reconciliation Act of 1989.  At the time, Medicare’s charge-based methodology for physician services gave rise to rapid spending growth and confusion among beneficiaries about what charges they would face for physician services.7  Moreover, high cost-sharing liabilities weighed disproportionately on beneficiaries who were sickest and used the most physician services. Despite physician reports that they took patient incomes into account when determining whether to charge higher-than Medicare rates, PPRC research did not find a relationship between beneficiary income and the probability that claims would be assigned.8 

While the Congress constrained growth in provider fees through the implementation of the fee schedule, it also implemented maximum “limiting charges” to establish further certainty and predictability for patients on their expected costs for services. In trying to rein in Medicare fee-schedule payments, the Congress sought to protect beneficiaries from excess charges that providers could otherwise impose in response to restrictions on their fees.9 

The continued desire to protect beneficiary spending during the implementation of the new physician fee schedule gave rise to the question of whether Congress might consider imposing even greater restrictions on balance billing or even mandate assignment (prohibiting balance billing) for all claims.10  Ultimately, the rationale in Congress for allowing limited balance billing was that it would provide for:  (1) a “safety valve” for physicians who believed that the fee schedule did not adequately reflect the quality of services that they provided; (2) a means to correct any underpricing of resource costs in the fee schedule; and (3) necessary financial protections for beneficiaries, particularly in areas of the country where choice of physicians was limited.11 

As limits on balance billing were implemented and incentives for physicians and practitioners to take assignment took hold, beneficiary liability for balance billing declined dramatically.  CMS data show that in 2011, total balance billing amounted to $40 million, down significantly from $2.5 billion in 1983, (which equals $5.6 billion in 2011 dollars) (Figure 4).  Concurrently, the rate of assigned claims to total covered charges climbed from 51% in 1983 to 99% in 2011.

Figure 4: Balance billing in Medicare has declined significantly; almost all physician services are now paid on assignment

Private Contracting Conditions for Providers who Opt Out of Medicare

A very small share of providers (less than 1 percent of physicians) have elected to “opt out” of Medicare and contract privately with all of their Medicare patients, individually.12  Their fees are not bound by Medicare’s physician fee schedule in any way, which means that these providers have no limits on the amounts they may charge beneficiaries for their services.  Medicare does not reimburse either the provider or the patient for any services furnished by opt-out providers.  Therefore, Medicare patients are financially responsible for the full charge of services provided by providers who have formally opted out of Medicare.13 

Serving as beneficiary protections, several important conditions exist for providers who elect to contract privately with Medicare patients. One condition is that prior to providing any service to Medicare patients, physicians and practitioners must inform their Medicare patients that they have opted out of Medicare and provide their Medicare patients with a written document stating that Medicare will not reimburse either the provider or the patient for any services furnished by opt-out providers. Their Medicare patients must sign this document to signify their understanding of it and their right to seek care from a physician or other practitioner who has not opted-out of Medicare.

Providers opt-out by submitting a signed affidavit to Medicare agreeing to applicable terms and affirming that their contracts with patients include all the necessary information.  Physicians or practitioners who opt out of Medicare must privately contract with all of their Medicare patients, not just some.  Once a physician or practitioner opts out of Medicare, this status lasts for a two-year period and is automatically renewed unless the physician or practitioner actively cancels it.14   Providers may not enter into a private contract with a beneficiary who also has Medicaid benefits or who is experiencing an urgent or emergent health care event. 15 

These conditions, which provide protections for both beneficiaries and the Medicare program, were included in the Balanced Budget Act of 1997 as part of the legislation that first codified physicians’ ability to privately contract with Medicare beneficiaries.  Requiring opt-out providers to privately contract for all services they provide to Medicare patients (rather than being able to select by individual patients or services) was intended to prevent confusion among Medicare patients as to whether or not each visit would be covered under Medicare and how much they could expect to pay out-of-pocket.  Similarly, requiring providers to opt out for a minimum period of time—two years—was intended to ensure that beneficiaries had consistent information to make knowledgeable choices when selecting their physicians.  Both of these provisions also addressed Medicare’s duty to guard against fraudulent billing in an administratively feasibly manner.  If, for example, physicians contracted with only some of their patients and/or services, Medicare would have to examine each contract for each submitted claim to discern which claims were eligible for Medicare reimbursement and which were not.

Previous Kaiser Family Foundation analysis shows that psychiatrists are disproportionately represented among the 0.7 percent of physicians (4,863) who have opted out of Medicare—comprising 42 percent of all physicians who have opted out (Figure 5).16   Another 1,775 clinical professionals with non-physician doctorate degrees (i.e. oral surgeon dentists, podiatrists, and optometrists) also have opted-out of the Medicare program.17  Dentists who are oral surgeons comprise the majority of this group (95%).  Earlier research that examined opt-out providers through 2002 found similarly low numbers of providers opting out (2,839) as well as relatively higher opt-out rates among psychiatrists compared with other specialties.18 

Some physician organizations attribute physician decisions to opt out of Medicare to frustration with Medicare’s fees and regulations.19  Others have noted a similar trend in physician refusal to work with any insurers—including commercial insurance plans—especially in prosperous communities. 20  In these cases, providers require patients to pay them directly out-of-pocket, leaving the patient to seek reimbursement, if any, from their insurer.  For providers with patients who have the resources to make the payments, this billing method significantly reduces providers’ paperwork.

Figure 5: Less than 1% of physicians in patient care have formally “opted out” of Medicare, with psychiatrists making up the largest share
SpecialtyNumber of physicians in patient care, 20101Percent of  physicians in specialtyNumber of Medicare opt-out providers, 20132Percent of Medicare opt-out providers  in specialtyPercent of total opt-out providers
Physicians
Addiction MedicineNA40.1%
Allergy/Immunology3,6680.5%351.0%0.7%
Anesthesiology36,4625.4%300.1%0.6%
Cardiovascular Disease/Cardiology19,6372.9%290.1%0.6%
Colorectal Surgery/ProctologyNA10.0%
Dermatology10,1011.5%961.0%2.0%
Emergency Medicine30,0944.4%530.2%1.1%
Endocrinology4,5020.7%320.7%0.7%
Family Medicine/General  Practice97,77914.4%7020.7%14.4%
Gastroenterology11,5501.7%200.2%0.4%
General Surgery21,8963.2%410.2%0.8%
Geriatric Medicine3,3670.5%50.1%0.1%
Hand SurgeryNA30.1%
Hematology/Oncology10,2611.5%140.1%0.3%
Infectious Disease5,0070.7%100.2%0.2%
Internal Medicine93,38113.8%4470.5%9.2%
Maxillofacial SurgeryNA2455.0%
Nephrology7,0201.0%20.0%0.0%
Neurology10,7481.6%470.4%1.0%
Neurosurgery4,5050.7%360.8%0.7%
Obstetrics/Gynecology36,9785.5%3751.0%7.7%
Ophthalmology16,5982.4%300.2%0.6%
Orthopedic Surgery18,6252.7%1400.8%2.9%
Osteopathic Manipulative MedicineNA491.0%
Otolaryngology8,6361.3%350.4%0.7%
Pain Mgt/Interventional Pain MgtNA210.4%
Pathology11,2311.7%20.0%0.0%
Pediatric Medicine55,6868.2%520.1%1.1%
Physical Medicine And Rehab, Sports Medicine7,4351.1%500.7%1.0%
Plastic And Reconstructive Surgery6,3790.9%1272.0%2.6%
Preventative Medicine4,0600.6%240.6%0.5%
Psychiatry, Geriatric Psychiatry, Neuropsychiatry38,7815.7%2,0295.2%41.7%
Pulmonary Disease, Critical Care/Intensivists10,4861.5%60.1%0.1%
Radiation Oncology4,0320.6%10.0%0.0%
Radiology, Nuclear Medicine24,8873.7%190.1%0.4%
Rheumatology4,0690.6%120.3%0.2%
Thoracic Surgery4,2220.6%40.1%0.1%
Urology9,1801.4%290.3%0.6%
Vascular Surgery2,5820.4%60.2%0.1%
Other, unspecified specialty*344,4796.6%NA
Total for all physician specialties678,324100.0%4,8630.7%100.00%
      
Non-physician clinicians with doctorate
ChiropracticNA50.3%
OptometryNA522.9%
Oral Surgery (Dentist Only)NA1,69295.3%
PodiatryNA261.5%
Total Non-physician clinicians with doctorate1,775100.0%
NOTES: Physician counts include active physicians in patient care with an MD (Medical Doctor) or DO (Doctor of Osteopathic Medicine) degree. NA (not available) indicates that the specified specialty category is not supplied in the applicable data source. *Physicians in specialties with fewer than 2,500 total physicians are not categorized by specialty in AAMC analysis of AMA data (see Sources); 44,749 is the difference between the total number of physicians in patient care (678,324) and the number categorized by specialty (633,845).
SOURCES: Kaiser Family Foundation analysis of: 1Physician counts from Association of American Medical Colleges (AAMC) 2012 Physician Specialty Data Book, using American Medical Association (AMA) Physician Masterfile (December 2010); 2Unpublished data from the Center for Medicare and Medicaid Services, September 2013; 3Physician counts from AAMC, 2011 State Physician Workforce Data Book, using AMA Physician Masterfile (December 31, 2010).

Concierge Practice Models

Some physicians are turning to concierge practice models (also called retainer-based care), in which they charge their patients annual membership fees and typically have smaller patient caseloads.  Physicians in a concierge practice model do not necessarily need to opt-out of Medicare to see Medicare patients.  However, if they do not opt-out of Medicare, these physicians are subject to Medicare’s balance billing rules, and therefore, cannot charge beneficiaries additional fees for services that are already covered by Medicare.21  For example, the annual fee for a concierge practice may not be used for the yearly wellness visit covered by Medicare, but it could be applied to items such as a newsletter and high-end waiting room furniture.  More controversy exists about concierge practices applying annual fees paid by Medicare beneficiaries to enhanced appointment access and extra time with patients.22 

While anecdotal reports suggest a significant migration of primary care physicians to concierge/retainer practices, particularly in areas around Washington D.C and other major east and west coast cities, reliable data on the number of these practices are lacking.  In 2010, a report for MedPAC found listings for 756 concierge physicians, compared with 146 found by Government Accountability Office in 2005.23   Other news articles have reported larger numbers (4,400 in 2012) according to the American Association of Private Physicians.24 

Implications of Proposals to Modify Incentives and Relax Certain Financial Protections—Pros and Cons

Proposals introduced by Rep. Tom Price, House Speaker Paul Ryan and others have sought to relax private contracting conditions either throughout the Medicare program or as a demonstration project that could be implemented by the Administration.  For example, in 2015, two Bills introduced in the House with a companion Bill in the Senate25  include provisions to allow physicians and practitioners to engage in private contracting on a beneficiary-by-beneficiary basis, instead of requiring providers to opt-out of Medicare entirely. These Bills would also allow beneficiaries to seek Medicare reimbursement for the portion of the privately contracted fee that equals Medicare’s fee schedule amount, but no out-of-pocket limits would apply to the remaining portion of the provider’s charge.  Similar changes are also proposed as a demonstration in the 2016 House Republican Plan, “A Better Way, our Vision for a Confident America.”26   An earlier House Bill also included a demonstration to allow non-participating providers to collect Medicare’s portion of their charge directly from Medicare.27 

Pros: Support for Relaxing restrictions and increasing physician autonomy

Proponents of such proposals, including the American Medical Association, support relaxing restrictions on balance billing and private contracting for a number of reasons—perhaps the foremost is that they would allow physicians to charge Medicare beneficiaries higher rates and thereby get relief from fees that they say have failed to keep pace with the rising costs of running their practices.28   Proponents also assert that this ability could increase the overall number of providers willing to accept Medicare patients. This concern may be an issue in some geographic areas, though surveys and other data sources show that nationally, access to physicians among Medicare seniors is generally comparable to access among people age 55 to 64 with private insurance.29 

Physician groups also state that proposals to relax constraints on balance billing and private contracting would give providers a sense of greater autonomy in how they relate to both their patients and the Medicare program and would allow physicians to charge higher fees to some patients based on their assessment of their patients’ ability to pay.30   Additionally, beneficiaries would be able to seek at least partial Medicare reimbursement for services they received under private contracts.  Proposals that would allow non-participating providers to collect Medicare’s portion of their charge directly from Medicare would obviate the need to charge patients the full fee upfront. This circumstance could be helpful to those patients who do not want to wait for Medicare’s reimbursement, even if on net, they would incur higher out-of-pocket liability due to balance billing.  Non-participating providers could also experience a more reliable payment from Medicare, compared with the challenges, in some cases, of collecting fees from Medicare patients for unassigned claims.

Cons: Concerns about Eroding Financial Protections

Other analysts have raised concerns about the effects of relaxing private contracting rules and balance billing restrictions.31   To the extent that such changes lead to increases in the number of non-participating and/or opt-out providers, they could exacerbate problems that lower-income beneficiaries face when seeking care.  Beneficiaries without the ability to pay higher rates (who are also likely to be disproportionately sicker) could find a reduced pool of physicians willing to accept them. Also, for rarer physician specialties and in some geographic areas, such as rural parts of the country, patients may have little choice among physicians.  If the limits on balance billing and private contracting were relaxed, beneficiaries in these situations could face the types of problems that existed prior to the imposition of limits on balance billing—high out-of-pocket costs and greater confusion and uncertainty about possible charges.  Additionally, concerns have been raised about the accuracy and appropriateness of providers determining which Medicare patients in their caseload can afford higher fees, and by how much.

While proposals that allow beneficiaries and non-participating physicians to seek reimbursement from Medicare may, in the short term, reduce out-of-pocket liability for beneficiaries, they could also decrease the incentives for physicians and practitioners to become participating providers.  In the long run, if significantly more providers balance billed their Medicare patients or opted-out of Medicare, this shift could alternatively increase beneficiary out-of-pocket spending.

From the perspective of the Medicare’s program integrity, Medicare would have significant difficulty tracking fraud and abuse if physicians were able to contract selectively for services with some but not all beneficiaries.  Medicare would have to examine every physician-patient contract, on a claim-by-claim basis, to determine which claims could be reimbursed directly to the physician and which would be the full responsibility of the patient.  Additionally, Medicare would need to examine these physicians’ billing practices to ensure that beneficiaries were not being charged inappropriately.

Conclusions

Balance billing limits, with incentives for physicians to accept assignment, have proven effective in limiting beneficiaries’ out-of-pocket liability for physician services. Today, a small share of Medicare beneficiaries experience balance billing just as only small share of provider claims in Medicare are paid unassigned—very different from the years before balance billing limits were instituted.  Moreover, only about 1 percent of physicians provide services to beneficiaries on a private contracting basis.  As the Congress has been considering changes to the way in which Medicare pays for physician service in the context of SGR repeal, some proposals have briefly surfaced to relax constraints on balance billing and private contracting.

On the one hand, these proposals could increase physician autonomy and provider willingness to treat Medicare patients, particularly among those providers who charge higher fees. On the other hand, such proposals could result in higher out-of-pocket liability, particularly in the longer term, which could affect beneficiary access to care.  Additionally, relaxing these protections could foster less predictability in the fees beneficiaries encounter when seeing physicians and practitioners.  Patients most at risk for experiencing a greater financial burden would be those with modest incomes and greater health care needs.  Beneficiaries in geographic areas with limited choices of physicians might also be at higher risk if a growing number of providers choose to balance bill or require private contracts with their Medicare patients.  The key is to strike a balance between assuring that providers receive fair payments from Medicare while also preserving financial protections that help beneficiaries face more predictable and affordable costs when they seek care.

Technical support in preparation of this brief was provided by Health Policy Alternatives, Inc.

Appendix

APPENDIX 1: In all states, physician participation rates have increased significantly, 1986 to 2011

Endnotes

  1. Physician Payment Review Commission, “Chapter 9: Assignment and the Participating Physician Program: Current Status,” Annual Report to Congress, March 1998. ↩︎
  2. Physician Payment Review Commission, “Appendix E: Trends in Assignment, Participation and Balance Billing,” Annual Report to Congress, 1989. ↩︎
  3. Physician Payment Review Commission, “Chapter 9: Assignment and the Participating Physician Program: Current Status,” Annual Report to Congress, March 1998. ↩︎
  4. U.S. House of Representatives Committee on Ways and Means, 2004 Green Book, March 2004, WMCP: 108-6, Table 2-34.  Much of that increase is attributed to the implementation of the Participating Physicians program.  Centers for Medicare & Medicaid Services, Data Compendium 2011, Table VI.6, Medicare Participating Physician Program, December 2011. ↩︎
  5. Specifically, providers are prohibited from balance billing Medicare beneficiaries who have full Medicaid coverage (dual eligible) or those who receive Medicaid coverage through the Qualified Medicare Beneficiary (QMB) program.  Also, some services are not eligible for balance billing such as clinical diagnostic laboratory services. ↩︎
  6. Medigap plans F and G include coverage for balance billing, referred to as “excess charges.” Regarding other supplemental coverage, balance billing is prohibited for Medicare-covered services in the Medicare Advantage program, except for private fee-for-service plans. Among employer-sponsored retiree health plans, potential liability for balance billing depends on the terms of each plan. ↩︎
  7. Burney, I., et al., “Medicare Physician Payment Participation, and Reform,” Health Affairs, 3, no.4 1984; and Physician Payment Review Commission, “Chapter 9: Assignment and the Participating Physician Program: Current Status.” Annual Report to Congress, March 1998. ↩︎
  8. Ginsburg, P. and P. Lee, “Physician Payment,” in Eli Ginzberg (ed) Health Services Research: Key to Health Policy. Harvard University Press, 1991. ↩︎
  9. See statements from Senator Dole (130 Cong.Rec.S. 8373, 8375 (daily ed. June 27, 1984) reprinted in 1984 U.S. Code Cong. & Admin News, Deficit Reduction Act Legislative History at 2156) and Senator Rostenkowski (130 Cong.Rec.H. 7085, 7086 (daily ed. June 27, 1984) reprinted in Legislative History at 1450. Accord, H.Conf.Rep. No. 98-861, reprinted in Deficit Reduction Act Legislative at 751, 1308). ↩︎
  10. Holahan, J. and S. Zuckerman, 1989.  “Medicare Mandatory Assignment: An Unnecessary Risk,” Health Affairs, Spring 1989. ↩︎
  11. Physician Payment Review Commission, “Appendix E: Trends in Assignment, Participation and Balance Billing,” Annual Report to Congress, 1989. ↩︎
  12. Boccuti, C. et al., “Medicare Patients’ Access to Physicians: A Synthesis of the Evidence,” Kaiser Family Foundation, December 2013. ↩︎
  13. Medigap plans do not make payments for services provided by opt-out physicians.  Other supplemental insurance plans have the discretion to determine whether or not they will cover services provided by opt-out physicians. ↩︎
  14. Automatic renewal provisions were included in 2015 legislation, The Medicare Access and CHIP Reauthorization Act of 2015 (MACRA), Pub.L. 114-10, 114th Congress (2015-2016). ↩︎
  15. Specifically, providers are prohibited from entering into private contracts with Medicare beneficiaries who have full Medicaid coverage (dual eligible) or those who receive Medicaid coverage through the Qualified Medicare Beneficiary (QMB) program. ↩︎
  16. Boccuti, C. et al., “Medicare Patients’ Access to Physicians: A Synthesis of the Evidence,” Kaiser Family Foundation, December 2013. ↩︎
  17. Dentists, podiatrists, and optometrists did not become eligible to opt out of Medicare until December 2003. Section 603 from the Medicare Prescription Drug, Improvement, and Modernization Act of 2003 added dentists, podiatrists, and optometrists to the definition/list of physicians who may opt out of Medicare. ↩︎
  18. Buczko, W. “Provider Opt-Out Under Medicare Private Contracting.” Health Care Financing Review, vol 26, no 2, Winter 2004-2005. ↩︎
  19. Melinda Becker, “More Doctors Steer Clear of Medicare, Some Doctors Opt Out of Program Frustrated With Payment Rates and Mounting Rules,” New York Times, July 29, 2013 ↩︎
  20. See for example, Rabin, Roni C., “When Doctors Stop Taking Insurance,” New York Times, October 1 2012; When physicians state that they “don’t take insurance,” it often indicates that they will bill the patient for the full charge and the patient must seek reimbursement (if applicable) from their insurer, similar to non-participating providers in Medicare. ↩︎
  21. Physicians in concierge practices who have opted out of Medicare may charge whatever fees they have outlined in their private contracts with their Medicare patients; Medicare does not reimburse either the physician or the Medicare patient for items or services provided by opt-out physicians. ↩︎
  22. Pasquale, F. “The Three Faces of Retainer Care: Crafting a Tailored Regulatory Response,” Yale Journal of Health Policy, Law, and Ethics Vol.7: Iss. 1, Article 2. 2007. ↩︎
  23. Hargrave, E., et al. “Retainer-Based Physicians: Characteristics, Impact, and Policy Considerations” Prepared for the Medicare Payment Advisory Commission, March 2010. ↩︎
  24. Leonard, D. “Is Concierge Medicine the future of Health Care?” Bloomberg Business Week, November 29, 2012. ↩︎
  25. See H.R. 2300 (Empowering Patients First Act of 2015) and H.R.1650 / S.1849 (Medicare Patient Empowerment Act of 2015). ↩︎
  26. See “A Better Way: Our Vision for a Confident America,” House Republican proposal, June 22, 2016. ↩︎
  27. See The Chairman’s amendment in the nature of a substitute to H.R. 2810 (Medicare Patient Access and Quality Improvement Act of 2013). ↩︎
  28. See letter to the Honorable Tom Price from the American Medical Association: https://searchlf.ama-assn.org/letter/documentDownload?uri=%2Funstructured%2Fbinary%2Fletter%2FLETTERS%2Fmedicare-patient-empowerment-act-28april2015.pdf. ↩︎
  29. Medicare Payment Advisory Commission (MedPAC), Report to Congress: Medicare Payment Policy. Chapter 4, March 2016. ↩︎
  30. See, for example, Letter to Speaker John Boehner from state medical associations and state and medical physician societies, May 19, 2011. ↩︎
  31. Ginsburg, P. “The Case Against Balance Billing” EyeNet Magazine, American Academy of Ophthalmology, November/December 2010.   ↩︎
News Release

What Might a Trump Administration Mean for Medicaid?

Published: Nov 28, 2016

This new fact sheet examines key questions around the potential changes President-elect Donald Trump and the next Congress may seek to make in Medicaid, a program that covers 73 million people nationally.

Depending on how it is structured, a repeal of the Affordable Care Act could reverse the expansion of Medicaid coverage that helped bring the nation’s uninsured rate to a historic low. The brief also examines the prospect of capping and reducing federal financing for Medicaid through a block grant or a per capita cap. These approaches are typically designed to save the federal government money and provide states with additional flexibility but, depending on how they are structured, could put populations and providers who disproportionately rely on Medicaid funding — including the elderly and people with disabilities, nursing homes and safety net hospitals – at risk.

The fact sheet also discusses how executive powers can be used to make changes to Medicaid without congressional action, including new regulations and Medicaid waivers.

Key Medicaid Questions Post-Election

Published: Nov 23, 2016

Medicaid covers about 73 million people nationwide.  Jointly financed by the federal and state governments, states have substantial flexibility to administer the program under existing law.  Medicaid provides health insurance for low-income children and adults, financing for the safety net, and is the largest payer for long-term care services in the community and nursing homes for seniors and people with disabilities.  President-elect Trump supports repeal and replacement of the Affordable Care Act (ACA) and a Medicaid block grant. The GOP plan would allow states to choose between block grant and a per capita cap financing for Medicaid. The new Administration could also make changes to Medicaid without new legislation.

1. How Would ACA repeal affect Medicaid?

A repeal of the ACA’s coverage expansion provisions would remove the new eligibility pathway created for adults, increase the number of uninsured and reduce the amount of federal Medicaid funds available to states. The Supreme Court’s 2012 ruling on the ACA effectively made the Medicaid expansion optional for states. As of November 2016, 32 states (including the District of Columbia) are implementing the expansion.  The full implications of repeal will depend on whether the ACA is repealed in whole or in part, whether there is an alternative to the ACA put in place and what other simultaneous changes to Medicaid occur. However, examining the effects of the ACA on Medicaid provide insight into what might be at stake under a repeal.

What happened to coverage? The ACA expanded Medicaid eligibility to nearly all non-elderly adults with income at or below 138% of the federal poverty level (FPL) – about $16,396 per year for an individual in 2016. Since summer of 2013, just before implementation of the ACA expansions, through August 2016 about 16 million people have been added to Medicaid and the Children’s Health Insurance Program.  While not all of this increase is due to those made newly eligible under the ACA, expansion states account for a much greater share of growth. States that expanded Medicaid have had large gains in coverage, although ACA related enrollment has tapered.  From 2013 to 2016 the rate of uninsured non-elderly adults fell by 9.2% in expansion states compared to 6% in non-expansion states.

What happened to financing? The law provided for 100% federal funding of the expansion through 2016, declining gradually to 90% in 2020 and beyond. Expansion states have experienced large increases in federal dollars for Medicaid and have claimed $79 billion in federal dollars for the new expansion group from January 2014 through June 2015.  Studies also show that states expanding Medicaid under the ACA have realized net fiscal gains despite Medicaid enrollment growth initially exceeding projections in many states.

What other Medicaid provisions were in the ACA? The ACA required states to implement major transformations to modernize and streamline eligibility and enrollment processes and systems.  The ACA also included an array of new opportunities related to delivery system reforms for complex populations, those dually eligible for Medicare and Medicaid and new options to expand community-based long-term care services.

2. What would changes in the financing structure mean for Medicaid?

A Medicaid block grant or per capita cap policy would fundamentally change the current structure of the program. These policies are typically designed to reduce federal spending and fix rates of growth to make federal spending more predictable, but could eliminate the guarantee of coverage for all who are eligible and the guarantee to states for matching funds.  States would gain additional flexibility to administer their programs but reduced federal funding could shift costs and risk to beneficiaries, states, and providers.

How would it work? Block grants or per capita caps could be structured in multiple ways. Key policy decisions would determine levels of federal financing as well as federal and state requirements around eligibility, benefits, state matching requirements, and beneficiary protections. Previous block grant proposals have determined a base year financing amount for each state and then specified a fixed rate of growth for federal spending. Under a Medicaid per capita cap, the federal government would set a limit on how much to reimburse states per enrollee.  Payments to states would be based on per enrollee spending multiplied by enrollees. Spending under per capita cap proposals fluctuate based on changes in enrollment, but would not account for changes in the costs per enrollee beyond the growth limit.  To achieve federal savings, the per capita growth amounts would be set below the projected rates of growth under current law.

What are the key policy questions? Key questions in designing these proposals include: what new flexibility would be granted to states, what federal requirements would remain in place, what requirements would be in place for state matching funds, what is the base year and growth rates, and how would a potential repeal of the ACA work with a block grant proposal?  Given the lack of recent administrative data, setting a base year could be challenging.  These financing designs could lock in historic spending patterns and variation in Medicaid spending across states, resulting in states deemed “winners” or “losers.”

What are the implications? Capping and reducing federal financing for Medicaid could have implications for beneficiaries, states, and providers including: declines in Medicaid coverage or new financial barriers to care; limited funding for children (the majority of Medicaid enrollees) as well as the elderly and those with disabilities (populations that represent the majority of Medicaid spending); reduced funding for nursing homes and community-based long-term care (Medicaid is the largest payer of these services); reductions in federal revenues to states and Medicaid revenues for safety-net providers.  A block grant would not adjust to increased coverage needs during a recession.  Block grants or per capita caps would not adjust to changes in health care or drug costs or emergencies.  Recently Medicaid costs have increased due to high cost specialty drugs and Medicaid has been used to help combat the growing opioid crisis.

3. How could Medicaid be changed through administrative actions?

The Administration could make changes to Medicaid without changes in legislation.

How can changes be made through guidance? A new administration can reinterpret existing laws through new regulations and new sub-regulatory guidance. While there are rules that govern how to change regulations, a new administration has more flexibility to issue or amend sub-regulatory guidance, such as state Medicaid director letters. Rules promulgated by the Obama administration could be rolled back or changed.

How can changes be made through waivers? Throughout the history of the Medicaid program, Section 1115 waivers have provided states an avenue to test and implement demonstrations that, in the view of the Health and Human Services Secretary, advance program objectives but do not meet federal program rules. Longstanding federal policy has required waivers to be budget neutral for the federal government.

What kind of waivers may be considered?  Seven states are using waivers to implement the ACA Medicaid expansion, including Indiana.  The Indiana waiver, implemented under then Governor Pence, includes provisions to impose: premiums on most Medicaid beneficiaries; a coverage lock-out period for individuals with incomes above the poverty level who fail to pay premiums; health savings accounts; and healthy behavior incentives.  The Obama administration has not approved waivers that would require work as a condition of Medicaid eligibility.  It also has denied Ohio’s waiver request to impose premiums regardless of income and exclude individuals from coverage until all arrears are paid on the basis that this would restrict or undermine coverage from existing levels.  Many other states are using waivers to implement payment and delivery system reforms.  The incoming administration could decide whether or not to renew existing waivers and can approve a new set of waivers to promote its own program goals.