An Early Look at Implementation of Medicaid Work Requirements in Arkansas

Authors: MaryBeth Musumeci, Robin Rudowitz, and Cornelia Hall
Published: Oct 8, 2018

Executive Summary

Arkansas is the first state to implement a Section 1115 waiver that conditions Medicaid eligibility on meeting monthly work and reporting requirements. The Centers for Medicare and Medicaid Services (CMS) approved Arkansas’ waiver amendment on March 5, 2018, and the new requirements took effect for the initial group of beneficiaries on June 1, 2018. As of September 9, the state reported that more than 4,300 enrollees have lost Medicaid coverage as a result of the new work and reporting requirements, and another 5,000 were at risk of losing coverage with another month of non-compliance.

This brief analyzes the early experience with implementation of work and reporting requirements in Arkansas, based on publicly available data and information, as well as targeted interviews with state officials, health plans, providers, and beneficiary advocates conducted in August and September 2018. Key findings include the following:

  1. The early stages of implementation of the new work and reporting requirements necessitated substantial outreach and education efforts and enrollees’ creation of online accounts.  

    Despite a robust outreach campaign conducted by the state, health plans, providers, and beneficiary advocates, many enrollees have not been successfully contacted. Telephone calls have been a focus of state and health plan outreach efforts, but accurate phone numbers are often not available, or individuals do not answer calls or return messages from the state or health plans. Emails, social media and online videos appear to have had a limited reach among enrollees who may lack access to computers or the internet. Low literacy levels, non-English proficiency and the complexity of the requirements also make outreach, education and compliance more difficult.

    The process to set up an online account for enrollees is complicated. Non-compliance with the new requirements to date is attributed to lack of knowledge and the complexity of new requirements. Lack of computer literacy and internet access among enrollees creates barriers to setting up online accounts as well as ongoing reporting. Providers, health plans, and beneficiary advocates all agreed that a number of enrollees need individualized help to walk through the online setup and reporting process, yet few enrollees are seeking assistance from registered reporters.

  2. Ongoing implementation requires complex data matching and sharing by the state, and enrollees must regularly report exemptions or work activities.

    The state is using data matching to exempt about two-thirds of enrollees from the reporting requirements. Data sharing across agencies and plans was generally working well.

    For non-exempt enrollees, reporting of exemptions or work activities requires multiple steps. Program rules about the frequency of reporting exemptions and hour limits for certain activities are complex. In September, the first month that individuals could lose coverage for failure to report work or exemptions, there were some technical issues that interfered with online reporting.

    Some enrollees who may qualify for an exemption but are not identified by the state data matching may fall through the cracks, and others may face barriers to work. Transportation is a major barrier to work throughout Arkansas, and there are few jobs for people with low educational levels; these challenges are particularly significant in rural areas of the state. The state has a good deal of information related to the work requirement online, but enrollees need internet access, and key details about volunteer or training opportunities are often missing. If substantial numbers of enrollees subject to the new requirement seek services from the Department of Workforce Services (DWS) in the future, there may be a shortage of caseworkers and supports without additional resources. Medicaid funds cannot be used to pay for work supports.

  3. Coverage losses could result in gaps in care as well as increases in the uninsured rate and uncompensated care costs for providers.

    Disenrollment of healthier enrollees could have implications for the risk pool that would result in higher premiums. The formal waiver evaluation should provide more data, but details about the evaluation plan are not yet publicly available.  

Looking ahead, while it is still early in implementation for Arkansas, these early experiences have implications for the future of such programs:

  • Implementation is complex and may result in increased administrative costs for the state and other stakeholders.
  • Outreach is difficult, especially in rural areas and for vulnerable populations.
  • Many who remain eligible for Medicaid could lose coverage if they fail to navigate the processes to verify work status or qualify for an exemption.
  • While the stated goal may be to increase work, early data suggest that a small share of enrollees may be engaging in new work-related activities.
  • Further into implementation, additional work support funding may be required to boost employment, but Medicaid cannot pay for these services.
  • Coverage losses could result in gaps in care with consequences for those with chronic physical and mental health care needs, as well as increases in the uninsured rate and uncompensated care costs, putting financial stability for providers at risk.

Key Findings

Introduction

Arkansas is the first state to implement a Section 1115 waiver that conditions Medicaid eligibility on meeting work and reporting requirements.1  The Centers for Medicare and Medicaid Services (CMS) approved these new requirements as an amendment to Arkansas’ existing Medicaid expansion waiver, now called Arkansas Works, on March 5, 2018.2  Arkansas’s original waiver allows it to use Medicaid funds as premium assistance to purchase coverage for most expansion enrollees in Marketplace qualified health plans, a model known as the “private option,”3  instead of implementing a traditional Medicaid expansion.4  Medicaid expansion in Arkansas increased eligibility for parents from 17% to 138% of the federal poverty level (FPL, $3,533 to $28,676 per year for a family of 3 in 2018), and covered childless adults for the first time, up to 138% FPL ($16,753 per year for an individual in 2018), contributing to a substantial reduction in the state’s uninsured rate.5 

Under the waiver amendment, Arkansas is requiring most Medicaid expansion enrollees6  to complete 80 hours of work or other qualifying activities per month for at least 10 months per calendar year, unless exempt, and to report their work or exemption status using an online portal7  (Figure 1). The new requirements are being phased in, beginning in June 2018. The first case closures for failure to meet the requirements for three months were effective in September 2018.8  A separate brief provides an overview of the monthly data released by the state. State data show that, as of September 9, more than 4,300 enrollees lost Medicaid coverage as a result of the new work and reporting requirements, and another 5,000 were at risk of losing coverage with another month of non-compliance.9  While implementation has continued to date, three Arkansas Medicaid enrollees have filed a federal lawsuit challenging CMS’s approval of the waiver amendment.10 
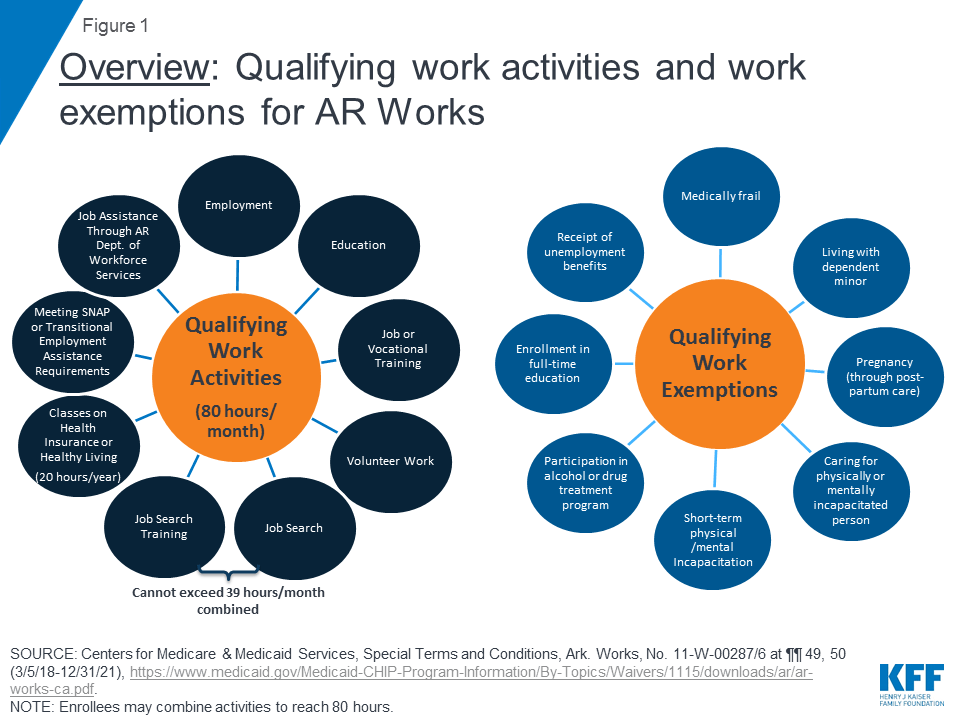
Figure 1: Overview: Qualifying work activities and work exemptions for AR Works

This brief analyzes the early experience with implementation of work and reporting requirements in Arkansas, based on publicly available data and other written materials, as well as targeted interviews with state officials, health plans, providers, and beneficiary advocates conducted in August and September 2018. This brief examines three key questions and then draws on findings from Arkansas to help inform policymakers in other states moving forward with similar requirements. Key findings explore answers to three key questions: (1) What was needed to get started with early implementation of the new work and reporting requirements? (2) What are the challenges related to ongoing implementation of the new work and reporting requirements? (3) What are the consequences of coverage loss?

Key Findings

1.  What was needed to get started with early implementation of the new work and reporting requirements?

To get started with the implementation of the new requirements, the state needed to conduct a substantial amount of outreach and education, and enrollees needed to create an online account to be able to report exemptions or work activities. This section discusses the challenges in each of these initial steps.

Outreach and Education

Despite a robust outreach campaign conducted by the state, health plans, providers, and beneficiary advocates, many enrollees have not been successfully contacted. There was consensus across interviewees that many enrollees are not aware of and do not understand the new requirements, despite the acknowledgement that the state has devoted considerable efforts to developing outreach materials, and health plans have dedicated staff to educating enrollees and helping them comply with the new requirements. The state and health plans are using multiple means of contacting enrollees, including making outbound calls; sending mailings,11  texts, and emails; posting information and videos online;12  using television, radio, and print media; and educating providers, including doctors and pharmacists, and community-based organizations.13  While health plans received lists of enrollees who were subject to the new requirements and updates on compliance to help target outreach, at least some providers did not have similar information to conduct outreach or target help to patients at the highest risk of losing coverage. Outreach by the health plans has required investments in materials and staff. Although the state was developing implementation plans prior to the approval of the waiver, there was a short time from waiver approval to implementation (March 5 to June 1) for the state to conduct initial outreach and education efforts.

Telephone calls have been a focus of state and health plan outreach efforts, but their effectiveness is limited. Enrollees may be hard to reach by phone for a variety of reasons. One health plan noted that over half of the enrollees on their targeted list do not have a phone number included in state data, others may have an incorrect phone number listed, and most of the remaining enrollees do not pick up the phone or respond to voicemail messages. One safety net provider observed that many enrollees have pre-paid government subsidized phones, for which the number resets every time the minutes run out, resulting in a new phone number every month or two. The state has contracted with the Arkansas Foundation for Medical Care (AFMC) to make outbound calls to educate enrollees about the new requirements,14  but AFMC is only required to contact 30% of existing enrollees15  and 40% of newly approved enrollees,16  with contact defined as “a minimum of two attempts by a live agent to contact beneficiaries by phone when a phone number is available.17  State data on outreach efforts show that AFMC made over 39,000 calls to just under 12,000 enrollees in May, and over 47,000 calls to about 9,000 enrollees in June.18 

Social media and online videos are likely to have a limited reach among enrollees who may lack access to computers or the internet. Enrollees are unlikely to look to social media for information about new program requirements from the state. Similar to national data, state-specific data show that nearly one in three (31%) of those non-exempt and not working have no access to the internet.19  Outreach efforts at the local level, in person or through word of mouth from trusted sources, could be more effective than social media. In addition, early in implementation, some internet links provided in the state’s online informational videos were broken.20 

Notices sent by the state may be confusing, and outreach efforts may not sufficiently account for low literacy and lack of English proficiency among enrollees. Advocates and providers described written notices sent by the state to enrollees as confusing, and complete information was spread across multiple notices. For example, the first notice provided to enrollees who are newly subject to the work requirement instructs them to report their work activities by the fifth of the following month, unless they receive another separate notice indicating that they are exempt from reporting.21  In addition, low literacy and lack of English proficiency could affect outreach and understanding of new requirements. In areas of the state with a large Hispanic population, not receiving written notices in Spanish was a concern. As a result of the way the private option is structured, another interviewee noted that many expansion enrollees are not used to regularly looking for or exchanging information with the state because their only contact with the state was for their initial eligibility determination and renewal, while they have more frequent contact with their health plans.

Setting up online accounts

The process for enrollees to set up an online account for reporting is complicated. Beneficiary advocates and providers described their own confusion with trying to understand the various steps required to create and link online accounts:

  • First, enrollees must create an “Access Arkansas Single Sign-On” account, an eight-step process that includes 5 security questions.22 
  • Next, enrollees must link their Single Sign On account to their health care coverage, which involves three additional steps once they are logged into their Single Sign On account23  (Figure 2). Linking the account also requires enrollees to have received a written notice by mail or email with a reference number that they must enter online.24 
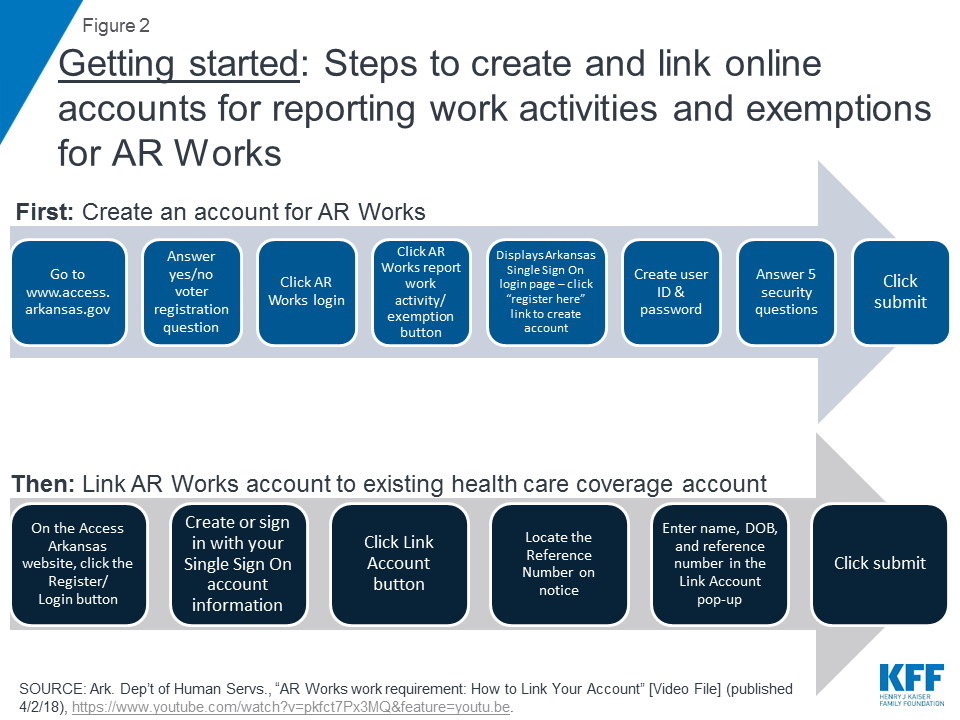
Figure 2: Getting started: Steps to create and link online accounts for reporting work activities and exemptions for AR Works

Lack of computer literacy and internet access among enrollees are barriers to setting up the online accounts and complying with the reporting requirements. Arkansas’ waiver is unique because it also includes an online reporting requirement, for which the state designed an online portal.25  All enrollees must have an email address that they use to create an online account, which they then must link to their health coverage account even if they believe that they are exempt from the work requirement. Enrollees must then report their monthly work activities or work exemption status, attesting to the information’s accuracy, in the online portal by the fifth of the following month, unless they qualify for a reporting exemption. Reporting by phone, by mail or in person is not permitted.26  Many enrollees only have internet access via a cell phone, and some interviewees were concerned that the portal was not mobile friendly. Other enrollees have to rely on internet access through public computers such as those at a library. The state has determined that 92% of the enrollees expected to be affected by the new requirements live within 10 miles of a public internet access site.27  However, traveling that distance, especially on a regular basis, could still be challenging for individuals without a car, as much of the state lacks public transportation.

Providers, health plans and beneficiary advocates all agreed that a number of enrollees need individualized help to walk through the complex account setup and reporting process, yet few enrollees are using registered reporters. Many expansion enrollees needed individualized help creating email addresses and enrolling in coverage online during Medicaid expansion implementation. For the work requirement, the state created a “registered reporter” program that allows enrollees to designate a third party to create their online accounts and access the portal to do their reporting.28  Health plans and some providers have designated staff to serve as registered reporters. However, few enrollees are using registered reporters, in large part because it has been hard to reach enrollees to educate them about the new requirements. Some providers noted that there were no funds provided for training and education about the portal, leaving many with challenges in helping enrollees navigate the new work and reporting requirements. Nevertheless, at least some safety net providers have devoted their own resources to provide laptops or iPads in clinic waiting areas for their patients to use for reporting.

Non-compliance with the new requirements to date is attributed to lack of knowledge about the complex new requirements. Of the 60,012 people who were subject to the new requirements in August 2018, 27% (or more than 16,000 people) did not report 80 hours of qualifying work activities.29  Failure to report work activities could mean that the enrollees did not create and link the online accounts required to enable them to report or experienced difficulty accessing or navigating the online portal. Additional research about those individuals who do not report can help inform future outreach and education strategies that may be more effective in contacting individuals who may be unaware of the new requirements or in areas of the state that are harder to reach.

Data Sharing

The state is using data matching to exempt about two-thirds of enrollees from the reporting requirements. Most of these enrollees fell into four categories: those who were already working at least 80 hours per month (46%), followed by those currently meeting or exempt from Supplemental Nutrition Assistance Program (SNAP, previously known as food stamps) employment and training (E&T) requirements (18%),30  those with a dependent child in the household (13%), and those who have been identified as medically frail (15%).31  Most exempt enrollees were identified as such through the state data matching process and should have received a notice indicating that they were subject to the work requirement but exempt from the reporting requirement. Another 5% (2,247) of the exempt enrollees reported an exemption since receiving a notice that they were subject to the work requirement.32 

Data sharing across state agencies and health plans is generally working well. The state reported early and frequent collaboration among the Medicaid, SNAP, and TANF (Transitional Assistance for Needy Families cash assistance, called Transitional Employment Assistance in Arkansas) programs, as well as between the state Medicaid agency (under the Department of Human Services, or DHS) and Department of Workforce Services (DWS) to implement the new requirements. DHS and DWS were able to use federal TANF funds to transfer lists of Arkansas Works enrollees from DHS to DWS computer systems in a new TANF case management system already in development. The Arkansas Works program, SNAP, and the TANF programs resided in three separate eligibility systems operated by Arkansas DHS;33  implementation of a daily file exchange across those systems to update exemption and compliance information across programs without manual intervention has gone smoothly. A regular data file transfer across agencies and from the state to health plans is also in place.

Online Reporting

Enrollee reporting of exemptions or work activities requires multiple steps. Under the waiver, enrollees must report a month’s work activities or exemptions by the fifth of the following month. They lose coverage for the rest of the calendar year if they fail to meet the work and reporting requirements for any three months. Enrollees must enter the required information to complete their online reporting each month, a process that includes at least 13 separate steps to report work hours, with additional steps required if beneficiaries are reporting hours for more than one job.34  There are 11 separate steps to report volunteer hours or to report an exemption based on pregnancy35  (Figure 3).
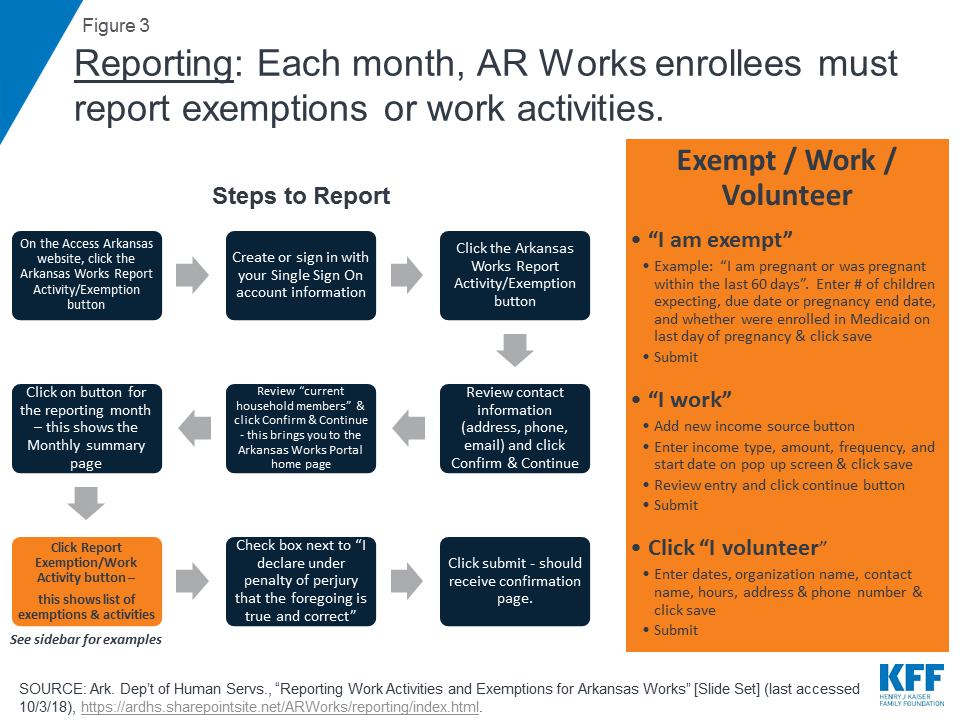
Figure 3: Reporting: Each month, AR Works enrollees must report exemptions or work activities.

Program rules about the frequency of exemption reporting and hour limits for certain activities are complex. Some online reporting is required more or less frequently than monthly. For example, students need to report full-time status weekly for four consecutive weeks before they qualify for a six-month exemption from reporting.36  Other students continue to report weekly.37  Some exemptions, such as caring for an incapacitated person, short-term incapacity, and participation in alcohol or drug treatment, must be reported every two months, while others, such as receiving unemployment benefits or full-time participation in school or vocational training, must be reported every six months.38  There are also complicated rules about how many hours of various activities can count toward the 80-hour monthly requirement. For example, beneficiaries are limited to 39 hours per month of job search and job search training activities and 20 hours per year of health education class hours.39 

Some activities have different conversions to countable hours. For example, for job search activities, each job contact counts as three work activity hours, while each hour of job search training counts as one work activity hour. Each credit hour for college or vocational school courses counts as 2.5 work activity hours. An hour of high school or ESL instruction counts as 2.5 work activity hours, while an hour of GED, basic skills, or literacy instruction counts as two work activity hours. One hour of “occupational training instruction” counts as two work activity hours, while an hour of “unpaid job training” counts as one work activity hour.40  The online portal does these calculations, but enrollees need to be aware of the rules or else they may go to report and fall short of the 80 qualifying hours required if they have devoted too many hours to job search or job search training.

Enrollees are unaware that they could be asked to verify their exemption status in the future. Enrollees do not have to provide documentation to verify their exemption status when reporting an exemption in the online portal, which helps to simplify the exemption process. Still, stakeholders worried about enrollees being unable to produce documentation if asked to do so months later as part of a state quality assurance check41  and therefore retroactively losing an exemption.

In September 2018, the first month that individuals could lose coverage for failure to report work or exemptions, there were technical issues that interfered with online reporting. There was a state computer outage on September 5, the deadline to report hours for August, and the first time that enrollees were at risk of losing coverage for three months of non-compliance. In response, the state is allowing enrollees who experienced difficulty accessing the portal to request a good cause exemption for late August reporting by October 5. Internet and cell phone connectivity, especially in rural areas, can be slow and unreliable, which can translate to problems with reporting online. One interviewee cited multiple examples of enrollees having difficulty linking their online accounts because the reference number provided in the notice did not work or they did not receive the notice with the reference number.

exemption processes

Enrollees who may qualify for exemptions that are not identified via the state data match may fall through the cracks. Exemptions unlikely to be identified through the state data match include caring for an incapacitated person or experiencing a short-term incapacity, pregnancy, participation in an alcohol or drug treatment program, and full-time students. A health plan reported that it had identified significant overlap between its enrollees who are subject to the work requirement and enrollees for whom it provides case management. Case management targets enrollees who need “additional intervention” to manage chronic conditions and find resources to address basic needs such as food insecurity, transportation and shelter. Given these criteria, these enrollees are likely to face barriers to compliance with the new requirements and/or the exemption process on their own due to their need for additional support. While health plans may have claims data or other information showing that an enrollee may be medically unable to work, the plans cannot initiate that determination. Instead, the enrollee must pursue a medically frail designation. Some interviewees expressed concern about enrollees’ ability to understand their potential qualification for exemption as well as navigation of that process, especially among those with mental health needs. The requirements to update certain exemptions at different intervals may also confuse enrollees and lead to their failure to update exemption information timely, which would result in non-compliance and coverage losses. To date, there have been few requests for reasonable accommodations by people with disabilities, which may reflect lack of knowledge among enrollees.

The good cause policies and process have only been recently finalized, resulting in confusion about how to make such requests. The availability of a good cause hardship exception for failing to meet the new requirements is explained in the notice informing enrollees that their case is closed for 3 months of non-compliance but not in earlier notices.42  Good cause must be requested online (but not through the portal, as exemptions are) and can be separately determined, both for not working and for not reporting timely.43  While this process is important for those who could lose coverage, there was some concern about state capacity to process a large number of good cause requests given past challenges with application and renewal processing.44  According to the state’s monitoring plan, good cause approval and denial notices are being generated manually until that functionality is added to the eligibility IT system.45  As of August 2018, 55 enrollees had requested good cause, and the state had granted 45 of those requests.46 

Access to work and work supports

State data so far suggest that a small share of those who are meeting the work and reporting requirements are doing so by engaging in activities beyond those required to meet SNAP requirements. The data do not indicate whether these enrollees started working in response to the new requirements. They could have been already engaged in work or another activity without the state having this information. This group represents a small share of enrollees compared to the more than 4,300 who lost Medicaid coverage due to failure to comply with work or reporting requirements. It is unclear why individuals reporting SNAP compliance through the portal are not included in the state data match that would have exempted them from the reporting requirements. The data do not separate out those who are newly working due to the requirements.47 

Transportation is a major barrier to work throughout the state and especially in rural areas.48  In many communities, there is “no effective alternative” to having a car for transportation. Most of the state has no public transportation system. Lack of transportation can be a barrier to getting to work or accessing education and training supports. Forty-three of 75 Arkansas counties lack physical DWS workforce services locations, and 25 counties lack physical locations for SNAP employment and training providers at the time of initial work requirement implementation.49  The state indicated that SNAP enrollees can be reimbursed for transportation costs or go to a local office for a conference call if a SNAP E&T provider is not in the county where they live. DWS offers services online, but these require individuals to have internet access.

While the state reports a low unemployment rate and robust economy, there are few jobs in rural areas of the state and for people with low educational levels. Many jobs available to enrollees are seasonal, such as construction or agricultural work. DWS reports about 65,000 to 67,000 openings currently in its job bank, with a “wide range of jobs” available, such as advanced manufacturing, health services, construction, and professional services. Still, the state acknowledges challenges in rural areas that are primarily agricultural, lack industry, and require a car for transportation.

Relatively few enrollees have sought DWS services since the work requirement took effect. Health plan case managers and AFMC outreach calls are making referrals to job training, resume assistance and other DWS services, noting a lack of awareness among enrollees about these services. Medicaid notices to enrollees about the work requirement include information about how to contact DWS for free job search help.50  The state’s monitoring plan indicates that DWS will offer career assessment, job search assistance and training referrals “as appropriate” to enrollees subject to the work requirement.51  Enrollees will have access to DWS career readiness certifications, resume assistance, “universal job services,” and screeners to determine program eligibility and computer literacy. They can also receive assessments for high-demand occupations based on current skills and abilities as well as for identification of barriers to work.52  Once assigned to a DWS case manager, DWS will track enrollees through monthly follow-ups for six months after they get a job to help ensure that they remain employed.

If substantial numbers of enrollees subject to the new requirement seek DWS services, there could be a shortage in DWS caseworkers and work supports without additional funding, and Medicaid funds cannot be used to pay for work supports.53  DWS reports having sufficient staff to serve enrollees who are presently seeking its services.54  However, no new money has been provided for work supports, and access to DWS- Workforce Innovation & Opportunity Act (WIOA) funded education, training, and apprenticeship programs depends on funding and availability.55  The state reports that it has absorbed a 7% cut in federal workforce training funds, with current DWS caseloads at about 135 clients per counselor. Current legislation provides $112.5 million less in federal funding for job training services nationwide for FY 2019 than FY 2018.56  DWS originally received identification of 35,000 Arkansas Works enrollees, but many were subsequently determined to be exempt from the new requirements, leaving DWS with about 15,000 enrollees who may be in need of jobs, training, or other services in order to keep their Medicaid coverage.

The state has a good deal of information related to the work requirement online, but enrollees need internet access, and key details about volunteer or training opportunities are often missing. For example, the Arkansas Works Resource Dashboard maintained by the state includes a list of public computers and county-level resource guides with various resources for employment, volunteering, education, “quality of life” (e.g., food banks and shelters), and county agencies57  (Figure 4). Enrollees must have internet access to view this information, and the listings are limited to the organization name and phone number and do not identify specific slots or available volunteer opportunities. Another state website, ARJobLink, does list job openings, but this information is available from the DWS website and not directly from the resource dashboard.58  Similarly, information about how to access the health education classes that can count toward the work requirement for up to 20 hours per year is not clear. Some information about the classes appears on the AFMC website,59  but it is unclear if enrollees must pre-register online to attend.
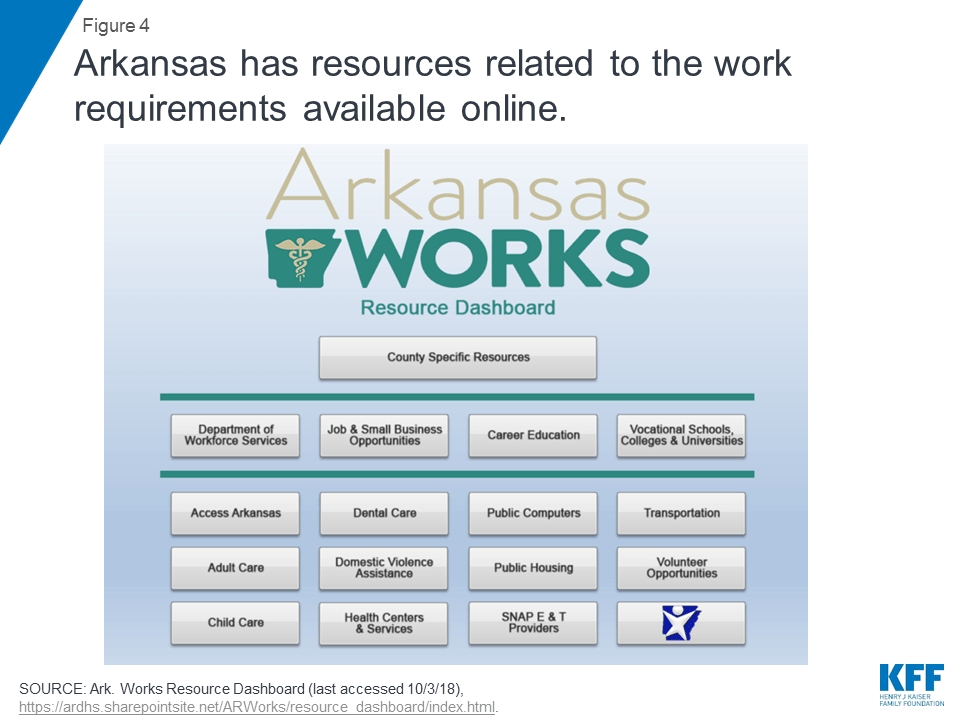
Figure 4: Arkansas has resources related to the work requirements available online.

Stakeholders questioned whether meeting the requirement through volunteer activities was a viable option. Without a more structured approach to engage and train volunteer organizations in a systemic way, finding volunteer opportunities depends largely on social connections and supports. This dependence could unfairly penalize some enrollees, especially those in rural communities where the only volunteer opportunity may be a local church where they are not a member.

3.   What are the consequences of coverage loss?

As of September 9, 2018, more than 4,300 cases were closed due to three months of non-compliance with the new work and reporting requirements. Another 5,000 enrollees were at risk of losing coverage in October, according to state data.60 

Enrollees could experience gaps in coverage even if they ultimately meet the reporting requirement. The state is sending notices to individuals who are non-compliant for two months, indicating that their cases will be closed on the last day of that month even though they have until the fifth of the next month to meet the reporting requirements. For example, individuals who were non-compliant for June and July were notified in letters dated August 6 that their cases would be closed on August 31, even though they would have until September 5 to report exemptions or work activities for August.61  If individuals do report by the fifth of the month, the state would reinstate their coverage. However, this process could result in a coverage gap from September 1 to September 5. Individuals who try to see a doctor or fill a prescription during this period would fall into that coverage gap and have to pay out of pocket or delay or forego care until their coverage is reinstated. This process can also create confusion about compliance and reporting deadlines.

Gaps in care and increases in uncompensated care costs are among top concerns if enrollees lose coverage. Health plans note that stable enrollment is critical to providing ongoing care, particularly for enrollees with mental health or chronic conditions, and to managing risk as healthier individuals are disenrolled. While safety net clinics continue to provide primary care services to the uninsured, they do not offer prescription drugs or specialist care needed to manage chronic physical and mental health conditions, which could result in more potentially avoidable hospitalizations and mental health crisis services. Plans and providers expressed concern that individuals who lose coverage and become uninsured will still seek care and that providers will see increased uncompensated care costs. Some providers worried that, because coverage increases under the expansion led to increased diagnosis and treatment of chronic conditions such as diabetes and high blood pressure, coverage loss could create higher uncompensated care costs than before the expansion. Expansion coverage had brought better financial stability for providers, and many thought that they would not be able to absorb increased uncompensated care costs.

Disenrollment of healthier enrollees could have implications for the health plan risk pool that would result in higher premiums. Arkansas had already experienced a significant drop in Medicaid enrollment prior to the implementation of the new work requirements.62  Additional coverage losses could exacerbate issues resulting from the changing case mix of enrollees. If healthier enrollees who have less costly and complex conditions lose coverage, premiums could increase for the enrollees who remain covered. The state pays these premiums for Medicaid enrollees, but Medicaid enrollment has been a stabilizing factor for the Marketplace, in which qualified health plan (QHP) enrollment has consisted of 80% Medicaid enrollees and 20% Marketplace enrollees.63  Changes in the case mix could thus increase premiums for all QHP enrollees. In addition, one plan indicated that capitation rates had already been adjusted upward to account for increased costs due to administration of the work requirements.

More data could be available through the formal waiver evaluation, but details about the evaluation plan are not yet publicly available. The most recent quarterly report, for the period ending June 30, 2018, indicates that the state is seeking a vendor to evaluate the amended waiver.64  The waiver terms and conditions required the state to submit a draft evaluation plan to CMS within 120 days of CMS approval (by July 3, 2018). The state indicated that CMS extended this deadline on July 3 and that the state subsequently submitted the draft evaluation plan. The state must submit a final evaluation design to CMS within 60 days after receiving any CMS comments and post the final design to the state website within 30 days of CMS approval.65  To date, monthly state data about compliance with the new requirements have provided key information to understand early effects of these new provisions.

Looking Ahead

Research and interviews align in the acknowledgement that work for enrollees who are able to do so is a laudable goal; however, the waiver design that ties compliance to coverage, requires monthly online reporting and provides no additional resources for work supports could lead to unintended consequences.

Implementation is complex and may result in increased administrative costs for the state and other stakeholders. Implementation requires months of planning to draft and send notices, conduct beneficiary outreach and education, update IT systems and coordinate across multiple state agencies, health plans and providers. Without additional resources, it is difficult to administer complex changes. Some providers and plans may also face increased costs conducting outreach and helping enrollees comply with new requirements.

Outreach is difficult, especially in rural areas and for vulnerable populations. Many enrollees do not have stable addresses, phone numbers or access to email and internet. These barriers could leave many enrollees unaware of the new requirements, as typical forms of outreach, including mail, telephone calls, emails, and social media, may not be effective. Some of these challenges may particularly affect rural areas.

Many enrollees who remain eligible could lose coverage if they fail to navigate the process to verify work status or qualify for an exemption. The model in Arkansas that relies solely on reporting work or exemptions through an online portal may be unique, but research shows generally more disenrollment among individuals who remain eligible but lose coverage due to new administrative burdens or red tape than among those who lose eligibility due to failure to meet new work requirements.66  The limitations of requiring enrollees only to report online creates additional administrative barriers for those who lack computers or internet access.

While the stated goal may be to provide new opportunities for enrollees to work, early data suggest that few enrollees may engage in new work-related activities. Early data from Arkansas show that the large majority of enrollees subject to new requirements are already meeting the requirements through work or compliance with SNAP or have an exemption, and few are newly reporting work or volunteer activities. The data do not explicitly identify individuals who have newly gained employment.67 

Further into implementation, additional work support funding may be required, and Medicaid cannot pay for these services. If more enrollees become aware of the requirements and seek needed work supports, new resources may be required to provide training, caseworkers and other supports such as transportation, GED fees, and funds to purchase uniforms. Work support funding is key to overcoming barriers to work but cannot come from Medicaid dollars.

Coverage loss could result in gaps in care and increases in uncompensated care costs. Gaps in care, particularly for those with chronic physical or mental health conditions, could lead to more unnecessary hospitalizations or mental health crises. Individuals needing or undergoing treatment for substance use disorders could be particularly vulnerable to gaps in coverage that result in breaks in care.68  Providers could face additional uncompensated care costs that they may not be able to absorb. Coverage losses could reverse coverage gains experienced since the implementation of the ACA that accompanied more financial stability for providers.

Additional research and evaluation are necessary to answer key questions. Evaluation is required to understand whether the hypothesis that work requirements lead to “enhanced socioeconomic status, maintenance of health insurance coverage and improved health compared to the alternative outcome that needy individuals lose health coverage” is valid.69  Additional data could examine the following questions:

  • How many enrollees are losing coverage, and of these, how many have other health insurance coverage or remain uninsured;
  • How many enrollees are newly working and in what types of jobs;
  • Whether enrollees understand the new requirements and use of the online portal, or whether they face barriers like lack of computers or internet to report work or exemptions successfully;
  • How many enrollees might have been eligible for an exemption but did not obtain one; and
  • How many individuals subject to disenrollment had good cause for not meeting the requirements.

More information is needed about the characteristics of disenrolled individuals, including barriers faced and more details about their current coverage status. More broadly, additional research can continue to examine what coverage losses and lock-outs mean for enrollees, providers and health plans. These formal waiver evaluations are important but often take a long time to complete. In the meantime, the early experience in Arkansas can provide valuable insights for other states considering similar policies.

Endnotes

  1. CMS also has approved work requirement waivers in Kentucky, Indiana, and New Hampshire. After being invalidated by a federal district court before implementation, the Kentucky waiver was reopened for additional public comment and is now awaiting a new decision from CMS. For more information about the court’s decision, see KFF, Explaining Stewart v. Azar, Implications of the Court’s Decision on Kentucky’s Medicaid Waiver (July, 2018), https://modern.kff.org/medicaid/issue-brief/explaining-stewart-v-azar-implications-of-the-courts-decision-on-kentuckys-medicaid-waiver/. Indiana and New Hampshire plan to implement their waivers in 2019. As of Sept. 28, 2018, 10 other states (AL, AZ, KS, ME, MI, MS, OH, SD, UT, and WI) have work requirement waivers pending with CMS. KFF, Medicaid Waiver Tracker (Sept. 28, 2018), https://modern.kff.org/medicaid/issue-brief/which-states-have-approved-and-pending-section-1115-medicaid-waivers/. ↩︎
  2. CMS, Special Terms & Conditions, Ark. Works, No. 11-W-00287/6 (March 5, 2018-Dec. 31, 2018), https://www.medicaid.gov/Medicaid-CHIP-Program-Information/By-Topics/Waivers/1115/downloads/ar/ar-works-ca.pdf. ↩︎
  3. Arkansas’ model is credited with substantially increasing enrollment, increasing the number of carriers, and contributing to premium reductions in the state’s Marketplace. Medicaid expansion in Arkansas also has resulted in a considerable reduction in the state’s uninsured rate. While the private option has been more administratively complex to implement than a traditional expansion, expanding Medicaid without a waiver was not seen as politically viable. Arkansas also was somewhat uniquely situated to adopt the private option, as it did not have an established Medicaid managed care delivery system prior to expansion, unlike most states, or a fee-for-service provider network equipped to serve a sizable number of new enrollees. KFF, A Look at the Private Option in Arkansas (Aug. 2015), https://modern.kff.org/medicaid/issue-brief/a-look-at-the-private-option-in-arkansas/. ↩︎
  4. Most states adopting the Affordable Care Act’s Medicaid expansion did so without a waiver. KFF, Status of State Action on the Medicaid Expansion Decision (Sept. 11, 2018), https://modern.kff.org/health-reform/state-indicator/state-activity-around-expanding-medicaid-under-the-affordable-care-act/. ↩︎
  5. KFF, A Look at the Private Option in Arkansas (Aug. 2015), https://modern.kff.org/medicaid/issue-brief/a-look-at-the-private-option-in-arkansas/. ↩︎
  6. One point of confusion was whether the new requirements apply to enrollees with income from 101-138% FPL. The state clarified that the requirements currently apply to those with incomes up to 100% FPL and will apply to the 101-138% group in the future, if the state ultimately does not receive approval from CMS to cap expansion eligibility at 100% FPL. See also Ark. Dep’t of Human Servs., Ark. Works Sec. 1115 Demonstration Waiver Quarterly Report at 2 (April 1, 2018-June 30, 2018), https://www.medicaid.gov/Medicaid-CHIP-Program-Information/By-Topics/Waivers/1115/downloads/ar/Health-Care-Independence-Program-Private-Option/ar-works-qtrly-rpt-apr-jun-2018.pdf. ↩︎
  7. Prior to implementing the new requirements, Arkansas provided a voluntary referral for all enrollees to the state Department of Workforce Services (DWS) for free job search and job training assistance. State law enacted in April, 2016 required this referral for enrollees with income at or below 50% FPL. Beginning in January 2017, DWS referrals were made for all Arkansas Works beneficiaries. Id. ↩︎
  8. Implementation was phased in for existing enrollees ages 30 to 49 from June through September 2018, and the first group of enrollees lost coverage on September 1, 2018, for failure to meet the requirements for three months. Enrollees were phased in according to their Medicaid eligibility renewal month: those with Jan., Feb., or March renewal dates became subject to the new requirements in June; those with April, May, or June renewal dates became subject to the new requirements in July; those with July, Aug., or Sept. renewal dates became subject to the new requirements in Aug.; and those with Oct., Nov., or Dec. renewals dates became subject to the new requirements in Sept. Those ages 30-49 who are newly determined eligible on or after April 1, 2018 are subject to the new requirements as of the second month after approval. The requirements will be phased in for existing enrollees ages 19 to 29 from January through April 2019, with the first notices to be sent in early November 2018. Those ages 19-29 who are newly determined eligible on or after Nov. 1, 2018 will be subject to the new requirements as of the second month after approval. Eligibility and Enrollment Monitoring Plan, Ark. Works – Work and Comm’y Engagement Amendment at 6-8 (approved by CMS, May 31, 2018), https://www.medicaid.gov/Medicaid-CHIP-Program-Information/By-Topics/Waivers/1115/downloads/ar/Health-Care-Independence-Program-Private-Option/ar-works-elig-enrllmnt-plan-05312018.pdf. ↩︎
  9. KFF, An Early Look at State Data for Medicaid Work Requirements in Arkansas (Sept. 2018), https://modern.kff.org/medicaid/issue-brief/an-early-look-at-state-data-for-medicaid-work-requirements-in-arkansas/; see also Ark. Dep’t of Human Servs., Ark. Works Program, Aug. 2018 Report (data as of Sept. 9, 2018, released Sept. 12, 2018), https://humanservices.arkansas.gov/images/uploads/newsroom/091218_AWReport_Final.pdf. ↩︎
  10. Gresham v. Azar, No. 1:18-cv-1900, Compl. (D. D.C., Aug. 14, 2018), http://www.healthlaw.org/issues/litigation/gresham-azar-complaint#.W7eIdmhKjIUj. The lawsuit was filed on August 14, 2018 by three individual Arkansas Medicaid enrollees in DC federal district court. The plaintiffs are challenging CMS’s approval of Arkansas’ waiver amendment, including the work and reporting requirements and elimination of 3-month retroactive eligibility, and CMS guidance inviting states to apply for Section 1115 waivers that condition Medicaid eligibility on work. The plaintiffs argue that the waiver amendment and guidance are illegal because they exceed the Health and Human Services (HHS) Secretary’s authority under Section 1115. The plaintiffs also assert that they have been unable to meet the work requirement due to medical issues, including seizures, chronic back pain, and mental health conditions; lack of transportation; and seasonal work with fluctuating hours, and they are having difficulty accessing and navigating the online portal to fulfill the reporting requirement. The case was brought against HHS and CMS. Subsequently, the state of Arkansas joined the case as a defendant. The case is assigned to the same judge who invalidated CMS’s approval of Kentucky’s waiver, including a work requirement and other restrictive eligibility and enrollment provisions in June. KFF, Explaining Stewart v. Azar, Implications of the Court’s Decision on Kentucky’s Medicaid Waiver (July 2018), https://modern.kff.org/medicaid/issue-brief/explaining-stewart-v-azar-implications-of-the-courts-decision-on-kentuckys-medicaid-waiver/. The case will be briefed from Nov. 5, 2018 through Jan. 14, 2019. Gresham v. Azar, no. 1:18-cv-01900-JEB, Joint Proposed Briefing Schedule, ECF no. 23 (D.D.C., Sept. 27, 2018), https://affordablecareactlitigation.files.wordpress.com/2018/09/5693453-0-9748.pdf. ↩︎
  11. The state Medicaid agency sent two informational mailings to enrollees before the work requirement took effect: first, a March 2018 mailing to all enrollees instructed them to call the state to provide their email address and indicated that they would receive a future notice if they were subject to the work requirement. AR Works Information, Notices and Flyer Samples, Example – March 2018 – Initial Work Requirement Info, last accessed Oct. 5, 2018, https://ardhs.sharepointsite.net/ARWorks/Notice_Samples/2.%20Example%20%E2%80%93%20March%202018%20%E2%80%93% 20Initial%20Work%20Requirement%20Info.pdf; Ark. Dep’t of Human Servs., Ark. Works Sec. 1115 Demonstration Waiver Quarterly Report at 7 (Jan. 1, 2018-March 31, 2018), https://www.medicaid.gov/Medicaid-CHIP-Program-Information/By-Topics/Waivers/1115/downloads/ar/Health-Care-Independence-Program-Private-Option/ar-works-qtrly-rpt-jan-mar-2018.pdf. Second, an April 2018 mailing directed enrollees to create their “Access Arkansas” online account and log on to update and provide information so that the state could determine whether they were exempt from the new requirements. AR Works Information, Notices and Flyer Samples, Example – April 2018 – Get Ready for the Work Requirement, last accessed Oct. 5, 2018, https://ardhs.sharepointsite.net/ARWorks/Notice_Samples/3.%20Example%20%E2%80%93%20April%202018%20%E2%80%93 %20Get%20Ready%20for%20the%20Work%20Requirement.pdf. Enrollees who are subject to the work requirement are sent a notice the month before, indicating when their work requirement begins and that, unless they get another notice saying that they are exempt from reporting, they must report their work activities by the fifth of the following month or will be considered non-compliant and will lose coverage after three months of non-compliance. AR Works Information, Notices and Flyer Samples, Example – Subject to Work Requirement – Work Activities, last accessed Oct. 5, 2018, https://ardhs.sharepointsite.net/ARWorks/Notice_Samples/4.%20Example%20%E2%80%93%20Subject%20to%20Work%20 Requirement%20%E2%80%93%20Work%20Activities.pdf. Another notice informs enrollees that they are subject to the work requirement but do not have to report work activities because they qualify for an exemption and includes a specific exemption end date. The sample notice posted by the state online uses pregnancy as the exemption reason. AR Works Information, Notices and Flyer Samples, Example – Subject to Work Requirement – Exempt, last accessed Oct. 5, 2018, https://ardhs.sharepointsite.net/ARWorks/Notice_Samples/5.%20Example%20%E2%80%93%20Subject%20to%20Work%20 Requirement%20%E2%80%93%20Exempt.pdf. ↩︎
  12. Multiple online videos go through how to set up an online account and report work activities. A one-minute video has a narrator announcing changes and holding up sheets of paper that enrollees should look for in the mail. This video also directs enrollees to follow the AR DHS Facebook page for more information and updates and directs enrollees to call DHS to report their email addresses. AR Works work requirement: Introduction to changes video (published March 20, 2018), https://www.youtube.com/watch?v=u8Dzra91Cz8&feature=youtu.be. Another 2.5-minute video goes through the need and process for setting up an online account. This video notes that even people who think they will be exempt from the requirement need to link accounts and report. AR Works work requirement: How to Link your Account video (published April 2, 2018), https://www.youtube.com/watch?v=pkfct7Px3MQ&feature=youtu.be. ↩︎
  13. See Ark. Dep’t of Human Servs., Ark. Works Sec. 1115 Demonstration Waiver Quarterly Report at 6 (April 1, 2018-June 30, 2018), https://www.medicaid.gov/Medicaid-CHIP-Program-Information/By-Topics/Waivers/1115/downloads/ar/Health-Care-Independence-Program-Private-Option/ar-works-qtrly-rpt-apr-jun-2018.pdf (listing state outreach activities). ↩︎
  14. AFMC also provides an inbound integrated voice response system where enrollees can receive information about the new requirements. Eligibility and Enrollment Monitoring Plan, Ark. Works – Work and Comm’y Engagement Amendment at 3 (approved by CMS, May 31, 2018), https://www.medicaid.gov/Medicaid-CHIP-Program-Information/By-Topics/Waivers/1115/downloads/ar/Health-Care-Independence-Program-Private-Option/ar-works-elig-enrllmnt-plan-05312018.pdf. ↩︎
  15. During the phase-in, AFMC begins outreach to existing beneficiaries 30 days before they become subject to the new requirements. Id. ↩︎
  16. AFMC does outreach to newly approved enrollees subject to the work requirement in the first 12 days after Medicaid eligibility is approved. Id. ↩︎
  17. Id. ↩︎
  18. Ark. Dep’t of Human Servs., Ark. Works Sec. 1115 Demonstration Waiver Quarterly Report at 5 (April 1, 2018-June 30, 2018), https://www.medicaid.gov/Medicaid-CHIP-Program-Information/By-Topics/Waivers/1115/downloads/ar/Health-Care-Independence-Program-Private-Option/ar-works-qtrly-rpt-apr-jun-2018.pdf. ↩︎
  19. Anuj Gangopadhyaya, et al. Medicaid Work Requirements in Arkansas: Who Could Be Affected? at 4 (May 2018), https://www.urban.org/sites/default/files/publication/98483/2001846_2018.05.23_arkansas_medicaid_finalized.pdf. Additional data show that among all states in 2015, Arkansas households reported the second-lowest rate of computer and internet use and the second-lowest rate of broadband access. Id. at n. 27 (citing “Table 702.60: Number and Percentage of Households with Computer and Internet Access, by State, 2015,” National Center for Education Statistics, Digest of Education Statistics, accessed May 8, 2018; and Ryan, Camille, and Jamie M. Lewis. 2017. “Computer and Internet Use in the United States: 2015.” ACS-37. Washington, DC: US Census Bureau.). ↩︎
  20. Ark. Works Introduction to Work Requirement video, https://ardhs.sharepointsite.net/ARWorks/work_requirement/index.html, last accessed with error screens, Oct. 5, 2018. ↩︎
  21. AR Works Information, Notices and Flyer Samples, Example – Subject to Work Requirement – Work Activities, last accessed Oct. 5, 2018, https://ardhs.sharepointsite.net/ARWorks/Notice_Samples/4.%20Example%20%E2%80%93%20Subject%20t%20Work%20 Requirement%20%E2%80%93%20Work%20Activities.pdf. ↩︎
  22. AR Works work requirement: How to Link Your Account video, last accessed Oct. 5, 2018, https://ardhs.sharepointsite.net/ARWorks/default.aspx. ↩︎
  23. Id.; see also Ark. Dep’t of Human Servs., Linking Your Online Account to Your Health Care Coverage slide set, last accessed Oct. 5, 2018, https://ardhs.sharepointsite.net/ARWorks/sso_linking/index.html. ↩︎
  24. Id. ↩︎
  25. Ark. Works Sec. 1115 Demonstration, Expenditure Authority, ¶ 2 (March 5, 2018 through Dec. 31, 2021, amended March 5, 2018), https://www.medicaid.gov/Medicaid-CHIP-Program-Information/By-Topics/Waivers/1115/downloads/ar/ar-works-ca.pdf. The online portal was available to enrollees beginning on March 30, 2018 to begin creating and linking their online accounts and reporting exemptions. Ark. Dep’t of Human Servs., Arkansas Works Section 1115 Demonstration Waiver Quarterly Report at 7 (Jan. 1, 2018-March 31, 2018), https://www.medicaid.gov/Medicaid-CHIP-Program-Information/By-Topics/Waivers/1115/downloads/ar/Health-Care-Independence-Program-Private-Option/ar-works-qtrly-rpt-jan-mar-2018.pdf. ↩︎
  26. The online reporting requirement is authorized through expenditure authority, authorizing spending for enrollee monthly reporting of work activities and exemptions only through the online portal, inconsistent with 42 CFR § 435.97 (a), which requires states to accept information by website, phone, mail, in person, and other commonly available electronic means. Ark. Works Sec. 1115 Demonstration, Expenditure Authority, ¶ 2 (March 5, 2018 through Dec. 31, 2021, amended March 5, 2018), https://www.medicaid.gov/Medicaid-CHIP-Program-Information/By-Topics/Waivers/1115/downloads/ar/ar-works-ca.pdf. ↩︎
  27. Ark. Dep’t of Human Servs., Ark. Works Sec. 1115 Demonstration Waiver Quarterly Report at 7 (April 1, 2018-June 30, 2018), https://www.medicaid.gov/Medicaid-CHIP-Program-Information/By-Topics/Waivers/1115/downloads/ar/Health-Care-Independence-Program-Private-Option/ar-works-qtrly-rpt-apr-jun-2018.pdf. ↩︎
  28. Individuals may become a registered reporter by reviewing specified online training material, signing a Registered Reporter Acknowledgement Form and emailing that form to Arkansas DHS. The online training material consists of two slidesets on how to report work activities and exemptions and how to link an enrollee’s online account with her health coverage. Ark. Works, Registered Reporter of Work and Community Engagement Activities Acknowledgement Form, last accessed Oct. 5, 2018, https://ardhs.sharepointsite.net/ARWorks/Forms/AR_Works_Registered_Reporter_Acknowledgment_Form.pdf. ↩︎
  29. KFF, An Early Look at State Data for Medicaid Work Requirements in Arkansas (Sept. 2018), https://modern.kff.org/medicaid/issue-brief/an-early-look-at-state-data-for-medicaid-work-requirements-in-arkansas/; see also Ark. Dep’t of Human Servs,. Ark. Works Program, Aug. 2018 Report (data as of Sept. 9, 2018, released Sept. 12, 2018), https://humanservices.arkansas.gov/images/uploads/newsroom/091218_AWReport_Final.pdf. ↩︎
  30. In contrast to the monthly online Arkansas Works reporting requirement, the state confirmed that Arkansas SNAP enrollees report their employment and training compliance to their caseworker semi-annually or whenever they experience a change in circumstances. ↩︎
  31. Other exemptions, accounting for about 8% of total exemptions, include pregnancy, caring for someone who is incapacitated, short-term incapacity, receiving unemployment benefits, receiving education and training, participating in an alcohol or drug treatment program and American Indian / Alaska Natives. American Indian / Alaska Natives are subject to the requirements but will be phased in at a later date. KFF, An Early Look at State Data for Medicaid Work Requirements in Arkansas (Sept. 2018), https://modern.kff.org/medicaid/issue-brief/an-early-look-at-state-data-for-medicaid-work-requirements-in-arkansas/; see also Ark. Dep’t of Human Servs,. Ark. Works Program, Aug. 2018 Report (data as of Sept. 9, 2018, released Sept. 12, 2018), https://humanservices.arkansas.gov/images/uploads/newsroom/091218_AWReport_Final.pdf. ↩︎
  32. Id. ↩︎
  33. Eligibility and Enrollment Monitoring Plan, Ark. Works – Work and Comm’y Engagement Amendment at 4 (approved by CMS, May 31, 2018), https://www.medicaid.gov/Medicaid-CHIP-Program-Information/By-Topics/Waivers/1115/downloads/ar/Health-Care-Independence-Program-Private-Option/ar-works-elig-enrllmnt-plan-05312018.pdf. ↩︎
  34. Ark. Dep’t of Human Servs., Reporting Work Activities and Exemptions for Arkansas Works slide set, last accessed Oct. 5, 2018, https://ardhs.sharepointsite.net/ARWorks/reporting/index.html. ↩︎
  35. Id. ↩︎
  36. Ark. Dep’t of Human Servs., AR Works Information for Students, last accessed Oct. 5, 2018, https://ardhs.sharepointsite.net/ARWorks/Outreach/Information_for_Students.pdf. ↩︎
  37. Id. ↩︎
  38. The state outreach materials, such as enrollee flyers, do not specify timeframes for particular exemption types, although they are contained in the state policy manual. Compare Ark. Dep’t of Human Servs., AR Works Work Requirement Work Activities and Exemptions, last accessed Oct. 5, 2018, https://ardhs.sharepointsite.net/ARWorks/Outreach/Work_Requirement_Activities_and_Exemptions.pdf, with Ark. Dep’t of Human Servs., Div. of Cnty. Operations, Med. Servs. Pol’y Manual, § G-190 Verification of the Adult Expansion Group Work and Cmty. Engagement Requirement (May 1, 2018), https://ardhs.sharepointsite.net/DHSPolicy/DCOPublishedPolicy/Section%20G-100%20Verification%20Standards.pdf. ↩︎
  39. Ark. Dep’t of Human Servs, Div. of Cnty Operations, Med. Servs. Pol’y Manual, Appendix Y (May 1, 2018), https://ardhs.sharepointsite.net/DHSPolicy/DCOPublishedPolicy/Appendix%20Y-Work%20Activity%20Chart.pdf. ↩︎
  40. Ark. Dep’t of Human Servs., Flyer – AR Works Work Requirement Info, “What You Need to Know About the Work Requirement”, last accessed Oct. 5, 2018, https://ardhs.sharepointsite.net/ARWorks/Notice_Samples/1.%20Flyer%20%E2%80%93%20AR%20Works%20Work%20 Requirement%20Info.pdf. ↩︎
  41. See, e.g., Eligibility and Enrollment Monitoring Plan, Ark. Works – Work and Comm’y Engagement Amendment at 4-5, 13 (approved by CMS, May 31, 2018), https://www.medicaid.gov/Medicaid-CHIP-Program-Information/By-Topics/Waivers/1115/downloads/ar/Health-Care-Independence-Program-Private-Option/ar-works-elig-enrllmnt-plan-05312018.pdf. ↩︎
  42. Compare AR Works Information, Notices and Flyer Samples, Example – Post Closure Letter, last accessed Oct. 5, 2018, https://ardhs.sharepointsite.net/ARWorks/Notice_Samples/8.%20Example%20%E2%80%93%20Post%20Closure%20Letter.pdf, with AR Works Information, Notices and Flyer Samples, Example – Subject to Work Requirement – Work Activities, last accessed Oct. 5, 2018, https://ardhs.sharepointsite.net/ARWorks/Notice_Samples/4.%20Example%20%E2%80%93%20Subject%20to%20Work%20 Requirement%20%E2%80%93%20Work%20Activities.pdf. ↩︎
  43. Ark. Dep’t of Human Servs, Div. of Cnty. Operations, Med. Servs. Pol’y Manual, § F-201 Good Cause Exemptions (May 1, 2018), https://ardhs.sharepointsite.net/DHSPolicy/DCOPublishedPolicy/Section%20F-200%20Work%20Requirement%20for%20the%20Adult%20Expansion%20Group.pdf; AR Works Information, Notices and Flyer Samples, Example – Post Closure Letter, last accessed Oct. 5, 2018, https://ardhs.sharepointsite.net/ARWorks/Notice_Samples/8.%20Example%20%E2%80%93%20Post%20Closure%20Letter.pdf. ↩︎
  44. See, e.g., Despite elimination of backlog, Medicaid re-determination process not quick, Ark. News (Sept. 21, 2015), http://www.arkansasnews.com/news/arkansas/despite-elimination-backlog-medicaid-re-determination-process-not-quick. ↩︎
  45. Eligibility and Enrollment Monitoring Plan, Ark. Works – Work and Comm’y Engagement Amendment at 4 (approved by CMS, May 31, 2018), https://www.medicaid.gov/Medicaid-CHIP-Program-Information/By-Topics/Waivers/1115/downloads/ar/Health-Care-Independence-Program-Private-Option/ar-works-elig-enrllmnt-plan-05312018.pdf. ↩︎
  46. KFF, An Early Look at State Data for Medicaid Work Requirements in Arkansas (Sept. 2018), https://modern.kff.org/medicaid/issue-brief/an-early-look-at-state-data-for-medicaid-work-requirements-in-arkansas/; see also Ark. Dep’t of Human Servs., Ark. Works Program, Aug. 2018 Report (data as of Sept. 9, 2018, released Sept. 12, 2018), https://humanservices.arkansas.gov/images/uploads/newsroom/091218_AWReport_Final.pdf. ↩︎
  47. Id. ↩︎
  48. The waiver terms and conditions require the state, “[p]rior to implementation of community engagement requirements as a condition of eligibility,” to “[e]nsure [that] the state will assess areas within the state that experience high rates of unemployment, areas with limited economies and/or educational opportunities, and areas with lack of public transportation to determine whether there should be further exemptions or alternative compliance standards from the community engagement requirements and/or additional mitigation strategies, so that the community engagement requirements will not be impossible or unreasonably burdensome for beneficiaries to meet in impacted areas.” CMS, Special Terms & Conditions, Ark. Works, No. 11-W-00287/6 at ¶ 54 (e) (March 5-Dec. 31, 2018), https://www.medicaid.gov/Medicaid-CHIP-Program-Information/By-Topics/Waivers/1115/downloads/ar/ar-works-ca.pdf. ↩︎
  49. DHS is in negotiations to add 15 more counties by the end of 2018, leaving 25 counties without a SNAP E&T physical location during the initial 7 months of implementation, and 10 counties remaining in 2019. Eligibility and Enrollment Monitoring Plan, Arkansas Works – Work and Community Engagement Amendment at 1 (approved by CMS, May 31, 2018), https://www.medicaid.gov/Medicaid-CHIP-Program-Information/By-Topics/Waivers/1115/downloads/ar/Health-Care-Independence-Program-Private-Option/ar-works-elig-enrllmnt-plan-05312018.pdf. ↩︎
  50. See, e.g., AR. Works Information, Notices and Flyer Samples, Example – Subject to Work Requirement – Work Activities, last accessed Aug. 10, 2018, https://ardhs.sharepointsite.net/ARWorks/Notice_Samples/4.%20Example%20%E2%80%93%20Subject%20to%20Work%20 Requirement%20%E2%80%93%20Work%20Activities.pdf. ↩︎
  51. Eligibility and Enrollment Monitoring Plan, Ark. Works – Work and Comm’y Engagement Amendment at 2 (approved by CMS, May 31, 2018), https://www.medicaid.gov/Medicaid-CHIP-Program-Information/By-Topics/Waivers/1115/downloads/ar/Health-Care-Independence-Program-Private-Option/ar-works-elig-enrllmnt-plan-05312018.pdf. Specific services listed on DWS’s website include job search training, resume assistance, job listings, occupational skills assessments, registered apprenticeships, college and career planning, and career readiness certification. See generally Ark. Dep’t of Workforce Servs., Jobseeker Servs., last accessed Oct. 5, 2018, https://www.dws.arkansas.gov/jobseekers/. Career readiness certification is described as a credential that individuals can obtain to demonstrate to potential employers that they possess basic workplace skills such as reading for information, applied mathematics, and locating information in graphics. Ark. Career Readiness Certificate Brochure, last accessed Oct. 5, 2018, http://www.state.ar.us/esd/Programs/CRC/PDF/CRC%20Job%20Seeker%20Brochure%20(Final%20Copy%20%2715).pdf ↩︎
  52. Eligibility and Enrollment Monitoring Plan, Ark. Works – Work and Comm’y Engagement Amendment at 2-3 (approved by CMS, May 31, 2018), https://www.medicaid.gov/Medicaid-CHIP-Program-Information/By-Topics/Waivers/1115/downloads/ar/Health-Care-Independence-Program-Private-Option/ar-works-elig-enrllmnt-plan-05312018.pdf. ↩︎
  53. KFF, Medicaid and Work Requirements: New Guidance, State Waiver Details and Key Issues (Jan. 2018), https://modern.kff.org/medicaid/issue-brief/medicaid-and-work-requirements-new-guidance-state-waiver-details-and-key-issues/. ↩︎
  54. The state also reported that there are no waiting lists for SNAP employment and training services. ↩︎
  55. Eligibility and Enrollment Monitoring Plan, Ark. Works – Work and Comm’y Engagement Amendment, at 2 (approved by CMS, May 31, 2018), https://www.medicaid.gov/Medicaid-CHIP-Program-Information/By-Topics/Waivers/1115/downloads/ar/Health-Care-Independence-Program-Private-Option/ar-works-elig-enrllmnt-plan-05312018.pdf. ↩︎
  56. House Appropriations Comm., Minibus #2 Summary: The Fiscal Year 2019 Labor, Health and Human Servs., Education Funding Bill (Div. B) at 1, last accessed Oct. 5, 2018, https://appropriations.house.gov/uploadedfiles/minibus_2_-_fy_2019_labor_hhs_appropriations_bill_-_summary.pdf. ↩︎
  57. Ark. Works Resource Dashboard, last accessed Oct. 5, 2018, https://ardhs.sharepointsite.net/ARWorks/resource_dashboard/index.html. ↩︎
  58. Ark. Workforce Centers, Resources, last accessed Oct. 5, 2018, https://www.arjoblink.arkansas.gov/ada/r/resources. ↩︎
  59. Ark. Found. for Med’l Care, Arkansans on Arkansas Works, last accessed Oct. 5, 2018, https://afmc.org/individuals/arkansans-on-arkansas-works/. ↩︎
  60. KFF, An Early Look at State Data for Medicaid Work Requirements in Arkansas (Sept. 2018), https://modern.kff.org/medicaid/issue-brief/an-early-look-at-state-data-for-medicaid-work-requirements-in-arkansas/; see also Ark. Dep’t of Human Servs., Ark. Works Program, Aug. 2018 Report (data as of Sept. 9, 2018, released Sept. 12, 2018), https://humanservices.arkansas.gov/images/uploads/newsroom/091218_AWReport_Final.pdf. The Arkansas Department of Human Services has released monthly data about the new requirements since June 2018. ↩︎
  61. AR Works Information, Notices and Flyer Samples, Example – Non-Compliance Closure, last accessed Oct. 5, 2018, https://ardhs.sharepointsite.net/ARWorks/Notice_Samples/7.%20Example%20%E2%80%93%20Non-Compliance%20Closure.pdf. ↩︎
  62. Arkansas reported enrollment of 334,113 individuals in Jan. 2017. Ark. Dep’t of Human Servs., Ark. Works Sec. 1115 Demonstration Waiver Final Report at 3 (Jan. 1, 2017-Dec. 31, 2017), https://www.medicaid.gov/Medicaid-CHIP-Program-Information/By-Topics/Waivers/1115/downloads/ar/Health-Care-Independence-Program-Private-Option/ar-works-qtrly-rpt-jan-dec-2017.pdf. Enrollment was 301,745 in Jan. 2018. Ark. Dep’t of Human Servs., Ark. Works Sec. 1115 Demonstration Waiver Quarterly Report at 3 (Jan. 1, 2018-March 31, 2018), https://www.medicaid.gov/Medicaid-CHIP-Program-Information/By-Topics/Waivers/1115/downloads/ar/Health-Care-Independence-Program-Private-Option/ar-works-qtrly-rpt-jan-mar-2018.pdf. Enrollment was 284,031 in June 2018.   Ark. Dep’t of Human Servs., Ark. Works Sec. 1115 Demonstration Waiver Quarterly Report at 3 (April 1, 2018-June 30, 2018), https://www.medicaid.gov/Medicaid-CHIP-Program-Information/By-Topics/Waivers/1115/downloads/ar/Health-Care-Independence-Program-Private-Option/ar-works-qtrly-rpt-apr-jun-2018.pdf ↩︎
  63. KFF, A Look at the Private Option in Arkansas (Aug. 2015), https://modern.kff.org/medicaid/issue-brief/a-look-at-the-private-option-in-arkansas/. ↩︎
  64. Ark. Dep’t of Human Servs., Ark. Works Sec. 1115 Demonstration Waiver Quarterly Report at 9 (April 1, 2018-June 30, 2018), https://www.medicaid.gov/Medicaid-CHIP-Program-Information/By-Topics/Waivers/1115/downloads/ar/Health-Care-Independence-Program-Private-Option/ar-works-qtrly-rpt-apr-jun-2018.pdf. ↩︎
  65. CMS, Special Terms & Conditions, Ark. Works, No. 11-W-00287/6 at ¶ ¶ 77, 85 (March 5-Dec. 31, 2018), https://www.medicaid.gov/Medicaid-CHIP-Program-Information/By-Topics/Waivers/1115/downloads/ar/ar-works-ca.pdf. ↩︎
  66. KFF, Implications of a Medicaid Work Requirement: National Estimates of Potential Coverage Losses (June, 2018), https://modern.kff.org/medicaid/issue-brief/implications-of-a-medicaid-work-requirement-national-estimates-of-potential-coverage-losses/; KFF, Implications of Emerging Waivers on Streamlined Medicaid Enrollment and Renewal Processes (Feb. 2018), https://modern.kff.org/medicaid/fact-sheet/implications-of-emerging-waivers-on-streamlined-medicaid-enrollment-and-renewal-processes/. ↩︎
  67. KFF, An Early Look at State Data for Medicaid Work Requirements in Arkansas (Sept. 2018), https://modern.kff.org/medicaid/issue-brief/an-early-look-at-state-data-for-medicaid-work-requirements-in-arkansas/; see also Ark. Dep’t of Human Servs., Ark. Works Program, Aug. 2018 Report (data as of Sept. 9, 2018, released Sept. 12, 2018), https://humanservices.arkansas.gov/images/uploads/newsroom/091218_AWReport_Final.pdf. The Arkansas Department of Human Services has released monthly data about the new requirements since June 2018. ↩︎
  68. Stakeholders expressed particular concern about potential adverse impacts of the new requirements on individuals with substance use disorders, although it was too early to determine the extent of coverage losses among this population. ↩︎
  69. J. Craig Wilson and Joseph Thompson. Nation’s First Medicaid Work Requirement Sheds Thousands From Rolls In Arkansas. Health Affairs Blog (Oct. 2, 2018), https://www.healthaffairs.org/do/10.1377/hblog20181001.233969/full/#.W7Os7jIuWjc.twitter.   ↩︎
Federal Legislation to Address the Opioid Crisis: Medicaid Provisions in the SUPPORT Act

Authors: MaryBeth Musumeci and Jennifer Tolbert
Published: Oct 5, 2018

On October 24, 2018, President Trump signed into law, the Substance Use Disorder Prevention that Promotes Opioid Recovery and Treatment for Patients and Communities (SUPPORT) Act. The comprehensive, bipartisan legislation to address the opioid epidemic, which passed overwhelmingly in both the House and Senate, tackles many aspects of the epidemic, including treatment, prevention, recovery, and enforcement. While very broad in scope, the final legislation contains a number of provisions related to Medicaid’s role in helping states provide coverage and services to people who need substance use disorder (SUD) treatment, particularly those needing opioid use disorder (OUD) treatment.

Medicaid Provisions in the SUPPORT Act

The Medicaid-related provisions in the SUPPORT Act are summarized in Table 1. These include:

Services. The most controversial measure in the bill amends the long-standing prohibition against the use of federal Medicaid funds for services in “institutions for mental disease” (IMDs) for nonelderly adults by creating a state option from 10/1/19 to 9/30/23 to cover those services up to 30 days in a year for individuals with a substance use disorder. To be eligible to receive federal matching funds, states must meet maintenance of effort and other requirements. Proponents of this provision argue that the measure is necessary to enable Medicaid to provide services across the full care continuum, while opponents maintain that states already are covering Medicaid IMD SUD services through waivers. CBO estimated a cost of $1.048 billion over ten years for this provision, the single most costly provision in the bill. The bill also codifies the Medicaid managed care regulation that allows Medicaid funds for managed care capitation payments that include IMD services up to 15 days per month.

The SUPPORT Act also requires state Medicaid programs to cover medication-assisted treatment (MAT), including all FDA-approved drugs, counseling services, and behavioral therapy, from October 2020 through September 2025, unless a state certifies to the Secretary’s satisfaction that statewide implementation is infeasible due to provider shortages. Most states cover buprenorphine and naltrexone, while fewer cover methadone. In addition, the SUPPORT Act extends the 90% enhanced federal match for Medicaid health home services focused on care coordination for beneficiaries with SUD from 8 to 10 quarters for states that elect that option.

In addition, it creates a state plan option to provide residential pediatric recovery center services to infants with neonatal abstinence syndrome.

Eligibility and Enrollment. The SUPPORT Act prohibits states from terminating Medicaid eligibility for an individual under age 21 or former foster care youth up to age 26 while incarcerated and requires states to redetermine eligibility prior to release without requiring a new application and restore coverage upon release. While Medicaid does not pay for health care services during incarceration, this measure is intended to facilitate access to coverage and care after release from prison or jail. The SUPPORT Act also requires states to cover former foster care youth up to age 26 from any state. This eliminates the need for states to get a Section 1115 waiver to cover former foster care youth from other states.

Demonstrations. The SUPPORT Act authorizes new demonstrations to help states increase Medicaid SUD provider capacity. The HHS Secretary would award 18-month planning grants, totaling $50 million, to 10 states, giving preference to those with average or higher SUD prevalence, particularly opioid use disorder. The Secretary would then select up to 5 states to receive enhanced federal matching funds for Medicaid SUD treatment services during the 36 month waiver implementation. The bill also requires the Secretary to issue guidance on how states can use Section 1115 demonstrations to improve health care transitions for individuals being released from prison or jail, including assistance with Medicaid enrollment and coverage of services 30 days prior to release.

Prescription Drug Oversight. The SUPPORT Act requires states to have drug utilization review safety edits in place for opioid refills, monitor concurrent prescribing of opioids and other drugs, and monitor antipsychotic prescribing for children. The bill also requires states to have Medicaid providers check prescription drug monitoring programs before prescribing controlled substances and offers enhanced federal matching funds for implementation activities if states have agreements with contiguous states for providers to access these programs.

Quality Measures. The SUPPORT Act requires state Medicaid programs to report annually on behavioral health quality measures in CMS’s adult core set beginning with 2024. These measures currently are voluntary.

Guidance and Studies. The SUPPORT Act directs the HHS Secretary to issue guidance on Medicaid-covered services and payment models for infants with neonatal abstinence syndrome and their families, state options for SUD telehealth services and Medicaid services for non-opioid pain management. It further requires the Secretary to make recommendations to improve Medicaid coverage and payment for MAT, non-opioid pain management, and SUD treatment services; report to Congress on best practices for reducing children’s barriers to Medicaid SUD telehealth services; report state-level data on Medicaid SUD prevalence and treatment services; and report and provide technical assistance to states on Medicaid housing-related services and supports for enrollees with SUD. The Secretary also must issue guidance on state options to use Medicaid funds for family-focused residential treatment programs. The bill also requires GAO to study gaps in Medicaid coverage for pregnant and postpartum women with SUD, Medicaid peer support services, children’s access to SUD services including telehealth, Medicaid SUD payment rates, and barriers to providing SUD treatment medication under various distribution models, and directs MACPAC to study IMDs that receive Medicaid payments and state Medicaid MAT utilization control policies.

The SUPPORT Act includes several offsets, including one Medicaid offset. The Medicaid offset allows states to retain medical loss ratio (MLR) remittances from managed care plans for the ACA expansion group at their regular FMAP, instead of the enhanced FMAP, if they establish an 85% MLR after FY 2020 and before FY 2024.

Table 1: Medicaid Provisions in the SUPPORT Act, H.R. 6
TopicSectionSummary
Eligibility and Enrollment for Criminal Justice Involved Youth1001Prohibits state Medicaid programs from terminating eligibility for an individual under age 21 or former foster care youth up to age 26 while incarcerated. State must redetermine eligibility prior to release, without requiring a new application, and if still eligible, restore coverage upon release. Effective 1 year after enactment.
Eligibility and Enrollment for Former Foster Care Youth Across State Lines1002Requires states to ensure that Medicaid foster care youth who were enrolled at age 18 can retain coverage in any state until age 26. Effective for those who turn 18 on or after 1/1/23. HHS Secretary must issue guidance on best practices for ensuring streamlined timely Medicaid access and conducting outreach to former foster care youth within 1 year of enactment.
Demonstrations to Increase Medicaid SUD Provider Capacity1003Authorizes demonstrations to increase Medicaid SUD provider capacity, beginning within 6 months of enactment. In the first 18 months, Secretary shall award planning grants to at least 10 states, totaling $50 million, ensuring geographic diversity and giving preference to states with SUD, particularly opioid use disorder, prevalence comparable to or higher than the national average. In the remaining 36 months, Secretary shall select up to 5 of these states to receive enhanced federal matching funds for a portion of state spending on Medicaid SUD treatment services.
Prescription Drug Utilization Review Requirements for Opioids and Children’s Antipsychotics1004Requires state Medicaid programs to have drug utilization review safety edits for opioid refills and an automated claims review process to identify refills in excess of state limits, monitor concurrent prescribing of opioids and benzodiazepines or antipsychotics, and require managed care plans to have these processes in place as of 10/1/19. States also must have a program to monitor and annually report on antipsychotic prescribing for children generally and those in foster care and a process to identify potential controlled substance fraud or abuse by Medicaid enrollees, providers or pharmacies. Exempts those receiving cancer treatment or hospice/palliative care, in long-term care facilities, and those whom state elects to exempt. Secretary shall waive requirements during natural disasters and for emergency services. Also adds excessive utilization to existing drug utilization review criteria as of 10/20/18.
HHS Guidance on Services and Payment Models for Infants with Neonatal Abstinence Syndrome and Parents with SUD; GAO Study on Medicaid Gaps for Pregnant Women with SUD1005Requires HHS Secretary to issue guidance within 1 year of enactment to improve care for infants with neonatal abstinence syndrome and their families. Guidance will include best practices for innovative or evidence-based payment models for parents with SUD and infants with NAS; recommendations on financing options for parents with SUD, infants with NAS, and home visiting services; technical assistance to states for additional flexibilities and incentives related to screening, prevention, and post-discharge services, including parenting supports; and suggested terminology and ICD codes to identify infants with NAS and neonatal withdrawal syndrome. Also requires GAO to study gaps in Medicaid coverage for pregnant and postpartum women with SUD within 1 year of enactment.
SUD Health Homes Enhanced FMAP Expansion; Required MAT Coverage1006Extends enhanced federal matching rate for new Medicaid health home activities targeted to beneficiaries with SUD from 8 quarters to 10 quarters for SPAs approved on or after 10/1/18. States receiving the extended enhanced FMAP must report on the access to and quality of health home services provided to eligible individuals and total expenditures for these services. HHS Secretary to post online best practices for SUD focused health homes by 10/1/20.

Also requires state Medicaid programs to cover all FDA-approved MAT drugs, from 10/1/20-9/30/25, including methadone, licensed biological products to treat opioid use disorder, and counseling services and behavioral therapy, unless state certifies to Secretary’s satisfaction that statewide implementation for all Medicaid eligible individuals would not be feasible due to provider or facility shortage.

Provider Agreements for Residential Pediatric Recovery Centers1007Creates Medicaid state plan option to provide residential pediatric recovery centers for inpatient or outpatient services for infants under age 1 with NAS and their families, as of date of enactment.
GAO Report on Peer Support Services1008Directs GAO to report within 2 years of enactment on Medicaid peer support services, including coverage mechanisms, populations, payment models, and spending, and make legislative and administrative recommendations to improve services and access.
HHS Guidance and GAO and Secretary Reporting on SUD Telehealth Services1009Directs Secretary to issue guidance within 1 year of enactment on state options for federal Medicaid reimbursement for SUD services using telehealth, to address needs of high risk individuals, including at least AI/ANs, adults under 40, individuals with history of nonfatal overdose, and individuals with a co-occurring serious mental illness and SUD; SUD provider education using hub and spoke model, through managed care contracts, through administrative claiming for disease management activities, and under DSRIP; and services in school-based health centers.

Directs GAO to report within 1 year of enactment on children’s access to Medicaid SUD services, including options to increase telehealth SUD providers in school-based health centers, particularly in rural or underserved areas, and Medicaid SUD provider reimbursement rates.

Directs Secretary to report to Congress within 1 year of enactment on best practices for reducing barriers to telehealth SUD services for Medicaid children.

Enhancing Patient Access to Non-Opioid Treatment Options1010Directs HHS Secretary to issue guidance on mandatory and optional Medicaid services for non-opioid pain treatment and management by 1/1/19.
GAO Study on MAT Drug Distribution Models1011Directs GAO to report within 15 months of enactment on barriers to providing SUD medications under various drug distribution models and options for Medicaid programs to remove or reduce the barriers.
Other Medicaid Services for Pregnant Women in IMDs1012Authorizes Medicaid payments for services provided outside IMDs for pregnant and postpartum women receiving IMD SUD services, as of date of enactment.  
IMD Managed Care Capitation Payments1013Codifies Medicaid managed care regulation allowing capitation payments to include IMD services up to 15 days per month.
MACPAC Report on MAT Utilization Controls1014Directs MACPAC to report on state Medicaid program policies for MAT utilization control, including managed care and FFS, and identify policies that limit access by limiting quantities without evaluating the potential for fraud, waste, or abuse, within 1 year of enactment.
Medicaid Data on SUD Prevalence and Services1015Directs HHS Secretary to publish online report with state-level data on SUD prevalence in Medicaid population and receipt of Medicaid SUD treatment services through managed care, FFS, and alternative payment models, within 1 year of enactment and updated annually through 2024.
Prescription Drug Monitoring Program1016Directs state Medicaid programs to facilitate reasonable access to prescription drug monitoring programs for Medicaid providers and MCOs, to the extent allowed under state law, as of date of enactment.
HHS Report on Housing-Related Services and Supports for Enrollees with SUD at Risk of Homelessness1017Directs HHS Secretary to report on Medicaid initiatives and strategies to provide housing-related services and supports to enrollees with SUD who are at risk of homelessness within one year of enactment.
Technical Assistance on Housing-Related Services and Supports to Enrollees with SUD1018Directs HHS Secretary to provide technical assistance to states seeking to provide Medicaid housing-related services and supports and care coordination services to enrollees with SUD and issue an action plan to do so within 180 days of enactment.
State Reporting on Adult Behavioral Health Quality Measures5001Requires state Medicaid programs to report annually on behavioral health quality measures in CMS’s adult core set beginning with 2024.


IMD Payment MACPAC Study5011-5012Directs MACPAC to study Medicaid payments to IMDs in a representative sample of at least 2 states by January, 2020, including the number of IMDs, facility type, and any coverage limits; services provided and clinical assessment, reassessment, and discharge processes; any federal waivers and other Medicaid funding sources such as supplemental payments; state certification, licensure, and accreditation requirements; state quality, clinical, and facility standards; and recommendations for Congress and CMS to improve care, standards, and data collection.
Demonstrations to Facilitate Medicaid Enrollment and Provide Services Within 30 days of Incarceration Release5031-5032Requires HHS Secretary to issue a state Medicaid director letter within 1 year of enactment regarding Section 1115 demonstrations to improve transitions for individuals moving from incarceration to the community, including systems for assistance and education about Medicaid enrollment and providing health care services 30 days prior to release, based on best practices identified by Secretary-convened stakeholder group.  
Prescription Drug Monitoring Programs for Controlled Substances5041-5042Requires state Medicaid programs to have providers check prescription drug monitoring program for enrollee’s prescription drug history before prescribing a controlled substance, as of 10/1/21. Establishes criteria for PDMPs. Exempts enrollees who are receiving cancer treatment or hospice/palliative care, in long-term care or other facilities with single pharmacy contract, and those whom state elects to exempt. Secretary shall waive PDMP requirement for natural disasters and emergency services. States shall receive 100% FMAP for fiscal years 2019 and 2020 for PDMP implementation activities if state has agreements with contiguous states for providers to access PDMP. Secretary shall issue guidance on PDMP best practices by 10/1/19; shall determine which providers should be exempt from PDMP requirements by 10/1/20; and issue model practices, including MCO and pharmacy benefit manager access to enrollee data and beneficiary protections, to assist states with using PDMP data sharing agreements for monitoring fraud, waste and abuse; improving health care for those who transition in and out of Medicaid, may have other coverage in addition to Medicaid, or pay for prescriptions with cash; or other purposes by 10/1/20. GAO shall report on PDMP operations by 10/1/20. CMS shall publish guidance on increasing provider use of and best practices for PDMPs by 10/1/23. States shall report annually to Secretary on PDMP use and trends beginning in 2023.
HHS Recommendations to Improve Coverage and Payment for MAT, Non-Opioid Pain Management, and SUD Treatment Services6031-6032Directs HHS Secretary to develop, inter alia, Medicaid action plan and recommendations, including (1) review of coverage and payment of FDA-approved MAT and other therapies that manage pain and treat and minimize addiction risk to determine whether these policies have contributed to the opioid crisis; (2) payment and service delivery models to be tested by CMMI and other federal demonstrations, including value-based models, that may encourage MAT use and other therapies that manage pain and minimize addiction risk; (3) data collection to facilitate research and policy making regarding opioid addiction prevention and treatment coverage and payment; (4) review of access to MAT and other therapies that manage pain and treat and minimize addiction risk, including access for rural or medically underserved communities; and (5) review of coverage or payment barriers to patient access to FDA-approved non-opioid medical devices to manage pain, monitor SUD withdrawal and prevent overdoses, and treat SUD. Secretary shall convene stakeholder meeting and issue RFI within 3 months of enactment and issue report to Congress by 6/1/20.
IMD Payment for SUD Services5051-5052Creates 5-year state plan option, from 10/1/19 to 9/30/23, for states to use Medicaid funds for IMD and other medically necessary services for nonelderly adults ages 21-64 with at least one SUD for up to any 30 days in a 12-month period. Eligible IMDs must provide at least two forms of medication-assisted treatment for OUD. States must maintain funding for eligible individuals in IMDs and outpatient and community-based settings at least at levels for most recent fiscal year prior to enactment. State shall notify the Secretary of how it will ensure appropriate clinical screening to determine level of care, length of stay, and appropriate care settings; provide outpatient, inpatient, and residential services at multiple levels of care; and ensure successful transitions to lower levels of care. Authorizes Medicaid payments for services provided outside IMDs for individuals receiving IMD SUD services..
Guidance on SUD Services in Family-Focused Residential Treatment Programs8081Directs HHS Secretary to issue guidance identifying opportunities for states to use Medicaid funds for family-focused residential treatment programs that allow children to reside with pregnant and post-partum women and parents/guardians receiving SUD treatment and to coordinate with Title IV-E funding, within 6 months of enactment.

More Employers Are Paying For Telemedicine, But Enrollee Take-Up Has Been Relatively Low

Published: Oct 3, 2018

Telemedicine – the delivery of health services by providers at remote locations, such as through video conferencing or remote monitoring – has been seen as a way to possibly improve access to care while also lowering costs. In our 2018 Employer Health Benefit Survey, we find that the share of large employers offering health plans that cover telemedicine has increased significantly from 2015 – 2018. In this corresponding brief, we use employer claims data to measure the uptake of these services by employees and their family members.

The analysis of part of the Peterson-Kaiser Health System Tracker, an online information hub dedicated to monitoring and assessing the performance of the U.S. health system.

News Release

Premiums for Employer-Sponsored Family Health Coverage Rise 5% to Average $19,616; Single Premiums Rise 3% to $6,896  

Burden of Deductibles for Covered Workers Has Tripled Since 2008, Growing 8 Times Faster Than Wages

Published: Oct 3, 2018

1 in 5 Large Employers Gather Data from Workers’ Mobile Apps, FitBits or Other Wearable Devices

San Francisco, Calif. – Annual family premiums for employer-sponsored health insurance rose 5 percent to average $19,616 this year, extending a seven-year run of moderate increases, finds the 2018 benchmark Kaiser Family Foundation Employer Health Benefits Survey released today. On average, workers this year are contributing $5,547 toward the cost of family coverage, with employers paying the rest.

Annual premiums for single coverage increased 3 percent to $6,896 this year, with workers contributing an average of $1,186.

This year’s premium increases are comparable to the rise in workers’ wages (2.6%) and inflation (2.5%) during the same period. Over time, the increases continue to outpace wages and inflation. Since 2008, average family premiums have increased 55 percent, twice as fast as workers’ earnings (26%) and three times as fast as inflation (17%).

This year’s survey also finds the burden of deductibles on workers continuing to climb over time in two ways: a growing share of covered workers face a general annual deductible, and the average deductible is rising for those who face one.

“Health costs don’t rise in a vacuum. As long as out-of-pocket costs for deductibles, drugs, surprise bills and more continue to outpace wage growth, people will be frustrated by their medical bills and see health costs as huge pocketbook and political issues,” KFF President and CEO Drew Altman said.

Currently 85 percent of covered workers have a deductible in their plan, up from 81 percent last year and 59 percent a decade ago. The average single deductible now stands at $1,573 for those workers who have one, similar to last year’s $1,505 average but up sharply from $735 in 2008. These two trends result in a 212 percent total increase in the burden of deductibles across all covered workers.

Looked at another way, a quarter (26%) of all covered workers are now in plans with a deductible of at least $2,000, up from 22 percent last year and 15 percent five years ago.  Among covered workers at small firms (fewer than 200 workers), 42 percent face a deductible of at least $2,000.

“Deductibles of $2,000 or more are increasingly common in employer plans, which means the bills can pile up quickly for workers who require significant medical care,” said study lead author Gary Claxton, a KFF vice president and director of the Health Care Marketplace Project.

About 152 million Americans rely on employer-sponsored coverage, and the 20th annual survey of nearly 2,200 small and large employers provides a detailed picture of the trends affecting it. In addition to the full report and summary of findings released today, the journal Health Affairs is publishing an article online with select findings that will appear in its November issue, and KFF is releasing an updated interactive graphic that charts the survey’s premium trends by firm size, industry, and other factors.

The survey finds 57 percent of employers offer health benefits, similar to the share last year (53%) and five years ago (57%). Employers that do not offer health benefits to any workers tend to be small, and nearly half (47%) cite cost as the main reason they do not offer health benefits.

Some employers that offer health benefits provide financial incentives to workers who don’t enroll –either for enrolling in a spouse’s plan (13%) or otherwise opting out of their employer plan (16%).

The survey also probes employers’ expectations about how the 2017 tax law, which eliminated the Affordable Care Act’s tax penalty for people who do not have health insurance, would affect enrollment in employer coverage in future years. Overall 10 percent of all offering firms – and 24 percent of large ones – expect fewer workers and dependents to enroll because of the elimination of the tax penalty.

Among large firms that offer health benefits, one in five (21%) report they collect some information from workers’ mobile apps or wearable devices such as a FitBit or Apple Watch as part of their wellness or health promotion programs. That’s up from 14 percent last year.

Most large offering employers (70%) provide workers with opportunities to complete health risk assessments, which are questionnaires about enrollees’ medical history, health status, and lifestyle, or biometric screenings, which are health examinations conducted by a medical professional, or both. Thirty-eight percent of large offering firms provide incentives for workers to participate in these programs. The maximum financial incentives for these and other wellness programs often total $500 or more.

Other survey findings include:

  • High-deductible health plans with savings option. The survey finds 29 percent of firms that offer health benefits offer a high-deductible health plan with a savings option – a plan that either can work with a Health Savings Account or is linked to an employer-created Health Reimbursement Arrangement. Most (61%) of those firms offer only this type of plan to at least some of their workers. Overall, 29 percent of covered workers are enrolled in such plans.
  • Telemedicine. About three quarters (74%) of large offering firms (at least 200 workers) cover services provided through telemedicine, such as video chat and remote monitoring, which allow a patient to get care from a provider at a remote location. That’s up from 63 percent last year and 27% in 2015. A separate analysis also released today suggests very few workers are using telemedicine services in place of traditional in-person physicians visits, as less than 1 percent of all enrollees in large employer health plans used any telemedicine services in 2016.
  • Retail health clinics. Similarly, three quarters (76%) of large offering firms cover services received in retail clinics, such as those located in pharmacies, supermarkets and other retail stores. A small share also provide financial incentives for workers to use these clinics.

Methodology

The annual survey was conducted between January and July of 2018 and included 4,070 randomly selected, non-federal public and private firms with three or more employees (including 2,160 that responded to the full survey and 1,910 others that responded to a single question about offering coverage). For more information on the survey methodology, please visit the Survey Design and Methods Section.

Filling the need for trusted information on national health issues, the Kaiser Family Foundation is a nonprofit organization based in San Francisco, California.

Health Affairs is the leading peer-reviewed journal at the intersection of health, health care, and policy. Published monthly by Project HOPE, the journal is available in print, online, and on mobile phones. Additional and late-breaking content is found at www.healthaffairs.org

2018 Employer Health Benefits Survey

Published: Oct 3, 2018

Abstract

This annual survey of employers provides a detailed look at trends in employer-sponsored health coverage including premiums, employee contributions, cost-sharing provisions, offer rates, wellness programs, and employer practices. The 2018 survey included 2,160 interviews with non-federal public and private firms. Annual premiums for employer-sponsored family health coverage reached $19,616 this year, up 5% from last year, with workers on average paying $5,547 toward the cost of their coverage. The average deductible among covered workers in a plan with a general annual deductible is $1,573 for single coverage. Fifty-six percent of small firms and 98% of large firms offer health benefits to at least some of their workers, with an overall offer rate of 57%. Survey results are released in several formats, including a full report with downloadable tables on a variety of topics, a summary of findings, and an article published in the journal Health Affairs.

News release

  • A news release announcing the publication of the 2018 Employer Health Benefits Survey is available here.

Summary of findings

  • The Summary of Findings provides an overview of the 2018 survey results and is available under the Summary of Findings section.

Full report

  • The complete Employer Health Benefits Survey report includes over 200 exhibits and is available under the Report The “Report” section contains 14 separate sections. Users can view each section separately or download the section exhibits from the right side of the respective section page.

Health affairs

  •  This related brief on the Peterson-Kaiser Health System Tracker examines employer claims data to measure the uptake of telemedicine services by employees and their family members.

Web briefing

  • On Wednesday, October 3rd, 2018, the Kaiser Family Foundation held a reporters-only web briefing to release the 2018 Employer Health Benefits Survey.

Interactive graphic

Key exhibits-chartpack

  • Nearly thirty overview slides from the 2018 Employer Health Benefits Survey are available as a slideshow or PDF.

Additional resources

  • Standard errors for selected estimates are available in the Technical Supplement here.
  • Employer Health Benefits Surveys from 1998–2017 are available here. Please note that historic survey reports have not been revised with methodological changes.
  • Researchers may request a public use dataset by going to Contact Us and choosing “TOPIC: Health Costs.”

Researchers at the Kaiser Family Foundation and NORC at the University of Chicago designed and analyzed the survey.

Summary Of Findings

Employer-sponsored insurance covers over half of the non-elderly population; approximately 152 million nonelderly people in total.1 To provide current information about employer-sponsored health benefits, the Kaiser Family Foundation (KFF) conducts an annual survey of private and non-federal public employers with three or more workers. This is the twentieth survey and reflects employer-sponsored health benefits in 2018.

HEALTH INSURANCE PREMIUMS AND WORKER CONTRIBUTIONS

The average annual premiums for employer-sponsored health insurance in 2018 are $6,896 for single coverage and $19,616 for family coverage [Figure A]. Over the past year, the average single premium increased 3% and the average family premium increased 5%. Workers’ wages increased 2.6% and inflation increased 2.5% over the past year.2 The average premium for family coverage has increased 20% since 2013 and 55% since 2008 [Figure B].

While covered workers in small firms (3-199 workers) and large firms (200 or more workers) have similar average premiums for single coverage, covered workers in small firms have a lower average premium for family coverage ($18,739 vs. $19,972). Average premiums for high-deductible health plans with a savings option (HDHP/SOs) are considerably lower than the overall average for all plan types for both single and family coverage, at $6,459 and $18,602, respectively [Figure A]. The average premiums for covered workers in the Northeast are higher than the average premiums for workers in other regions for both single and family coverage; the average family premium for covered workers in the South is relatively low. Covered workers at private for-profit firms have lower average annual premiums than covered workers at public firms or private not-for-profit firms for both single and family coverage.

Most covered workers make a contribution toward the cost of the premium for their coverage. On average, covered workers contribute 18% of the premium for single coverage and 29% of the premium for family coverage. Workers in small firms contribute a higher average percentage of the premium for family coverage than workers in large firms (38% vs. 26%). On average, covered workers in firms with a relatively large share of lower-wage workers (where at least 35% of workers earn $25,000 a year or less) have higher contribution rates for single coverage (24% vs. 17%) and family coverage (42% vs. 29%) than those in firms with a smaller share of lower-wage workers.3

Twenty-seven percent of covered workers in small firms are in a plan where the employer pays the entire premium for single coverage, compared to 6% of covered workers in large firms. In contrast, 34% of covered workers in small firms are in a plan where they must contribute more than one-half of the premium for family coverage, compared to 8% of covered workers in large firms [Figure D].

The average annual dollar amounts contributed by covered workers for 2018 are $1,186 for single coverage and $5,547 for family coverage, similar to the amounts last year. The average dollar contribution for family coverage has increased 21% since 2013 and 65% since 2008 [Figure B]. Average contribution amounts for covered workers in HDHP/SOs are lower than average for both single and family coverage [Figure A]. Seven percent of covered workers, including 14% of covered workers in small firms, are in a plan with a worker contribution of $12,000 or more for family coverage.

Figure A: Average Annual Worker and Employer Premium Contributions and Total Premiums for Single and Family Coverage, by Plan Type, 2018

Figure A: Average Annual Worker and Employer Premium Contributions and Total Premiums for Single and Family Coverage, by Plan Type, 2018

Figure B: Average Annual Worker and Employer Premium Contributions and Total Premiums for Family Coverage, 2008, 2013, and 2018

Figure B: Average Annual Worker and Employer Premium Contributions and Total Premiums for Family Coverage, 2008, 2013, and 2018

Figure C: Cumulative Family Premium Increases and Workers' Earnings, 2000-2018

Figure C: Cumulative Family Premium Increases and Workers’ Earnings, 2000-2018

Figure D: Distribution of Percentage of Premium Paid by Covered Workers for Single and Family Coverage, by Firm Size, 2018

Figure D: Distribution of Percentage of Premium Paid by Covered Workers for Single and Family Coverage, by Firm Size, 2018

PLAN ENROLLMENT

PPOs continue to be the most common plan type, enrolling 49% of covered workers in 2018. Twenty-nine percent of covered workers are enrolled in a high-deductible plan with a savings option (HDHP/SO), 16% in an HMO, 6% in a POS plan, and less than one percent in a conventional (also known as an indemnity) plan [Figure E]. Covered workers in the South (55%) are more likely to be enrolled in PPOs than workers in other regions. Covered workers in the Midwest (39%) are more likely to be enrolled in HDHP/SOs than workers in other regions, while covered workers in the West (19%) are less likely to be enrolled in HDHP/SOs. The share of covered workers enrolled in POS plans decreased from 10% in 2017 to 6% this year.

Figure E: Distribution of Health Plan Enrollment for Covered Workers, by Plan Type and Firm Size, 2013 and 2018

Figure E: Distribution of Health Plan Enrollment for Covered Workers, by Plan Type and Firm Size, 2013 and 2018

Self-Funding. Sixty-one percent of covered workers, including 13% of covered workers in small firms and 81% in large firms, are enrolled in plans that are either partially or completely self-funded. The percentage of covered workers in self-funded plans increases as the number of workers in a firm increases. The percentages of small and large firms with self-funded plans are similar to those last year.

In recent years, insurers have begun offering health plans that provide a nominally self-funded option for small or mid-sized employers that incorporates stoploss insurance with relatively low attachment points. These plans are sometimes referred to as level-funded plans because insurers calculate an expected monthly expense for the employer that includes a share of the estimated annual expense for benefits, the premiums for the stoploss protection, and an administrative fee. Due to the complexity of the funding (and regulatory status) of these plans, and because employers often pay a monthly amount that resembles a premium, they may be confused as to whether or not their health plan is self-funded or insured. To test this, we asked employers with fewer than 200 workers that responded that they had an insured health plan whether they had a level-funded plan. Among small firms that responded that they had an insured plan, 6% reported that they had a level-funded plan.

EMPLOYEE COST SHARING

Most covered workers must pay a share of the cost when they use health care services. Eighty-five percent of covered workers have a general annual deductible for single coverage that must be met before most services are paid for by the plan, an increase from last year [Figure F]. Even workers without a general annual deductible often face other types of cost sharing when they use services, such as copayments or coinsurance for office visits and hospitalizations.

Among covered workers with a general annual deductible, the average deductible amount for single coverage is $1,573, similar to the average deductible last year. The average deductible for covered workers is higher in small firms than large firms ($2,132 vs. $1,355).

Assigning a zero deductible amount to those in plans without a general annual deductible, the average deductible among all covered workers is $1,350, an increase from the amount last year ($1,221). Over the past five years, the average annual deductible among all covered workers has increased 53%. Forty-two percent of covered workers in small firms and 20% of covered workers in large firms are in a plan with a deductible of at least $2,000 for single coverage, similar to the percentages last year.

Deductibles have increased in recent years due to higher deductibles within plan types and higher enrollment in HDHP/SOs. While growing deductibles in PPOs and other plan types generally increase enrollee out-of-pocket liability, the shift in enrollment to HDHP/SOs does not necessarily do so because most HDHP/SO enrollees receive an account contribution from their employers. Eight percent of covered workers in an HDHP with a Health Reimbursement Arrangement (HRA) and 2% of covered workers in a Health Savings Account (HSA)-qualified HDHP receive an account contribution for single coverage at least equal to their deductible, while another 37% of covered workers in an HDHP with an HRA and 26% of covered workers in an HSA-qualified HDHP receive account contributions that, if applied to their deductible, would reduce their deductible to less than $1,000.

Whether they face a general annual deductible or not, a large share of covered workers also pay a portion of the cost when they visit an in-network physician. For primary care, 66% of covered workers have a copayment (a fixed dollar amount) when they visit a doctor and 24% have coinsurance (a percentage of the covered amount). For specialty care, 64% face a copayment and 27% face coinsurance. The average copayments are $25 for primary care and $40 for specialty care. The average coinsurance is 18% for both primary and specialty care. These amounts are similar to those in 2017.

Most workers also face additional cost sharing for a hospital admission or outpatient surgery. After any general annual deductible is met, 68% of covered workers have coinsurance and 11% have a copayment for hospital admissions. The average coinsurance rate for a hospital admission is 19% and the average copayment is $284 per hospital admission. The cost-sharing provisions for outpatient surgery follow a similar pattern to those for hospital admissions.

While almost all (99%) covered workers are in plans with a limit on in-network cost sharing (called an out-of-pocket maximum) for single coverage, there is considerable variation in the actual dollar limits. Fourteen percent of covered workers in plans with an out-of-pocket maximum for single coverage have an out-of-pocket maximum of less than $2,000, while 20% have an out-of-pocket maximum of $6,000 or more.

Figure F: Percentage of Covered Workers With Various Single Coverage General Annual Deductible Levels, 2013 and 2018

Figure F: Percentage of Covered Workers With Various Single Coverage General Annual Deductible Levels, 2013 and 2018

AVAILABILITY OF EMPLOYER-SPONSORED COVERAGE

Fifty-seven percent of firms offer health benefits to at least some of their workers, similar to the percentage last year [Figure G]. The likelihood of offering health benefits differs significantly by firm size; for example, only 47% of firms with 3 to 9 workers offer coverage, while virtually all firms with 1,000 or more workers offer coverage.

While the vast majority of firms are small, most workers work for large firms that offer coverage. In 2018, 90% of workers are employed by a firm that offers health benefits to at least some of its workers.

Even in firms that offer health benefits, some workers are not eligible to enroll (e.g., waiting periods or part-time or temporary work status) and others who are eligible choose not to enroll (e.g., they feel the coverage is too expensive or they are covered through another source). In firms that offer coverage, 79% of workers are eligible for the health benefits offered, and of those eligible, 76% take up the firm’s offer, resulting in 60% of workers in offering firms enrolling in coverage through their employer. All of these percentages are similar to 2017.

Looking across workers both in firms that offer and those that do not offer health benefits, 53% of workers are covered by health plans offered by their employer, similar to the percentage last year.

Coverage for Family Members. Among firms offering health benefits, 97% of small firms and 99% of large firms offer coverage to spouses of eligible workers. Similarly, 95% of small firms and 100% of large firms offering health benefits offer coverage to other dependents of their eligible workers, such as children.

Inducements Not to Enroll. Among all firms that offer health benefits, 13% provide additional compensation or benefits to employees if they enroll in a spouse’s plan, and 16% provide additional compensation or benefits to employees if they do not participate in the firm’s health benefits.

Figure G: Percentage of Firms Offering Health Benefits, by Firm Size, 1999-2018

Figure G: Percentage of Firms Offering Health Benefits, by Firm Size, 1999-2018

HEALTH AND WELLNESS PROGRAMS

Firms continue to show considerable interest in programs that help workers identify health issues and manage chronic conditions, including health risk assessments, biometric screenings, and health promotion programs.

Health Risk Assessments. Among firms offering health benefits, 37% of small firms and 62% of large firms provide workers the opportunity to complete a health risk assessment. A health risk assessment includes questions about a person’s medical history, health status, and lifestyle. Fifty-one percent of large firms with a health risk assessment program offer an incentive to encourage workers to complete the assessment. Incentives may include: gift cards, merchandise or similar rewards; lower premium contributions or cost sharing; and financial rewards, such as cash, contributions to health-related savings accounts, or avoiding a payroll fee.

Biometric Screenings. Among firms offering health benefits, 21% of small firms and 50% of large firms provide workers the opportunity to complete a biometric screening. A biometric screening is an in-person health examination that measures a person’s risk factors, such as body mass index (BMI), cholesterol, blood pressure, stress, and nutrition. We do not consider preventive health services covered by the plan to be biometric screening. Sixty percent of large firms with biometric screening programs offer workers an incentive to complete the screening, similar to the incentives for completing health risk assessments.

Additionally, among large firms with biometric screening programs, 15% reward or penalize workers based on achieving specified biometric outcomes (such as meeting a target BMI). The size of these incentives varies considerably: among large firms offering a reward or penalty for meeting biometric outcomes, the maximum reward is valued at $150 or less in 15% of firms and more than $1,000 in 19% of firms.

Health and Wellness Promotion Programs. A majority of firms offering health benefits offer programs to help workers identify health risks and unhealthy behaviors, and improve their lifestyles. Fifty-three percent of small firms and 82% of large firms offer a program in at least one of these areas: smoking cessation; weight management; and behavioral or lifestyle coaching. Among large firms offering at least one of these programs, 35% offer workers an incentive to participate in or complete the program.

As health screenings and wellness programs have become more complex, incentives have become more sophisticated and may involve participating in or meeting goals in different programs (e.g., completing an assessment and participating in a health promotion activity). To better understand the combined incentives or penalties facing program participants, we asked large firms that had any incentives for health risk assessments, biometric screenings, or the specified health and wellness promotion programs what the maximum incentive was for a worker for all of their programs combined. Among large firms with any type of incentive, 15% have a maximum incentive of 150 or less; 39% have a maximum incentive between $151 and $500; 21% have a maximum incentive between $501 and $1,000; 19% have a maximum incentive between $1,001 and $2,000; and 6% have a maximum incentive of more than $2,000 [Figure H].

Figure H: Among Large Firms That Offer Workers an Incentive to Participate In or Complete Any Health Promotion Programs, Maximum Annual Value of the Incentive for All Programs Combined, 2018

Figure H: Among Large Firms That Offer Workers an Incentive to Participate In or Complete Any Health Promotion Programs, Maximum Annual Value of the Incentive for All Programs Combined, 2018

SITES OF CARE

Telemedicine. Seventy-four percent of large firms offering health benefits cover the provision of health care services through telemedicine in their largest health plan [Figure I]. Telemedicine is the delivery of health care services through telecommunications to a patient from a provider who is at a remote location, including video chat and remote monitoring. Firms with 1,000 or more workers are more likely to cover services provided through telemedicine than smaller firms.

Retail Health Clinics. Seventy-six percent of large firms offering health benefits cover health care services received in retail clinics, such as those located in pharmacies, supermarkets and retail stores, in their largest health plan [Figure I]. These clinics are often staffed by nurse practitioners or physician assistants and treat minor illnesses and provide preventive services.

On-Site Health Clinics Only 10% of large firms offering health benefits have an on-site health clinic for their employees at one or more of their major locations. A large share of these firms report that employees can receive treatment for non-work-related illnesses at their on-site clinics.

PROVIDER NETWORKS

High Performance or Tiered Networks. Seventeen percent of large firms that offer health benefits include a high-performance or tiered provider network in their health plan with the largest enrollment, a similar percentage to last year [Figure I]. These arrangements identify providers that are more efficient and generally provide financial or other incentives for enrollees to use the selected providers. Firms with 1,000 or more workers are more likely than smaller firms to incorporate a high-performance or tiered network into their largest plan.

Narrow Networks. Five percent of large firms offering health benefits offer a plan they consider to be a narrow network plan, similar to the percentages for the past two years [Figure I]. Narrow network plans limit the number of providers who can participate in order to reduce costs, and are generally more restrictive than standard HMO networks. Firms with 5,000 or more workers offering health benefits are more likely than firms of other sizes to offer at least one plan with a narrow network.

Eliminated Hospitals or Health Systems. Only 3% of large firms report that they or their health plan eliminated a hospital or health system in the past year in order to reduce the costs of their plan, similar to the percentage reported last year [Figure I]. Firms with 5,000 or more workers offering health benefits are more likely to say that either they or their insurer eliminated a hospital or health system from a provider network to reduce costs than firms of other sizes.

Figure I: Among Firms Offering Health Benefits, Percentage of Firms Whose Plan Has Various Features, by Firm Size, 2018

Figure I: Among Firms Offering Health Benefits, Percentage of Firms Whose Plan Has Various Features, by Firm Size, 2018

REPEAL OF TAX PENALTY FOR INDIVIDUALS WITHOUT HEALTH INSURANCE

The 2017 tax law eliminated the tax penalty for people who do not have health insurance (sometimes called the ‘individual mandate’) beginning in 2019. Nine percent of small firms and 24% of large firms report that they expect fewer employees and dependents to participate in their health plans as result of the change. Additionally, 5% of small firms and 10% of large firms said that they expect to change the benefit options for at least some employees as a result of the change.

CONCLUSION

This year continues a period of stability and relatively low cost growth for employer-provided coverage. While premium growth continues to exceed increases in earnings and inflation, the differences are small compared to recent periods which, along with low underlying health spending growth, may help explain the apparent reluctance of employers and plans to make many changes in the market [Figure C].

The one area where we have seen change is higher deductibles – the average deductible for single coverage among all workers increased 53% since 2013, driven in part by a 50% increase in HDHP/SO enrollment over that period. Higher deductibles have helped to keep premium increases relatively low, but it is unclear how long that trend will continue. Given the importance of health benefits to workers and prospective workers, employers may find it increasingly difficult to impose higher cost sharing in what is essentially a full employment economy. The growth in HDHP/SO enrollment has stalled over the past three years, which may be a sign of employer reluctance to rock the benefit boat for their workers. If underlying health care prices and service use begin to grow as part of stronger economic growth, employer and health plans may need to look for tools other than higher cost sharing to address the pressures that would lead to higher premium growth.

METHODOLOGY

The Kaiser Family Foundation 2018 Employer Health Benefits Survey reports findings from a telephone survey of 2,160 randomly selected non-federal public and private employers with three or more workers. Researchers at NORC at the University of Chicago and the Kaiser Family Foundation designed and analyzed the survey. National Research, LLC conducted the fieldwork between January and July 2018. In 2018, the overall response rate is 32%, which includes firms that offer and do not offer health benefits. Among firms that offer health benefits, the survey’s response rate is also 32%. To improve estimates for small firms, the 2018 survey had a significantly larger sample than in previous years; the increased sample size led to both more firms completing the survey and a lower response rate than in years past. Unless otherwise noted, differences referred to in the text and figures use the 0.05 confidence level as the threshold for significance. Values below 3% are not shown on graphical figures to improve the readability of those graphs.

For more information on the survey methodology, please visit the Survey Design and Methods section at http://ehbs.kff.org/.


Filling the need for trusted information on national health issues, the Kaiser Family Foundation is a nonprofit organization based in San Francisco, California.


  1. Kaiser Commission on Medicaid and the Uninsured. The uninsured: A primer – Key facts about health insurance and the uninsured in the era of health reform: Supplemental Tables. Washington (DC): The Commission; 2017 Dec (cited 2018 Jul 23). https://files.kff.org/attachment/Supplemental-Tables-The-Uninsured-A-Primer-Key-Facts-about-Health-Insurance-and-the-Uninsured-Under-the-Affordable-Care-Act. See Table 1: 271.1 million nonelderly people, 56.2% of whom are covered by employer-sponsored insurance.
  2. Inflation values are not seasonally adjusted. Bureau of Labor Statistics. Consumer Price Index – All Urban Consumers (April to April): Department of Labor; 2018 (cited 2018 Jul 20). https://beta.bls.gov/dataViewer/view/timeseries/CUUR0000SA0. Wage data are from the Bureau of Labor Statistics and based on the change in total average hourly earnings of production and nonsupervisory employees. Employment, hours, and earnings from the Current Employment Statistics survey: Department of Labor; 2018 (cited 2018 July 20). https://beta.bls.gov/dataViewer/view/timeseries/CES0500000008
  3. This threshold is based on the twenty-fifth percentile of workers’ earnings, using data for 2017 (April to April). Bureau of Labor Statistics. May 2017 National Occupational Employment and Wage Estimates: United States. Washington (DC): BLS; (last modified 2018 Apr 27; cited 2018 Jul 23). Available from: http://www.bls.gov/oes/current/oes_nat.htm

Survey Design And Methods

The Kaiser Family Foundation (KFF) has conducted this annual survey of employer-sponsored health benefits since 1999. KFF works with NORC at the University of Chicago (NORC) and National Research, LLC (NR) to field and analyze the survey. From January to July 2018, NR completed telephone interviews with human resource and benefits managers at 2,160 firms.

SURVEY TOPICS

The survey includes questions on the cost of health insurance, health benefit offer rates, coverage, eligibility, plan type enrollment, premium contributions, employee cost sharing, prescription drug benefits, retiree health benefits, and wellness benefits.

Firms that offer health benefits are asked about the plan attributes of their largest health maintenance organization (HMO), preferred provider organization (PPO), point-of-service (POS) plan, and high-deductible health plan with a savings option (HDHP/SO).4 We treat exclusive provider organizations (EPOs) and HMOs as one plan type and report the information under the banner of “HMO”. Since 2013, plan information for conventional (or indemnity) plans was collected within the PPO battery. Less than one percent of firms that completed the PPO section had more enrollment in a conventional plan than in a PPO plan. Firms with 50 or more workers were asked: “Does your firm offer health benefits for current employees through a private or corporate exchange?” Employers were still asked for plan information about their HMO, PPO, POS and HDHP/SO plan regardless of whether they purchased health benefits through a private exchange or not.

Firms are asked about the attributes of their current plans during the interview. While the survey’s fielding period begins in January, many respondents may have a plan whose 2018 plan year lags behind the calendar year [Figure M.1]. In some cases, plans may report the attributes of their 2017 plans and some plan attributes (such as HSA deductible limits) may not meet the calendar year regulatory requirements.

Figure M.1: Among Firms Offering Health Benefits, Month In Which Plan Year Begins, 2018

Figure M.1: Among Firms Offering Health Benefits, Month In Which Plan Year Begins, 2018

SAMPLE DESIGN

The universe is defined by the U.S. Census’ 2014 Statistics of U.S. Businesses (SUSB) for private firms and the 2012 Census of Governments (COG) for non-federal public employers. At the time of the sample design (December 2017), these data represented the most current information on the number of public and private firms nationwide with three or more workers. As in the past, the post-stratification is based on the most up-to-date Census data available (the 2015 SUSB). We determine the sample size based on the number of firms needed to ensure a target number of completes in six size categories.

We attempted to repeat interviews with prior years’ survey respondents (with at least ten employees) who participated in either the 2016 or the 2017 survey, or both. Firms with 3-9 employees are not included in the panel to minimize the impact of panel effects. As a result, 1,529 of the 2,160 firms that completed the full survey also participated in either the 2016 or 2017 surveys, or both. In total, 150 firms participated in 2016, 416 firms participated in 2017, and 963 firms participated in both 2016 and 2017. In addition non-panel firms are randomly selected to participate in the survey.

Since 2010, the sample has been drawn from a Research Now SSI list (based on an original Dun and Bradstreet list) of the nation’s private employers and the COG for public employers. To increase precision, we stratified the sample by ten industry categories and six size categories. The federal government and business with fewer than three employees are not included in the sample frame. Education is a separate sampling category for the purposes of sampling, rather than a subgroup of the Service category. Education is controlled for during post-stratification, and adjusting the sampling frame to also control for Education allows for a more accurate representation of both the Education and Service industries. For information on changes to the sampling methods over time, please consult the Survey Design and Methods Sections of prior Employer Health Benefits Surveys (https://www.kff.org/health-costs/report/employer-health-benefits-annual-survey-archives/).

RESPONSE RATE

Response rates are calculated using a CASRO method, which accounts for firms that are determined to be ineligible in its calculation. The overall response rate is 32% [Figure M.2].5 The response rate for panel firms is higher than the response rate for non-panel firms [Figure M.2]. Similar to other employer and household surveys, the Employer Health Benefits Survey has seen a general decrease in response rates over time. Since 2017, we have attempted to increase the number of completes by increasing the number of non-panel firms in the sample. While this generally increases the precision of estimates by ensuring a sufficient number of respondents in various sub-groups, it has the effect of reducing the overall response rate.

To increase response rates, some firms with 3-9 employees were offered an incentive for participating in the survey. A third of these firms were sent a $5 Starbucks gift card in the advance letter, a third were offered both a $5 Starbucks gift card in the advance letter and an incentive of $25 in cash or as a donation to a charity of their choice after completing the full survey, and a third of firms were offered no incentive at all. Our analysis does not show significant differences in responses to key variables or participation rates among these incentive groups.

The vast majority of questions are asked only of firms that offer health benefits. A total of 1,872 of the 2,160 responding firms indicated they offered health benefits. The response rate for firms that offer health benefits is also 32%.

We asked one question of all firms in the study with which we made phone contact but where the firm declined to participate. The question was A6: “Does your company offer a health insurance program as a benefit to any of your employees?”. A total of 4,070 firms responded to this question (including 2,160 who responded to the full survey and 1,910 who responded to this one question). These responses are included in our estimates of the percentage of firms offering health benefits.6 The response rate for this question is 60% [Figure M.2].

Figure M.2: Response Rates for Various Subsets of the Sample, 2018

Figure M.2: Response Rates for Various Subsets of the Sample, 2018

FIRM SIZE CATEGORIES AND KEY DEFINITIONS

Throughout the report, figures categorize data by size of firm, region, and industry. Unless otherwise specified, firm size definitions are as follows: small firms: 3 to 199 workers; and large firms: 200 or more workers. Figure M.3 shows selected characteristics of the survey sample. A firm’s primary industry classification is determined from Research Now SSI’s designation on the sampling frame and is based on the U.S. Census Bureau’s North American Industry Classification System (NAICS). A firm’s ownership category and other firm characteristics used in figures such as 3.5 and 6.18 are based on respondents’ answers. While there is considerable overlap in firms in the “State/Local Government” industry category and those in the “public” ownership category, they are not identical. For example, public school districts are included in the service industry even though they are publicly owned.

Figure M.3: Selected Characteristics of Firms In the Survey Sample, 2018

Figure M.3: Selected Characteristics of Firms In the Survey Sample, 2018

Figure M.4 presents the breakdown of states into regions and is based on the U.S Census Bureau’s categorizations. State-level data are not reported both because the sample size is insufficient in many states and we only collect information on a firm’s primary location rather than where all workers may actually be employed. Some mid- and large-size employers have employees in more than one state, so the location of the headquarters may not match the location of the plan for which we collected premium information.

Figure M.4: States by Region, 2018

Figure M.4: States by Region, 2018

Figure M.5 displays the distribution of the nation’s firms, workers, and covered workers (employees receiving coverage from their employer). Among the three million firms nationally, approximately 60.1% employ 3 to 9 workers; such firms employ 7.6% of workers, and 3.4% of workers covered by health insurance. In contrast, less than one percent of firms employ 5,000 or more workers; these firms employ 35.8% of workers and 39.5% of covered workers. Therefore, the smallest firms dominate any statistics weighted by the number of employers. For this reason, most statistics about firms are broken out by size categories. In contrast, firms with 1,000 or more workers are the most influential employer group in calculating statistics regarding covered workers, since they employ the largest percentage of the nation’s workforce. Statistics among small firms and those weighted by the number of firms tend to have more variability.

Figure M.5: Distribution of Employers, Workers, and Workers Covered by Health Benefits, by Firm Size, 2018

Figure M.5: Distribution of Employers, Workers, and Workers Covered by Health Benefits, by Firm Size, 2018

Throughout this report, we use the term “in-network” to refer to services received from a preferred provider. Family coverage is defined as health coverage for a family of four. Definitions of the health plan types are available in Section 4, and a detailed explanation of the HDHP/SO plan type is in Section 8.

The survey asks firms what percentage of their employees earn more or less than a specified amount in order to identify the portion of a firm’s workforce that has relatively lower or higher wages. This year, the income threshold is $25,000 per year for lower-wage workers and $62,000 for higher-wage workers. These thresholds are based on the 25th and 75th percentile of workers’ earnings as reported by the Bureau of Labor Statistics using data from the Occupational Employment Statistics (OES) (2017).7 The cutoffs were inflation-adjusted and rounded to the nearest thousand. Prior to 2013, wage cutoffs were calculated using the now-eliminated National Compensation Survey.

ROUNDING AND IMPUTATION

Some figures in the report do not sum to totals due to rounding. In a few cases, numbers from distribution figures may not add to the numbers referenced in the text due to rounding. Although overall totals and totals for size and industry are statistically valid, some breakdowns may not be available due to limited sample sizes or a high relative standard error. Where the unweighted sample size is fewer than 30 observations, figures include the notation “NSD” (Not Sufficient Data). Estimates with high relative standard errors are reviewed and in some cases not published. Many breakouts by subsets may have a large standard error, meaning that even large differences are not statistically different.

To control for item nonresponse bias, we impute values that are missing for most variables in the survey. On average, 5% of observations are imputed. All variables are imputed following a hotdeck approach. The hotdeck approach replaces missing information with observed values from a firm similar in size and industry to the firm for which data are missing. In 2018, there were eleven variables where the imputation rate exceeded 20%; most of these cases were for individual plan level statistics. When aggregate variables were constructed for all of the plans, the imputation rate was usually much lower. There are a few variables that we have decided not to impute; these are typically variables where “don’t know” is considered a valid response option. Some variables are imputed based on their relationship to each other. For example, if a firm provided a worker contribution for family coverage but no premium information, a ratio between the family premium and family contribution was imputed and then the family premium was calculated. In addition, there are several variables in which missing data are calculated based on respondents’ answers to other questions (for example, employer contributions to premiums are calculated from the respondent’s premium and the worker contribution to premiums).

Since 2014, we estimate separate single and family coverage premiums for firms that provide premium amounts as the average cost for all covered workers, instead of differentiating between single and family coverage. This method more accurately accounts for the portion that each type of coverage contributes to the total cost for the less than one percent of covered workers who are enrolled at firms affected by this adjustment.

To ensure data accuracy we have several processes to review outliers and illogical responses. Every year several hundred firms are called back to confirm or correct responses. In some cases, answers are edited based on responses to open-ended questions or based on established logic rules.

WEIGHTING

Because we select firms randomly, it is possible through the use of statistical weights to extrapolate the results to national (as well as firm size, regional, and industry) averages. These weights allow us to present findings based on the number of workers covered by health plans, the number of total workers, and the number of firms. In general, findings in dollar amounts (such as premiums, worker contributions, and cost sharing) are weighted by covered workers. Other estimates, such as the offer rate, are weighted by firms. Specific weights were created to analyze the HDHP/SO plans that are offered with a Health Reimbursement Arrangement (HRA) or that are Health Savings Account (HSA)-qualified. These weights represent the proportion of employees enrolled in each of these arrangements.

Calculation of the weights follows a common approach. The employer weight was determined by calculating the firm’s probability of selection. This weight was adjusted for nonresponse bias and trimmed of overly influential weights. Finally, we calibrated the weights to U.S. Census Bureau’s 2015 Statistics of U.S. Businesses for firms in the private sector, and the 2012 Census of Governments as the basis for calibration / post-stratification for public sector firms. Historic employer-weighted statistics were updated in 2011. The worker weight was calculated by multiplying the employer weight by the number of workers at the firm and then following the same weight adjustment process described above. The covered-worker weight and the plan-specific weights were calculated by multiplying the percentage of workers enrolled in each of the plan types by the firm’s worker weight. These weights allow analyses of all workers covered by health benefits and of workers in a particular type of health plan.

The trimming procedure follows the following steps: First, we grouped firms into size and offer categories of observations. Within each strata, we identified the median and the interquartile range of the weights and calculated the trimming cut point as the median plus six times the interquartile range (M + [6 * IQR]). Weight values larger than this cut point are trimmed to the cut point. In all instances, very few weight values were trimmed.

As in past years, we conducted a small follow-up survey of those firms with 3-49 workers that refused to participate in the full survey. Based on the results of a McNemar test, we were not able to verify that the results of the follow-up survey were comparable to the results from the original survey, and weights were not adjusted using the nonresponse adjustment process described in previous years’ methods. In 2010, 2015, and 2017, the results of the McNemar test were also significant and we did not conduct a nonresponse adjustment.

The survey collects information on primary and specialty care physician office visits for each plan type. Different plan types at the same firm may have different cost-sharing structures (e.g., copayments or coinsurance). Because the composite variables (using data from across all plan types) are reflective of only those plans with that provision, separate weights for the relevant variables were created in order to account for the fact that not all covered workers have such provisions.

To account for design effects, the statistical computing package R and the library package “survey” were used to calculate standard errors.

STATISTICAL SIGNIFICANCE

All statistical tests are performed at the .05 confidence level. For figures with multiple years, statistical tests are conducted for each year against the previous year shown, unless otherwise noted. No statistical tests are conducted for years prior to 1999.

Statistical tests for a given subgroup (firms with 25-49 workers, for instance) are tested against all other firm sizes not included in that subgroup (all firm sizes NOT including firms with 25-49 workers, in this example). Tests are done similarly for region and industry; for example, Northeast is compared to all firms NOT in the Northeast (an aggregate of firms in the Midwest, South, and West). However, statistical tests for estimates compared across plan types (for example, average premiums in PPOs) are tested against the “All Plans” estimate. In some cases, we also test plan-specific estimates against similar estimates for other plan types (for example, single and family premiums for HDHP/SOs against single and family premiums for HMO, PPO, and POS plans); these are noted specifically in the text. The two types of statistical tests performed are the t-test and the Wald test. The small number of observations for some variables resulted in large variability around the point estimates. These observations sometimes carry large weights, primarily for small firms. The reader should be cautioned that these influential weights may result in large movements in point estimates from year to year; however, these movements are often not statistically significant. Standard Errors for most key statistics are available in a technical supplement available at http://www.kff.org/ehbs.

2018 SURVEY

In light of a number of regulatory changes and policy proposals, we included new questions on the anticipated effects of the ACA’s individual mandate penalty repeal on the firm’s health benefits offerings, and the impact of the delay of the high cost plan tax, also known as the Cadillac tax, on the firm’s health benefits decisions. Also new in 2018 are questions asking about smaller firms’ use of level-funded premium plans, an alternative self-funding method with integrated stop loss coverage and a fixed monthly premium.

The 2018 survey also expands on retiree health benefits questions, asking firms about cost reduction strategies, whether they contribute to the cost of coverage, and how retiree benefits are offered (e.g., through a Medicare Advantage contract, a traditional employer plan, private exchange, etc.).

In 2018, we moved the battery of worker demographics questions from near the beginning of the survey to the end of the survey in an effort to improve the flow. There is no evidence that this move has impacted our survey findings and we will continue to monitor any suspected impacts.

Starting in 2018, we allowed respondents who did not know the combined maximum incentive or penalty an employee could receive for health screening and/or wellness and health promotion to answer a categorical question with specified ranges. This method is consistent with how we handle the percent of low-wage and high-wage workers at a firm. In 2018, 18% of respondents did not know the dollar value of the their incentive or penalty and 39% were able to estimate a range.

Starting in 2018, the survey began asking small firms who indicated that their plan was fully-insured whether the plan was level-funded. In a level-funded plan, employers make a set payment each month to an insurer or third party administrator which funds a reserve account for claims, administrative costs, and premiums for stop-loss coverage. These plans are often integrated and firms may not understand the complexities of the self-funded mechanisms underlying them. Some small employers who indicate that their plan is self-funded may also offer a plan that meets this definition. Respondents offering level funded plans were asked about any attachment points applying to enrollees. These firms were not less likely to answer this question, and including them doesn’t not substantially change the average. Prior to 2018, all firms reporting coverage as underwritten by an insurer were excluded from the stop-loss calculations.

For prescription drug coverage, similar to years past, if the firm reports that the worker pays the full cost for drugs on a particular tier and/or that the plan only offers access to a discount program, we do not consider this as offering covering for that drug tier. Hospital, outpatient surgery and prescription drug cost-sharing was only asked of a firm’s largest plan type.

The response option choices for the type of incentive or penalty for completing biometric screening or a health risk assessment changed from 2017 to 2018.

Values below 3% are not shown on graphical figures to improve the readability of those graphs. The underlying data for all estimates presented in graphs are available at http://www.kff.org/ehbs.

Annual inflation estimates are usually calculated from April to April. The 12 month percentage change for May to May was 2.5%.8

HISTORICAL DATA

Data in this report focus primarily on findings from surveys conducted and authored by the Kaiser Family Foundation since 1999. Between 1999 and 2017, the Health Research & Educational Trust (HRET) co-authored this survey. HRET’s divestiture had no impact on our survey methods, which remain the same as years past. Prior to 1999, the survey was conducted by the Health Insurance Association of America (HIAA) and KPMG using a similar survey instrument, but data are not available for all the intervening years. Following the survey’s introduction in 1987, the HIAA conducted the survey through 1990, but some data are not available for analysis. KPMG conducted the survey from 1991-1998. However, in 1991, 1992, 1994, and 1997, only larger firms were sampled. In 1993, 1995, 1996, and 1998, KPMG interviewed both large and small firms. In 1998, KPMG divested itself of its Compensation and Benefits Practice, and part of that divestiture included donating the annual survey of health benefits to HRET.

This report uses historical data from the 1993, 1996, and 1998 KPMG Surveys of Employer-Sponsored Health Benefits and the 1999-2017 Kaiser/HRET Survey of Employer-Sponsored Health Benefits. For a longer-term perspective, we also use the 1988 survey of the nation’s employers conducted by the HIAA, on which the KPMG and KFF surveys are based. The survey designs for the three surveys are similar.

Additional information on the 2018 Employer Health Benefit Survey is available at http://www.kff.org/ehbs, including an article in the Journal Health Affairs, an interactive graphic, historic reports and a technical supplement. Researchers may also request a public use dataset here: https://www.kff.org/contact-us/

Published: October 3rd, 2018. Last Updated: September 27, 2018.


  1. HDHP/SO includes high-deductible health plans with a deductible of at least $1,000 for single coverage and $2,000 for family coverage and that offer either a Health Reimbursement Arrangement (HRA) or a Health Savings Account (HSA). Although HRAs can be offered along with a health plan that is not an HDHP, the survey collected information only on HRAs that are offered along with HDHPs. For specific definitions of HDHPs, HRAs, and HSAs, see the introduction to Section 8.
  2. Response rate estimates are calculated by dividing the number of completes over the number of refusals and the fraction of the firms with unknown eligibility to participate estimated to be eligible. Firms determined to be ineligible to complete the survey are not included in the response rate calculation.
  3. Estimates presented in Figures 2.1, 2.2, 2.3, 2.4, 2.5, and 2.6 are based on the sample of both firms that completed the entire survey and those that answered just one question about whether they offer health benefits.
  4. General information on the OES can be found at http://www.bls.gov/oes/oes_emp.htm#scope. A comparison between the OES and the NCS is available at https://www.bls.gov/opub/mlr/2013/article/lettau-zamora.htm
  5. Bureau of Labor Statistics, Consumer Price Index, U.S. City Average of Annual Inflation, 1998-2018; (cited 2018 July 20). https://beta.bls.gov/dataViewer/view/timeseries/CUUR0000SA0.

Section One: Cost Of Health Insurance

The average annual premiums in 2018 are $6,896 for single coverage and $19,616 for family coverage. The average premium for single coverage increased by 3% since 2017 and the average premium for family coverage increased by 5%. The average family premium has increased 55% since 2008 and 20% since 2013. The average family premium for covered workers in small firms (3-199 workers) ($18,739) is significantly lower than average family premiums for workers in large firms (200 or more workers) ($19,972).

This graphing tool allows users to look at changes in premiums and worker contributions for covered workers at different types of firms over time: https://www.kff.org/interactive/premiums-and-worker-contributions/

PREMIUMS FOR SINGLE AND FAMILY COVERAGE

  • The average premium for single coverage in 2018 is $6,896 per year. The average premium for family coverage is $19,616 per year [Figure 1.1].
  • The average annual premium for family coverage for covered workers in small firms ($18,739) is lower than the average premium for covered workers in large firms ($19,972) [Figure 1.2].
  • The average annual premiums for covered workers in HDHP/SOs are lower for single coverage ($6,459) and family coverage ($18,602) than overall average premiums. The average premiums for covered workers enrolled in PPOs are higher for single ($7,149) and family coverage ($20,324) than the overall plan average [Figure 1.1].
  • The average premium for covered workers with single coverage is higher in the Northeast ($7,172) than in all other regions. Compared to the average premium for family coverage for covered workers in other regions, the average family premium for covered workers in the Northeast ($20,697) is higher and the average family premium for covered workers in the South is lower ($19,057) [Figure 1.3].
  • The average premiums for covered workers vary across industries. The average premiums for covered workers in the Agriculture/Mining/Construction industry category are relatively lower for single ($6,241) and family ($17,417) coverage [Figure 1.4].
  • The average premiums for covered workers in firms with a relatively large share of older workers (where at least 35% of the workers are age 50 or older) are higher than the average premiums for covered workers in firms with a smaller share of older workers ($7,288 vs. $6,560 for single coverage and $20,463 vs. $18,887 for family coverage) [Figure 1.6].
  • The average premiums for covered workers in firms with at least some union workers are higher than the average premiums for covered workers in firms without union workers for family coverage ($20,333 vs. $19,234) [Figure 1.5].
  • Premiums also vary by type of firm ownership. For both single and family coverage, covered workers at private for-profit firms have lower average annual premiums than covered workers at public firms or private not-for-profit firms [Figure 1.6].
Figure 1.1: Average Annual Premiums for Covered Workers, Single and Family Coverage, by Plan Type, 2018

Figure 1.1: Average Annual Premiums for Covered Workers, Single and Family Coverage, by Plan Type, 2018

Figure 1.2: Average Monthly and Annual Premiums for Covered Workers, by Plan Type and Firm Size, 2018

Figure 1.2: Average Monthly and Annual Premiums for Covered Workers, by Plan Type and Firm Size, 2018

Figure 1.3: Average Monthly and Annual Premiums for Covered Workers, by Plan Type and Region, 2018

Figure 1.3: Average Monthly and Annual Premiums for Covered Workers, by Plan Type and Region, 2018

Figure 1.4: Average Monthly and Annual Premiums for Covered Workers, by Plan Type and Industry, 2018

Figure 1.4: Average Monthly and Annual Premiums for Covered Workers, by Plan Type and Industry, 2018

Figure 1.5: Average Annual Premiums for Covered Workers With Family Coverage, by Firm Characteristics, 2018

Figure 1.5: Average Annual Premiums for Covered Workers With Family Coverage, by Firm Characteristics, 2018

Figure 1.6: Average Annual Premiums for Covered Workers, by Firm Characteristics and Firm Size, 2018

Figure 1.6: Average Annual Premiums for Covered Workers, by Firm Characteristics and Firm Size, 2018

PREMIUM DISTRIBUTION

  • There is considerable variation in premiums for both single and family coverage.
  • Sixteen percent of covered workers are employed in a firm with a single premium at least 20% higher than the average single premium, while 17% of covered workers are in firms with a single premium less than 80% of the average single premium [Figure 1.7].
  • For family coverage, 17% of covered workers are employed in a firm with a family premium at least 20% higher than the average family premium, while 19% of covered workers are in firms with a family premium less than 80% of the average family premium [Figure 1.7].
  • Five percent of covered workers are in a firm with an average annual premium of at least $10,000 for single coverage [Figure 1.8]. Eight percent of covered workers are in a firm with an average annual premium of at least $26,000 for family coverage [Figure 1.9].
Figure 1.7: Distribution of Annual Premiums for Single and Family Coverage Relative to the Average Annual Single or Family Premium, 2018

Figure 1.7: Distribution of Annual Premiums for Single and Family Coverage Relative to the Average Annual Single or Family Premium, 2018

Figure 1.8: Distribution of Annual Premiums for Covered Workers With Single Coverage, 2018

Figure 1.8: Distribution of Annual Premiums for Covered Workers With Single Coverage, 2018

Figure 1.9: Distribution of Annual Premiums for Covered Workers With Family Coverage, 2018

Figure 1.9: Distribution of Annual Premiums for Covered Workers With Family Coverage, 2018

PREMIUM CHANGES OVER TIME

  • The average premium for single coverage is 3% higher than the single premium last year, and the average premium for family coverage is 5% higher than the average family premium last year.
  • The average premium for single coverage has grown 17% since 2013 and the average premium for family coverage has grown 20% over the same period.
  • The average family premiums for both small and large firms have increased at similar rates since 2013 (20% for small firms and 19% for large firms). For small firms, the average family premium rose from $15,581 in 2013 to $18,739 in 2018. For large firms, the average family premium rose from $16,715 in 2013 to $19,972 in 2018 [Figures 1.11 and 1.12].
  • The $19,616 average family premium in 2018 is 20% higher than the average family premium in 2013 and 55% higher than the average family premium in 2008. The 20% family premium growth in the past five years is smaller than the 29% growth between 2008 and 2013, or the 40% premium growth between 2003 and 2008 [Figure 1.13].
  • The average family premiums for both small and large firms have increased at similar rates since 2008 (55% for small firms and 54% for large firms). For small firms, the average family premium rose from $12,091 in 2008 to $18,739 in 2018. For large firms, the average family premium rose from $12,973 in 2008 to $19,972 in 2018 [Figures 1.11 and 1.12].
  • For covered workers in large firms, over the past five years, the average family premium in firms that are fully insured has grown at a similar rate to the average family premium for covered workers in fully or partially self-funded firms (19% for fully insured plans and 20% for self-funded firms) [Figure 1.14].
Figure 1.10: Average Annual Premiums for Single and Family Coverage, 1999-2018

Figure 1.10: Average Annual Premiums for Single and Family Coverage, 1999-2018

Figure 1.11: Average Annual Premiums for Covered Workers With Family Coverage, by Firm Size, 1999-2018

Figure 1.11: Average Annual Premiums for Covered Workers With Family Coverage, by Firm Size, 1999-2018

Figure 1.12: Average Annual Premiums for Covered Workers With Family Coverage, by Firm Size, 1999-2018

Figure 1.12: Average Annual Premiums for Covered Workers With Family Coverage, by Firm Size, 1999-2018

Figure 1.13: Cumulative Premium Increases, Inflation, and Earnings for Covered Workers With Family Coverage, 2003-2018

Figure 1.13: Cumulative Premium Increases, Inflation, and Earnings for Covered Workers With Family Coverage, 2003-2018

Figure 1.14: Among Workers In Large Firms, Average Annual Premiums for Family Coverage, by Funding Arrangement, 1999-2018

Figure 1.14: Among Workers In Large Firms, Average Annual Premiums for Family Coverage, by Funding Arrangement, 1999-2018

Section Two: Health Benefits Offer Rates

While nearly all large firms (200 or more workers) offer health benefits to at least some workers, small firms (3-199 workers) are significantly less likely to do so. The percentage of all firms offering health benefits in 2018 (57%) is similar to the percentages of firms offering health benefits last year (53%) and five years ago (57%), but lower than the percentage of firms offering health benefits ten years ago (63%). As we reported last year, there has been a long-term decline in the offer and coverage rates for employer-provided coverage, particularly among smaller firms.9

Almost all firms that offer coverage offer to dependents such as children and the spouses of eligible employees. Firms not offering health benefits continue to cite cost as the most important reason they do not do so.

FIRM OFFER RATES

  • In 2018, 57% of firms offer health benefits, similar to the 53% who reported doing so in 2017 [Figure 2.1]. Because surveys only collect information from a sample of the total number of firms in the country, there is uncertainty in any estimate. Since there are so many small firms, sometimes even seemingly large differences are not statistically different.10
  • The overall percentage of firms offering coverage in 2018 is the same as the percentage offering coverage in 2013 (57%) but lower than the percentage in 2008 (63%) [Figure 2.1].
  • Ninety-eight percent of large firms offer health benefits to at least some of their workers. In contrast, only 56% of small firms offer health benefits [Figures 2.2 and 2.3]. The percentages of both small and large firms offering health benefits to at least some of their workers are similar to last year [Figure 2.2].
  • The smallest-sized firms are least likely to offer health insurance: 47% of firms with 3-9 workers offer coverage, compared to 71% of firms with 25-49 workers, and 91% of firms with 50-199 workers [Figure 2.3]. Since most firms in the country are small, variation in the overall offer rate is driven largely by changes in the percentages of the smallest firms (3-9 workers) offering health benefits. For more information on the distribution of firms in the country, see the Survey Design and Methods Section and Figure M.4.
  • Ninety-six percent of firms with 100 or more workers offer health benefits to at least some of their workers. Eighty-nine percent of firms with 50-99 workers offer benefits to at least some workers [Figure 2.4].
  • Ninety percent of all workers are employed by a firm that offers health benefits to at least some of its workers [Figure 2.6].
Figure 2.1: Percentage of Firms Offering Health Benefits, 1999-2018

Figure 2.1: Percentage of Firms Offering Health Benefits, 1999-2018

Figure 2.2: Percentage of Firms Offering Health Benefits, by Firm Size, 1999-2018

Figure 2.2: Percentage of Firms Offering Health Benefits, by Firm Size, 1999-2018

Figure 2.3: Percentage of Firms Offering Health Benefits, by Firm Size, Region, and Industry, 2018

Figure 2.3: Percentage of Firms Offering Health Benefits, by Firm Size, Region, and Industry, 2018

Figure 2.4: Percentage of Firms Offering Health Benefits to at Least Some of Their Workers, by Firm Size, 2018

Figure 2.4: Percentage of Firms Offering Health Benefits to at Least Some of Their Workers, by Firm Size, 2018

Figure 2.5: Percentage of Firms Offering Health Benefits, by Firm Size, 1999-2018

Figure 2.5: Percentage of Firms Offering Health Benefits, by Firm Size, 1999-2018

Figure 2.6: Percentage of Workers at Firms That Offer Health Benefits to at Least Some Workers, by Firm Size, 1999-2018

Figure 2.6: Percentage of Workers at Firms That Offer Health Benefits to at Least Some Workers, by Firm Size, 1999-2018

PART-TIME AND TEMPORARY WORKERS

  • Among firms offering health benefits, relatively few offer benefits to their part-time and temporary workers.

    Beginning in 2015, we modified the survey to explicitly ask employers whether they offered benefits to employees working fewer than 30 hours. Our previous question did not include a definition of “part-time”. For this reason, historical data on part-time offer rates are shown, but we did not test whether the differences between 2014 and 2015 were significant. Many employers may work with multiple definitions of part-time; one for their compliance with legal requirements and another for internal policies and programs.

  • The Affordable Care Act (ACA) defines full-time workers as those who on average work at least 30 hours per week, and part-time workers as those who on average work fewer than 30 hours per week. The employer shared responsibility provision of the ACA requires that firms with at least 50 full-time equivalent employees offer most full-time employees coverage that meets minimum standards or be assessed a penalty.11
  • In 2018, 22% of all firms that offer health benefits offer them to part-time workers. Small firms and large firms have similar rates of offering to part-time workers [Figure 2.7].
  • A small percentage (6%) of firms offering health benefits offer them to temporary workers [Figure 2.8].
  • Among firms offering health benefits, large firms are more likely than small firms to offer benefits to temporary workers (14% vs. 6%) [Figure 2.8].
  • The percentage of large firms offering health benefits to temporary workers is not statistically different from the 13% reported in 2017, but is an increase from ten years ago (5%) [Figure 2.10].
Figure 2.7: Among Firms Offering Health Benefits, Percentage That Offer to Part-Time Workers, by Firm Size, 2018

Figure 2.7: Among Firms Offering Health Benefits, Percentage That Offer to Part-Time Workers, by Firm Size, 2018

Figure 2.8: Among Firms Offering Health Benefits, Percentage That Offer to Temporary Workers, by Firm Size, 2018

Figure 2.8: Among Firms Offering Health Benefits, Percentage That Offer to Temporary Workers, by Firm Size, 2018

Figure 2.9: Among Firms Offering Health Benefits, Percentage That Offer to Part-Time Workers, by Firm Size, 1999-2018

Figure 2.9: Among Firms Offering Health Benefits, Percentage That Offer to Part-Time Workers, by Firm Size, 1999-2018

Figure 2.10: Among Firms Offering Health Benefits, Percentage That Offer to Temporary Workers, by Firm Size, 1999-2018

Figure 2.10: Among Firms Offering Health Benefits, Percentage That Offer to Temporary Workers, by Firm Size, 1999-2018

SPOUSES, DEPENDENTS, AND DOMESTIC PARTNER BENEFITS

  • The majority of firms offering health benefits offer to spouses and dependents, such as children.
  • In 2018, 97% of small firms and 99% of large firms offering health benefits offer coverage to spouses, similar to the percentages last year [Figure 2.11].
  • Ninety-five percent of small firms and 100% of large firms offering health benefits cover other dependents, such as children, similar to last year [Figure 2.11].
  • Five percent of small firms offering health benefits offer only single coverage to their workers [Figure 2.11].
  • Firms were also asked whether they offer health benefits to same-sex or opposite-sex domestic partners. While definitions may vary, employers often define domestic partners as an unmarried couple who has lived together for a specified period of time. Firms may define domestic partners separately from any legal requirements a state may have.
  • Forty-five percent of firms offering health benefits offer coverage to opposite-sex domestic partners, similar to the 36% that did so last year.
  • Forty-five percent of firms offering health benefits offer coverage to same-sex domestic partners, similar to the 40% that did so last year.
  • Forty-one percent of large firms offering health benefits offer coverage to opposite-sex domestic partners, similar to the 40% that did so last year [Figure 2.13].
  • Forty-seven percent of large firms offering health benefits offer coverage to same-sex domestic partners, similar to the 46% that did so last year [Figure 2.13].
  • When firms are asked if they offer health benefits to opposite or same-sex domestic partners, many small firms report that they have not encountered this issue. These firms may not have formal human resource policies on domestic partners simply because none of the firm’s workers have asked to cover a domestic partner. Regarding health benefits for opposite-sex domestic partners, 26% of small firms report that they have not encountered this request or that the question was not applicable. Similarly, for health benefits for same-sex domestic partners, 30% of small firms report that they have not encountered the request or that the question was not applicable [Figure 2.12].
  • Among large firms not offering health benefits to same-sex domestic partners, 5% stopped offering them within the past 12 months [Figure 2.14].
  • Over half (63%) of firms that offer health benefits to spouses also offer coverage to same-sex spouses [Figure 2.15].
  • Large firms are more likely than small firms to offer coverage to same-sex spouses (87% vs. 62%).
  • Small firms are more likely than large firms to report that this request has not been encountered (32% vs. 4%).
  • Among all firms that offer health benefits, 13% report providing additional compensation or benefits to employees if they enroll in a spouse’s plan, and 16% provide additional compensation or benefits to employees if they do not participate in the firm’s health benefits [Figure 2.17].
Figure 2.11: Among Firms Offering Benefits, Percentage That Offer to Spouses, Dependents and Partners, by Firm Size, 2018

Figure 2.11: Among Firms Offering Benefits, Percentage That Offer to Spouses, Dependents and Partners, by Firm Size, 2018

Figure 2.12: Among Firms Offering Health Benefits, Percentage That Offer to Unmarried Same-Sex and Opposite-Sex Domestic Partners, by Firm Size and Region, 2018

Figure 2.12: Among Firms Offering Health Benefits, Percentage That Offer to Unmarried Same-Sex and Opposite-Sex Domestic Partners, by Firm Size and Region, 2018

Figure 2.13: Among Large Firms Offering Health Benefits, Percentage That Offer to Unmarried Opposite-Sex and Same-Sex Domestic Partners, 2008-2018

Figure 2.13: Among Large Firms Offering Health Benefits, Percentage That Offer to Unmarried Opposite-Sex and Same-Sex Domestic Partners, 2008-2018

Figure 2.14: Among Firms Not Offering Domestic Partner Benefits, Percentage of Firms That Stopped Offering Those Benefits In the Past 12 Months, by Firm Size, 2018

Figure 2.14: Among Firms Not Offering Domestic Partner Benefits, Percentage of Firms That Stopped Offering Those Benefits In the Past 12 Months, by Firm Size, 2018

Figure 2.15: Among Firms Offering Health Benefits to Spouses, Percentage of Firms That Offer Coverage to Same-Sex Spouses, by Firm Size, 2018

Figure 2.15: Among Firms Offering Health Benefits to Spouses, Percentage of Firms That Offer Coverage to Same-Sex Spouses, by Firm Size, 2018

Figure 2.16: Among Firms Offering Health Benefits to Spouses, Percentage of Firms That Have Made a Significant Reduction In the Amount They Contribute to Cover an Employee's Spouse In the Past Year, by Firm Size, 2016 and 2018

Figure 2.16: Among Firms Offering Health Benefits to Spouses, Percentage of Firms That Have Made a Significant Reduction In the Amount They Contribute to Cover an Employee’s Spouse In the Past Year, by Firm Size, 2016 and 2018

Figure 2.17: Among Firms Offering Health Benefits, Percentage of Firms That Provide Workers Additional Incentives for Various Enrollment Decisions, by Firm Size, 2018

Figure 2.17: Among Firms Offering Health Benefits, Percentage of Firms That Provide Workers Additional Incentives for Various Enrollment Decisions, by Firm Size, 2018

Figure 2.18: Among Firms Offering Health Benefits, Percentage of Firms That Provide Workers Additional Compensation or Benefits for Various Enrollment Decisions, by Firm Size, 2009-2018

Figure 2.18: Among Firms Offering Health Benefits, Percentage of Firms That Provide Workers Additional Compensation or Benefits for Various Enrollment Decisions, by Firm Size, 2009-2018

FIRMS NOT OFFERING HEALTH BENEFITS

  • The survey asks firms that do not offer health benefits if they have offered insurance or shopped for insurance in the recent past, and about their most important reasons for not offering coverage. Because such a small percentage of large firms report not offering health benefits, we present responses for small non-offering firms only.
  • The cost of health insurance remains the primary reason cited by firms for not offering health benefits. Among small firms not offering health benefits, 47% cite high cost as “the most important reason” for not doing so, followed by “the firm is too small” (20%). Few small firms indicate that they do not offer because they believe employees will get a better deal on the health insurance exchanges (1%) [Figure 2.19].
  • Many small non-offering firms have either offered health insurance in the past five years or shopped for health insurance in the past year.
  • Twenty percent of small non-offering firms have offered health benefits in the past five years, the same percentage reported last year [Figure 2.20].
  • Twenty-four percent of small non-offering firms have shopped for coverage in the past year, an increase from last year (13%) [Figure 2.20].
  • Among small non-offering firms that report they stopped offering coverage within the past five years, 17% stopped offering coverage within the past year, similar to the percentage reported last year.
  • Among small non-offering firms, 9% report that they provide funds to their employees to purchase health insurance on their own in the individual market or through a health insurance exchange [Figure 2.21].
Figure 2.19: Among Small Firms Not Offering Health Benefits, Most Important Reason for Not Offering, 2018

Figure 2.19: Among Small Firms Not Offering Health Benefits, Most Important Reason for Not Offering, 2018

Figure 2.20: Among Small Firms Not Offering Health Benefits, Percentage of Firms That Report the Following Actions, 2009-2018

Figure 2.20: Among Small Firms Not Offering Health Benefits, Percentage of Firms That Report the Following Actions, 2009-2018

Figure 2.21: Among Small Firms Not Offering Health Benefits, Percentage of Firms That Provide Workers Funds to Purchase Non-Group Insurance, by Firm Size, 2012-2018

Figure 2.21: Among Small Firms Not Offering Health Benefits, Percentage of Firms That Provide Workers Funds to Purchase Non-Group Insurance, by Firm Size, 2012-2018


  1. Kaiser Family Foundation. Diminishing offer and coverage rates among private sector employees. Menlo Park, (CA): KFF; 2016 Sep (cited 2017 Jul 13). Available from: http://www.kff.org/private-insurance/issue-brief/diminishing-offer-and-coverage-rates-among-private-sector-employees/
  2. For more information on the Employer Health Benefits Survey’s weighting and design please see the Survey Design and Methods section.
  3. Internal Revenue Code. 26 U.S. Code § 4980H – Shared responsibility for employers regarding health coverage. 2011. https://www.gpo.gov/fdsys/pkg/USCODE-2011-title26/pdf/USCODE-2011-title26-subtitleD-chap43-sec4980H.pdf

Section Three: Employee Coverage, Eligibility, And Participation

Employers are the principal source of health insurance in the United States, providing health benefits for about 152 million non-elderly people in America.12 Most workers are offered health coverage at work, and the majority of workers who are offered coverage take it. Workers may not be covered by their own employer for several reasons: their employer may not offer coverage, they may not be eligible for the benefits offered by their firm, they may elect to receive coverage through their spouse’s employer, or they may refuse coverage from their firm. In 2018, 60% of covered workers in firms offering health benefits are covered by their own firm, similar to the percentage in recent years, but lower than the percentage ten years ago (65%).

Before eligible workers may enroll in benefits at their firm, 71% of covered workers face a waiting period.

ELIGIBILITY

  • Even in firms that offer health benefits, some workers may not be eligible to participate.13 Many firms, for example, do not offer coverage to part-time or temporary workers. Among workers in firms offering health benefits in 2018, 79% are eligible to enroll in the benefits offered by their firm, similar to the percentages last year and the recent past for both small and large firms [Figure 3.1].
  • The percentage of workers eligible to enroll in health benefits at their firm is relatively higher in firms with 3-24 workers (83%) and firms with 200-999 workers (82%), and relatively lower in firms with 5,000 or more workers (75%) [Figure 3.3].
  • Eligibility varies considerably by firm wage level. Workers in firms with a relatively large share of lower-wage workers (where at least 35% of workers earn $25,000 a year or less) are less likely to be eligible for health benefits than workers in firms with a smaller share of lower-wage workers (61% vs. 81%) [Figure 3.5].
  • Workers in firms with a relatively large share of higher-wage workers (where at least 35% earn $62,000 or more annually) are more likely to be eligible for health benefits than workers in firms with a smaller share of higher-wage workers (86% vs. 73%) [Figure 3.5].
  • Eligibility also varies by the age of the workforce. Those in firms with a relatively small share of younger workers (where fewer than 35% of the workers are age 26 or younger) are more likely to be eligible for health benefits than those in firms with a larger share of younger workers (81% vs. 63%) [Figure 3.5].
  • Eligibility rates vary considerably for workers in different industries. The average eligibility rate is particularly low in retail firms (48%) [Figure 3.3].
Figure 3.1: Eligibility, Take-Up, and Coverage Rates for Workers In Firms Offering Health Benefits, by Firm Size, 1999-2018

Figure 3.1: Eligibility, Take-Up, and Coverage Rates for Workers In Firms Offering Health Benefits, by Firm Size, 1999-2018

Figure 3.2: Eligibility and Coverage Rates for Workers In Firms Offering Health Benefits, 1999-2018

Figure 3.2: Eligibility and Coverage Rates for Workers In Firms Offering Health Benefits, 1999-2018

Figure 3.3: Eligibility, Take-Up, and Coverage Rates In Firms Offering Health Benefits, by Firm Size, Region, and Industry, 2018

Figure 3.3: Eligibility, Take-Up, and Coverage Rates In Firms Offering Health Benefits, by Firm Size, Region, and Industry, 2018

Figure 3.4: Eligibility, Take-Up, and Coverage Rates In Firms Offering Health Benefits, by Firm Size, 2018

Figure 3.4: Eligibility, Take-Up, and Coverage Rates In Firms Offering Health Benefits, by Firm Size, 2018

Figure 3.5: Among Workers In Firms Offering Health Benefits, Percentage of Workers Eligible for Health Benefits Offered by Their Firm, by Firm Characteristics, 2018

Figure 3.5: Among Workers In Firms Offering Health Benefits, Percentage of Workers Eligible for Health Benefits Offered by Their Firm, by Firm Characteristics, 2018

TAKE-UP RATE

  • Seventy-six percent of eligible workers take up coverage when it is offered to them, similar to the percentage last year [Figure 3.1].14 Eligible workers in large firms (200 or more workers) are more likely to take up coverage when offered than eligible workers in small firms (3-199 workers) (78% vs. 73%) [Figure 3.3].
  • The likelihood of a worker accepting a firm’s offer of coverage varies by firm wage level. Eligible workers in firms with a relatively small share of lower-wage workers are more likely to take up coverage than eligible workers in firms with a larger share of lower-wage workers (79% vs. 54%) [Figure 3.6].
  • Eligible workers in firms with a relatively large share of higher-wage workers are more likely to take up coverage than those in firms with a smaller share of higher-wage workers (81% vs. 72%) [Figure 3.6].
  • Eligible workers in firms with a relatively large share of older workers (where at least 35% of the workers are age 50 or older) are more likely to take up coverage than those in firms with a smaller share of older workers (80% vs. 74%) [Figure 3.6].
  • The percentage of eligible workers taking up benefits in offering firms also varies considerably by industry. The average take-up rate is lower in agriculture/mining/construction firms (67%) than firms of other industries [Figure 3.3].
  • The share of eligible workers taking up benefits in offering firms (76%) has decreased over time, from 80% in 2013 and 82% in 2008 [Figure 3.1].
Figure 3.6: Among Workers In Firms Offering Health Benefits, Percentage of Eligible Workers Who Take Up Health Benefits Offered by Their Firm, by Firm Characteristics, 2018

Figure 3.6: Among Workers In Firms Offering Health Benefits, Percentage of Eligible Workers Who Take Up Health Benefits Offered by Their Firm, by Firm Characteristics, 2018

COVERAGE

  • In 2018, the percentage of workers at firms offering health benefits covered by their firm’s health plan is 60%, similar to the percentage last year [Figures 3.1 and 3.2].
  • The coverage rate at firms offering health benefits is the same for small firms and large firms in 2018. These rates are similar to the rates last year for both small firms and large firms [Figure 3.1].
  • There is significant variation by industry in the coverage rate among workers in firms offering health benefits. The average coverage rate is particularly low in retail (35%) and service (55%) industries [Figure 3.3].
  • There also is variation by firm wage levels. Among workers in firms offering health benefits, those in firms with a relatively large share of lower-wage workers are much less likely to be covered by their own firm than workers in firms with a smaller share of lower-wage workers (33% vs. 64%). A comparable pattern exists in firms with a relatively large share of higher-wage workers, with workers in these firms being more likely to be covered by their employer’s health benefits than those in firms with a smaller share of higher-wage workers (70% vs. 53%) [Figure 3.7].
  • The age profile of workers is also related to variation in coverage rates. Among workers in firms offering health benefits, those in firms with a relatively small share of younger workers are more likely to be covered by their own firm than those in firms with a larger share of younger workers (63% vs. 44%). Similarly, workers in offering firms with a relatively large share of older workers are more likely to be covered by their own firm than those in firms with a smaller share of older workers (65% vs. 56%) [Figure 3.7].
  • Among workers in all firms, including those that offer and those that do not offer health benefits, 53% are covered by health benefits offered by their employer, similar to last year, but lower than the coverage rate in 2008 (60%) [Figure 3.8].
Figure 3.7: Among Workers In Firms Offering Health Benefits, Percentage of Workers Covered by Health Benefits Offered by Their Firm, by Firm Characteristics, 2018

Figure 3.7: Among Workers In Firms Offering Health Benefits, Percentage of Workers Covered by Health Benefits Offered by Their Firm, by Firm Characteristics, 2018

Figure 3.8: Percentage of Workers Covered by Their Firm's Health Benefits, 1999-2018

Figure 3.8: Percentage of Workers Covered by Their Firm’s Health Benefits, 1999-2018

Figure 3.9: Percentage of All Workers Covered by Their Firm's Health Benefits, Both In Firms Offering and Not Offering Health Benefits, by Firm Size, 1999-2018

Figure 3.9: Percentage of All Workers Covered by Their Firm’s Health Benefits, Both In Firms Offering and Not Offering Health Benefits, by Firm Size, 1999-2018

WAITING PERIODS

  • Waiting periods are a specified length of time after beginning employment before workers are eligible to enroll in health benefits. With some exceptions, the Affordable Care Act (ACA) requires that waiting periods cannot exceed 90 days.15 For example, employers are permitted to have orientation periods before the waiting period begins which, in effect, means a worker is not eligible for coverage three months after being hired. If a worker is eligible to enroll on the 1st of the month after three months of employment, this survey rounds up and considers the firm’s waiting period four months. For these reasons, some employers still have waiting periods exceeding the 90-day maximum.
  • Seventy-one percent of covered workers face a waiting period before coverage is available, similar to last year [Figure 3.12]. Covered workers in small firms are more likely than those in large firms to have a waiting period (81% vs. 67%) [Figure 3.10].
  • The average waiting period among covered workers who face a waiting period is 1.9 months [Figure 3.10]. A small percentage (4%) of covered workers with a waiting period have a waiting period of more than 3 months.
  • Respondents with waiting periods greater than 4 months generally indicated that employees had training, orientation, or measurement periods in which they were employees but were not eligible for health benefits. Some employers have measurement periods to determine whether variable hour employees will meet the requirements for the firm’s health benefits.16
Figure 3.10: Percentage of Covered Workers In Firms With a Waiting Period for Coverage and Average Waiting Period In Months, by Firm Size, Region, and Industry, 2018

Figure 3.10: Percentage of Covered Workers In Firms With a Waiting Period for Coverage and Average Waiting Period In Months, by Firm Size, Region, and Industry, 2018

Figure 3.11: Distribution of Covered Workers With the Following Waiting Periods for Coverage, by Firm Size, 2018

Figure 3.11: Distribution of Covered Workers With the Following Waiting Periods for Coverage, by Firm Size, 2018

Figure 3.12: Percentage of Covered Workers In Firms With a Waiting Period for Coverage, by Firm Size, 2002-2018

Figure 3.12: Percentage of Covered Workers In Firms With a Waiting Period for Coverage, by Firm Size, 2002-2018

Figure 3.13: Among Covered Workers With a Waiting Period for Health Benefits, Average Waiting Period In Months, by Firm Size, 2002-2018

Figure 3.13: Among Covered Workers With a Waiting Period for Health Benefits, Average Waiting Period In Months, by Firm Size, 2002-2018


  1. The Uninsured: A Primer – Key Facts about Health Insurance and the Uninsured Under the Affordable Care Act. Washington (DC): The Commission; 2017 Dec (cited 2018 July 30). https://www.kff.org/uninsured/report/the-uninsured-a-primer-key-facts-about-health-insurance-and-the-uninsured-under-the-affordable-care-act/. See supplemental tables – Table 1: 271.1 million non-elderly people, 56.2% of whom are covered by employer-sponsored insurance (ESI).
  2. See Section 2 for part-time and temporary worker offer rates.
  3. In 2009, we began weighting the percentage of workers that take up coverage by the number of workers eligible for coverage. The historical take-up estimates have also been updated. See the Survey Design and Methods section for more information.
  4. Variable hour employees may have a measurement period of up to 12 months before it is determined if they are eligible for benefits. Employers may require a cumulative service requirement of up to 1,200 hours before an employee may enroll. Federal Register. Vol. 79, No. 36. Feb 12, 2014. https://www.gpo.gov/fdsys/pkg/FR-2014-02-24/pdf/2014-03809.pdf
  5. Under the ACA, employers may determine whether or not an employee is a full-time employee by looking back at the number of hours an employee has worked during a defined period. See https://www.irs.gov/affordable-care-act/employers/identifying-full-time-employees

Section Four: Types Of Plans Offered

Most firms that offer health benefits offer only one type of health plan (80%). Large firms (200 or more workers) are more likely than small firms (3-199 workers) to offer more than one type of health plan. Firms are most likely to offer their workers a PPO plan and are least likely to offer a conventional plan (sometimes known as indemnity insurance).

  • In 2018, 80% of firms offering health benefits offer only one type of health plan. Large firms are more likely than small firms to offer more than one plan type (58% vs. 19%) [Figure 4.1].
  • Fifty-nine percent of covered workers are employed in a firm that offers more than one type of health plan. Sixty-nine percent of covered workers in large firms are employed by a firm that offers more than one plan type, compared to 35% in small firms [Figure 4.2].
  • Seventy-three percent of covered workers in firms offering health benefits work in firms that offer one or more PPOs; 58% work in firms that offer one or more HDHP/SOs; 37% work in firms that offer one or more HMOs; 10% work in firms that offer one or more POS plans; and 1% work in firms that offer one or more conventional plans [Figure 4.4].17
  • Among covered workers in firms offering only one type of health plan, 51% are in firms that only offer one or more PPOs and 29% are in firms that only offer one or more HDHP/SOs [Figure 4.5].
  • Some firms only offer workers an HDHP/SO, with no other plan choices available to them. At 61% of firms that offer an HDHP/SO, at least some workers can only choose an HDHP/SO, while 39% of firms that offer an HDHP/SO allow workers to choose between an HDHP/SO and other plan types [Figure 4.6].
Figure 4.1: Among Firms Offering Health Benefits, Percentage of Firms That Offer One, Two, or Three or More Plan Types, by Firm Size, 2018

Figure 4.1: Among Firms Offering Health Benefits, Percentage of Firms That Offer One, Two, or Three or More Plan Types, by Firm Size, 2018

Figure 4.2: Among Firms Offering Health Benefits, Percentage of Covered Workers In Firms Offering One, Two, or Three or More Plan Types, by Firm Size, 2018

Figure 4.2: Among Firms Offering Health Benefits, Percentage of Covered Workers In Firms Offering One, Two, or Three or More Plan Types, by Firm Size, 2018

Figure 4.3: Among Firms Offering Health Benefits, Percentage of Firms That Offer the Following Plan Types, by Firm Size, 2018

Figure 4.3: Among Firms Offering Health Benefits, Percentage of Firms That Offer the Following Plan Types, by Firm Size, 2018

Figure 4.4: Among Firms Offering Health Benefits, Percentage of Covered Workers In Firms That Offer the Following Plan Types, by Firm Size, 2018

Figure 4.4: Among Firms Offering Health Benefits, Percentage of Covered Workers In Firms That Offer the Following Plan Types, by Firm Size, 2018

Figure 4.5: Among Firms Offering Only One Type of Health Plan, Percentage of Covered Workers In Firms That Offer the Following Plan Type, by Firm Size, 2018

Figure 4.5: Among Firms Offering Only One Type of Health Plan, Percentage of Covered Workers In Firms That Offer the Following Plan Type, by Firm Size, 2018

Figure 4.6: Among Firms Offering an HDHP/SO, Percentage of Firms That Offer Workers Various Plan Type Choices, by Firm Size, 2018

Figure 4.6: Among Firms Offering an HDHP/SO, Percentage of Firms That Offer Workers Various Plan Type Choices, by Firm Size, 2018


The survey collects information on a firm’s plan with the largest enrollment in each of the plan types. While we know the number of plan types a firm has, we do not know the total number of plans a firm offers workers. In addition, firms may offer different types of plans to different workers. For example, some workers might be offered one type of plan at one location, while workers at another location are offered a different type of plan.


  1. Starting in 2010, we included firms that said they offer a plan type even if there are no covered workers enrolled in that plan type.

Section Five: Market Shares Of Health Plans

The largest share of covered workers is enrolled in PPOs, covering 49% of covered workers, followed by HDHP/SOs, HMOs, POS plans, and conventional plans.

  • Forty-nine percent of covered workers are enrolled in PPOs, followed by HDHP/SOs (29%), HMOs (16%), POS plans (6%), and conventional plans (less than one percent) [Figure 5.1].
  • The percentage of covered workers enrolled in HDHP/SOs is similar to last year, but has increased over the past decade.
  • The percentage of covered workers enrolled in PPOs is similar to last year, but has decreased over the past decade.
  • A larger share of covered workers are enrolled in HDHP/SOs than in HMOs in both small firms and large firms.
  • The share of covered workers enrolled in POS plans decreased from 10% in 2017 to 6% this year [Figure 5.1].
  • Covered workers in small firms are more likely than covered workers in large firms to enroll in POS plans (11% vs. 3%) [Figure 5.2].
  • Plan enrollment patterns also differ across regions.
  • HMO enrollment is significantly higher in the West (33%), and significantly lower in the South (10%) and Midwest (5%) [Figure 5.3].
  • Covered workers in the South (55%) are more likely to be enrolled in PPOs than workers in other regions [Figure 5.3].
  • Covered workers in the Midwest (39%) are more likely to be enrolled in HDHP/SOs than workers in other regions, while covered workers in the West (19%) are less likely to be enrolled in HDHP/SOs [Figure 5.3].
Figure 5.1: Distribution of Health Plan Enrollment for Covered Workers, by Plan Type, 1988-2018

Figure 5.1: Distribution of Health Plan Enrollment for Covered Workers, by Plan Type, 1988-2018

Figure 5.2: Distribution of Health Plan Enrollment for Covered Workers, by Plan Type and Firm Size, 2018

Figure 5.2: Distribution of Health Plan Enrollment for Covered Workers, by Plan Type and Firm Size, 2018

Figure 5.3: Distribution of Health Plan Enrollment for Covered Workers, by Firm Size, Region, and Industry, 2018

Figure 5.3: Distribution of Health Plan Enrollment for Covered Workers, by Firm Size, Region, and Industry, 2018

Section Six: Worker And Employer Contributions For Premiums

In 2018, premium contributions by covered workers average 18% for single coverage and 29% for family coverage.18 The average monthly worker contributions are $99 for single coverage ($1,186 annually) and $462 for family coverage ($5,547 annually). Covered workers in small firms (3-199 workers) make a higher average contribution for family coverage ($6,781 vs. $5,046) than covered workers in large firms (200 or more workers).

  • In 2018, covered workers on average contribute 18% of the premium for single coverage and 29% of the premium for family coverage [Figure 6.1].19 The average percentage contributed for single coverage has remained stable in recent years. While estimates of the average contribution percentage for family coverage have shown small changes in recent years, the differences after 2012 are not statistically significant.
  • Covered workers in small firms on average contribute a higher percentage of the premium for family coverage (38% vs. 26%) than covered workers in large firms [Figure 6.2].
  • Workers with single coverage make an average contribution of $99 per month ($1,186 annually), and workers with family coverage make an average contribution of $462 per month ($5,547 annually) toward their health insurance premiums [Figures 6.3, 6.4, and 6.5].
  • The average worker contributions in HDHP/SOs are lower than the overall average worker contribution for single coverage ($1,074 vs. $1,186) and family coverage ($4,631 vs. $5,547). The average worker contributions in PPOs are higher than the overall average worker contribution for family coverage ($5,916 vs. $5,547) [Figure 6.6].
  • Worker contributions also differ by firm size. Workers in small firms on average contribute significantly more annually for family coverage than workers in large firms ($6,781 vs. $5,046) [Figure 6.7].
Figure 6.1: Average Percentage of Premium Paid by Covered Workers for Single and Family Coverage, 1999-2018

Figure 6.1: Average Percentage of Premium Paid by Covered Workers for Single and Family Coverage, 1999-2018

Figure 6.2: Average Percentage of Premium Paid by Covered Workers for Single and Family Coverage, by Firm Size, 2018

Figure 6.2: Average Percentage of Premium Paid by Covered Workers for Single and Family Coverage, by Firm Size, 2018

Figure 6.3: Average Monthly Worker Premium Contributions for Single and Family Coverage, 1999-2018

Figure 6.3: Average Monthly Worker Premium Contributions for Single and Family Coverage, 1999-2018

Figure 6.4: Average Annual Worker and Employer Contributions to Premiums and Total Premiums for Single Coverage, 1999-2018

Figure 6.4: Average Annual Worker and Employer Contributions to Premiums and Total Premiums for Single Coverage, 1999-2018

Figure 6.5: Average Annual Worker and Employer Contributions to Premiums and Total Premiums for Family Coverage, 1999-2018

Figure 6.5: Average Annual Worker and Employer Contributions to Premiums and Total Premiums for Family Coverage, 1999-2018

Figure 6.6: Average Annual Firm and Worker Premium Contributions and Total Premiums for Single and Family Coverage, by Plan Type, 2018

Figure 6.6: Average Annual Firm and Worker Premium Contributions and Total Premiums for Single and Family Coverage, by Plan Type, 2018

Figure 6.7: Average Annual Worker and Employer Premium Contributions and Total Premiums for Single and Family Coverage, by Firm Size, 2018

Figure 6.7: Average Annual Worker and Employer Premium Contributions and Total Premiums for Single and Family Coverage, by Firm Size, 2018

Figure 6.8: Average Annual Firm and Worker Premium Contributions and Total Premiums for Single Coverage, by Plan Type and Firm Size, 2018

Figure 6.8: Average Annual Firm and Worker Premium Contributions and Total Premiums for Single Coverage, by Plan Type and Firm Size, 2018

Figure 6.9: Average Annual Employer and Worker Premium Contributions and Total Premiums for Family Coverage, by Plan Type and Firm Size, 2018

Figure 6.9: Average Annual Employer and Worker Premium Contributions and Total Premiums for Family Coverage, by Plan Type and Firm Size, 2018

DISTRIBUTIONS OF WORKER CONTRIBUTIONS TO THE PREMIUM

  • About four-fifths of covered workers are in a plan where the employer contributes at least half of the premium for both single and family coverage.
  • Twelve percent of covered workers are in a plan where the employer pays the entire premium for single coverage; 3% of covered workers are in a plan where the employer pays the entire premium for family coverage [Figure 6.10].
  • Covered workers in small firms are much more likely than covered workers in large firms to be in a plan where the employer pays 100% of the premium.
  • Twenty-seven percent of covered workers in small firms have an employer that pays the full premium for single coverage, compared to 6% of covered workers in large firms [Figure 6.10].
  • For family coverage, 8% of covered workers in small firms have an employer that pays the full premium, compared to 1% of covered workers in large firms [Figure 6.10].
  • Fifteen percent of covered workers are in a plan with a worker contribution of more than 50% of the premium for family coverage [Figure 6.10].
  • Thirty-four percent of covered workers in small firms work in a firm where the worker contribution for family coverage is more than 50% of the premium, compared to 8% of covered workers in large firms [Figure 6.10].
  • Small shares of covered workers in small firms (3%) and large firms (1%) must pay more than 50% of the premium for single coverage [Figure 6.10].
  • There is substantial variation among workers in small firms and workers in large firms in the dollar amounts they contribute for single and family coverage.
  • Among covered workers in small firms, 35% make a contribution for single coverage of less than $500, while 19% contribute $2,000 or more. For family coverage, 14% make a contribution of less than $1,500 for family coverage, while 21% contribute $10,500 or more [Figures 6.13 and 6.14].
  • Among covered workers in large firms, 13% make a contribution for single coverage of less than $500, while 12% contribute $2,000 or more. For family coverage, 5% make a contribution of less than $1,500 for family coverage, while 4% contribute $10,500 or more [Figures 6.13 and 6.14].
Figure 6.10: Distribution of Percentage of Premium Paid by Covered Workers for Single and Family Coverage, by Firm Size, 2018

Figure 6.10: Distribution of Percentage of Premium Paid by Covered Workers for Single and Family Coverage, by Firm Size, 2018

Figure 6.11: Distribution of Percentage of Premium Paid by Covered Workers for Single Coverage, 2002-2018

Figure 6.11: Distribution of Percentage of Premium Paid by Covered Workers for Single Coverage, 2002-2018

Figure 6.12: Distribution of Percentage of Premium Paid by Covered Workers for Family Coverage, 2002-2018

Figure 6.12: Distribution of Percentage of Premium Paid by Covered Workers for Family Coverage, 2002-2018

Figure 6.13: Distribution of Worker Contributions for Single Coverage, by Firm Size, 2018

Figure 6.13: Distribution of Worker Contributions for Single Coverage, by Firm Size, 2018

Figure 6.14: Distribution of Worker Contributions for Family Coverage, by Firm Size, 2018

Figure 6.14: Distribution of Worker Contributions for Family Coverage, by Firm Size, 2018

DIFFERENCES BY FIRM CHARACTERISTICS

  • The percentage of the premium paid by covered workers also varies by firm characteristics.
  • Covered workers in firms with a relatively large share of lower-wage workers (where at least 35% of workers earn $25,000 a year or less) on average have higher contribution rates for single coverage (24% vs. 17%) and family coverage (42% vs. 29%) than those in firms with a smaller share of lower-wage workers [Figures 6.19 and 6.20].
  • Covered workers in firms with a relatively large share of higher-wage workers (where at least 35% earn $62,000 or more annually) on average have lower contribution rates for family coverage than those in firms with a smaller share of higher-wage workers (27% vs. 32%) [Figures 6.19 and 6.20].
  • Covered workers in firms that have at least some union workers on average have lower contribution rates for family coverage than those in firms without any union workers (22% vs. 34%) [Figure 6.20].
  • Covered workers in firms that are partially or completely self-funded on average have lower contribution rates for family coverage than workers in firms that are fully-insured (25% vs. 36%) [Figure 6.20].20
  • Covered workers in private for-profit firms on average have higher contribution rates for both single coverage (19%) and family coverage (31%) than workers in other types of firms. Covered workers in public organizations have lower contribution rates for both single coverage (13%) and family coverage (22%) than workers in other types of firms [Figures 6.19 and 6.20].
Figure 6.15: Distribution of the Percentage of Total Premium Paid by Covered Workers for Single and Family Coverage, by Firm Wage Level, 2018

Figure 6.15: Distribution of the Percentage of Total Premium Paid by Covered Workers for Single and Family Coverage, by Firm Wage Level, 2018

Figure 6.16: Average Annual Worker and Employer Contributions to Premiums and Total Premiums for Single and Family Coverage, by Firm Wage Level, 2018

Figure 6.16: Average Annual Worker and Employer Contributions to Premiums and Total Premiums for Single and Family Coverage, by Firm Wage Level, 2018

Figure 6.17: Average Monthly and Annual Worker Premium Contributions Paid by Covered Workers for Single and Family Coverage, by Plan Type and Region, 2018

Figure 6.17: Average Monthly and Annual Worker Premium Contributions Paid by Covered Workers for Single and Family Coverage, by Plan Type and Region, 2018

Figure 6.18: Average Annual Premium Contributions Paid by Covered Workers for Single and Family Coverage, by Firm Characteristics, 2018

Figure 6.18: Average Annual Premium Contributions Paid by Covered Workers for Single and Family Coverage, by Firm Characteristics, 2018

Figure 6.19: Average Percentage of Premium Paid by Covered Workers, by Firm Characteristics, 2018

Figure 6.19: Average Percentage of Premium Paid by Covered Workers, by Firm Characteristics, 2018

Figure 6.20: Average Percentage of Premium Paid by Covered Workers, by Firm Characteristics and Size, 2018

Figure 6.20: Average Percentage of Premium Paid by Covered Workers, by Firm Characteristics and Size, 2018

Figure 6.21: Average Percentage of Premium Paid by Covered Workers for Single and Family Coverage, by Plan Type and Region, 2018

Figure 6.21: Average Percentage of Premium Paid by Covered Workers for Single and Family Coverage, by Plan Type and Region, 2018

Figure 6.22: Average Percentage of Premium Paid by Covered Workers, by Industry, 2018

Figure 6.22: Average Percentage of Premium Paid by Covered Workers, by Industry, 2018

CHANGES OVER TIME

  • The average worker contributions for single and family coverage have increased 65% and 65%, respectively, over the past 10 years, and 19% and 21%, respectively, over the past five years.
  • Over the past ten years, the average worker contribution for family coverage has increased faster than the average employer contribution for family coverage (65% vs. 51%).
  • The average worker contributions for single and family coverage in both small and large firms are similar to last year [Figures 6.23 and 6.24].
Figure 6.23: Average Annual Worker Contributions for Covered Workers With Single Coverage, by Firm Size, 1999-2018

Figure 6.23: Average Annual Worker Contributions for Covered Workers With Single Coverage, by Firm Size, 1999-2018

Figure 6.24: Average Annual Worker Contributions for Covered Workers With Family Coverage, by Firm Size, 1999-2018

Figure 6.24: Average Annual Worker Contributions for Covered Workers With Family Coverage, by Firm Size, 1999-2018

Figure 6.25: Average Percentage of Premium Paid by Covered Workers for Single and Family Coverage, by Firm Size, 1999-2018

Figure 6.25: Average Percentage of Premium Paid by Covered Workers for Single and Family Coverage, by Firm Size, 1999-2018

Figure 6.26: Among Large Firms, Average Annual Worker Contributions for Covered Workers With Family Coverage, by Firm Wage Level, 1999-2018

Figure 6.26: Among Large Firms, Average Annual Worker Contributions for Covered Workers With Family Coverage, by Firm Wage Level, 1999-2018


  1. Estimates for premiums, worker contributions to premiums, and employer contributions to premiums presented in Section 6 do not include contributions made by the employer to Health Savings Accounts (HSAs) or Health Reimbursement Arrangements (HRAs). See Section 8 for estimates of employer contributions to HSAs and HRAs.
  2. The average percentage contribution is calculated as a weighted average of all a firm’s plan types and may not necessarily equal the average worker contribution divided by the average premium.
  3. For definitions of self-funded and fully-insured plans, see the introduction to Section 10.

Section Seven: Employee Cost Sharing

In addition to any required premium contributions, most covered workers must pay a share of the cost for the medical services they use. The most common forms of cost sharing are: deductibles (an amount that must be paid before most services are covered by the plan), copayments (fixed dollar amounts), and coinsurance (a percentage of the charge for services). The type and level of cost sharing often vary by the type of plan in which the worker is enrolled. Cost sharing may also vary by the type of service, such as office visits, hospitalizations, or prescription drugs.

The cost-sharing amounts reported here are for covered workers using in-network services. Plan enrollees receiving services from providers that do not participate in plan networks often face higher cost sharing and may be responsible for charges that exceed the plan’s allowable amounts. The framework of this survey does not allow us to capture all of the complex cost-sharing requirements in modern plans, particularly for ancillary services (such as durable medical equipment or physical therapy) or cost-sharing arrangements that vary across different settings (such as tiered networks). Therefore, we do not collect information on all plan provisions and limits that affect enrollee out-of-pocket liability.

GENERAL ANNUAL DEDUCTIBLES FOR WORKERS IN PLANS WITH DEDUCTIBLES

  • A general annual deductible is an amount that must be paid by enrollees before most services are covered by their health plan. Non-grandfathered health plans are required to cover some services, such as preventive care, without cost sharing. Some plans require enrollees to meet a service-specific deductible, such as for prescription drugs or hospital admissions, in lieu of or in addition to a general annual deductible.
  • Eighty-five percent of covered workers are enrolled in a plan with a general annual deductible for single coverage, higher than the percentage last year (81%) and much higher than the percentage ten years ago (59%) [Figure 7.2].
  • The percentage of covered workers enrolled in a plan with a general annual deductible for single coverage is the same for small firms (3-199 workers) and large firms (200 or more workers) (85%) [Figure 7.2].
  • The likelihood of having a deductible varies by plan type [Figure 7.1]. Covered workers in HMOs are less likely to have a general annual deductible for single coverage than workers in other plan types. Forty-six percent of workers in HMOs do not have a general annual deductible for single coverage, compared to 24% of workers in POS plans and 12% of workers in PPOs.
  • For covered workers in a plan with a general annual deductible, the average annual deductible for single coverage is $1,573, similar to the average deductible last year ($1,505) [Figures 7.3 and 7.10].
  • For covered workers in plans with a general annual deductible, the average deductibles for single coverage are $870 in HMOs, $1,204 in PPOs, $1,598 in POS plans, and $2,349 in HDHP/SOs [Figure 7.6].
  • The average deductibles for single coverage are higher across plan types for covered workers in small firms than for covered workers in large firms. For covered workers in PPOs with a general annual deductible, for example, the average deductible for single coverage in small firms is considerably higher than the average deductible in large firms ($1,784 vs. $1,012) [Figure 7.6]. Overall, for covered workers in plans with a general annual deductible, the average deductible for single coverage in small firms ($2,132) is higher than the average deductible in large firms ($1,355) [Figure 7.3].
  • The average general annual deductible for single coverage for covered workers in plans with a deductible has increased 39% over the past five years, from $1,135 in 2013 to $1,573 in 2018 [Figure 7.9].
Figure 7.1: Percentage of Covered Workers With No General Annual Deductible for Single Coverage, by Plan Type and Firm Size, 2018

Figure 7.1: Percentage of Covered Workers With No General Annual Deductible for Single Coverage, by Plan Type and Firm Size, 2018

Figure 7.2: Percentage of Covered Workers In a Plan That Includes a General Annual Deductible for Single Coverage, by Plan Type and Firm Size, 2006-2018

Figure 7.2: Percentage of Covered Workers In a Plan That Includes a General Annual Deductible for Single Coverage, by Plan Type and Firm Size, 2006-2018

Figure 7.3: Percentage of Covered Workers In a Plan That Includes a General Annual Deductible and Average Deductible for Single Coverage, by Firm Size and Region, 2018

Figure 7.3: Percentage of Covered Workers In a Plan That Includes a General Annual Deductible and Average Deductible for Single Coverage, by Firm Size and Region, 2018

Figure 7.4: Percentage of Covered Workers In a Plan That Includes a General Annual Deductible and Average Deductibles for Single Coverage, by Firm Characteristics, 2018

Figure 7.4: Percentage of Covered Workers In a Plan That Includes a General Annual Deductible and Average Deductibles for Single Coverage, by Firm Characteristics, 2018

Figure 7.5: Among Covered Workers With No General Annual Deductible, Percentage With Other Forms of Cost Sharing for Various Services, by Plan Type, 2018

Figure 7.5: Among Covered Workers With No General Annual Deductible, Percentage With Other Forms of Cost Sharing for Various Services, by Plan Type, 2018

Figure 7.6: Among Covered Workers With a General Annual Deductible for Single Coverage, Average Deductible, by Plan Type and Firm Size, 2018

Figure 7.6: Among Covered Workers With a General Annual Deductible for Single Coverage, Average Deductible, by Plan Type and Firm Size, 2018

Figure 7.7: Percentage of Covered Workers With a General Annual Deductible for Single Coverage, 2006-2018

Figure 7.7: Percentage of Covered Workers With a General Annual Deductible for Single Coverage, 2006-2018

Figure 7.8: Prevalence and Value of General Annual Deductibles for Single Coverage, by Firm Size, 2006-2018

Figure 7.8: Prevalence and Value of General Annual Deductibles for Single Coverage, by Firm Size, 2006-2018

Figure 7.9: Among Covered Workers With a General Annual Deductible, Average Single and Family Coverage Deductible, by Plan Type, 2006-2018

Figure 7.9: Among Covered Workers With a General Annual Deductible, Average Single and Family Coverage Deductible, by Plan Type, 2006-2018

GENERAL ANNUAL DEDUCTIBLES AMONG ALL COVERED WORKERS

  • As discussed above, the share of covered workers in plans with a general annual deductible has increased significantly over time: from 59% in 2008, to 78% in 2013, to 85% in 2018 [Figure 7.2]. The average deductibles for covered workers in plans with a deductible have also increased: from $735 in 2008, to $1,135 in 2013, to $1,573 in 2018 [Figure 7.10]. Neither trend by itself, however, captures the full impact of changes in deductibles on covered workers. We can look at the average impact of both trends together on covered workers by assigning a zero deductible value to covered workers in plans with no deductible and looking at how the resulting averages change over time. These average deductible amounts are lower in any given year but the changes over time reflect both the higher deductibles in plans with a deductible and the fact that more workers face them.
  • Using this approach, the average general annual deductible for single coverage for all covered workers in 2018 is $1,350, higher than the general annual deductible last year ($1,221) [Figure 7.10].
  • The 2018 value is 53% higher than the average general annual deductible of $883 in 2013 and 212% higher than the average general annual deductible of $433 in 2008 [Figure 7.10].
  • Another way to look at deductibles is the percentage of all covered workers who are in a plan with a deductible that exceeds certain thresholds. Fifty-eight percent of covered workers are in plans with a general annual deductible of $1,000 or more for single coverage, higher than the percentage last year [Figure 7.13].
  • Over the past five years, the percentage of covered workers with a general annual deductible of $1,000 or more for single coverage has grown 54%, from 38% to 58% [Figure 7.13].
  • Workers in small firms are considerably more likely to have a general annual deductible of $1,000 or more for single coverage than workers in large firms (68% vs. 54%) [Figure 7.12].
  • In 2018, over a quarter (26%) of covered workers are enrolled in a plan with a deductible of $2,000 or more, higher than the percentage last year (22%) [Figure 7.15]. This percentage is much higher for covered workers in small firms (42% vs. 20%) [Figure 7.12].

GENERAL ANNUAL DEDUCTIBLES AND ACCOUNT CONTRIBUTIONS

  • One of the reasons for the growth in deductibles has been the growth in enrollment in HDHP/SOs, which have higher deductibles than other plans. While growing deductibles in other plan types generally increases enrollee out-of-pocket liability, the shift in enrollment to HDHP/SOs does not necessarily do so because many HDHP/SO enrollees receive an account contribution from their employers, which in essence reduces the high cost sharing in these plans.
  • Eight percent of covered workers in an HDHP with an HRA and 2% of covered workers in an HSA-qualified HDHP receive an account contribution for single coverage at least equal to their deductible, while another 37% of covered workers in an HDHP with an HRA and 26% of covered workers in an HSA-qualified HDHP receive account contributions that, if applied to their deductible, would reduce the deductible to $1,000 or less [Figure 7.17].
  • If we reduce the deductibles by employer account contributions, the percentage of covered workers with a deductible of $1,000 or more would be reduced from 58% to 48% [Figures 7.13 and 7.14].
Figure 7.10: Average General Annual Deductibles for Single Coverage, 2006-2018

Figure 7.10: Average General Annual Deductibles for Single Coverage, 2006-2018

Figure 7.11: Average General Annual Deductible for Single Coverage, by Firm Size, 2006-2018

Figure 7.11: Average General Annual Deductible for Single Coverage, by Firm Size, 2006-2018

Figure 7.12: Percentage of Covered Workers Enrolled In a Plan With a High General Annual Deductible for Single Coverage, by Firm Size, 2018

Figure 7.12: Percentage of Covered Workers Enrolled In a Plan With a High General Annual Deductible for Single Coverage, by Firm Size, 2018

Figure 7.13: Percentage of Covered Workers Enrolled In a Plan With a General Annual Deductible of $1,000 or More for Single Coverage, by Firm Size, 2009-2018

Figure 7.13: Percentage of Covered Workers Enrolled In a Plan With a General Annual Deductible of $1,000 or More for Single Coverage, by Firm Size, 2009-2018

Figure 7.14: Percentage of Covered Workers Enrolled In a Plan With a General Annual Deductible of $1,000 or More for Single Coverage, Reduced by Any HRA/HSA Contributions, by Firm Size, 2009-2018

Figure 7.14: Percentage of Covered Workers Enrolled In a Plan With a General Annual Deductible of $1,000 or More for Single Coverage, Reduced by Any HRA/HSA Contributions, by Firm Size, 2009-2018

Figure 7.15: Percentage of Covered Workers Enrolled In a Plan With a General Annual Deductible of $2,000 or More for Single Coverage, by Firm Size, 2009-2018

Figure 7.15: Percentage of Covered Workers Enrolled In a Plan With a General Annual Deductible of $2,000 or More for Single Coverage, by Firm Size, 2009-2018

Figure 7.16: Percentage of Covered Workers Enrolled In a Plan With a General Annual Deductible of $2,000 or More for Single Coverage, Reduced by Any HRA/HSA Contributions, by Firm Size, 2009-2018

Figure 7.16: Percentage of Covered Workers Enrolled In a Plan With a General Annual Deductible of $2,000 or More for Single Coverage, Reduced by Any HRA/HSA Contributions, by Firm Size, 2009-2018

Figure 7.17: Among Covered Workers With a General Annual Deductible, Average General Annual Deductibles for Single Coverage, Reduced by Any HRA/HSA Contributions, by Plan Type and Firm Size, 2018

Figure 7.17: Among Covered Workers With a General Annual Deductible, Average General Annual Deductibles for Single Coverage, Reduced by Any HRA/HSA Contributions, by Plan Type and Firm Size, 2018

Figure 7.18: Among Covered Workers With a General Annual Deductible, Distribution of General Annual Deductibles for Single Coverage, Reduced by Any HRA/HSA Contributions, 2007-2018

Figure 7.18: Among Covered Workers With a General Annual Deductible, Distribution of General Annual Deductibles for Single Coverage, Reduced by Any HRA/HSA Contributions, 2007-2018

Figure 7.19: Among Covered Workers With a General Annual Deductible for Single Coverage, Distribution of Deductibles, 2007-2018

Figure 7.19: Among Covered Workers With a General Annual Deductible for Single Coverage, Distribution of Deductibles, 2007-2018

Figure 7.20: Distribution of General Annual Deductibles for Single Coverage, by Plan Type, 2018

Figure 7.20: Distribution of General Annual Deductibles for Single Coverage, by Plan Type, 2018

GENERAL ANNUAL DEDUCTIBLES FOR WORKERS ENROLLED IN FAMILY COVERGE

Family deductibles are structured in two ways: (1) with an aggregate family deductible, the out-of-pocket expenses of all family members count against a specified family deductible amount, and the deductible is considered met when the combined family expenses exceeds the deductible amount; (2) with a separate per-person family deductible, each family member is subject to a specified deductible amount before the plan covers expenses for that member, although many plans consider the deductible for all family members met once a specified number (typically two or three) of family members meet their specified deductible.21

  • In most plan types, relatively few covered workers are in plans without a general annual deductible for family coverage: 12% of covered workers in PPOs, and 24% of covered workers in POS plans. As defined, all covered workers in HDHP/SOs have a general annual deductible for family coverage [Figure 7.21].
  • Among covered workers enrolled in family coverage, the percentages of covered workers in a plan with an aggregate general annual deductible are 25% for workers in HMOs; 53% for workers in PPOs; 65% for workers in POS plans; and 75% for workers in HDHP/SOs [Figure 7.21].
  • The average deductible amounts for covered workers in plans with an aggregate annual deductible for family coverage are $2,317 for HMOs; $3,000 for PPOs; $3,497 for POS plans; and $4,676 for HDHP/SOs [Figure 7.22]. Deductible amounts for aggregate family deductibles are similar to last year for plan types other than PPOs.
  • For covered workers in plans with an aggregate deductible for family coverage, the average annual family deductibles in small firms are higher than the average annual family deductibles in large firms for covered workers in HMOs, PPOs, and HDHP/SOs [Figure 7.22].
  • Among covered workers enrolled in family coverage, the percentages of covered workers in plans with a separate per-person annual deductible for family coverage are 30% for workers in HMOs; 35% for workers in PPOs; 11% for workers in POS plans; and 25% for workers in HDHP/SOs [Figure 7.21].
  • The average deductible amounts for covered workers in plans with separate per-person annual deductibles for family coverage are $691 for HMOs; $1,005 for PPOs; $1,864 for POS plans; and $2,560 for HDHP/SOs [Figure 7.22].
  • Most covered workers in plans with a separate per-person annual deductible for family coverage have a limit for the number of family members required to meet the separate deductible amounts [Figure 7.25]. Among those covered workers in plans with a limit on the number of family members, the most frequent number of family members required to meet the separate per-person deductible is two [Figure 7.26].
Figure 7.21: Distribution of Type of General Annual Deductible for Covered Workers With Family Coverage, by Plan Type and Firm Size, 2018

Figure 7.21: Distribution of Type of General Annual Deductible for Covered Workers With Family Coverage, by Plan Type and Firm Size, 2018

Figure 7.22: Among Covered Workers With a General Annual Deductible, Average Deductibles for Family Coverage, by Deductible Type, Plan Type, and Firm Size, 2018

Figure 7.22: Among Covered Workers With a General Annual Deductible, Average Deductibles for Family Coverage, by Deductible Type, Plan Type, and Firm Size, 2018

Figure 7.23: Among Covered Workers With a Separate Per-Person General Annual Deductible for Family Coverage, Distribution of Deductibles, by Plan Type, 2018

Figure 7.23: Among Covered Workers With a Separate Per-Person General Annual Deductible for Family Coverage, Distribution of Deductibles, by Plan Type, 2018

Figure 7.24: Among Covered Workers With an Aggregate General Annual Deductible for Family Coverage, Distribution of Deductibles, by Plan Type, 2018

Figure 7.24: Among Covered Workers With an Aggregate General Annual Deductible for Family Coverage, Distribution of Deductibles, by Plan Type, 2018

Figure 7.25: Among Covered Workers With a Separate Per-Person General Annual Deductible for Family Coverage, Structure of Deductible Limits, by Plan Type, 2018

Figure 7.25: Among Covered Workers With a Separate Per-Person General Annual Deductible for Family Coverage, Structure of Deductible Limits, by Plan Type, 2018

Figure 7.26: Among Covered Workers With a Separate Per-Person General Annual Deductible for Family Coverage and a Per-Person Limit, Distribution of Maximum Number of Family Members Required to Meet the Deductible, by Plan Type, 2018

Figure 7.26: Among Covered Workers With a Separate Per-Person General Annual Deductible for Family Coverage and a Per-Person Limit, Distribution of Maximum Number of Family Members Required to Meet the Deductible, by Plan Type, 2018

Figure 7.27: Among Covered Workers With an Aggregate General Annual Deductible for Family Coverage, Distribution of Aggregate Deductibles, by Plan Type, 2013 and 2018

Figure 7.27: Among Covered Workers With an Aggregate General Annual Deductible for Family Coverage, Distribution of Aggregate Deductibles, by Plan Type, 2013 and 2018

CHARACTERISTICS OF GENERAL ANNUAL DEDUCTIBLES

  • The majority of covered workers with a general annual deductible are in plans where the deductible does not have to be met before certain services, such as physician office visits or prescription drugs, are covered.
  • Large majorities of covered workers (80% in HMOs, 75% in PPOs, 74% in POS plans, and 44% in HDHP/HRAs) that are enrolled in plans with general annual deductibles are in plans where the deductible does not have to be met before physician office visits for primary care are covered [Figure 7.28].
  • Similarly, among workers with a general annual deductible, large shares of covered workers in HMOs (95%), PPOs (92%), POS plans (91%), and HDHP/HRAs (83%) are enrolled in plans where the general annual deductible does not have to be met before prescription drugs are covered [Figure 7.28].
Figure 7.28: Among Covered Workers With a General Annual Deductible, Percentage With Coverage for the Following Services Without Having to First Meet the Deductible, by Plan Type, 2018

Figure 7.28: Among Covered Workers With a General Annual Deductible, Percentage With Coverage for the Following Services Without Having to First Meet the Deductible, by Plan Type, 2018

HOSPITAL ADMISSIONS AND OUTPATIENT SURGERY

  • Whether or not a worker has a general annual deductible, most workers face additional types of cost sharing (such as a copayment, coinsurance, or a per diem charge) when admitted to a hospital or having outpatient surgery. The distribution of workers with cost sharing for hospital admissions or outpatient surgery does not equal 100%, as workers may face a complex combination of types of cost sharing. For this reason, the average copayment and coinsurance rates include workers who may have a combination of these types of cost sharing.
  • Beginning in 2017, to reduce the burden on respondents, we revised the survey to ask about cost sharing for hospital admissions and outpatient surgery only for their largest health plan type; previously, we asked for this information for each of the plan types that they offered.
  • For hospital admissions, 68% of covered workers have coinsurance and 11% have a copayment. Lower percentages of workers have per day (per diem) payments (5%), a separate hospital deductible (1%), or both a copayment and coinsurance (9%), while 16% have no additional cost sharing for hospital admissions after any general annual deductible has been met [Figure 7.29].
  • For covered workers in HMO, copayments are more common (38%) and coinsurance (24%) is less common than the average for all covered workers [Figures 7.29 and 7.31].
  • HDHP/SOs, on average, have a different cost-sharing structure than other plan types for hospital admissions. Only 2% of covered workers in HDHP/SOs have a copayment for hospital admissions, lower than the average for all covered workers [Figure 7.29].
  • The average coinsurance rate for a hospital admission is 19%, the average copayment is $284 per hospital admission, and the average per diem charge is $327 [Figure 7.32]. Ninety-two percent of workers enrolled in a plan with a per diem for hospital admissions have a limit on the number of days a worker must pay the amount [Figure 7.33].
  • The cost-sharing provisions for outpatient surgery are similar to those for hospital admissions, as most workers have coinsurance or copayments. In 2018, 14% of covered workers have a copayment and 69% have coinsurance for outpatient surgery. In addition, 5% have both a copayment and coinsurance, while 16% have no additional cost sharing after any general annual deductible has been met [Figures 7.30 and 7.31].
  • For covered workers with cost sharing for outpatient surgery, the average coinsurance rate is 19% and the average copayment is $151 [Figure 7.32].
Figure 7.29: Distribution of Covered Workers With Other Cost Sharing for Hospital Admissions, In Addition to Any General Annual Deductible, by Plan Type, 2018

Figure 7.29: Distribution of Covered Workers With Other Cost Sharing for Hospital Admissions, In Addition to Any General Annual Deductible, by Plan Type, 2018

Figure 7.30: Distribution of Covered Workers With Other Cost Sharing for Outpatient Surgery, In Addition to Any General Annual Deductible, by Plan Type, 2018

Figure 7.30: Distribution of Covered Workers With Other Cost Sharing for Outpatient Surgery, In Addition to Any General Annual Deductible, by Plan Type, 2018

Figure 7.31: Percentage of Covered Workers With the Following Types of Cost Sharing for Hospital Admissions and Outpatient Surgery, In Addition to Any General Annual Deductible, 2018

Figure 7.31: Percentage of Covered Workers With the Following Types of Cost Sharing for Hospital Admissions and Outpatient Surgery, In Addition to Any General Annual Deductible, 2018

Figure 7.32: Among Covered Workers With Separate Cost Sharing for Hospital Admissions or Outpatient Surgery, Average Cost Sharing, by Type, 2018

Figure 7.32: Among Covered Workers With Separate Cost Sharing for Hospital Admissions or Outpatient Surgery, Average Cost Sharing, by Type, 2018

Figure 7.33: Among Covered Workers With a Charge Per Day for Hospital Admissions, Average Cost Sharing Features, 2018

Figure 7.33: Among Covered Workers With a Charge Per Day for Hospital Admissions, Average Cost Sharing Features, 2018

Figure 7.34: Among Covered Workers With a Copayment for Hospital Admissions or Outpatient Surgery, Distribution of Copayments, 2018

Figure 7.34: Among Covered Workers With a Copayment for Hospital Admissions or Outpatient Surgery, Distribution of Copayments, 2018

Figure 7.35: Among Covered Workers With Coinsurance for Hospital Admissions or Outpatient Surgery, Distribution of Coinsurance Rates, 2018

Figure 7.35: Among Covered Workers With Coinsurance for Hospital Admissions or Outpatient Surgery, Distribution of Coinsurance Rates, 2018

COST SHARING FOR PHYSICIAN OFFICE VISITS

  • The majority of covered workers are enrolled in health plans that require cost sharing for an in-network physician office visit, in addition to any general annual deductible.22
  • The most common form of physician office visit cost sharing for in-network services is a copayment. Sixty-six percent of covered workers have a copayment for a primary care physician office visit and 24% have coinsurance. For office visits with a specialty physician, 64% of covered workers have a copayment and 27% have coinsurance [Figure 7.36].
  • Over the past five years, the percentage of covered workers with coinsurance for office visits with a specialist has risen from 20% to 27%.
  • Covered workers in HMOs, PPOs, and POS plans are much more likely to have copayments for both primary care and specialty care physician office visits than workers in HDHP/SOs. For primary care physician office visits, 62% of covered workers in HDHP/SOs have coinsurance, 20% have no cost sharing after the general annual plan deductible is met, and 16% have a copayment [Figure 7.36].
  • Among covered workers with a copayment for in-network physician office visits, the average copayment is $25 for primary care and $40 for specialty physician office visits [Figure 7.37], similar to the amounts last year.
  • Among covered workers with coinsurance for in-network physician office visits, the average coinsurance rates are 18% for a visit with a primary care physician and 18% for a visit with a specialist [Figure 7.37], similar to the rates last year.
Figure 7.36: Percentage of Covered Workers With the Following Types of Cost Sharing for Physician Office Visits, by Plan Type, 2018

Figure 7.36: Percentage of Covered Workers With the Following Types of Cost Sharing for Physician Office Visits, by Plan Type, 2018

Figure 7.37: Among Covered Workers With Copayments And/Or Coinsurance for Physician Office Visits, Average Copayments and Coinsurance, by Plan Type, 2018

Figure 7.37: Among Covered Workers With Copayments And/Or Coinsurance for Physician Office Visits, Average Copayments and Coinsurance, by Plan Type, 2018

Figure 7.38: Among Covered Workers With a Copayment for a Primary Care Physician Office Visit, Distribution of Copayments, by Plan Type, 2018

Figure 7.38: Among Covered Workers With a Copayment for a Primary Care Physician Office Visit, Distribution of Copayments, by Plan Type, 2018

Figure 7.39: Among Covered Workers With a Copayment for a Specialist Physician Office Visit, Distribution of Copayments, by Plan Type, 2018

Figure 7.39: Among Covered Workers With a Copayment for a Specialist Physician Office Visit, Distribution of Copayments, by Plan Type, 2018

Figure 7.40: Among Covered Workers With a Copayment for a Primary Care Physician Office Visit, Distribution of Copayments, 2006-2018

Figure 7.40: Among Covered Workers With a Copayment for a Primary Care Physician Office Visit, Distribution of Copayments, 2006-2018

Figure 7.41: Among Covered Workers With a Copayment for a Specialist Physician Office Visit, Distribution of Copayments, 2006-2018

Figure 7.41: Among Covered Workers With a Copayment for a Specialist Physician Office Visit, Distribution of Copayments, 2006-2018

Figure 7.42: Among Covered Workers With a Copayment And/Or Coinsurance for Physician Office Visits, Average Copayment and Coinsurance, 2006-2018

Figure 7.42: Among Covered Workers With a Copayment And/Or Coinsurance for Physician Office Visits, Average Copayment and Coinsurance, 2006-2018

OUT-OF-POCKET MAXIMUMS

  • Most covered workers are in a plan that partially or totally limits the cost sharing that an enrollee must pay in a year. This limit is generally referred to as an out-of-pocket maximum. The Affordable Care Act (ACA) requires that non-grandfathered health plans have an out-of-pocket maximum of no more than $7,350 for single coverage and $14,700 for family coverage in 2018.23 Many plans have complex out-of-pocket structures, which makes it difficult to accurately collect information on this element of plan design.
  • In 2018, 99% of covered workers are in a plan with an out-of-pocket maximum for single coverage. This is a significant increase from 88% in 2013 [Figure 7.43].
  • For covered workers in plans with an out-of-pocket maximum for single coverage, there is wide variation in spending limits.
  • Fourteen percent of covered workers in plans with an out-of-pocket maximum for single coverage have an out-of-pocket maximum of less than $2,000, while 20% have an out-of-pocket maximum of $6,000 or more [Figure 7.45].
Figure 7.43: Percentage of Covered Workers In a Plan With an Out-Of-Pocket Maximum for Single Coverage, 2009-2018

Figure 7.43: Percentage of Covered Workers In a Plan With an Out-Of-Pocket Maximum for Single Coverage, 2009-2018

Figure 7.44: Percentage of Covered Workers In a Plan With an Out-Of-Pocket Maximum Above Certain Thresholds for Single Coverage, 2009-2018

Figure 7.44: Percentage of Covered Workers In a Plan With an Out-Of-Pocket Maximum Above Certain Thresholds for Single Coverage, 2009-2018

Figure 7.45: Among Covered Workers With an Out-Of-Pocket Maximum for Single Coverage, Distribution of Out-Of-Pocket Maximums, by Plan Type, 2018

Figure 7.45: Among Covered Workers With an Out-Of-Pocket Maximum for Single Coverage, Distribution of Out-Of-Pocket Maximums, by Plan Type, 2018

Figure 7.46: Among Covered Workers With an Out-Of-Pocket Maximum for Single Coverage, Average Out-Of-Pocket Maximums, by Firm Size, 2018

Figure 7.46: Among Covered Workers With an Out-Of-Pocket Maximum for Single Coverage, Average Out-Of-Pocket Maximums, by Firm Size, 2018


  1. Some workers with separate per-person deductibles or out-of-pocket maximums for family coverage do not have a specific number of family members that are required to meet the deductible amount and instead have another type of limit, such as a per-person amount with a total dollar amount limit. These responses are included in the averages and distributions for separate family deductibles and out-of-pocket maximums.
  2. Starting in 2010, the survey asked about the prevalence and cost of physician office visits separately for primary care and specialty care. Prior to the 2010 survey, if the respondent indicated the plan had a copayment for office visits, we assumed the plan had a copayment for both primary and specialty care visits. The survey did not allow for a respondent to report that a plan had a copayment for primary care visits and coinsurance for visits with a specialist physician. The changes made in 2010 allow for variations in the type of cost sharing for primary care and specialty care visits. The survey includes cost sharing for in-network services only.
  3. See https://www.federalregister.gov/d/2016-30433/p-846. For those enrolled in an HDHP/HSA, the out-of-pocket maximum may be no more than $6,650 for an individual plan and $13,300 for a family plan in 2018. See https://www.irs.gov/pub/irs-drop/rp-17-37.pdf

Section Eight: High-deductible Health Plans With Savings Option

To help cover out-of-pocket expenses not covered by a health plan, some firms offer high deductible plans that are paired with an account that allows enrollees to use tax-preferred funds to pay plan cost sharing and other out-of-pocket medical expenses. The two most common are health reimbursement arrangements (HRAs) and health savings accounts (HSAs). HRAs and HSAs are financial accounts that workers or their family members can use to pay for health care services. These savings arrangements are often (or, in the case of HSAs, always) paired with health plans with high deductibles. The survey treats high-deductible plans paired with a savings option as a distinct plan type – High-Deductible Health Plan with Savings Option (HDHP/SO) – even if the plan would otherwise be considered a PPO, HMO, POS plan, or conventional health plan. Specifically for the survey, HDHP/SOs are defined as (1) health plans with a deductible of at least $1,000 for single coverage and $2,000 for family coverage24 offered with an HRA (referred to as HDHP/HRAs); or (2) high-deductible health plans that meet the federal legal requirements to permit an enrollee to establish and contribute to an HSA (referred to as HSA-qualified HDHPs).25

PERCENTAGE OF FIRMS OFFERING HDHP/HRAS AND HSA-QUALIFIED HDHPS

  • Twenty-nine percent of firms offering health benefits offer an HDHP/HRA, an HSA-qualified HDHP, or both. Among firms offering health benefits, 7% offer an HDHP/HRA and 22% offer an HSA-qualified HDHP [Figure 8.1]. The percentage of firms offering an HDHP/SO is similar to last year.
  • Large firms (200 or more workers) are more likely than small firms (3-199 workers) to offer an HDHP/SO (58% vs. 27%) [Figure 8.3].
Figure 8.1: Among Firms Offering Health Benefits, Percentage That Offer an HDHP/HRA And/Or an HSA-Qualified HDHP, 2005-2018

Figure 8.1: Among Firms Offering Health Benefits, Percentage That Offer an HDHP/HRA And/Or an HSA-Qualified HDHP, 2005-2018

Figure 8.2: Among Firms Offering Health Benefits, Percentage That Offer an HDHP/SO, by Firm Size, 2005-2018

Figure 8.2: Among Firms Offering Health Benefits, Percentage That Offer an HDHP/SO, by Firm Size, 2005-2018

Figure 8.3: Among Firms Offering Health Benefits, Percentage That Offer an HDHP/HRA And/Or an HSA-Qualified HDHP, by Firm Size, 2018

Figure 8.3: Among Firms Offering Health Benefits, Percentage That Offer an HDHP/HRA And/Or an HSA-Qualified HDHP, by Firm Size, 2018

ENROLLMENT IN HDHP/HRAS AND HSA-QUALIFIED HDHPS

  • Twenty-nine percent of covered workers are enrolled in an HDHP/SO in 2018 [Figure 8.5].
  • Enrollment in HDHP/SOs has increased over the past five years, from 20% of covered workers in 2013 to 29% in 2018 [Figure 8.5].
  • Ten percent of covered workers are enrolled in HDHP/HRAs and 19% of covered workers are enrolled in HSA-qualified HDHPs in 2018. These percentages are similar to the percentages last year [Figure 8.5].
  • The percentage of covered workers enrolled in HDHP/SOs is the same in small firms and large firms (29%) [Figure 8.6].
Figure 8.4: Percentage of Covered Workers Enrolled In an HDHP/SO, by Firm Size, 2006-2018

Figure 8.4: Percentage of Covered Workers Enrolled In an HDHP/SO, by Firm Size, 2006-2018

Figure 8.5: Percentage of Covered Workers Enrolled In an HDHP/HRA or HSA-Qualified HDHP, 2006-2018

Figure 8.5: Percentage of Covered Workers Enrolled In an HDHP/HRA or HSA-Qualified HDHP, 2006-2018

Figure 8.6: Percentage of Covered Workers Enrolled In an HDHP/HRA or HSA-Qualified HDHP, by Firm Size, 2018

Figure 8.6: Percentage of Covered Workers Enrolled In an HDHP/HRA or HSA-Qualified HDHP, by Firm Size, 2018

PREMIUMS AND WORKER CONTRIBUTIONS

  • In 2018, the average annual premiums for covered workers in HDHP/HRAs are $6,791 for single coverage and $19,527 for family coverage [Figure 8.7].
  • The average annual premiums for workers in HSA-qualified HDHPs are $6,272 for single coverage and $18,054 for family coverage. These amounts are significantly less than the average single and family premium for covered workers in plans that are not HDHP/SOs [Figure 8.8].
  • The average single and family coverage premiums for covered workers enrolled in HSA-qualified HDHPs are lower than the premiums for covered workers enrolled in HDHP/HRAs.
  • The average annual worker contributions to premiums for workers enrolled in HDHP/HRAs are $1,142 for single coverage and $4,665 for family coverage [Figure 8.7]. The average contribution for family coverage for covered workers in HDHP/HRAs is significantly less than the average premium contribution made by covered workers in plans that are not HDHP/SOs [Figure 8.8].
  • The average annual worker contributions to premiums for workers in HSA-qualified HDHPs are $1,024 for single coverage and $4,626 for family coverage. The average contributions for single and family coverage for covered workers in HSA-qualified HDHPs are significantly less than the average premium contribution made by covered workers in plans that are not HDHP/SOs [Figure 8.8].
Figure 8.7: HDHP/HRA and HSA-Qualified HDHP Features for Covered Workers, 2018

Figure 8.7: HDHP/HRA and HSA-Qualified HDHP Features for Covered Workers, 2018

Figure 8.8: Average Annual Premiums and Contributions to Savings Accounts for Covered Workers In HDHP/HRAs or HSA-Qualified HDHPs, Compared to Non-HDHP/SOs, 2018

Figure 8.8: Average Annual Premiums and Contributions to Savings Accounts for Covered Workers In HDHP/HRAs or HSA-Qualified HDHPs, Compared to Non-HDHP/SOs, 2018

Figure 8.9: Average Annual Premiums and Contributions for Covered Workers In HDHP/SOs and Non-HDHP/SOs, for Family Coverage, 2018

Figure 8.9: Average Annual Premiums and Contributions for Covered Workers In HDHP/SOs and Non-HDHP/SOs, for Family Coverage, 2018

Figure 8.10: Total Annual Costs (Premiums and Account Contributions) for Covered Workers In HDHP/SOs, for Family Coverage, by Firm Size, 2018

Figure 8.10: Total Annual Costs (Premiums and Account Contributions) for Covered Workers In HDHP/SOs, for Family Coverage, by Firm Size, 2018

Figure 8.11: Average Annual Premiums for Covered Workers With Family Coverage, by Plan Type, 2007-2018

Figure 8.11: Average Annual Premiums for Covered Workers With Family Coverage, by Plan Type, 2007-2018

Figure 8.12: Average Annual Premiums for Covered Workers With Single Coverage, by Plan Type, 2007-2018

Figure 8.12: Average Annual Premiums for Covered Workers With Single Coverage, by Plan Type, 2007-2018

OUT-OF-POCKET MAXIMUMS AND PLAN DEDUCTIBLES

  • HSA-qualified HDHPs are legally required to have an annual out-of-pocket maximum of no more than $6,650 for single coverage and $13,300 for family coverage in 2018. Non-grandfathered HDHP/HRA plans are required to have out-of-pocket maximums of no more than $7,350 for single coverage and $14,700 for family coverage in 2018.26 Virtually all HDHP/HRA plans have an out-of-pocket maximum for single coverage in 2018.
  • The average annual out-of-pocket maximum for single coverage is $4,563 for HDHP/HRAs and $4,297 for HSA-qualified HDHPs [Figure 8.7].
  • As expected, workers enrolled in HDHP/SOs have higher deductibles than workers enrolled in HMOs, PPOs, or POS plans.
  • The average general annual deductible for single coverage is $2,245 for HDHP/HRAs and $2,447 for HSA-qualified HDHPs [Figure 8.14]. These averages are similar to the amounts reported in recent years. There is wide variation around these averages: 45% of covered workers enrolled in an HDHP/SO are in a plan with a deductible of $1,000 to $1,999 while 24% are in a plan with a deductible of $3,000 or more [Figure 8.13].
  • The survey asks firms whether the family deductible amount is (1) an aggregate amount (i.e., the out-of-pocket expenses of all family members are counted until the deductible is satisfied), or (2) a per-person amount that applies to each family member (typically with a limit on the number of family members that would be required to meet the deductible amount) (see Section 7 for more information).
  • The average aggregate deductibles for workers with family coverage are $4,329 for HDHP/HRAs and $4,883 for HSA-qualified HDHPs [Figure 8.7]. As with single coverage, there is wide variation around these averages for family coverage: 14% of covered workers enrolled in HDHP/SOs with an aggregate family deductible have a deductible of $2,000 to $2,999 while 23% have a deductible of $6,000 dollars or more [Figure 8.16].
Figure 8.13: Distribution of Covered Workers In HDHP/SOs With the Following General Annual Deductibles for Single Coverage, by Firm Size, 2018

Figure 8.13: Distribution of Covered Workers In HDHP/SOs With the Following General Annual Deductibles for Single Coverage, by Firm Size, 2018

Figure 8.14: General Annual Deductible for Workers In HDHP/SOs After Any Employer Account Contributions for Single Coverage, by Firm Size, 2018

Figure 8.14: General Annual Deductible for Workers In HDHP/SOs After Any Employer Account Contributions for Single Coverage, by Firm Size, 2018

Figure 8.15: Among Covered Workers With a General Annual Deductible, Average Deductibles for Workers In Non-HDHP/SOs Compared to HDHP/SOs Before and After Any Employer Account Contributions, for Single Coverage, 2007-2018

Figure 8.15: Among Covered Workers With a General Annual Deductible, Average Deductibles for Workers In Non-HDHP/SOs Compared to HDHP/SOs Before and After Any Employer Account Contributions, for Single Coverage, 2007-2018

Figure 8.16: Distribution of Covered Workers In HDHP/SOs With the Following Aggregate Family Deductibles, 2018

Figure 8.16: Distribution of Covered Workers In HDHP/SOs With the Following Aggregate Family Deductibles, 2018

EMPLOYER ACCOUNT CONTRIBUTIONS

  • Employers contribute to HDHP/SOs in two ways: through their contributions toward the premium for the health plan and through their contributions (if any, in the case of HSAs) to the savings account option (i.e., the HRAs or HSAs themselves).
  • Looking at only the annual employer contributions to premiums, covered workers in HDHP/HRAs on average receive employer contributions of $5,648 for single coverage and $14,862 for family coverage [Figure 8.8]. These amounts are similar to the contribution amounts last year.
  • The average annual employer contributions to premiums for workers in HSA-qualified HDHPs are $5,248 for single coverage and $13,428 for family coverage, higher than the contribution amounts last year. The average employer contribution for covered workers in HSA-qualified HDHPs for single coverage is lower than the average contribution for covered workers in plans that are not HDHP/SOs [Figure 8.8].
  • Looking at employer contributions to the savings options, covered workers enrolled in HDHP/HRAs on average receive an annual employer contribution to their HRA of $1,149 for single coverage and $2,288 for family coverage [Figure 8.8].
  • HRAs are generally structured in such a way that employers may not actually spend the whole amount that they make available to their employees’ HRAs.27 Amounts committed to an employee’s HRA that are not used by the employee generally roll over and can be used in future years, but any balance may revert back to the employer if the employee leaves his or her job. Thus, the employer contribution amounts to HRAs that we capture in the survey may exceed the amount that employers will actually spend.
  • Covered workers enrolled in HSA-qualified HDHPs on average receive an annual employer contribution to their HSA of $603 for single coverage and $1,073 for family coverage [Figure 8.8 and 8.21]. These amounts do not include the 2% of covered workers in HSA-qualified HDHPs whose employers say they vary account contributions based on certain factors, such as job classification or participation in a wellness program [Figure 8.19].
  • In many cases, employers that sponsor HSA-qualified HDHP/SOs do not make contributions to HSAs established by their employees. Forty percent of employers offering single coverage and 39% offering family coverage through HSA-qualified HDHPs do not make contributions toward the HSAs that their workers establish. For both single and family coverage, 23% of workers in an HSA-qualified HDHP do not receive an account contribution from their employer [Figures 8.17 and 8.18].
  • The average HSA contributions reported above include the portion of covered workers whose employer contribution to the HSA is zero. When those firms that do not contribute to the HSA are excluded from the calculation, the average employer contribution for covered workers is $790 for single coverage and $1,406 for family coverage.
  • The percentage of covered workers enrolled in a plan where the employer makes no HSA contribution (23% for both single and family coverage) is similar to the percentages in recent years [Figure 8.21].
  • There is considerable variation in the amount that employers contribute to savings accounts.
  • Fifty-nine percent of covered workers in an HDHP/HRA receive an annual HRA contribution of less than $800 for single coverage, while 20% receive an annual HRA contribution of $1,600 or more [Figure 8.17].
  • Thirty-seven percent of covered workers in an HSA-qualified HDHP receive an annual HSA contribution of less than $400 for single coverage, including 23% that receive no HSA contribution from their employer [Figure 8.17]. In contrast, 14% of covered workers in an HSA-qualified HDHP receive an annual HSA contribution of $1,200 or more. One percent of covered workers with an employer that matches any HSA contribution for single coverage .
  • Employer contributions to savings account options (i.e., the HRAs and HSAs themselves) for their workers can be added to their health plan premium contributions to calculate total employer contributions toward HDHP/SOs. We note that HRAs are a promise by an employer to pay up to a specified amount and that many employees will not receive the full amount of their HRA in a year, so adding the employer premium contribution amount and the HRA contribution represents an upper bound for employer liability that overstates the amount that is actually expended. Since employer contributions to employee HSAs immediately transfer the full amount to the employee, adding employer premium and HSA contributions is an instructive way to look at their total liability under these plans.
  • For HDHP/HRAs, the average annual total employer contribution for covered workers is $6,797 for single coverage and $17,150 for family coverage. The average total employer contributions for covered workers for single coverage and family coverage in HDHP/HRAs are higher than the average firm contributions toward single and family coverage in plans that are not HDHP/SOs [Figure 8.8].
  • For HSA-qualified HDHPs, the average total annual firm contribution for covered workers is $5,858 for single coverage and $14,503 for workers with family coverage. The average total firm contribution amounts for single and family coverage in HSA-qualified HDHPs are similar to the average firm contributions toward single and family coverage in health plans that are not HDHP/SOs [Figure 8.8].
Figure 8.17: Distribution of Covered Workers With the Following Annual Employer Contributions to Their HRA or HSA, for Single Coverage, 2018

Figure 8.17: Distribution of Covered Workers With the Following Annual Employer Contributions to Their HRA or HSA, for Single Coverage, 2018

Figure 8.18: Distribution of Covered Workers With the Following Annual Employer Contributions to Their HRA or HSA, for Family Coverage, 2018

Figure 8.18: Distribution of Covered Workers With the Following Annual Employer Contributions to Their HRA or HSA, for Family Coverage, 2018

Figure 8.19: Among Firms Offering Family Coverage and an HSA-Qualified HDHP, Percentage of Firms That Vary Their HSA Contribution On Various Factors, by Firm Size, 2018

Figure 8.19: Among Firms Offering Family Coverage and an HSA-Qualified HDHP, Percentage of Firms That Vary Their HSA Contribution On Various Factors, by Firm Size, 2018

Figure 8.20: Among Firms Making a Monthly Contribution to an HSA-Qualified HDHP, Percentage of Firms That Contribute to the HSA Through a Section 125 Cafeteria Plan, by Firm Size, 2018

Figure 8.20: Among Firms Making a Monthly Contribution to an HSA-Qualified HDHP, Percentage of Firms That Contribute to the HSA Through a Section 125 Cafeteria Plan, by Firm Size, 2018

Figure 8.21: Average Annual Employer Contributions to HSA Accounts for Covered Workers Enrolled In an HSA-Qualified HDHP, 2009-2018

Figure 8.21: Average Annual Employer Contributions to HSA Accounts for Covered Workers Enrolled In an HSA-Qualified HDHP, 2009-2018

Figure 8.22: Average Annual Employer HSA and HRA Contributions, 2018

Figure 8.22: Average Annual Employer HSA and HRA Contributions, 2018

COST SHARING FOR OFFICE VISITS

  • The cost-sharing pattern for primary care office visits differs for workers enrolled in HDHP/SOs. Thirty-five percent of covered workers in HDHP/HRAs have a copayment for primary care physician office visits compared to 6% enrolled in HSA-qualified HDHPs [Figure 8.23]. Workers in other plan types are much more likely to face copayments than coinsurance for physician office visits (see Section 7 for more information).
Figure 8.23: Distribution of Covered Workers In HDHP/HRAs and HSA-Qualified HDHPs With the Following Types of Cost Sharing In Addition to the General Annual Deductible, 2018

Figure 8.23: Distribution of Covered Workers In HDHP/HRAs and HSA-Qualified HDHPs With the Following Types of Cost Sharing In Addition to the General Annual Deductible, 2018


  1. There is no legal requirement for the minimum deductible in a plan offered with an HRA. The survey defines a high-deductible HRA plan as a plan with a deductible of at least $1,000 for single coverage and $2,000 for family coverage. Federal law requires a deductible of at least $1,350 for single coverage and $2,700 for family coverage for HSA-qualified HDHPs in 2018 (or $1,300 and $2,600, respectively, for plans in their 2017 plan year). Not all firms’ plan years correspond with the calendar year, so some firms may report a plan with limits from the prior year. See the Text Box for more information on HDHP/HRAs and HSA-qualified HDHPs.
  2. The definitions of HDHP/SOs do not include other consumer-driven plan options, such as arrangements that combine an HRA with a lower-deductible health plan or arrangements in which an insurer (rather than the employer as in the case of HRAs or the enrollee as in the case of HSAs) establishes an account for each enrollee. Other arrangements may be included in future surveys as the market evolves.
  3. See https://www.federalregister.gov/d/2016-30433/p-846. For those enrolled in an HDHP/HSA, see https://www.irs.gov/pub/irs-drop/rp-17-37.pdf
  4. The survey asks “Up to what dollar amount does your firm promise to contribute each year to an employee’s HRA or health reimbursement arrangement for single coverage?” We refer to the amount that the employer commits to make available to an HRA as a contribution for ease of discussion. As discussed, HRAs are notional accounts, and employers are not required to actually transfer funds until an employee incurs expenses. Thus, employers may not expend the entire amount that they commit to make available to their employees through an HRA. Some employers may make their HRA contribution contingent on other factors, such as completing wellness programs.
  5. See https://www.federalregister.gov/d/2016-30433/p-846. For those enrolled in an HDHP/HSA, see https://www.irs.gov/pub/irs-drop/rp-17-37.pdf

Section Nine: Prescription Drug Benefits

Almost all covered workers have coverage for prescription drugs. Over the years we have conducted the survey, coverage for prescriptions has become more complex as employers and insurers expanded the use of formularies with multiple cost-sharing tiers as well as other management approaches. Collecting information about these practices is challenging and was burdensome to respondents with multiple plan types. Beginning in 2016, we revised the survey to ask respondents about the attributes of prescription drug coverage only in their largest health plan; previously, we asked about prescription coverage in their largest plan for each of the plan types that they offered.

In addition, because of the significant policy interest in access to and the cost of specialty drugs, in 2016 we also began asking employers to report separately about the cost sharing for tiers that cover only specialty drugs. In cases in which a tier covers only specialty drugs, we report its attributes under the specialty banner, rather than as one of the standard tiers. This entails revising the way we group formulary tiers: for example, a three-tier formulary where the third tier covers exclusively specialty drugs is now considered a two-tier plan with an additional tier. This approach allows us to report on the cost sharing for specialty drugs regardless of the number of tiers in the formulary. For this reason, we are not presenting statistical comparisons of estimates relying on tiers to prior years.29 This change is also discussed more fully in the survey design and methods section.

  • Nearly all (more than 99%) covered workers work at a firm that provides prescription drug coverage in its largest health plan.

DISTRIBUTION OF COST SHARING

  • The majority of covered workers (92%) are in a plan with tiered cost sharing for prescription drugs [Figure 9.1]. Cost-sharing tiers generally refer to a health plan placing a drug on a formulary or preferred drug list that classifies drugs into categories that are subject to different cost sharing or management. It is common for there to be different tiers for generic, preferred and non-preferred drugs. In recent years, plans have created additional tiers that may, for example, be used for specialty drugs or expensive biologics. Some plans may have multiple tiers for different categories; for example, a plan may have preferred and non-preferred specialty tiers. The survey obtains information about the cost-sharing structure for up to five tiers.
  • Eighty-eight percent of covered workers are in a plan with three, four, or more tiers of cost sharing for prescription drugs [Figure 9.1]. These totals include tiers that cover only specialty drugs, even though the cost-sharing information for those tiers is reported separately.
  • HDHP/SOs have a different cost-sharing pattern for prescription drugs than other plan types. Compared to covered workers in other plan types, those in HDHP/SOs are more likely to be in a plan with the same cost sharing regardless of drug type (10% vs. 2%) or in a plan that has no cost sharing for prescriptions once the plan deductible is met (8% vs. 1%) [Figure 9.2].
Figure 9.1: Distribution of Covered Workers Facing Different Cost-Sharing Formulas for Prescription Drug Benefits, by Firm Size, 2018

Figure 9.1: Distribution of Covered Workers Facing Different Cost-Sharing Formulas for Prescription Drug Benefits, by Firm Size, 2018

Figure 9.2: Distribution of Covered Workers Facing Different Cost-Sharing Formulas for Prescription Drug Benefits, by Plan Type, 2018

Figure 9.2: Distribution of Covered Workers Facing Different Cost-Sharing Formulas for Prescription Drug Benefits, by Plan Type, 2018

TIERS NOT EXCLUSIVELY FOR SPECIALTY DRUGS

  • Even when formulary tiers covering only specialty drugs are not counted, a large share (82%) of covered workers are in a plan with three or more tiers of cost sharing for prescription drugs. The cost-sharing statistics presented in this section do not include information about tiers that cover only specialty drugs. In cases in which a plan covers specialty drugs on a tier with other drugs, they will still be included in these averages. Cost-sharing statistics for tiers covering only specialty drugs are presented in the next section.
  • For covered workers in a plan with three or more tiers of cost sharing for prescription drugs, copayments are the most common form of cost sharing in the first four tiers and coinsurance is the next most common [Figure 9.3].
  • Among covered workers in plans with three or more tiers of cost sharing for prescription drugs, the average copayments are $11 for first-tier drugs, $33 second-tier drugs, $59 for third-tier drugs, and $105 for fourth-tier drugs [Figures 9.6 and 9.7].
  • Among covered workers in plans with three or more tiers of cost sharing for prescription drugs, the average coinsurance rates are 19% for first-tier drugs, 26% second-tier drugs, 36% third-tier drugs, and 31% for fourth-tier drugs [Figures 9.6 and 9.7].
  • Eight percent of covered workers are in a plan with two tiers for prescription drug cost sharing (excluding tiers covering only specialty drugs).
  • For these workers, copayments are more common than coinsurance for first-tier drugs [Figure 9.3]. The difference for second-tier drugs is not statistically significant. The average copayment for the first tier is $11 and the average copayment for the second tier is $31 [Figure 9.7].
  • Five percent of covered workers are in a plan with the same cost sharing for prescriptions regardless of the type of drug (excluding tiers covering only specialty drugs).
  • Among these workers, 8% have copayments and 92% have coinsurance [Figure 9.3]. The average coinsurance rate is 20% [Figure 9.7].
  • Six percent of these workers are in a plan that limits coverage for prescriptions to generic drugs [Figure 9.9].
  • Coinsurance rates for prescription drugs often include maximum and/or minimum dollar amounts. Depending on the plan design, coinsurance maximums may significantly limit the amount an enrollee must spend out-of-pocket for higher-cost drugs.
  • These coinsurance minimum and maximum amounts vary across the tiers.
  • For example, among covered workers in a plan with coinsurance for the first cost-sharing tier, 20% have only a maximum dollar amount attached to the coinsurance rate, 6% have only a minimum dollar amount, 20% have both a minimum and maximum dollar amount, and 54% have neither. For those in a plan with coinsurance for the fourth cost-sharing tier, 42% have only a maximum dollar amount attached to the coinsurance rate, <1% have only a minimum dollar amount, 10% have both a minimum and maximum dollar amount, and 48% have neither [Figure 9.8].
Figure 9.3: Among Workers With Prescription Drug Coverage, Distribution of Covered Workers With the Following Types of Cost Sharing for Prescription Drugs, 2018

Figure 9.3: Among Workers With Prescription Drug Coverage, Distribution of Covered Workers With the Following Types of Cost Sharing for Prescription Drugs, 2018

Figure 9.4: Among Workers With Three or More Tiers of Prescription Drug Cost Sharing, Distribution of Covered Workers With the Following Types of Cost Sharing, by Firm Size, 2018

Figure 9.4: Among Workers With Three or More Tiers of Prescription Drug Cost Sharing, Distribution of Covered Workers With the Following Types of Cost Sharing, by Firm Size, 2018

Figure 9.5: Among Covered Workers With Three or More Tiers of Prescription Drug Cost Sharing, Distribution of Covered Workers With the Following Types of Cost Sharing, by Plan Type, 2018

Figure 9.5: Among Covered Workers With Three or More Tiers of Prescription Drug Cost Sharing, Distribution of Covered Workers With the Following Types of Cost Sharing, by Plan Type, 2018

Figure 9.6: Among Covered Workers With Three or More Tiers of Prescription Drug Cost Sharing, Average Copayments and Coinsurance, 2018

Figure 9.6: Among Covered Workers With Three or More Tiers of Prescription Drug Cost Sharing, Average Copayments and Coinsurance, 2018

Figure 9.7: Among Covered Workers With Prescription Drug Coverage, Average Copayments and Coinsurance, 2018

Figure 9.7: Among Covered Workers With Prescription Drug Coverage, Average Copayments and Coinsurance, 2018

Figure 9.8: Distribution of Coinsurance Structures for Covered Workers Facing a Coinsurance for Prescription Drugs, 2018

Figure 9.8: Distribution of Coinsurance Structures for Covered Workers Facing a Coinsurance for Prescription Drugs, 2018

Figure 9.9: Among Covered Workers With Prescription Drug Coverage, Coverage of Generic Drugs by Plan Design, 2018

Figure 9.9: Among Covered Workers With Prescription Drug Coverage, Coverage of Generic Drugs by Plan Design, 2018

SEPARATE TIERS FOR SPECIALTY DRUGS

  • Specialty drugs, such as biologics that may be used to treat chronic conditions, or some cancer drugs, can be quite expensive and often require special handling and administration. We revised our questions beginning with the 2016 survey to obtain more information about formulary tiers that are exclusively for specialty drugs. We are reporting results only among large firms because a relatively large share of small firms were unsure whether their largest plan covered these drugs.
  • Ninety-eight percent of covered workers at large firms have coverage for specialty drugs [Figure 9.10]. Among these workers, 52% are in a plan with at least one cost-sharing tier just for specialty drugs [Figure 9.11].
  • Among covered workers in a plan with a separate tier for specialty drugs, 34% have a copayment for specialty drugs and 59% have coinsurance [Figure 9.12]. The average copayment is $99 and the average coinsurance rate is 26% [Figure 9.13]. Eighty-one percent of those with coinsurance have a maximum dollar limit on the amount of coinsurance they must pay.
Figure 9.10: Among Large Firms With Prescription Drug Coverage, Percentage of Covered Workers Whose Plan With the Largest Enrollment Includes Coverage for Specialty Drugs, by Firm Size, 2018

Figure 9.10: Among Large Firms With Prescription Drug Coverage, Percentage of Covered Workers Whose Plan With the Largest Enrollment Includes Coverage for Specialty Drugs, by Firm Size, 2018

Figure 9.11: Among Large Firms Whose Prescription Drug Coverage Includes Specialty Drugs, Percentage of Covered Workers Enrolled In a Plan That Has a Separate Tier for Specialty Drugs, by Firm Size, 2018

Figure 9.11: Among Large Firms Whose Prescription Drug Coverage Includes Specialty Drugs, Percentage of Covered Workers Enrolled In a Plan That Has a Separate Tier for Specialty Drugs, by Firm Size, 2018

Figure 9.12: Among Covered Workers at Large Firms Enrolled In a Plan With a Separate Tier for Specialty Drugs, Distribution of the Following Types of Cost Sharing, by Firm Size, 2018

Figure 9.12: Among Covered Workers at Large Firms Enrolled In a Plan With a Separate Tier for Specialty Drugs, Distribution of the Following Types of Cost Sharing, by Firm Size, 2018

Figure 9.13: Among Covered Workers at Large Firms Enrolled In a Plan With a Separate Tier for Specialty Drugs, Average Copayments and Coinsurance, by Firm Size, 2018

Figure 9.13: Among Covered Workers at Large Firms Enrolled In a Plan With a Separate Tier for Specialty Drugs, Average Copayments and Coinsurance, by Firm Size, 2018

HSA-QUALIFIED PLANS

  • HSA-qualified plans generally are not permitted to cover services, other than for preventive care, until the plan deductible is met. In this context, many HSA-qualified plans have identified a list of prescription medications that may be considered preventive so that they can be covered prior to the deductible being met. An example are statins, which treat high cholesterol, and are considered to be preventing the complications that can result if high cholesterol levels are not treated.
  • Sixty-eight percent of workers covered by an HSA-qualified plan have coverage for preventive medications before the deductible is met [Figure 9.14]. Among covered workers in HSA-qualified plans, those in firms with 5,000 or more workers are more likely than covered workers in firms of other sizes to have coverage for preventive medications before the deductible is met [Figure 9.14].
Figure 9.14: Among Covered Workers Enrolled In an HSA-Qualified High Deductible Plan, Percentage of Covered Workers Enrolled In a Plan With Coverage for Preventive Drugs Before the General Annual Deductible Is Met, 2018

Figure 9.14: Among Covered Workers Enrolled In an HSA-Qualified High Deductible Plan, Percentage of Covered Workers Enrolled In a Plan With Coverage for Preventive Drugs Before the General Annual Deductible Is Met, 2018


  1. In cases in which a firm indicated that one of their tiers was exclusively for specialty drugs, we reported the cost-sharing structure and any copayment or coinsurance information under the specialty drug banner. Therefore, a firm that has three tiers of cost sharing may only have plan attributes for the generic and preferred tiers.

Section Ten: Plan Funding

Many firms, particularly larger firms, choose to pay for some or all of the health services of their workers directly from their own funds rather than by purchasing health insurance for them. This is called self funding. Both public and private employers use self funding to provide health benefits. Federal law (the Employee Retirement Income Security Act of 1974, or ERISA) exempts self-funded plans established by private employers (but not public employers) from most state insurance laws, including reserve requirements, mandated benefits, premium taxes, and many consumer protection regulations. Sixty-one percent of covered workers are in a self-funded health plan. Self-funding is common among larger firms because they can spread the risk of costly claims over a large number of workers and dependents.

Many firms with self-funded plans also use insurance, often called stoploss coverage, to limit their liability for very large claims or an unexpected level of expenses. Three-fifths of covered workers in fully or partially self-funded plans are in plans with stoploss insurance.

  • Sixty-one percent of covered workers are in a plan that is completely or partially self-funded, similar to last year [Figures 10.1 and 10.2].
  • The percentage of covered workers enrolled in self-funded plans has been stable in recent years across firm sizes [Figure 10.2].
  • As expected, covered workers in large firms are significantly more likely to be in a self-funded plan than covered workers in small firms (81% vs. 13%). The percentage of covered workers in self-funded plans increases as the number of workers in a firm increases. Eighty-seven percent of covered workers in firms with 1,000 to 4,999 workers and 91% of covered workers in firms with 5,000 or more workers are in self-funded plans in 2018 [Figures 10.1 and 10.3].
Figure 10.1: Percentage of Covered Workers Enrolled In a Self-Funded Plan, by Firm Size, 2018

Figure 10.1: Percentage of Covered Workers Enrolled In a Self-Funded Plan, by Firm Size, 2018

Figure 10.2: Percentage of Covered Workers Enrolled In a Self-Funded Plan, by Firm Size, 1999-2018

Figure 10.2: Percentage of Covered Workers Enrolled In a Self-Funded Plan, by Firm Size, 1999-2018

Figure 10.3: Percentage of Covered Workers In a Self-Funded Plan, by Firm Size, Region, and Industry, 2018

Figure 10.3: Percentage of Covered Workers In a Self-Funded Plan, by Firm Size, Region, and Industry, 2018

Figure 10.4: Percentage of Covered Workers Enrolled In a Self-Funded Plan, by Plan Type and Firm Size, 2018

Figure 10.4: Percentage of Covered Workers Enrolled In a Self-Funded Plan, by Plan Type and Firm Size, 2018

Figure 10.5: Percentage of Covered Workers Enrolled In Self-Funded HMO, PPO, and HDHP/SO Plans, by Firm Size, 1999-2018

Figure 10.5: Percentage of Covered Workers Enrolled In Self-Funded HMO, PPO, and HDHP/SO Plans, by Firm Size, 1999-2018

LEVEL-FUNDED PLANS

In the past few years, insurers have begun offering health plans that provide a nominally self-funded option for small or mid-sized employers that incorporates stoploss insurance with relatively low attachment points. Often, the insurer calculates an expected monthly expense for the employer, which includes a share of the estimated annual cost for benefits, premium for the stoploss protection, and an administrative fee. The employer pays this “level premium” amount, with the potential for some reconciliation between the employer and the insurer at the end of the year if claims differ significantly from the estimated amount. These policies are sold as self-funded plans, so they generally are not subject to state requirements for insured plans and, for those sold to employers with fewer than 50 employees, are not subject to the rating and benefit standards in the ACA for small firms.

Due to the complexity of the funding (and regulatory status) of these plans, and because employers often pay a monthly amount that resembles a premium, they may be confused as to whether or not their health plan is self-funded or insured. This year we asked employers with fewer than 200 workers that responded that they had an insured health plan whether it was a level-funded plan.

  • Among small firms that responded that they had an insured plan, 6% reported that they had a level-funded plan [Figure 10.6].
  • If we consider the small firms reporting that they had a level-funded plan to actually be self-funded, the percentage of small firms with a self-funded health plan increases to 19% [Figure 10.6].
Figure 10.6: Among Covered Workers at Small Firms, Percentage Enrolled In a Level-Funded or Self-Funded Plan, by Firm Size, 2018

Figure 10.6: Among Covered Workers at Small Firms, Percentage Enrolled In a Level-Funded or Self-Funded Plan, by Firm Size, 2018

STOPLOSS COVERAGE AND ATTACHMENT POINTS

  • Stoploss coverage may limit the amount of claims that must be paid for each worker or may limit the total amount the plan sponsor must pay for all claims over the plan year. Sixty percent of covered workers in self-funded health plans are in plans that have stoploss insurance [Figure 10.7].
  • The percentage of covered workers in self-funded plans with stoploss insurance (60%) is similar to the value when the survey first asked about stoploss insurance in 2011 (58%). This is also true for both small firms and large firms [Figure 10.11].
  • Ninety percent of covered workers in self-funded plans that have stoploss protection are in plans where the stoploss insurance limits the amount the plan must spend on each worker. This includes stoploss insurance plans that limit a firm’s per-employee spending and plans that limit both a firm’s overall spending and per-employee spending [Figures 10.8 and 10.10].
  • Firms with per-enrollee stoploss coverage were asked for the dollar amount where the stoploss coverage would start to pay for most or all of the claim (called an attachment point). The average attachment points for firms with a per-person limit are $110,000 for small firms and $390,000 for large firms [Figure 10.8].
Figure 10.7: Among Covered Workers Enrolled In a Self-Funded Plan, Percentage Covered by Stoploss Insurance, by Firm Size, 2018

Figure 10.7: Among Covered Workers Enrolled In a Self-Funded Plan, Percentage Covered by Stoploss Insurance, by Firm Size, 2018

Figure 10.8: Prevalence and Average Attachment Points of Stoploss Insurance, by Firm Size and Region, 2018

Figure 10.8: Prevalence and Average Attachment Points of Stoploss Insurance, by Firm Size and Region, 2018

Figure 10.9: Among Self-Funded Firms With Stoploss Coverage, Percentage of Covered Workers Enrolled In a Plan With an Attachment Point of $100,000 or Less, by Firm Size, 2011-2018

Figure 10.9: Among Self-Funded Firms With Stoploss Coverage, Percentage of Covered Workers Enrolled In a Plan With an Attachment Point of $100,000 or Less, by Firm Size, 2011-2018

Figure 10.10: Percentage of Covered Workers Enrolled In Self-Funded Plans That Purchase Different Types of Stoploss Insurance, by Firm Size, 2018

Figure 10.10: Percentage of Covered Workers Enrolled In Self-Funded Plans That Purchase Different Types of Stoploss Insurance, by Firm Size, 2018

Figure 10.11: Among Covered Workers Enrolled In a Self-Funded Plan, Percentage Covered by Stoploss Insurance, by Firm Size, 2011-2018

Figure 10.11: Among Covered Workers Enrolled In a Self-Funded Plan, Percentage Covered by Stoploss Insurance, by Firm Size, 2011-2018


Section Eleven: Retiree Health Benefits

Retiree health benefits are an important consideration for older workers making decisions about their retirement. Retiree benefits can be an important source of coverage for people retiring before Medicare eligibility. For retirees with Medicare coverage, retiree health benefits can provide an important supplement to Medicare, helping them pay for cost sharing, and benefits not otherwise covered by Medicare.

The percentage of large firms offering retiree coverage has decreased over time. This year we report a decrease in the share of large firms offering retiree health benefits, partly attributable to a 17% decline in the percentage of public employers reporting that they provide benefits to any employee that has retired from the organization. While this decline is not statistically significant in itself, it has a large influence on the overall estimate, and we are skeptical that this type of change took place over a one-year period. We would note that there has been concern about the ability of public entities to finance these benefits, with some cities and other public entities deciding to stop providing benefits to current or future employees when they retire. It is possible that some respondents may have focused on the changing eligibility for future retirees rather than on the benefits provided to current retirees in responding to this question. We note that some respondents in the panel changed their response to the question in the last year. To address this potential issue, beginning in 2019 we will include one or more follow-up questions to better ascertain whether respondents are considering only benefits offered to current retirees when answering this question.

This survey asks retiree health benefits questions only of large firms (200 or more workers).

EMPLOYER RETIREE BENEFITS

  • In 2018, 18% of large firms that offer health benefits to their workers offer retiree coverage, a significantly lower percentage than in recent years [Figure 11.1]. As discussed above, despite this longer-term decrease, we are skeptical about the magnitude of this change over one year and plan to clarify the question in the future.
  • Retiree health benefits offer rates vary considerably by firm characteristics.
  • Among large firms offering health benefits, the likelihood that a firm will offer retiree health benefits increases with firm size [Figure 11.2].
  • The share of large firms offering retiree health benefits varies considerably by industry [Figure 11.2].
  • Despite the lower percentage of public firms reporting that they offer retiree health benefits, among large firms offering health benefits, the share of public firms offering retiree benefits (49%) is higher than the shares of private for-profit firms (10%) or private not-for-profit firms (21%) offering retiree benefits [Figure 11.3].
  • Large firms with at least some union workers are more likely to offer retiree health benefits than large firms without any union workers (29% vs. 14%) [Figure 11.3].
Figure 11.1: Among Large Firms Offering Health Benefits to Active Workers, Percentage of Firms Offering Retiree Health Benefits, 1988-2018

Figure 11.1: Among Large Firms Offering Health Benefits to Active Workers, Percentage of Firms Offering Retiree Health Benefits, 1988-2018

Figure 11.2: Among Large Firms Offering Health Benefits to Active Workers, Percentage of Firms Offering Retiree Health Benefits, by Firm Size, Region, and Industry, 2018

Figure 11.2: Among Large Firms Offering Health Benefits to Active Workers, Percentage of Firms Offering Retiree Health Benefits, by Firm Size, Region, and Industry, 2018

Figure 11.3: Among Large Firms Offering Health Benefits to Active Workers, Percentage of Firms Offering Retiree Health Benefits, by Firm Characteristics, 2018

Figure 11.3: Among Large Firms Offering Health Benefits to Active Workers, Percentage of Firms Offering Retiree Health Benefits, by Firm Characteristics, 2018

EARLY RETIREES AND MEDICARE-AGE RETIREES

  • Among large firms offering retiree health benefits, most firms offer to early retirees under the age of 65 (91%). A lower percentage (67%) of large firms offering retiree health benefits offer to Medicare-age retirees. Despite the change in the overall offer rate for retiree benefits, these percentages are similar to those last year [Figure 11.4].
  • Among large firms offering retiree health benefits, 60% offer health benefits to both early and Medicare-age retirees.
  • Among large firms offering retiree benefits, a large share (88%) report offering benefits to the spouses of retirees [Figure 11.5].
  • Thirty-four percent of large employers offering retiree health benefits to Medicare-age retirees offer coverage through a contract with a Medicare Advantage plan. Firms with 5,000 or more workers are more likely to offer retiree benefits through a contract with a Medicare Advantage plan than other large firms [Figure 11.6].
  • Seventy-four percent of large firms offering Medicare-age retirees health benefits through a contract with a Medicare Advantage plan require some or all Medicare-age retirees to choose the Medicare Advantage plan in order to receive a contribution from the firm, while 26% allow Medicare-age retirees to choose another type of plan and still receive a firm contribution [Figure 11.7].
Figure 11.4: Among Large Firms Offering Health Benefits to Active Workers and Retirees, Percentage of Firms Offering Health Benefits to Early and Medicare-Age Retirees, 2000-2018

Figure 11.4: Among Large Firms Offering Health Benefits to Active Workers and Retirees, Percentage of Firms Offering Health Benefits to Early and Medicare-Age Retirees, 2000-2018

Figure 11.5: Among Large Firms Offering Health Benefits to Active Workers and Retirees, Percentage of Firms Offering Retiree Health Benefits to Various Groups, by Firm Size, 2018

Figure 11.5: Among Large Firms Offering Health Benefits to Active Workers and Retirees, Percentage of Firms Offering Retiree Health Benefits to Various Groups, by Firm Size, 2018

Figure 11.6: Among Large Firms That Offer Retiree Health Benefits to Medicare-Age Retirees, Percentage of Firms That Contract With a Medicare Advantage Plan, 2018

Figure 11.6: Among Large Firms That Offer Retiree Health Benefits to Medicare-Age Retirees, Percentage of Firms That Contract With a Medicare Advantage Plan, 2018

Figure 11.7: Among Large Firms Offering Retiree Health Benefits Through a Contract With a Medicare Advantage Plan, Workers' Eligibility to Choose Another Plan Type and Receive a Firm Contribution, 2018

Figure 11.7: Among Large Firms Offering Retiree Health Benefits Through a Contract With a Medicare Advantage Plan, Workers’ Eligibility to Choose Another Plan Type and Receive a Firm Contribution, 2018

ELIGIBILITY FOR NEW AND RETIRING WORKERS

  • Among large firms offering retiree health benefits, 62% report that new hires will be eligible for the firm’s retiree health benefits and 90% report that employees retiring this year will be eligible for retiree health benefits [Figure 11.8].
Figure 11.8: Among Large Firms Offering Health Benefits to Active Workers and Retirees, Percentage of Firms Offering Retiree Health Benefits to Various Groups of Workers, by Firm Size, 2018

Figure 11.8: Among Large Firms Offering Health Benefits to Active Workers and Retirees, Percentage of Firms Offering Retiree Health Benefits to Various Groups of Workers, by Firm Size, 2018

PREMIUM CONTRIBUTIONS

  • Sixty-one percent of large firms offering retiree health benefits make a contribution toward the cost of benefits for at least some of their retirees [Figure 11.9].
  • A defined contribution is a set dollar amount that the retiree can use to purchase a health plan they choose. Among large firms that make a contribution toward the cost of retiree benefits, 31% report that they make a defined contribution for retiree health benefits [Figure 11.10].
  • Among large firms offering retiree health benefits to early retirees, 8% provide retirees a contribution they can use to purchase coverage on their own or through a public exchange such as Healthcare.gov [Figure 11.11].
Figure 11.9: Among Large Firms Offering Health Benefits to Active Workers and Retirees, Percentage of Firms That Contribute to the Cost of Retiree Health Benefits, by Firm Size, 2018

Figure 11.9: Among Large Firms Offering Health Benefits to Active Workers and Retirees, Percentage of Firms That Contribute to the Cost of Retiree Health Benefits, by Firm Size, 2018

Figure 11.10: Among Large Firms That Contribute to Retiree Health Benefits, Percentage of Firms That Contribute Through a Defined Contribution, by Firm Size, 2018

Figure 11.10: Among Large Firms That Contribute to Retiree Health Benefits, Percentage of Firms That Contribute Through a Defined Contribution, by Firm Size, 2018

Figure 11.11: Among Large Firms That Offer Retiree Health Benefits to Early Retirees, Percentage of Firms That Provide Retirees a Contribution to Purchase Coverage On Their Own or Through a Public Exchange, by Firm Size, 2018

Figure 11.11: Among Large Firms That Offer Retiree Health Benefits to Early Retirees, Percentage of Firms That Provide Retirees a Contribution to Purchase Coverage On Their Own or Through a Public Exchange, by Firm Size, 2018

PRIVATE EXCHANGES

  • Private exchanges have received considerable attention over the past several years. They are typically created by a consulting company, broker, or insurer, and are different than the public exchanges created under the Affordable Care Act (ACA). Private exchanges allow employees or retirees from multiple companies to choose from a larger number of health benefit options than one firm would generally provide.
  • Five percent of large firms, including 25% of firms with 5,000 or more workers, offering retiree health benefits report they offer benefits through a private exchange [Figure 11.12]. For more information on the use of private exchanges for active employees, please see Section 14.
Figure 11.12: Among Large Firms Offering Health Benefits to Active Workers and Retirees, Percentage of Firms That Offer Retiree Health Benefits Through a Private or Corporate Exchange, by Firm Size, 2014-2018

Figure 11.12: Among Large Firms Offering Health Benefits to Active Workers and Retirees, Percentage of Firms That Offer Retiree Health Benefits Through a Private or Corporate Exchange, by Firm Size, 2014-2018

COST REDUCTION STRATEGIES

Large firms offering retiree health benefits were asked if they had implemented specified cost reduction strategies within the past two years.

  • Eight percent of large firms offering retiree benefits to Medicare-age retirees reported that they started offering benefits through a Medicare Advantage Plan within the past two years [Figure 11.13].
  • Among large firms offering retiree health benefits, 20% say they increased patient cost sharing and 29% say they increased retiree premium contributions in the last two years [Figure 11.13]. The percentage of firms reporting increasing retiree premium contributions increases with firm size.
  • Small shares of large firms offering retiree health benefits reported other changes: 2% started using a defined contribution approach to permit retirees to purchase benefits on a public or private exchange; 3% eliminated coverage for early retirees; and 3% eliminated coverage for Medicare-age retirees [Figure 11.13].
Figure 11.13: Among Large Firms Offering Health Benefits to Retirees and Active Workers, Percentage of Firms That Have Implemented Any of the Following Cost Reduction Strategies In the Past Two Years, 2018

Figure 11.13: Among Large Firms Offering Health Benefits to Retirees and Active Workers, Percentage of Firms That Have Implemented Any of the Following Cost Reduction Strategies In the Past Two Years, 2018

Section Twelve: Health And Wellness Programs

Firms continue to show considerable interest in programs that help workers identify health issues and manage chronic conditions. Many employers believe that improving the health of their workers and their family members can improve morale and productivity, and reduce health care costs.

In addition to offering wellness programs, a majority of large firms now offer health screening programs, including health risk assessments, which are questionnaires asking workers about lifestyle, stress, or physical health, and biometric screening, which we define as in-person health examinations conducted by a medical professional. Firms and insurers may use the health information collected during screenings to target wellness offerings or other health services to workers with certain conditions or behaviors that pose a risk to their health. Some firms have incentive programs that reward or penalize workers for different activities, including participating in wellness programs or completing health screenings.

Only firms offering health benefits were asked about their wellness and health promotion programs. Information about incentives is reported only for large firms (200 or more workers) because there is a relatively high degree of uncertainty among small firm (3-199 workers) respondents.

Among large firms offering health benefits in 2018, 62% offer workers the opportunity to complete a health risk assessment, 50% offer workers the opportunity to complete a biometric screening, and 82% offer workers wellness programs, such as programs to help them stop smoking or lose weight, or programs that offer lifestyle and behavioral coaching. Substantial shares of these large firms provide incentives for workers to participate in or complete the programs.

HEALTH RISK ASSESSMENTS

Some firms provide workers the opportunity to complete a health risk assessment to identify potential health issues. Health risk assessments generally include questions about medical history, health status, and lifestyle. At small firms, health risk assessments are typically administered by an insurer.

  • Among firms offering health benefits, 37% of small firms and 62% of large firms provide workers the opportunity to complete a health risk assessment [Figure 12.1]. These percentages are similar to the corresponding percentages for 2017 (38% for small firms and 62% for large firms) [Figure 12.2].
  • Seventy-five percent of firms offering health benefits with 5,000 or more workers provide workers the opportunity to complete a health risk assessment, similar to the percentage in 2017 (78%) [Figure 12.1].
  • Some firms offer incentives to encourage workers to complete a health risk assessment.
  • Among large firms that offer a health risk assessment, 51% offer workers an incentive to complete the assessment [Figure 12.4].
  • Among large firms offering workers incentives to complete a health risk assessment, 46% reduce premium contributions or cost sharing and 45% offer cash, HSA or HRA contributions, or allow the worker to avoid a payroll deduction [Figure 12.5]. In some firms, workers must complete the assessment to be eligible for other rewards under the firm’s wellness programs. Some firms offer workers more than one type of incentive.
  • In firms providing workers the opportunity to complete a health risk assessment, 53% of covered workers complete an assessment, similar to the percentage in 2017 [Figure 12.3].
  • There is considerable variation across firms in the percentage of workers that complete the assessment. Sixteen percent of large firms providing workers the opportunity to complete a health risk assessment report that more than 75% of their workers complete the assessment, while 47% report no more than 25% of workers complete the assessment.
  • Large firms offering workers an incentive to complete a health risk assessment report a higher share of workers completing the assessment than large firms without an incentive (51% vs. 26%).
Figure 12.1: Among Firms Offering Health Benefits, Percentage of Firms That Provide an Opportunity to Complete a Health Risk Assessment, by Firm Size, 2018

Figure 12.1: Among Firms Offering Health Benefits, Percentage of Firms That Provide an Opportunity to Complete a Health Risk Assessment, by Firm Size, 2018

Figure 12.2: Among Firms Offering Health Benefits, Percentage of Firms That Provide an Opportunity to Complete a Health Risk Assessment, by Firm Size, 2009-2018

Figure 12.2: Among Firms Offering Health Benefits, Percentage of Firms That Provide an Opportunity to Complete a Health Risk Assessment, by Firm Size, 2009-2018

Figure 12.3: Among Firms Providing Workers an Opportunity to Complete a Health Risk Assessment (HRA), Percentage of Workers That Complete the HRA, by Firm Size, 2018

Figure 12.3: Among Firms Providing Workers an Opportunity to Complete a Health Risk Assessment (HRA), Percentage of Workers That Complete the HRA, by Firm Size, 2018

Figure 12.4: Among Large Firms Offering Health Benefits and Providing an Opportunity to Complete a Health Risk Assessment (HRA), Percentage of Firms That Offer Workers Incentives to Complete the HRA, by Firm Size, 2018

Figure 12.4: Among Large Firms Offering Health Benefits and Providing an Opportunity to Complete a Health Risk Assessment (HRA), Percentage of Firms That Offer Workers Incentives to Complete the HRA, by Firm Size, 2018

Figure 12.5: Among Large Firms Offering an Incentive to Workers Who Complete a Health Risk Assessment, Percentage of Firms Using Different Types of Incentives, by Firm Size, 2018

Figure 12.5: Among Large Firms Offering an Incentive to Workers Who Complete a Health Risk Assessment, Percentage of Firms Using Different Types of Incentives, by Firm Size, 2018

BIOMETRIC SCREENING

Biometric screening is a health examination that measures a person’s risk factors (such as cholesterol, blood pressure, and body mass index (BMI)) for certain medical issues. A biometric outcome involves assessing whether the person meets specified health targets related to certain risk factors, such as meeting a target BMI or cholesterol level. As defined by this survey, goals related to smoking are not included in the biometric screening questions.

  • Among firms offering health benefits, 21% of small firms and 50% of large firms provide workers the opportunity to complete a biometric screening [Figure 12.6]. These percentages are similar to 2017 (21% and 52%) [Figure 12.7].
  • Some firms offer incentives to encourage workers to complete the biometric screening.
  • Among large firms with biometric screening programs, 60% offer workers an incentive to complete the screening [Figure 12.10]. Some firms report offering more than one type of incentive.
  • Among large firms with an incentive for workers to complete a biometric screening, 52% reduce premium contributions or cost sharing and 39% offer cash, HRA or HSA contributions, or allow the worker to avoid a payroll deduction. As with incentives for health risk assessments, workers in some firms must complete the biometric screening to be eligible for other rewards under the firm’s wellness programs [Figure 12.11].
  • In firms providing workers the opportunity to complete a biometric screening, 55% of covered workers complete a screening [Figure 12.8].
  • There is considerable variation across firms in the percentage of workers who complete a biometric screening. Twenty-one percent of large firms providing workers the opportunity to complete a biometric screening report that more than 75% of their workers complete the screening, while 40% report no more than 25% of workers complete the screening.
  • Large firms offering an incentive for workers to complete a biometric screening report a higher share of workers completing the screening than large firms without an incentive (54% vs. 30%).
  • In addition to incentives for completing a biometric screening, some firms offer workers incentives to meet biometric outcomes. Among large firms with biometric screening programs, 15% reward or penalize workers based on achieving specified biometric outcomes (such as meeting a target BMI) [Figure 12.10].
  • The size of the incentives firms offer for meeting biometric outcomes varies considerably. Among large firms offering a reward or penalty for meeting biometric outcomes, the maximum reward is valued at $150 or less for 15% of firms and more than $1,000 for 19% of firms [Figure 12.12]. Fifteen percent of these firms combine the reward with incentives for other activities.
Figure 12.6: Among Firms Offering Health Benefits, Percentage of Firms That Provide an Opportunity to Complete a Biometric Screening, by Firm Size, 2018

Figure 12.6: Among Firms Offering Health Benefits, Percentage of Firms That Provide an Opportunity to Complete a Biometric Screening, by Firm Size, 2018

Figure 12.7: Among Firms Offering Health Benefits, Percentage of Firms That Provide an Opportunity to a Complete Biometric Screening, by Firm Size, 2012-2018

Figure 12.7: Among Firms Offering Health Benefits, Percentage of Firms That Provide an Opportunity to a Complete Biometric Screening, by Firm Size, 2012-2018

Figure 12.8: Among Firms Providing Workers an Opportunity to Complete a Biometric Screening, Percentage of Workers That Complete the Screening, by Firm Size, 2018

Figure 12.8: Among Firms Providing Workers an Opportunity to Complete a Biometric Screening, Percentage of Workers That Complete the Screening, by Firm Size, 2018

Figure 12.9: Among Large Firms Offering Health Benefits, Percentage of Firms That Provide an Opportunity to Complete a Biometric Screening or a Health Risk Assessment, by Region and Industry, 2018

Figure 12.9: Among Large Firms Offering Health Benefits, Percentage of Firms That Provide an Opportunity to Complete a Biometric Screening or a Health Risk Assessment, by Region and Industry, 2018

Figure 12.10: Among Large Firms Offering Health Benefits and Providing an Opportunity to Complete a Biometric Screening, Percentage of Firms With Incentives to Complete the Screening or Achieve Biometric Outcomes, by Firm Size, 2018

Figure 12.10: Among Large Firms Offering Health Benefits and Providing an Opportunity to Complete a Biometric Screening, Percentage of Firms With Incentives to Complete the Screening or Achieve Biometric Outcomes, by Firm Size, 2018

Figure 12.11: Among Large Firms Offering Workers an Incentive to Complete a Biometric Screening, Percentage of Firms With Various Types of Incentives, by Firm Size, 2018

Figure 12.11: Among Large Firms Offering Workers an Incentive to Complete a Biometric Screening, Percentage of Firms With Various Types of Incentives, by Firm Size, 2018

Figure 12.12: Among Large Firms Offering Workers an Incentive to Meet Biometric Outcomes, Maximum Value a Worker Can Receive for Achieving Outcomes, 2015-2018

Figure 12.12: Among Large Firms Offering Workers an Incentive to Meet Biometric Outcomes, Maximum Value a Worker Can Receive for Achieving Outcomes, 2015-2018

USE OF HEALTH SCREENING INFORMATION

Among firms offering health benefits, 42% of small firms and 70% of large firms offer workers a health risk assessment, biometric screening or both screening programs.

  • Thirty-eight percent of large firms offering health benefits have an incentive for workers to complete a biometric screening or health risk assessment [Figure 12.14].
  • Firms with screening programs report using the information from the program for a variety of reasons. Among large firms with a screening program, 62% report using information from their screening programs to target health promotion programs or communications, 53% use information to design new programs, 43% use information to measure health plan costs, 67% use information to understand employee health risks, and 24% use information as the basis for an incentive program [Figure 12.13].
  • Among all firms offering health benefits, 5% of small firms and 21% of large firms collect information from workers’ mobile apps or wearable devices, such as a Fitbit or Apple Watch, as part of their wellness or health promotion program [Figure 12.15].
  • The percentage of large firms that collect information from workers’ mobile apps or wearable devices has increased from 14% in 2017 to 21% this year.
Figure 12.13: Among Large Firms That Offer a Health Screening Program, How Firm Uses Information Collected, 2018

Figure 12.13: Among Large Firms That Offer a Health Screening Program, How Firm Uses Information Collected, 2018

Among Large Firms Offering Health Benefits, Percentage With or Without an Incentive to Complete the Programs, 2018

Figure 12.14: Among Large Firms Offering Health Benefits, Percentage With or Without an Incentive to Complete the Programs, 2018

Figure 12.15: Among Firms Offering Health Benefits, Percentage of Firms That Collect Information From Workers' Mobile Apps or Wearable Technologies, by Firm Size, 2018

Figure 12.15: Among Firms Offering Health Benefits, Percentage of Firms That Collect Information From Workers’ Mobile Apps or Wearable Technologies, by Firm Size, 2018

WELLNESS AND HEALTH PROMOTION PROGRAMS

Many firms and health plans offer programs to help workers engage in healthy lifestyles and reduce health risks. Wellness and health promotion programs may include exercise programs, health education classes, and stress-management counseling. These programs may be offered directly by the firm, an insurer, or a third-party contractor.

  • Among firms offering health benefits, 44% of small firms and 70% of large firms offer programs to help workers stop smoking or using tobacco, 43% of small firms and 62% of large firms offer programs to help workers lose weight, and 39% of small firms and 68% of large firms offer some other lifestyle or behavioral coaching program. Fifty-three percent of small firms and 82% of large firms offering health benefits offer at least one of these three programs [Figures 12.16 and 12.17].
  • To encourage participation in wellness programs, firms may offer incentives to workers who participate in or complete them.
  • Thirty-five percent of large firms offering one of these wellness or health promotion programs offer an incentive to encourage workers to participate in or complete the programs [Figure 12.18]
  • Among large firms offering incentives to workers to participate in or complete wellness or health promotion programs, 32% reduce premium contributions or cost sharing and 43% offer cash, HSA or HRA contributions, or allow the worker to avoid a payroll deduction [Figure 12.19].
  • Firms with incentives for health risk assessments, biometric screenings, or wellness or health promotion programs were asked to report the maximum reward or penalty a worker could earn for all of the firm’s health promotion activities combined. Some firms do not offer incentives for individual activities, but offer rewards to workers who complete a variety of activities.30 Among large firms offering incentives for any of these programs, the maximum value for all wellness-related incentives is $150 or less in 15% of firms and more than $1,000 in 24% of firms [Figure 12.20].
  • Among large firms with incentives for a screening or wellness or health promotion program, 39% make dependent spouses eligible for incentives or penalties under at least one of their programs [Figure 12.22].
Figure 12.16: Among Firms Offering Health Benefits, Percentage of Firms Offering Specific Wellness Programs to Their Workers, by Firm Size and Region, 2018

Figure 12.16: Among Firms Offering Health Benefits, Percentage of Firms Offering Specific Wellness Programs to Their Workers, by Firm Size and Region, 2018

Figure 12.17: Among Firms Offering Health Benefits, Percentage of Firms Offering Specific Wellness Programs to Their Workers, by Firm Size, 2018

Figure 12.17: Among Firms Offering Health Benefits, Percentage of Firms Offering Specific Wellness Programs to Their Workers, by Firm Size, 2018

Figure 12.18: Among Firms Offering Specific Wellness Programs, Percentage of Firms That Offer Incentives to Participate In or Complete Wellness Programs, by Firm Size, 2018

Figure 12.18: Among Firms Offering Specific Wellness Programs, Percentage of Firms That Offer Incentives to Participate In or Complete Wellness Programs, by Firm Size, 2018

Figure 12.19: Among Large Firms Offering Incentives to Workers Who Participate In or Complete Wellness Programs, Percentage of Firms With Various Types of Incentives, 2018

Figure 12.19: Among Large Firms Offering Incentives to Workers Who Participate In or Complete Wellness Programs, Percentage of Firms With Various Types of Incentives, 2018

Figure 12.20: Among Large Firms That Offer Workers an Incentive to Participate In or Complete Any Health Promotion Programs, Maximum Annual Value of the Incentive for All Programs Combined, 2015-2018

Figure 12.20: Among Large Firms That Offer Workers an Incentive to Participate In or Complete Any Health Promotion Programs, Maximum Annual Value of the Incentive for All Programs Combined, 2015-2018

Figure 12.21: Among Large Firms Offering Workers an Incentive for Any Health Promotion Programs, Maximum Annual Value of the Incentive for All Programs Combined, 2018

Figure 12.21: Among Large Firms Offering Workers an Incentive for Any Health Promotion Programs, Maximum Annual Value of the Incentive for All Programs Combined, 2018

Figure 12.22: Among Firms Offering Health Benefits to Spouses and Offering Workers an Incentive for Any Health Promotion Programs, Percentage of Firms Where Dependent Spouses Are Eligible for Incentives or Penalties, by Firm Size, 2018

Figure 12.22: Among Firms Offering Health Benefits to Spouses and Offering Workers an Incentive for Any Health Promotion Programs, Percentage of Firms Where Dependent Spouses Are Eligible for Incentives or Penalties, by Firm Size, 2018

Figure 12.23: Among Large Firms Offering Health Benefits, Percentage of Firms Offering Various Wellness and Health Promotion Activities and Incentives, by Firm Size, 2018

Figure 12.23: Among Large Firms Offering Health Benefits, Percentage of Firms Offering Various Wellness and Health Promotion Activities and Incentives, by Firm Size, 2018

PENALTIES FOR TOBACCO USE

  • Among large firms offering health benefits, 17% of large firms, including 33% of firms with 5,000 or more workers, require higher premium contributions or cost sharing from workers who use tobacco [Figure 12.24]. Some firms noted that not using tobacco is a condition of employment.
Figure 12.24 Among Large Firms Offering Health Benefits, Percentage of Firms That Require Workers Who Use Tobacco to Contribute More to the Premium or Cost Sharing Than Those Who Do Not Use Tobacco, by Firm Size, 2018

Figure 12.24 Among Large Firms Offering Health Benefits, Percentage of Firms That Require Workers Who Use Tobacco to Contribute More to the Premium or Cost Sharing Than Those Who Do Not Use Tobacco, by Firm Size, 2018


  1. In 2018, less than one percent of firms indicated that they had an incentive for completing health risk assessments, biometric screenings, or wellness or health promotion programs, but had a maximum incentive of zero dollars. These firms may have non-monetary incentives such as preferred parking spots or employee recognition programs.

Section Thirteen: Grandfathered Health Plans

The Affordable Care Act (ACA) exempts certain health plans that were in effect when the law was passed, referred to as grandfathered plans, from some standards in the law, including the requirement to cover preventive services without cost sharing, have an external appeals process, or comply with the new benefit and rating provisions in the small group market. In 2018, 20% of firms offering health benefits offer at least one grandfathered health plan, and 16% of covered workers are enrolled in a grandfathered plan.

As in years past, some firms had difficulty with the details of the term “grandfathering”, as described in the provisions of the ACA. We would note that smaller firms in particular appeared to have some confusion about whether or not they are grandfathered.

  • Twenty percent of offering firms report having at least one grandfathered plan in 2018, similar to 23% in 2017 [Figure 13.1].
  • Sixteen percent of covered workers are enrolled in a grandfathered health plan in 2018 [Figure 13.2].
  • The percentage of covered workers enrolled in a grandfathered plan is similar to the percentage in 2017 (17%), but lower than previous years: 25% in 2015, 26% in 2014, and 36% in 2013 [Figure 13.3].
Figure 13.1: Percentage of Firms With at Least One Plan Grandfathered Under the Affordable Care Act (ACA), by Size and Region, 2018

Figure 13.1: Percentage of Firms With at Least One Plan Grandfathered Under the Affordable Care Act (ACA), by Size and Region, 2018

Figure 13.2: Percentage of Covered Workers Enrolled In Plans Grandfathered Under the Affordable Care Act (ACA), by Size, Region, and Industry, 2018

Figure 13.2: Percentage of Covered Workers Enrolled In Plans Grandfathered Under the Affordable Care Act (ACA), by Size, Region, and Industry, 2018

Figure 13.3: Percentage of Covered Workers Enrolled In Plans Grandfathered Under the Affordable Care Act (ACA), by Firm Size, 2011-2018

Figure 13.3: Percentage of Covered Workers Enrolled In Plans Grandfathered Under the Affordable Care Act (ACA), by Firm Size, 2011-2018


Section Fourteen: Employer Practices And Health Plan Networks

Employers play a major role in financing and arranging for health insurance coverage, so their opinions and experiences are important factors in health policy discussions. In recent years, employers have included new providers and sites of care, such as retail clinics, and some have pursued changes to their networks to reduce costs or improve quality.

SHOPPING FOR HEALTH COVERAGE

Sixty-one percent of firms offering health benefits reported shopping for a new health plan or a new insurance carrier in the past year, similar to the percentage last year. Small firms were more likely to shop for coverage (62%) while firms with 1,000-4,999 workers and firms with 5,000 or more workers were less likely to shop for coverage (37% and 26%, respectively) than firms in other size categories [Figure 14.1].

  • Among firms that offer health benefits and who shopped for a new plan or carrier in the past year, 25% changed insurance carriers [Figure 14.2].
Figure 14.1: Percentage of Firms Offering Health Benefits That Shopped for a New Plan or Health Insurance Carrier In the Past Year, by Firm Size, 2018

Figure 14.1: Percentage of Firms Offering Health Benefits That Shopped for a New Plan or Health Insurance Carrier In the Past Year, by Firm Size, 2018

Figure 14.2: Among Firms Offering Health Benefits That Shopped for a New Plan or Insurance Carrier, Percentage of Firms That Changed Insurance Carriers In the Past Year, by Firm Size, 2018

Figure 14.2: Among Firms Offering Health Benefits That Shopped for a New Plan or Insurance Carrier, Percentage of Firms That Changed Insurance Carriers In the Past Year, by Firm Size, 2018

PROVIDER NETWORKS

Firms and health plans can structure their networks of providers and their cost sharing to encourage enrollees to use providers who are lower cost or who provide better care.

  • A tiered or high-performance network groups providers in the network based on the cost, quality and/or efficiency of the care they deliver. These networks encourage enrollees to visit preferred doctors by either restricting networks to efficient providers, or by having different cost-sharing requirements based on the provider’s tier. Fourteen percent of firms with 50 or more workers that offer health benefits include a high-performance or tiered provider network in their health plan with the largest enrollment, similar to last year [Figures 14.3 and 14.4].
  • Firms with 1,000 or more workers are more likely than smaller firms to incorporate a high-performance or tiered network into their largest plan.
  • Narrow network plans limit the number of providers that can participate in order to reduce costs and generally are more restrictive than standard HMO networks. Seven percent of firms offering health benefits report that they offer a plan that they considered to be a narrow network plan, similar to the percentages reported the past two years [Figures 14.6].
  • Firms with 5,000 or more workers offering health benefits are more likely than firms of other sizes to offer at least one plan with a narrow network [Figure 14.5].
  • Only 2% of firms offering health benefits say that either they or their insurer eliminated a hospital or health system from a provider network during the past year in order to reduce the plan’s cost [Figure 14.5].
  • Firms with 50-199 workers and firms with 5,000 or more workers offering health benefits are more likely than firms of other sizes to say that either they or their insurer eliminated a hospital or health system from a provider network to reduce costs [Figure 14.5].
Figure 14.3: Among Firms With 50 or More Workers Offering Health Benefits, Percentage of Firms Whose Largest Plan Includes a High-Performance or Tiered Provider Network, by Firm Size, 2018

Figure 14.3: Among Firms With 50 or More Workers Offering Health Benefits, Percentage of Firms Whose Largest Plan Includes a High-Performance or Tiered Provider Network, by Firm Size, 2018

Figure 14.4: Among Firms With 50 or More Workers Offering Health Benefits, Percentage of Firms Whose Largest Plan Includes a High-Performance or Tiered Provider Network, by Firm Size, 2007-2018

Figure 14.4: Among Firms With 50 or More Workers Offering Health Benefits, Percentage of Firms Whose Largest Plan Includes a High-Performance or Tiered Provider Network, by Firm Size, 2007-2018

Figure 14.5: Among Firms Offering Health Benefits, Percentage of Firms That Eliminated Hospitals From Their Network In the Past Year to Reduce Cost or Offer a Narrow Network Plan, by Firm Size, 2018

Figure 14.5: Among Firms Offering Health Benefits, Percentage of Firms That Eliminated Hospitals From Their Network In the Past Year to Reduce Cost or Offer a Narrow Network Plan, by Firm Size, 2018

Figure 14.6: Among Firms With 50 or More Workers Offering Health Benefits, Percentage of Firms That Offer a Narrow Network Plan or Eliminated Hospitals From Their Network In Past Year to Reduce Cost, by Firm Size, 2014-2018

Figure 14.6: Among Firms With 50 or More Workers Offering Health Benefits, Percentage of Firms That Offer a Narrow Network Plan or Eliminated Hospitals From Their Network In Past Year to Reduce Cost, by Firm Size, 2014-2018

ALTERNATIVE CARE SETTINGS: TELEMEDICINE, ONSITE CLINICS, AND RETAIL CLINICS

Many firms provide coverage for health services delivered outside typical provider settings.

  • Telemedicine is the delivery of health care services through telecommunications to a patient from a provider who is at a remote location, including video chat and remote monitoring. This would not include the mere exchange of information via email, exclusively web-based resources, or online information a plan may make available unless a health professional provides information specific to the enrollee’s condition. Sixty-seven percent of firms with 50 or more workers who offer health benefits cover the provision of some health care services through telemedicine in their largest health plan [Figure 14.7]. Firms with 1,000 or more workers are more likely than smaller firms to cover services provided through telemedicine.
  • Among firms with 50 or more workers with plans that cover health services through telemedicine, 39% provide a financial incentive for workers to use telemedicine instead of visiting a traditional physician’s office in-person, higher than the percentage in 2017 [Figure 14.8].
  • The percentage of large firms reporting that they cover services through telemedicine increased from 63% last year to 74% this year [Figure 14.9].
  • Among large firms offering health benefits, 10% have an on-site health clinic for their employees at one or more of their major locations. A large share of these firms report that employees can receive treatment for non-work-related illnesses at their on-site clinics [Figure 14.10].
  • Firms with 1,000 or more workers are more likely than other large firms to have an on-site health clinic at one or more of their major locations [Figure 14.11].
  • Sixty-eight percent of firms that offer health benefits cover health care services received in retail clinics, such as those located in pharmacies, supermarkets and retail stores, in their largest health plan [Figure 14.12]. These clinics are often staffed by nurse practitioners or physician assistants and treat minor illnesses and provide preventive services.
  • Among firms with plans that cover health services received in retail clinics, 15% provide a financial incentive for workers to use a retail health clinic instead of visiting a traditional physician’s office [Figure 14.12].
Figure 14.7: Among Firms With 50 or More Workers Offering Health Benefits, Percentage of Firms Whose Plan With the Largest Enrollment Covers Telemedicine, by Firm Size, 2018

Figure 14.7: Among Firms With 50 or More Workers Offering Health Benefits, Percentage of Firms Whose Plan With the Largest Enrollment Covers Telemedicine, by Firm Size, 2018

Figure 14.8: Among Firms With 50 or More Workers Offering Health Benefits, Percentage of Firms Whose Plan With the Largest Enrollment Covers Telemedicine and That Have an Incentive for Workers to Use Telemedicine, by Firm Size, 2018

Figure 14.8: Among Firms With 50 or More Workers Offering Health Benefits, Percentage of Firms Whose Plan With the Largest Enrollment Covers Telemedicine and That Have an Incentive for Workers to Use Telemedicine, by Firm Size, 2018

Figure 14.9: Among Large Firms Offering Health Benefits, Percentage of Firms Whose Plan With the Largest Enrollment Covers Telemedicine, 2015-2018

Figure 14.9: Among Large Firms Offering Health Benefits, Percentage of Firms Whose Plan With the Largest Enrollment Covers Telemedicine, 2015-2018

Figure 14.10: Among Firms With 50 or More Workers Offering Health Benefits, Percentage of Firms With an On-Site Health Clinic and Whose Clinic Treats Non-Work-Related Illnesses, by Firm Size, 2018

Figure 14.10: Among Firms With 50 or More Workers Offering Health Benefits, Percentage of Firms With an On-Site Health Clinic and Whose Clinic Treats Non-Work-Related Illnesses, by Firm Size, 2018

Figure 14.11: Among Large Firms Offering Health Benefits, Percentage of Firms With an On-Site Health Clinic at Any of Their Major Locations, by Firm Size, 2009-2018

Figure 14.11: Among Large Firms Offering Health Benefits, Percentage of Firms With an On-Site Health Clinic at Any of Their Major Locations, by Firm Size, 2009-2018

Figure 14.12: Among Firms With 50 or More Workers Offering Health Benefits, Percentage of Firms Whose Plan With the Largest Enrollment Covers Care at Retail Clinics and That Have a Financial Incentive for Workers to Visit Retail Clinics Instead of a Physician's Office, by Firm Size, 2018

Figure 14.12: Among Firms With 50 or More Workers Offering Health Benefits, Percentage of Firms Whose Plan With the Largest Enrollment Covers Care at Retail Clinics and That Have a Financial Incentive for Workers to Visit Retail Clinics Instead of a Physician’s Office, by Firm Size, 2018

Figure 14.13: Among Large Firms Offering Health Benefits, Percentage of Firms Whose Plan With the Largest Enrollment Covers Care at Retail Clinics and That Have a Financial Incentive for Workers to Visit Retail Clinics Instead of a Physician's Office, 2010-2018

Figure 14.13: Among Large Firms Offering Health Benefits, Percentage of Firms Whose Plan With the Largest Enrollment Covers Care at Retail Clinics and That Have a Financial Incentive for Workers to Visit Retail Clinics Instead of a Physician’s Office, 2010-2018

EMPLOYERS OFFERING LIMITED BENEFIT PLANS

Some employers offer their employees more limited benefit plans, sometimes called skinny health plans or minimum essential coverage plans. These arrangements, which have fewer benefits and lower costs than traditional employer-provided plans, satisfy the ACA’s requirement that employers offer a health plan to employees, but not typically minimum value standards. If an employee enrolls in one of these plans, however, the employee meets his or her individual requirement to have health coverage, and because they are enrolled in an employer-provided plan, they are ineligible to receive a premium tax credit if they enroll in an individual plan through the federal or a state marketplace.

  • In 2018, 4% of large firms offering health benefits report that they offer a skinny health plan to at least some of their workers [Figure 14.14].
Figure 14.14: Among Firms With 50 or More Workers Offering Health Benefits, Percentage of Firms That Offer a Skinny Plan, by Firm Size, 2018

Figure 14.14: Among Firms With 50 or More Workers Offering Health Benefits, Percentage of Firms That Offer a Skinny Plan, by Firm Size, 2018

ASSISTING LOWER-WAGE WORKERS WITH PREMIUM CONTRIBUTIONS

Some employers assist their lower-wage employees by requiring them to pay a lower share of the premium than higher-wage workers. Among firms offering health benefits, 11% of large firms, including 24% of firms with 5,000 or more workers, have this policy [Figure 14.15].

Figure 14.15: Percentage of Firms Offering Health Benefits With a Policy That Lower-Wage Workers Contribute a Lower Percentage of the Premium Than Higher-Wage Workers, by Firm Size, 2018

Figure 14.15: Percentage of Firms Offering Health Benefits With a Policy That Lower-Wage Workers Contribute a Lower Percentage of the Premium Than Higher-Wage Workers, by Firm Size, 2018

Figure 14.16: Among Firms Offering Health Benefits, Percentage of Firms Whose Plan Has Various Features, by Firm Size, 2018

Figure 14.16: Among Firms Offering Health Benefits, Percentage of Firms Whose Plan Has Various Features, by Firm Size, 2018

REPEAL OF TAX PENALTY FOR INDIVIDUALS WITHOUT HEALTH INSURANCE

The 2017 tax law eliminated the tax penalty for people who do not have health insurance (sometimes called the ‘individual mandate’) beginning in 2019. We asked employers offering health benefits how the change might affect their health benefit offerings.

  • Nine percent of small firms and 24% of large firms expect fewer employees and dependents to participate in their health plans as as result of the change [Figure 14.17].
  • Five percent of small firms and 10% of large firms expect to change their benefit options for at least some employees as a result of the change [Figure 14.17].
Figure 14.17: Among Firms Offering Health Benefits, Percentage of Firms That Believe the Repeal of the Individual Mandate Will Impact Their Benefit Offerings, by Firm Size, 2018

Figure 14.17: Among Firms Offering Health Benefits, Percentage of Firms That Believe the Repeal of the Individual Mandate Will Impact Their Benefit Offerings, by Firm Size, 2018

EXCISE TAX ON HIGH COST HEALTH PLANS

The high-cost plan tax, sometimes called the “Cadillac Tax”, is an excise tax on health benefit plans with premiums and other costs that exceed specified thresholds. The tax was scheduled to take effect in 2018, but its effective date has been delayed several times, most recently in the 2017 tax bill, and is now scheduled to take effect in 2022. The tax is 40% of the amount by which plan costs exceed the specified thresholds, and is calculated with respect to each employee based on the combinations of health benefits received by that employee, including the employer and employee share of health plan premiums (or premium equivalents for self-funded plans), Flexible Spending Account (FSA) contributions, and employer contributions to health savings accounts and health reimbursement arrangement contributions.

  • Employers appear to be aware of the pending implementation of the high cost plan tax, although they have some uncertainty as to whether it will take effect as scheduled.
  • Among firms offering health benefits, 7% of small firms and 26% of large firms say they considered the potential impact of the upcoming tax when they made their benefit decisions for 2018 [Figure 14.18].
  • Less than one-third (30%) of firms offering health benefits anticipate that the high cost plan tax will take effect as scheduled in 2022 [Figure 14.18]. Fifty-one percent of offering firms anticipate the tax will not take effect in 2022, while 19% say they do not know. Responses are similar across small and large firms.

Figure 14.18: Among Firms Offering Health Benefits, Firm Reactions to the High Cost Plan Tax (Or “Cadillac Tax”), by Firm Size, 2018

FLEXIBLE SPENDING ACCOUNTS

Flexible spending accounts (FSAs) allow employees to set aside funds on a pre-tax basis to pay for medical expenses not covered by health insurance. The legal maximum contribution for employee FSA contributions for 2018 is $2,650, although employers may establish a lower limit.

  • Among firms offering health benefits, 33% of small firms and 76% of large firms offer their employees a health FSA [Figure 14.19]. Very few firms that do not offer health benefits offer an FSA for their employees. The average maximum employee contributions are $2,528 in small firms and $2,599 in large firms [Figure 14.21].
Figure 14.19: Among All Firms and Firms Offering Health Benefits, Percentage of Firms Offering a Flexible Spending Account, by Firm Size, 2018

Figure 14.19: Among All Firms and Firms Offering Health Benefits, Percentage of Firms Offering a Flexible Spending Account, by Firm Size, 2018

Figure 14.20: Among All Firms, Percentage of Firms Offering a Flexible Spending Account, by Firm Size, 2007-2018

Figure 14.20: Among All Firms, Percentage of Firms Offering a Flexible Spending Account, by Firm Size, 2007-2018

Figure 14.21: Among Firms Offering Health Benefits and a Flexible Spending Account (FSA), Average Maximum Contribution an Employee Can Make to Their FSA Annually, by Firm Size, 2018

Figure 14.21: Among Firms Offering Health Benefits and a Flexible Spending Account (FSA), Average Maximum Contribution an Employee Can Make to Their FSA Annually, by Firm Size, 2018

PRIVATE EXCHANGES AND DEFINED CONTRIBUTIONS

A private exchange is a virtual market that allows employers to provide their workers with a choice of several different health benefit options, often including supplemental or ancillary benefits options. Private exchanges generally are created by consulting firms, insurers, or brokers, and are different than the public exchanges run by the states or the federal government. There is considerable variation in the types of exchanges currently offered: some exchanges allow workers to choose between multiple plans offered by the same carrier while in other cases multiple carriers participate. Private exchanges have been operating for several years, but enrollment remains modest.

  • Five percent of firms offering health benefits with 50 or more workers offer coverage through a private exchange. These firms provide coverage to 3% of covered workers in firms with 50 or more workers [Figure 14.22]. These percentages are similar to those in 2017.
Figure 14.22: Among Firms With 50 or More Workers Offering Health Benefits, Percentage of Covered Workers Enrolled at a Firm That Offers Benefits Through a Private or Corporate Exchange, by Firm Size, 2018

Figure 14.22: Among Firms With 50 or More Workers Offering Health Benefits, Percentage of Covered Workers Enrolled at a Firm That Offers Benefits Through a Private or Corporate Exchange, by Firm Size, 2018

News Release

State Medicaid Fact Sheets Highlight the Role of Medicaid in the U.S. Health Care System

Published: Sep 28, 2018

An updated collection of state Medicaid fact sheets from the Kaiser Family Foundation summarizes Medicaid coverage and spending nationally and in each state. The fact sheets for each state are accessible via an interactive map of the U.S. and display a wide range of data, including:

  • The share of the state population covered by Medicaid and the Children’s Health Insurance Program (CHIP), including the number covered by the Medicaid expansion in the 33 expansion states.
  • Medicaid eligibility levels and Medicaid’s role for low-income adults, children, nursing home residents and individuals with disabilities.
  • Program spending.

The two-page fact sheets provide a snapshot of Medicaid in every state as the country heads into fall elections for Congress and 36 gubernatorial contests that could have implications for Medicaid expansion, Medicaid work requirements and state and federal Medicaid spending. A related issue brief highlights key Medicaid issues to watch in the elections, including Medicaid expansion ballot initiatives in three states.

Also available is our State Health Facts database with state-level data about Medicaid spending, enrollment, eligibility levels and more.

2018 Elections: Key Medicaid Issues to Watch

Authors: Robin Rudowitz and Cornelia Hall
Published: Sep 27, 2018

Medicaid provides health insurance coverage for more than 76 million Americans, supplies funding for safety-net providers, and is the largest source of federal revenues for states. At this time last year, Congress was debating repeal and replace of the Affordable Care Act (ACA) as well as more fundamental changes to Medicaid financing. While federal legislative changes to Medicaid did not pass in 2017, the outcomes of the 2018 elections will shape program changes at both the state and federal levels of government. Our state-specific fact sheets provide background information about Medicaid and the upcoming elections.

Three states (Idaho, Nebraska and Utah) have November ballot initiatives to implement Medicaid expansion. Voters in Idaho, Nebraska and Utah will vote on a measure on the November ballot that would adopt the ACA Medicaid expansion to 138% of the federal poverty level. In addition, Montana voters will vote on a measure on the November ballot that would eliminate the state’s June 2019 expansion program sunset date and raise tobacco taxes to fund the state’s share of expansion costs. In Maine, the Medicaid expansion was adopted through a ballot initiative in November 2017. After resisting implementation of the expansion, the Governor complied with a Maine Supreme Judicial Court order to submit an expansion state plan amendment (SPA) to the federal government in September 2018, but he accompanied it with a letter asking CMS to reject the SPA. Ultimately, the outcome of implementation of the expansion in Maine will fall to the state’s next governor.

Gubernatorial races in 36 states could have implications for the direction of state Medicaid programs. Changes in the composition of state legislatures could also have implications for Medicaid. For example, such changes in Virginia made Medicaid expansion possible. Some Democratic candidates in toss-up non-expansion states, including Florida, Georgia, Kansas and Wisconsin, are running on expansion. In addition, state elections could affect the adoption of work requirements in Medicaid. For example, in Michigan, the outgoing Republican governor signed legislation to impose a work requirement in Medicaid, but the newly elected governor could move forward with or work to oppose CMS approval and implementation of these requirements.

Federal elections could affect Medicaid’s future. The elections could shift the composition of Republicans and Democrats in the Senate and the House and influence whether Congress considers legislation related to the ACA. These legislative efforts could have implications for the ACA Medicaid expansion and Medicaid financing caps. A preview of such debates appears in Senate races in Missouri, North Dakota, and West Virginia, where Democratic incumbents are running on protections for people with preexisting conditions. The Republican challengers in both Missouri and West Virginia are state attorneys general who have signed onto Texas v. Azar, another legal challenge to the ACA.

Only 1 in 3 People with Opioid Addiction in 2016 Received Substance Abuse Treatment in the Prior 12 Months

Published: Sep 27, 2018

Source

2016 National Survey on Drug Use and Health