Medicare Advantage in 2025: Enrollment Update and Key Trends
Enrollment in Medicare Advantage, the private plan alternative to traditional Medicare, has increased steadily over the past two decades, with more than half of eligible beneficiaries enrolled in Medicare Advantage since 2023. The growth in enrollment has implications for federal spending, because according to the Medicare Payment Advisory Commission (MedPAC), Medicare payments to private plans are higher than spending for similar beneficiaries in traditional Medicare. In 2025, payments are 20% more per person, which translates into an additional $84 billion in federal spending this year, substantially larger than the $18 billion in higher spending a decade ago when about one-third of eligible beneficiaries were enrolled in a Medicare Advantage plan.
Given the enrollment and spending trends, policymakers have become increasingly focused on how Medicare pays private plans, though without broad agreement on how or when to move forward. In part, the difficulty stems from concerns about the effects of payment changes for beneficiaries’ choice among plans and access to supplemental benefits, such as coverage of dental, vision and hearing.
To better understand trends in the growth of the Medicare Advantage program, this brief provides current information about enrollment, including by plan type and firm. A second, companion analysis describes Medicare Advantage premiums, out-of-pocket limits, supplemental benefits offered, and prior authorization requirements in 2025.
Highlights for 2025:
- More than half (54%) of eligible Medicare beneficiaries are enrolled in Medicare Advantage in 2025. While a growing share of Medicare beneficiaries are enrolled in a Medicare Advantage plan, the pace of the increase in enrollment slowed in 2025.
- In 2025, one in five (21%) Medicare Advantage enrollees is in a special needs plan (SNP), reflecting a steady increase in recent years. Almost half (48%) of the total increase in Medicare Advantage enrollment between 2024 and 2025 was among SNPs, up from 43% in the prior year.
- More than 80% of SNP enrollment is in plans designed for people who are dually eligible for Medicare and Medicaid (D-SNPs), though plans for people with certain chronic conditions (C-SNPs) saw a surge in enrollees in 2025. Enrollment in C-SNPS increased by more than 70% between 2024 and 2025, compared to 3% for D-SNPs and 0% for institutional-SNPs.
- Medicare Advantage enrollment is highly concentrated among plans owned by a small number of parent organizations, with UnitedHealth Group leading the market, and, together with Humana, accounting for nearly half (46%) of all Medicare Advantage enrollees nationwide, consistent with the pattern in 2024. Since 2024, market shares for the leading parent organizations have remained roughly the same. However, in absolute numbers, UnitedHealth Group had the largest growth in enrollment, with 505,000 more enrollees in 2024 than in 2025, followed by Elevance Health, which gained 249,000 enrollees. In contrast, enrollment in Humana plans decreased by about 297,000 between 2024 to 2025.
More than half of eligible Medicare beneficiaries are enrolled in Medicare Advantage in 2025.
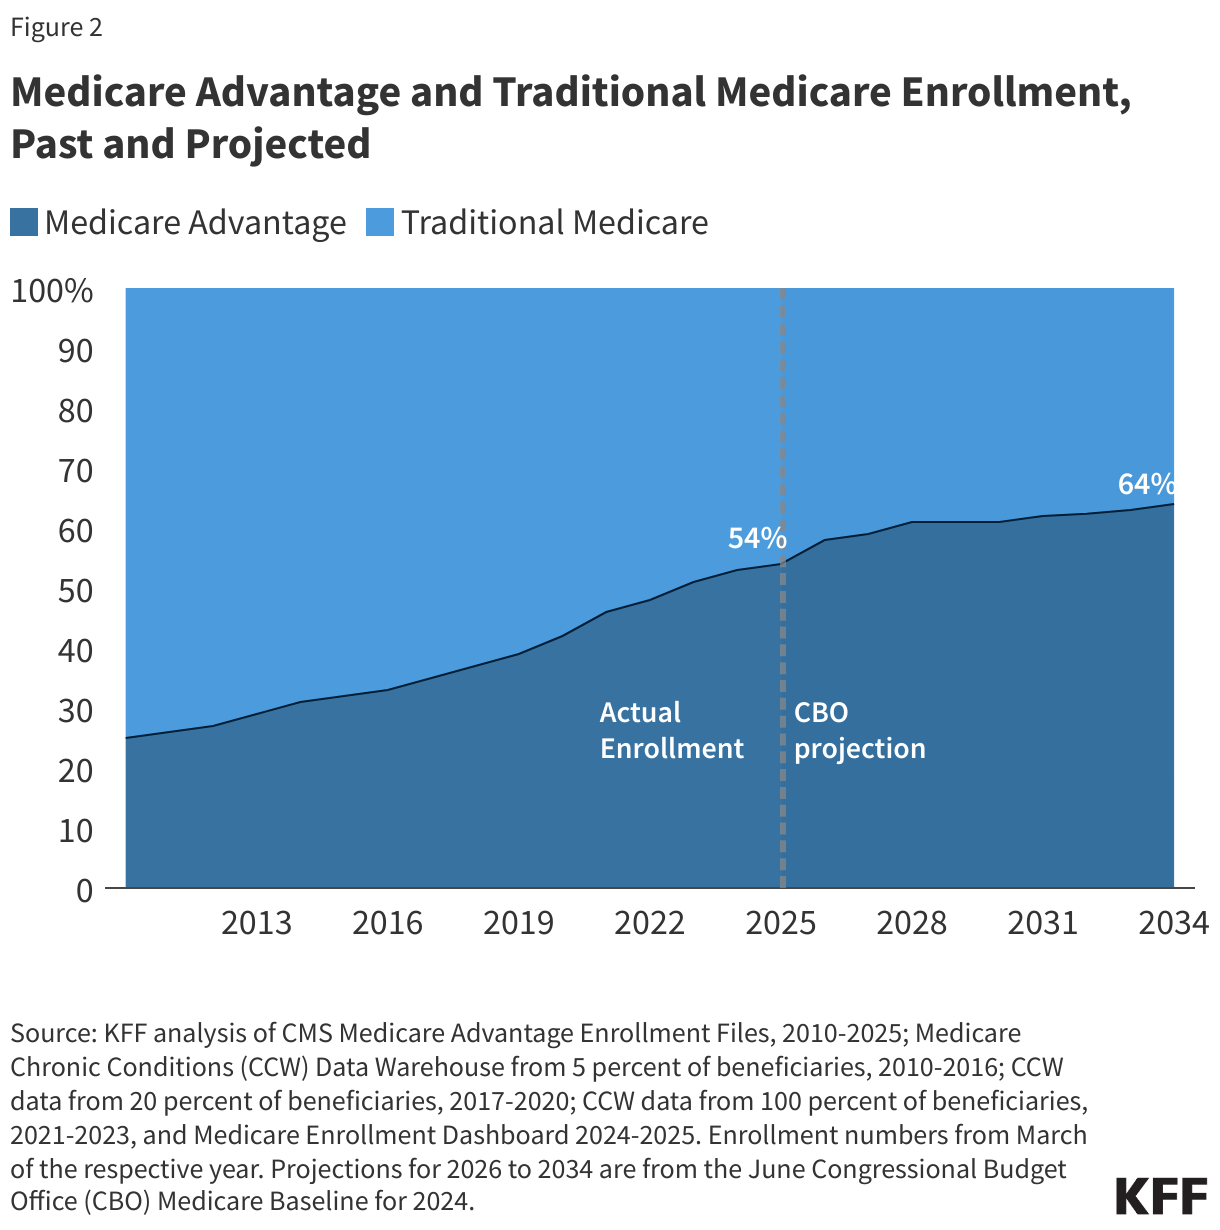
In 2025, more than half (54%) of eligible Medicare beneficiaries – 34.1 million out of about 62.8 million Medicare beneficiaries with both Medicare Parts A and B – are enrolled in Medicare Advantage plans. Medicare Advantage enrollment as a share of the eligible Medicare population has jumped from 19% in 2007 to 54% in 2025 (Figure 1).

Between 2024 and 2025, total Medicare Advantage enrollment grew by about 1.3 million beneficiaries, or 4%– a somewhat smaller growth rate than the prior year (7%). The Congressional Budget Office (CBO) projects that the share of all Medicare beneficiaries enrolled in Medicare Advantage plans will rise to 64% by 2034 (Figure 2).
In 2025, nearly two-thirds of Medicare Advantage enrollees are in individual plans that are open for general enrollment.
More than 6 in 10 Medicare Advantage enrollees (62%), or 21.2 million people, are in plans generally available to all beneficiaries for individual enrollment (Figure 3). That is an increase of 0.7 million enrollees compared to 2024. While individual plans comprised a stable share of total Medicare Advantage enrollment in 2025 compared to 2024, their share of enrollment has declined since 2010 when they comprised 71% of all enrollees. The decline in the share of enrollment in individual plans is due to faster enrollment growth in special needs plans (SNPs), especially since 2018.

Special needs plans (SNPs) comprise a growing share of Medicare Advantage enrollment.
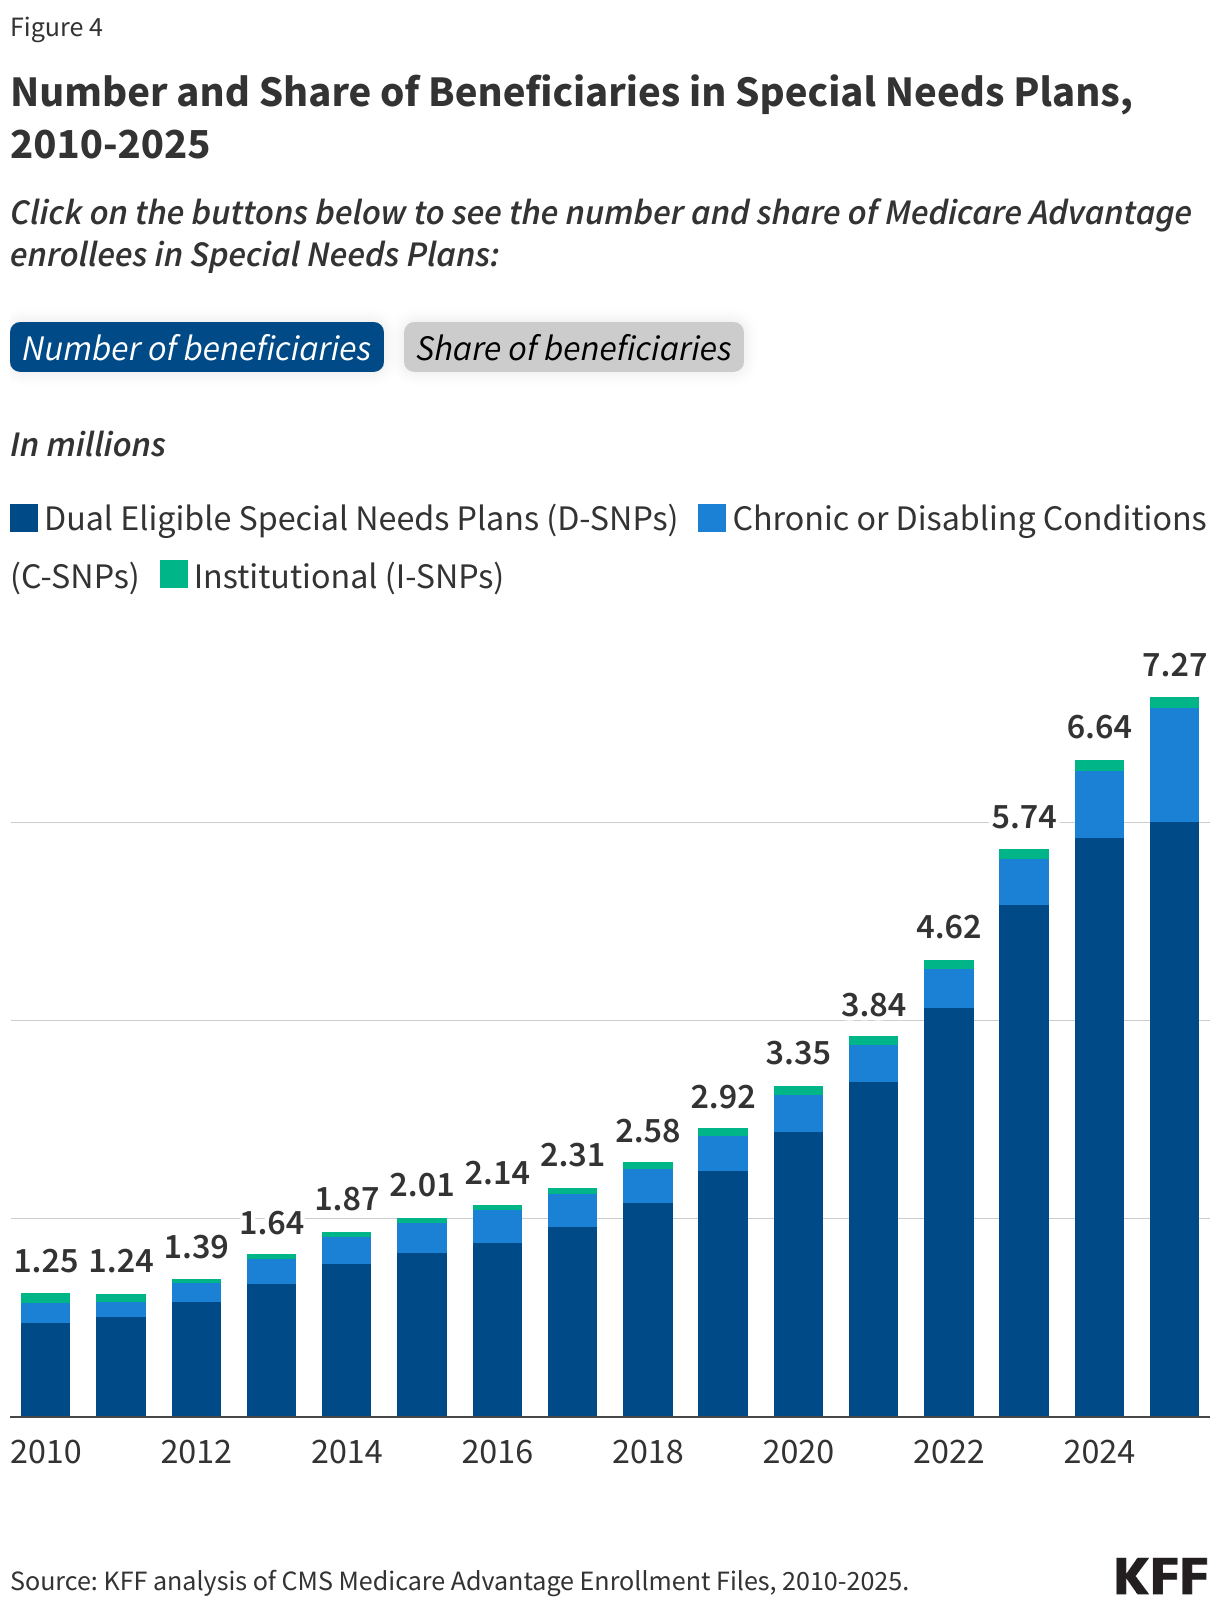
Nearly 7.3 million Medicare beneficiaries are enrolled in special needs plans (SNPs). SNPs restrict enrollment to beneficiaries with significant or relatively specialized care needs, or who qualify because they are eligible for both Medicare and Medicaid. SNPs comprise a growing share of Medicare Advantage enrollment, accounting for 21% of enrollees in 2025 compared with 14% of enrollees in 2020, reflecting small, but steadily year-over-year increases (Figure 3).
The increase in SNP enrollment is consistent with the increasing number of SNP plans available on average and more dual-eligible individuals having access to these plans since the Bipartisan Budget Act of 2018 made SNPs a permanent part of the Medicare Advantage programextra benefits
Most SNP enrollees (83%) are in plans for beneficiaries dually enrolled in both Medicare and Medicaid (D-SNPs), a decline from 88% in 2024 (Figure 4). Another 16 percent of SNP enrollees are in plans for people with severe chronic or disabling conditions (C-SNPs) – an increase from 10 percent in 2024 – and 2 percent are in plans for beneficiaries requiring a nursing home or institutional level of care (I-SNPs), the same as 2024.
While D-SNPs are designed specifically for dually-eligible individuals, among the 3.9 million dually-eligible enrollees with full benefits enrolled in Medicare Advantage plans in 2021, most (57%) were in D-SNPs while 28% were in Medicare Advantage plans that are generally available to all beneficiaries (not designed specifically for the dually-eligible population).
SNP enrollment varies across states. In the District of Columbia and Puerto Rico, SNP enrollees comprise about half of all Medicare Advantage enrollees (49% in DC and 51% in PR). In ten states, SNP enrollment accounts for at least a quarter of Medicare Advantage enrollment: 47% in MS, 38% in AR, 34% in LA and NY, 30% in FL, 29% in GA and SC, 27% in AL, 26% in CT, and 25% in Oklahoma. In the remaining 40 states, fewer than a quarter of Medicare Advantage enrollees are in SNPs.
C-SNP enrollment in 2025 (about 1.2 million people) is 71% higher than it was in 2024 – an increase of about 480,000 enrollees. Nearly all (97%) C-SNP enrollees are in plans for people with diabetes or cardiovascular conditions in 2025. Enrollment in I-SNPs has been generally unchanged with approximately 115,000 enrollees in 2025, the same as 2024.
Slightly less than one in five (17% or about 5.7 million) Medicare Advantage enrollees are in a group plan offered to retirees by an employer or union.
Group enrollment as a share of total Medicare Advantage enrollment has fluctuated between 17% and 20% since 2010, but the number of enrollees has increased from 1.8 million in 2010 to 5.7 million in 2025. The 2025 enrollment in group plans is essentially unchanged from 2024, the first time in about a decade that enrollment in this type of plan has been relatively flat year-to-year (Figure 5). With a group plan, an employer or union contracts with an insurer and Medicare pays the insurer a fixed amount per enrollee to provide benefits covered by Medicare. For example, 13 states provided health insurance benefits to their Medicare-eligible retirees exclusively through Medicare Advantage plans in 2024.

As with other Medicare Advantage plans, employer and union group plans may provide additional benefits and/or lower cost sharing than traditional Medicare and are eligible for bonus payments if they obtain required quality scores. The employer or union (and sometimes the retiree) may also pay an additional premium for these supplemental benefits. Group enrollees comprise a quarter or more of Medicare Advantage enrollees in eight states: Alaska (100%), Michigan (36%), New Jersey (32%), West Virginia and Maryland (29% for both), Vermont (28%), and Illinois and Kentucky (27% for both).
Medicare Advantage enrollment is highly concentrated among a small number of parent organizations.
The average Medicare beneficiary is able to choose from Medicare Advantage plans offered by 9 parent organizations in 2025, similar to 2024, and over one-third of beneficiaries (36%) can choose among Medicare Advantage plans offered by 10 or more parent organizations. (Note, these numbers are slightly different than what was reported in a previous KFF publication due to differences in how parent organizations are identified, see Methods for more details.)
UnitedHealth Group and Humana account for nearly half of all Medicare Advantage enrollees nationwide in 2025.
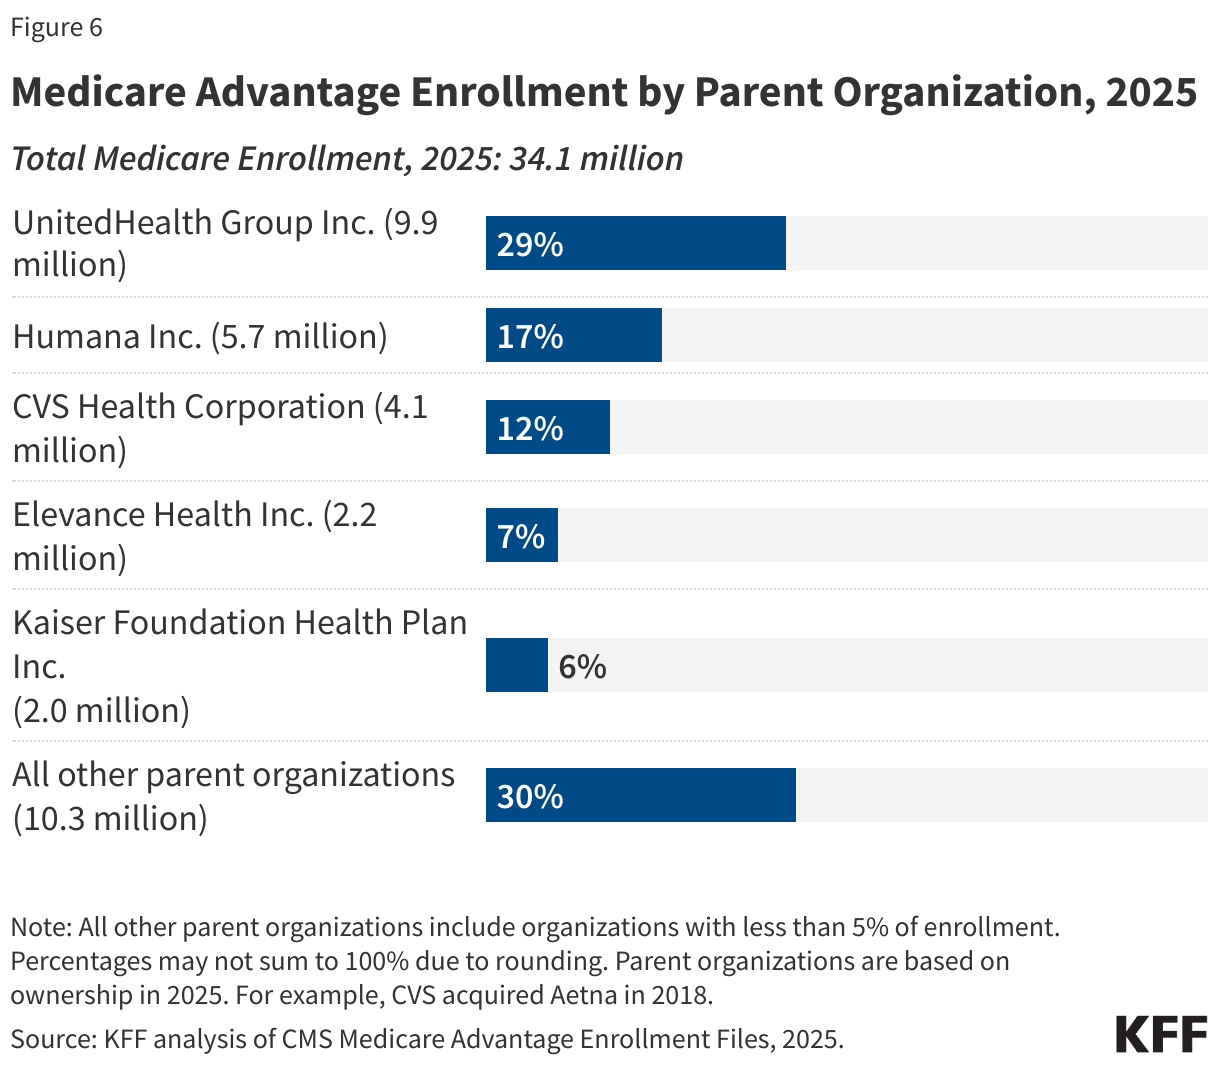
Despite most beneficiaries having access to plans operated by several parent organizations, Medicare Advantage enrollment is highly concentrated among a small number of parent organizations. UnitedHealth Group Inc. accounts for 29% of all Medicare Advantage enrollment in 2025, or 9.9 million enrollees. Together, UnitedHealth Group Inc. and Humana Inc. (17%) account for nearly half (46%) of all Medicare Advantage enrollees nationwide, nearly the same share as 2024. In more than a quarter of counties (26%; or 815 counties), these two organizations account for at least 75% of Medicare Advantage enrollment. These counties include East Baton Rouge (Baton Rouge), LA (81%), Clark County (Las Vegas), NV (75%), Travis County (Austin), TX (77%), and El Paso County (Colorado Springs), CO (72%).
Three other parent organizations comprise more than 25% of Medicare Advantage enrollment: CVS Health Corporation (12%), Elevance Health Inc, (7%), and Kaiser Foundation Health Plan Inc. (6%) (Figure 6). (In contrast, CVS Health and Centene Corporation dominate the market for stand-alone prescription drug plans (PDP) that supplement traditional Medicare, with both organizations accounting for just over half of enrollment in PDPs).
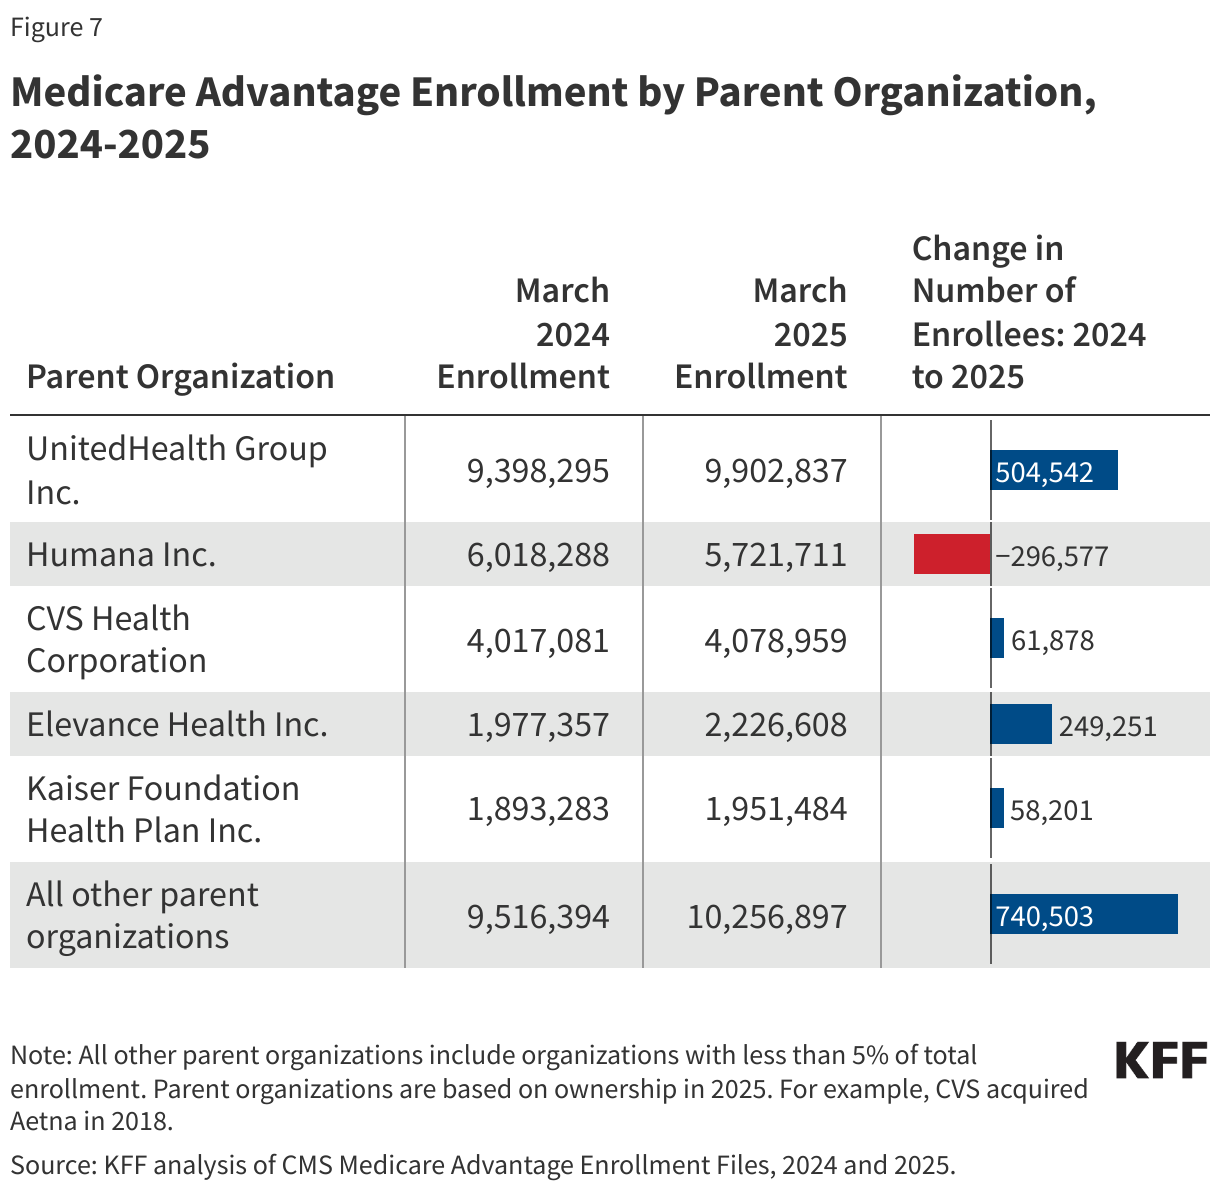
In absolute numbers, UnitedHealth Group had the largest growth in enrollment, with 505,000 more beneficiaries enrolled in a plan sponsored by UnitedHealth Group in March 2025 than in March 2024 (Figure 7). Elevance Health had the second largest growth in enrollment, with an increase of about 249,000 beneficiaries between March 2024 and March 2025.
In contrast, enrollment in Humana plans declined, decreasing by about 297,000 between March 2024 and March 2025.
UnitedHealth Group has consistently accounted for a relatively large share of Medicare Advantage enrollment.
UnitedHealth Group has had the largest share of Medicare Advantage enrollment and largest growth in enrollment since 2010, increasing from 18% of all Medicare Advantage enrollment in 2010 to 29% in 2025. Humana has also had a relatively large share of Medicare Advantage enrollment, though it has been more stable, increasing only slightly from 16% in 2010 to 17% in 2025 (data for 2010 not shown).
Nancy Ochieng, Meredith Freed, Jeannie Fuglesten Biniek, and Tricia Neuman are with KFF. Anthony Damico is an independent consultant.
Methods
This analysis uses data from the Centers for Medicare & Medicaid Services (CMS) Medicare Advantage Enrollment, Benefit and Landscape files for the respective year. KFF uses the Medicare Enrollment Dashboard for enrollment data for March 2024 and March 2025, and the CMS Chronic Conditions Data Warehouse Master Beneficiary Summary File (MBSF) for March for earlier years. Trend analysis begins in 2007 because that was the earliest year of data that was based on March enrollment. Enrollment data is only provided for plan-county combinations that have at least 11 beneficiaries; thus, this analysis excludes approximately 400,000 individuals who reside in a county where county-wide plan enrollment does not meet this threshold.
KFF calculates the share of eligible Medicare beneficiaries enrolled in Medicare Advantage, meaning they must have both Part A and B coverage. The share of enrollees in Medicare Advantage would be somewhat smaller if based on the total Medicare population that includes 5.8 million beneficiaries with Part A only or Part B only (in 2025) who are not generally eligible to enroll in a Medicare Advantage plan.
In previous years, KFF calculated the share of Medicare beneficiaries enrolled in Medicare Advantage by including Medicare beneficiaries with either Part A and/or B coverage. We modified our approach in 2022 to estimate the share enrolled among beneficiaries eligible for Medicare Advantage who have both Medicare Part A and Medicare B. In the past, the number of beneficiaries enrolled in Medicare Advantage was smaller and therefore the difference between the share enrolled with Part A and/or B vs Part A and B was also smaller. For example, in 2010, 24% of all Medicare enrollees were enrolled in Medicare Advantage versus 25% with just Parts A and B. However, these shares have diverged over time: in 2024, 49% of all Medicare beneficiaries were enrolled in Medicare Advantage versus 54% with just Parts A and B. These changes are reflected in all data displayed trending back to 2007.
Additionally, in previous years, KFF had used the term Medicare Advantage to refer to Medicare Advantage plans as well as other types of private plans, including cost plans, PACE plans, and HCPPs. However, cost plans, PACE plans, and HCPPs are now excluded from this analysis in addition to MMPs. In this analysis, KFF excludes these other plans as some may have different enrollment requirements than Medicare Advantage plans (e.g., may be available to beneficiaries with only Part B coverage) and in some cases, may be paid differently than Medicare Advantage plans. These exclusions are reflected in all data displayed trending back to 2007.
Beginning with this analysis of 2025 Medicare Advantage enrollment, KFF relies on the parent organization field reported to CMS to identify plans sponsored by the same insurer. Previously, KFF had supplemented these data with publicly available information about acquisitions, mergers, and business relationships. The previous approach led to fewer total plan sponsors.
Medicare projections for 2026-2033 are from the June Congressional Budget Office (CBO) Medicare Baseline for 2024. Using the CBO baseline, Medicare enrollment is based on individuals who are enrolled in Part B, which is designed to include only individuals who are eligible for Medicare Advantage and exclude those who only have Part A only (~6 million people in 2026) and cannot enroll in Medicare Advantage. However, it may include some individuals who have Part B only and also are not eligible for Medicare Advantage.
Enrollment counts in publications by firms operating in the Medicare Advantage market, such as company financial statements, might differ from KFF estimates due to inclusion or exclusion of certain plan types, such as SNPs or employer group health plans.