Medicaid State Fact Sheets
Medicaid and CHIP provide health and long-term care coverage to millions of low-income children and adults in the United States. The programs are jointly financed by the federal government and states and are administered by states within broad federal rules. As a result, programs vary widely across states in how many and which residents they cover and how much they spend. These differences reflect state policy choices, such as whether to adopt the ACA Medicaid expansion or set income limits above federal minimums for certain groups, as well as differences in demographic characteristics of state populations. These fact sheets provide key data on Medicaid programs in every state.
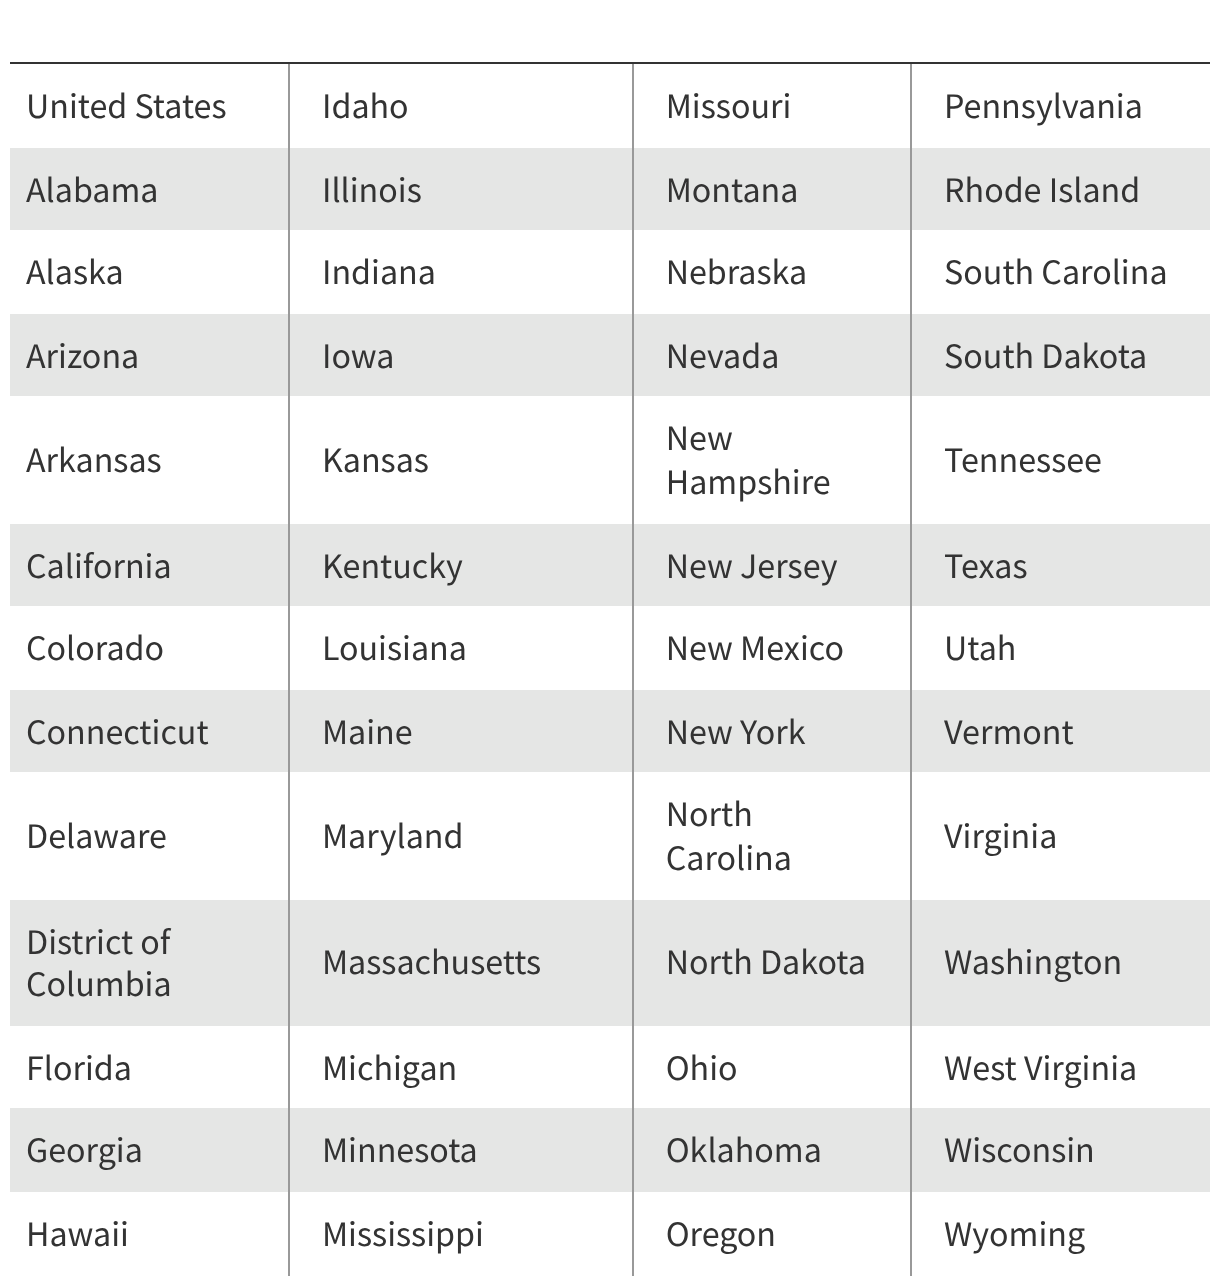
Click a state’s tooltip in the map or the state name in the table below to view the fact sheets.
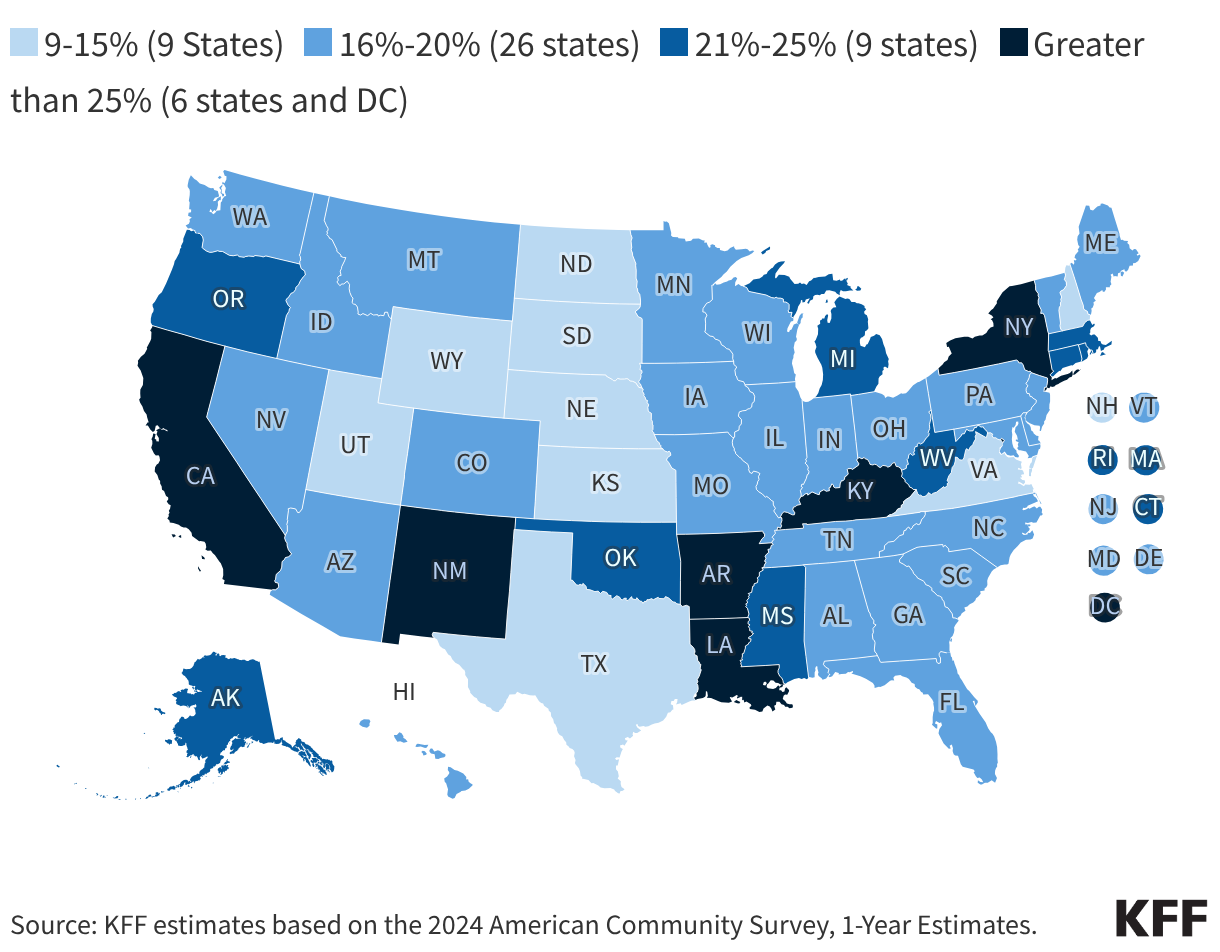
Percent of People Covered By Medicaid, 2024
Sources
The fact sheets include both state and national level data. For specific sources used in the fact sheets, see below.
Total Medicaid Enrollment
State Health Facts, Total Monthly Medicaid & CHIP Enrollment and Pre-ACA Enrollment, June 2026.
Medicaid Covers
- Births covered by Medicaid: State Health Facts, Births Financed by Medicaid by Metropolitan Status, 2024.
- Children and adults ages 19-64: State Health Facts, Medicaid Coverage Rates for People Ages 0-64 by Age, 2024.
- Working-age adults with disabilities: State Health Facts, Distribution of Adults Ages 19-64 with a Disability by Insurance Coverage, 2024.
- Medicare beneficiaries: State Health Facts, Dual-Eligible Individuals as a Share of Medicare Enrollment, 2026.
- Nursing home residents: State Health Facts, Distribution of Certified Nursing Facility Residents by Primary Payer Source, 2025.
Congressional District Maps
KFF, Congressional District Interactive Map: Medicaid Enrollment by Eligibility Group, October 2026.
Medicaid Enrollees & Spending
- Enrollees: State Health Facts, Medicaid Enrollees by Enrollment Group, 2024.
- Note: “Unknown” enrollees are not included.
- Spending: State Health Facts, Medicaid Spending by Enrollment Group, 2024.
- Note: “Unknown” expenditures are not included.
Distribution of Medicaid Spending
- Federal funding as a share of total Medicaid spending: State Health Facts, Federal and State Share of Medicaid Spending, FY 2024.
- Medicaid spending by service: State Health Facts, Distribution of Medicaid Spending by Service, FY 2024.
- Note: Values may not sum to 100% due to rounding.
- For more information on fee-for-service acute care spending, see the Distribution of Fee-for-Service Medicaid Spending on Acute Care, FY 2024.
Medicaid Expansion Status
KFF, Status of State Medicaid Expansion Decisions, 2026.
Uninsured Rate
State Health Facts, Uninsured Rates for People Ages 0-64 by Age, 2024.
Demographic Characteristics of Medicaid Enrollees
- Rural enrollees: State Health Facts, Medicaid Enrollees by Urban/Rural Status, 2024.
- Enrollees with chronic conditions: State Health Facts, Medicaid Enrollees Ages 19-64 by Number of Chronic Conditions, 2024.
Median Eligibility Levels
- 100% of FPL for family of three and individual: Department of Health & Human Services, Office of the Assistant Secretary for Planning and Evaluation. U.S. Federal Poverty Guidelines Used to Determine Financial Eligibility for Certain Programs, 2026.
- Children: State Health Facts, Medicaid and CHIP Income Eligibility Limits for Children as a Percent of the Federal Poverty Level, January 2026.
- Note: Data includes eligibility through CHIP, see SHF indicator for more information.
- Pregnant women: State Health Facts, Medicaid and CHIP Income Eligibility Limits for Pregnant Women, January 2026.
- Note: Data reflect the highest pathway for eligibility, see SHF indicator for more information.
- Parents and childless adults: State Health Facts, Medicaid Income Eligibility Limits for Adults as a Percent of the Federal Poverty Level, January 2026.
- Seniors and people with disabilities: State Health Facts, Medicaid Eligibility for SSI Enrollees and Optional Seniors & People with Disabilities Up To 100% FPL, 2026.