Medicaid Home and Community-Based Services Enrollment and Spending
Executive Summary
Medicaid fills in gaps in the overall health care system by serving as the primary source of coverage for long-term services and supports (LTSS), including home and community-based services (HCBS), as these services are typically unavailable and/or unaffordable through private insurance or Medicare. HCBS help seniors and people with disabilities and chronic illnesses live independently outside institutions by assisting with daily needs. This issue brief presents the latest (FY 2018) Medicaid HCBS enrollment and spending data from KFF’s 18th annual 50-state survey. Appendix Tables contain detailed state-level data. Key findings include the following:
- Most HCBS enrollees receive services provided at state option. Over 2.5 million individuals receive HCBS through an optional Section 1915 (c) or Section 1115 waiver, and nearly 1.2 million receive optional personal care state plan services, while 600,000 receive home health state plan services, the sole required benefit. Fewer individuals receive HCBS through the relatively newer state plan options including Section 1915 (i) and Community First Choice.
- Joint federal and state Medicaid HCBS spending totaled $92 billion in FY 2018, with nearly all spending for optional services.
- National per enrollee spending varies among the HCBS authorities, ranging from under $8,000 for Section 1915 (i) state plan services to nearly $30,000 for Section 1915 (c) waivers.
- Per enrollee spending by Section 1915 (c) waiver target population is highest for people with intellectual/developmental disabilities ($46,000). Per enrollee spending is relatively lower for seniors/adults with physical disabilities ($16,000).
State Medicaid programs will face increased pressure to meet the health and LTSS needs of a growing elderly population in the coming years, and their ability to do so could be affected by an economic downturn that could leave states with limited resources and require reductions in services offered at state option. In addition, if the ACA ultimately is struck down in Texas v. Azar, states would lose authority to offer some HCBS as well as some flexibility to design benefit packages. The 2020 elections also could have important implications for Medicaid and HCBS as policymakers may consider a range of proposals, from those that could cap federal Medicaid financing program-wide as in the President’s FY 2020 budget to proposals advocated by some Democrats to create a single, federal, universal health insurance program known as Medicare-for-all.
Issue Brief
Medicaid continues to be the primary source of coverage for long-term services and supports (LTSS), financing over half of these services in 2018 (Figure 1). LTSS help seniors and people with disabilities with self-care, such as bathing and dressing, and household activities, such as preparing meals and managing medication. LTSS needs arise from a range of conditions, such as cognitive disabilities, like dementia or Down syndrome; physical disabilities, like multiple sclerosis or spinal cord injury; mental health disabilities, like depression or schizophrenia; and disabling chronic conditions, like cancer or HIV/AIDS.1

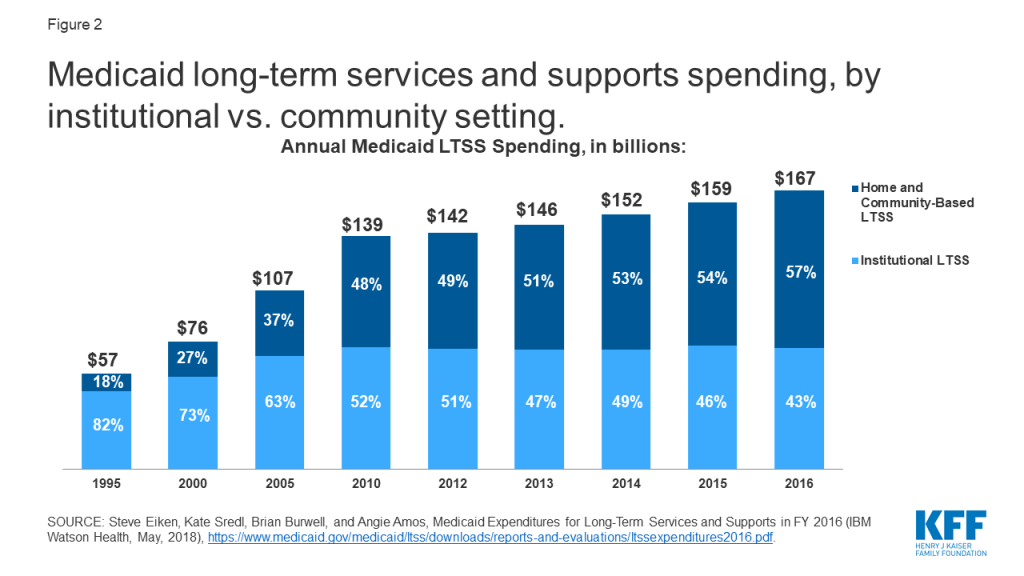
State Medicaid programs must cover LTSS in nursing homes, while most home and community-based services (HCBS) are optional.2 Spending on HCBS surpassed spending on institutional care for the first time in 2013, and comprises 57% of total Medicaid LTSS spending as of 2016 (Figure 2). Factors contributing to this trend include beneficiary preferences for HCBS, the fact that states are encouraging HCBS as an alternative to typically more costly institutional care, and states’ community integration obligations under the Americans with Disabilities Act and the Supreme Court’s Olmstead decision. In Olmstead, the Supreme Court held that the unjustified institutionalization of people with disabilities is illegal discrimination and violates the Americans with Disabilities Act.
This issue brief presents the latest (FY 2018)3 state-level Medicaid HCBS enrollment and spending data from KFF’s 18th annual survey of all 50 states and DC. The survey tracks Medicaid HCBS across four types of state plan benefits and two types of waivers, which are described in more detail in Table 1,4 and also presents enrollment and spending by target population where relevant. In general, state plan benefits are provided to all Medicaid beneficiaries for whom they are medically necessary. Waivers allow states to provide services to specific populations, set enrollment caps, and expand income and asset limits. State plan HCBS include home health; personal care; Section 1915 (i), which authorizes HCBS targeted to a particular population with functional needs that are less than an institutional level of care; and Community First Choice (CFC) attendant services and supports. HCBS waivers include Section 1915 (c) and Section 1115,5 both of which allow states to expand financial eligibility and offer HCBS to seniors and people with disabilities who would otherwise qualify for an institutional level of care, while limiting enrollment.6 The Appendix Tables contain detailed state-level data. A related brief presents the latest data and highlights themes in state HCBS policies.
| Table 1: Medicaid Home and Community Based Services (HCBS) Authorities | ||
| State Plan Benefits | ||
| Home Health Services |
| Required |
| Personal Care Services |
| Optional |
| Community First Choice |
| Optional |
| Section 1915 (i) |
| Optional |
| HCBS Waivers | ||
| Section 1915 (c) |
| Optional |
| Section 1115 |
| Optional |
HCBS Enrollment and Spending by Authority
Nearly all HCBS are provided at state option. Home health state plan services are the only HCBS that are required for states participating in Medicaid, covering 616,800 enrollees. Among the optional HCBS authorities, waivers continue to be the most commonly used. While some states have taken up Section 1915 (i) and/or CFC, these relatively newer state plan options have not supplanted waivers as the primary authority through which HCBS are provided. Personal care services are the most commonly used HCBS state plan option, offered in 34 states (Figure 3 and Appendix Table 1).
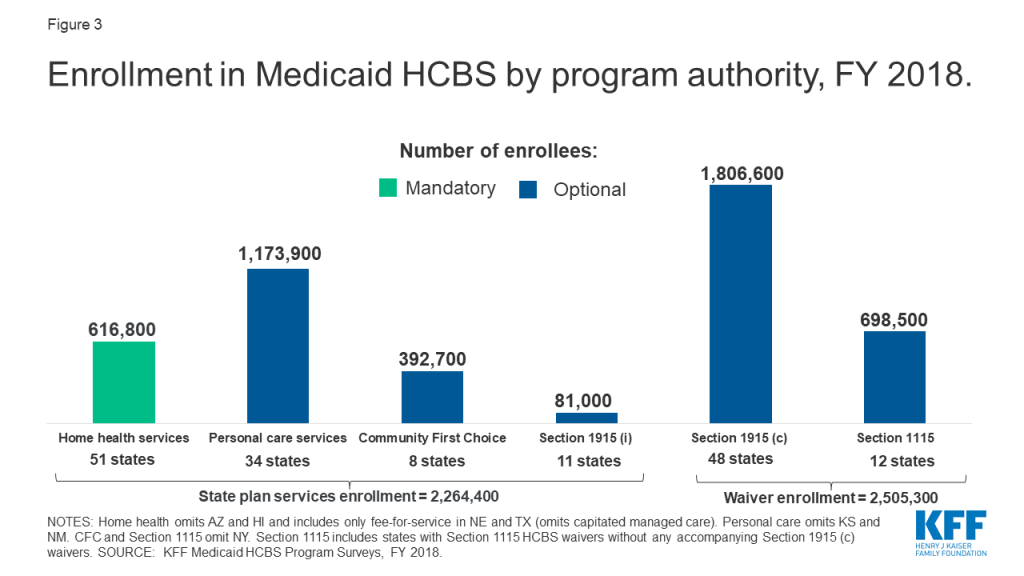
Enrollment across the various HCBS authorities ranges from 81,000 individuals receiving Section 1915 (i) state plan services to 1.8 million individuals receiving Section 1915 (c) waiver services (Figure 3 and Appendix Table 1). Most HCBS enrollees receive services provided through an optional authority. Over 2.5 million individuals receive HCBS through a Section 1915 (c) or Section 1115 waiver, and nearly 1.2 million individuals are served in the personal care state plan option, while about 600,000 individuals receive home health state plan services through the sole required HCBS benefit. Total home health state plan enrollment omits some or all individuals in four states (AZ,7 HI,8 NE,9 and TX)10 and total personal care state plan enrollment omits individuals in two states (KS11 and NM)12 that provide services through capitated managed care and cannot separately report enrollment data. In addition, New York is unable to report enrollment for CFC and Section 1115.13
HCBS enrollment under a state plan authority is slightly less than enrollment under a waiver authority (2.3 million vs. 2.5 million) (Figure 3). Total HCBS enrollment across all authorities is not presented as individuals may receive services under more than one authority. For example, in some states, an individual could receive some personal care hours through the state plan option and additional personal care hours through a Section 1915 (c) waiver. States can choose to allow enrollees to self-direct their personal care and/or home health services. Box 1 contains enrollment data for those services.
Box 1: Enrollment in Self-Directed Personal Care and Home Health State Plan Services
Nearly 700,000 people are self-directing personal care state plan services in 15 (of 20) states reporting this data.14 Self-direction typically allows enrollees to select and dismiss their direct care workers, determine worker schedules, set worker payment rates, and/or allocate their service budgets.15 The number of individuals self-directing services varies considerably from state to state. California has the greatest number of individuals (over 516,000) self-directing personal care state plan services, followed by Michigan (61,000) and Massachusetts (45,000). Self-direction of home health state plan services is less common. Among the three states that allow self-direction for home health state plan services, one state reports enrollment data (over 12,400 individuals in NJ).16
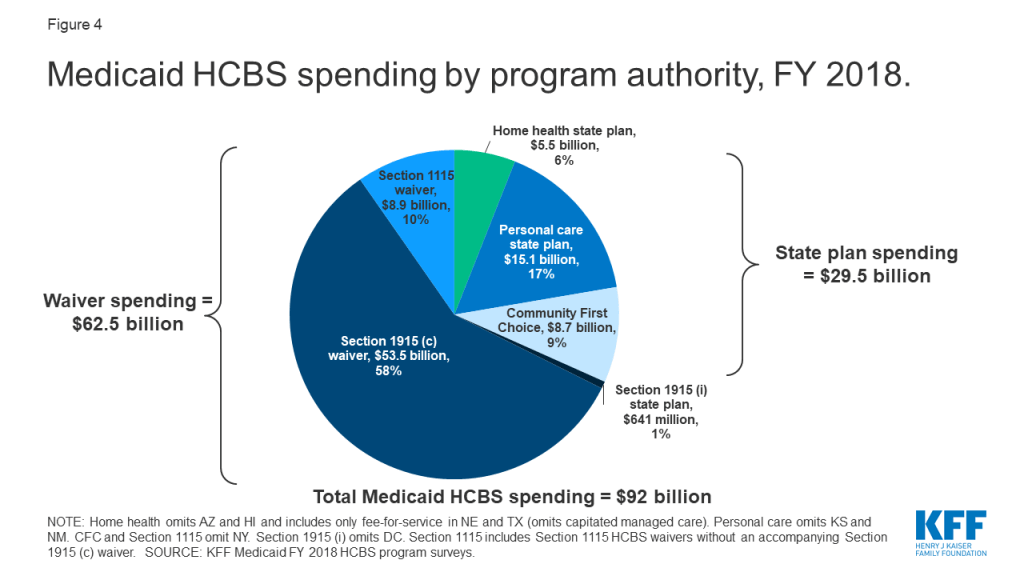
Medicaid HCBS spending totaled $92 billion in FY 2018, with nearly all spending for services provided at state option. Six percent of total HCBS spending is devoted to mandatory home health state plan services (Figure 4 and Appendix Table 2). Additionally, over two-thirds of all Medicaid HCBS spending is on services provided under a waiver authority compared to a state plan authority. Total spending under a state plan authority is under $30 billion, or about one-third of total Medicaid HCBS spending. Total home health state plan spending omits some or all spending in four states (AZ,17 HI,18 NE,19 and TX)20 and total personal care state plan spending omits two states (KS21 and NM0)22 that provide services through capitated managed care and cannot separately report spending data. In addition, New York is unable to report spending for CFC and Section 1115,23 and DC is unable to report spending for Section 1915 (i).
National per enrollee spending varies among the HCBS authorities, ranging from under $8,000 for Section 1915 (i) state plan services to nearly $30,000 for Section 1915 (c) waivers (Figure 5 and Appendix Table 3). This variation likely is due to the type and extent of services provided in the different HCBS authorities. For example:
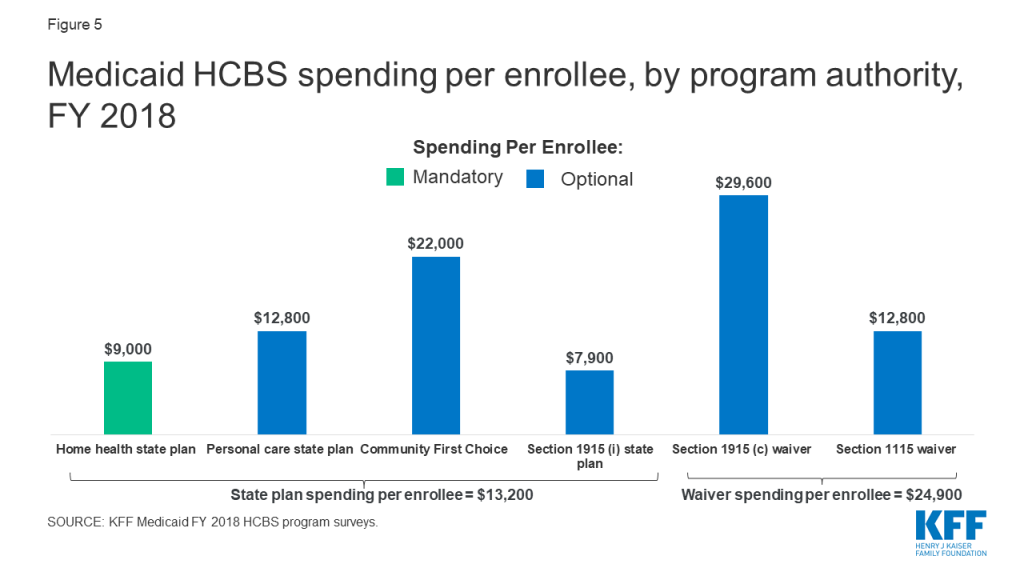
- Lower per enrollee spending for Section 1915 (i) compared to other authorities may reflect that Section 1915 (i) serves enrollees with functional needs that are less than an institutional level of care. By contrast, Section 1915 (c) waivers generally require enrollees to meet an institutional level of care and therefore are likely to serve individuals with more extensive and intensive – and therefore generally costlier — service needs.
- Lower per enrollee spending on home health state plan services compared to other authorities likely reflects shorter periods of service utilization. In contrast, Section 1915 (c) waiver enrollees typically use services over an extended period of time, due to chronic long-term needs.24
- Lower per enrollee spending for Section 1115 waivers compared to Section 1915 (c) waivers may reflect that most Section 1115 waiver states use this authority for seniors and adults with physical disabilities but continue to serve people with intellectual or developmental disabilities (I/DD), the costliest population, through Section 1915 (c).
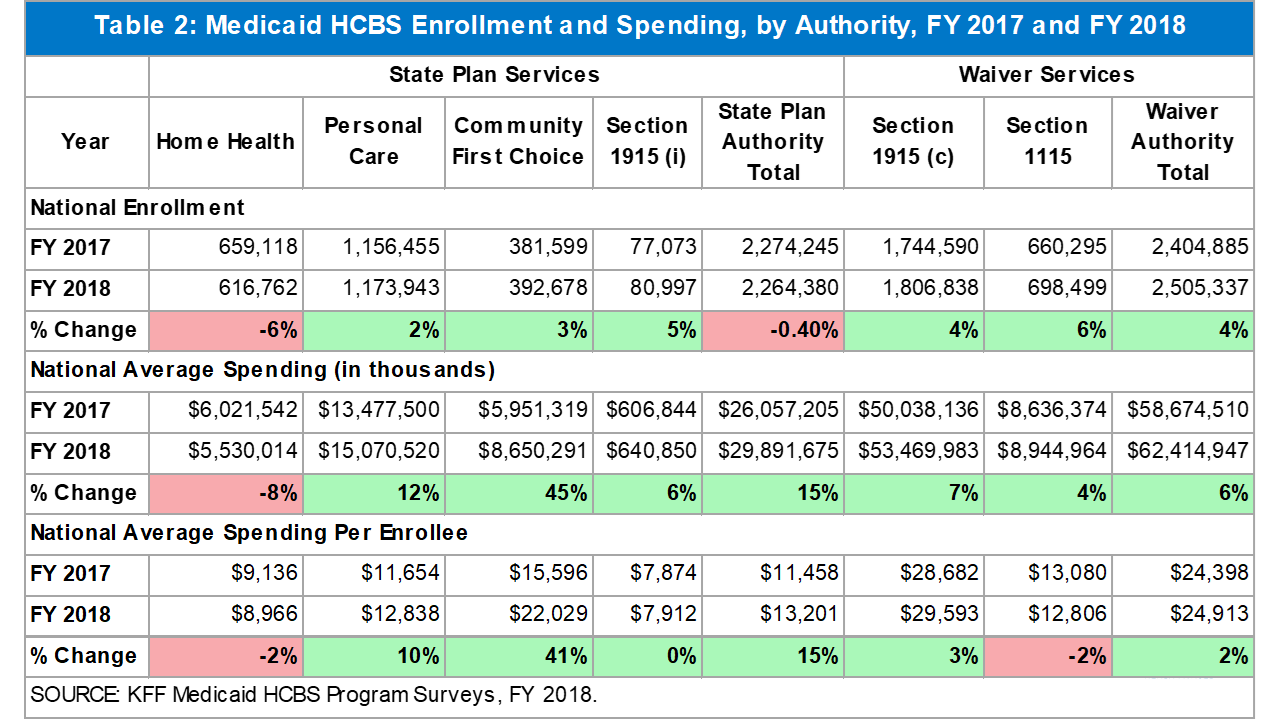
Enrollment and spending increased in each HCBS authority from FY 2017 to FY 2018, except home health state plan services (Table 2).25 The two authorities with the largest percent increases in total spending were CFC and personal care state plan services; spending increases in these authorities appear to be driven by increased per enrollee costs rather than by increased enrollment. Notable state-level changes from FY 2017 to FY 2018 include the following:
- Sizeable growth in CFC total spending and spending per enrollee is largely attributable to substantially increased spending in California (76%). More modest growth in CFC enrollment primarily reflects an increase from 61,000 to nearly 80,000 individuals in Washington.
- Increased total spending and spending per enrollee for personal care state plan services reflects notable spending growth in South Dakota, Colorado, and California. Although enrollment in personal care state plan services increased slightly across all states electing this option, two states (MD and MT) had enrollment declines in both FY 2017 and FY 2018, as individuals transitioned to CFC services.
- Growth in Section 1915 (c) waiver spending reflects notable increases in Nebraska (36%) and Pennsylvania (19%). Specifically, spending in one I/DD waiver in Nebraska grew substantially (87%), while spending in three Pennsylvania waivers serving seniors and adults with physical disabilities and individuals with I/DD grew by more than 20 percent.
- Growth in Section 1115 waiver enrollment was driven by an increase in New Jersey (19%).
- Growth in Section 1915 (i) enrollment is largely due to an increase from 3,100 to 7,000 individuals in Ohio.
Home health state plan services is the only authority with both enrollment and spending declines, which could be attributable at least in part to increased enrollment in capitated managed care, and states’ inability to isolate home health enrollment and spending from other services included in the capitation payment. States with substantial home health state plan enrollment declines as a result of such data limitations include Texas (-55%) and Nebraska (-85%). Overall enrollment across all HCBS state plan authorities also decreased from FY 2017 to FY 2018, likely driven by the home health decrease.
HCBS Enrollment and Spending by Target Population
Section 1915 (c) waivers26
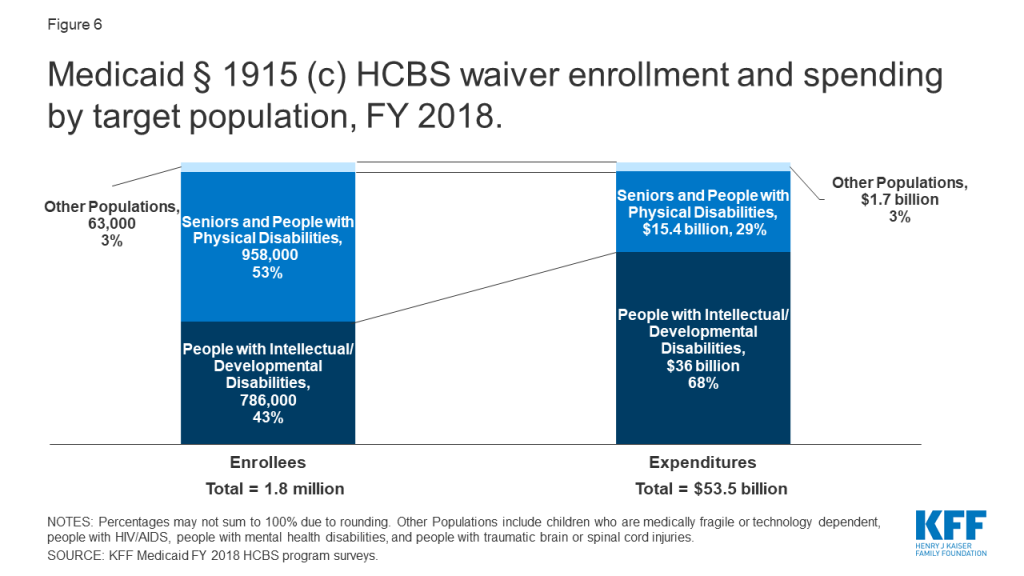
People with I/DD account for less than half of overall Section 1915 (c) waiver enrollment but more than two-thirds of spending (Figure 6 and Appendix Tables 4 and 5).27 Spending for this population is disproportionate to their enrollment as a result of their generally more intensive needs. By contrast, seniors and people with physical disabilities comprise over half of Section 1915 (c) waiver enrollment and over a quarter of spending.28 Other target populations, including people with mental health disabilities,29 people with traumatic brain or spinal cord injuries (TBI/SCI),30 children who are medically fragile or technology dependent,31 and people with HIV/AIDS,32 together account for a small share of Section 1915 (c) waiver enrollment and spending.
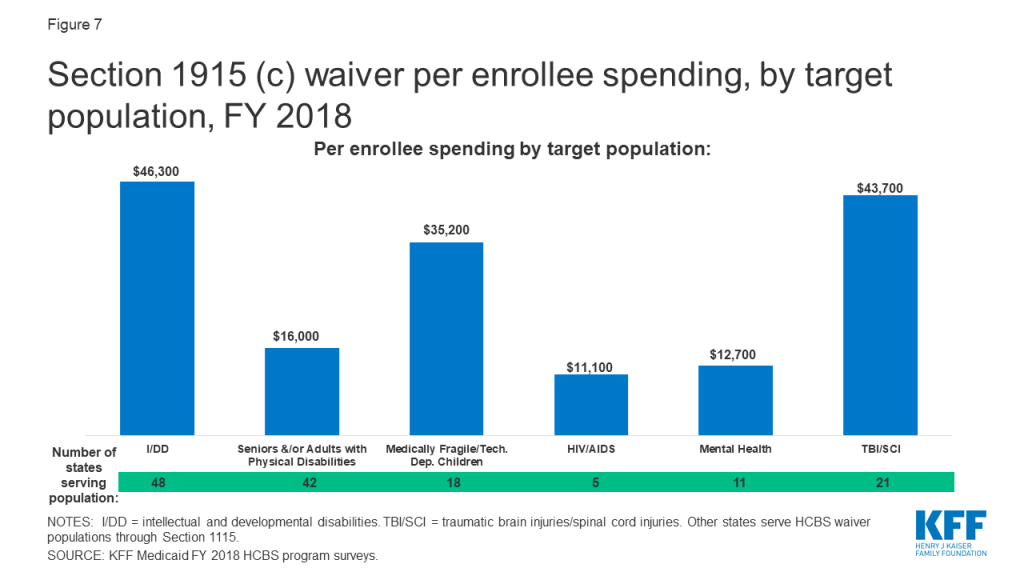
The fact that services for people with I/DD comprise over two-thirds of total Section 1915 (c) waiver spending reflects high per enrollee costs for this population. There is substantial variation in per enrollee spending among Section 1915 (c) waiver target populations, ranging from about $11,000 for people with HIV/AIDS to over $46,000 for people with I/DD (Figure 7 and Appendix Table 6). Per enrollee spending for people with I/DD is closely followed by the TBI/SCI population ($44,000) and medically fragile children ($35,000). In addition to people with HIV/AIDS, per enrollee spending is relatively lower for seniors and adults with physical disabilities ($16,000) and people with mental health disabilities ($13,000).
Section 1915 (i) state plan option
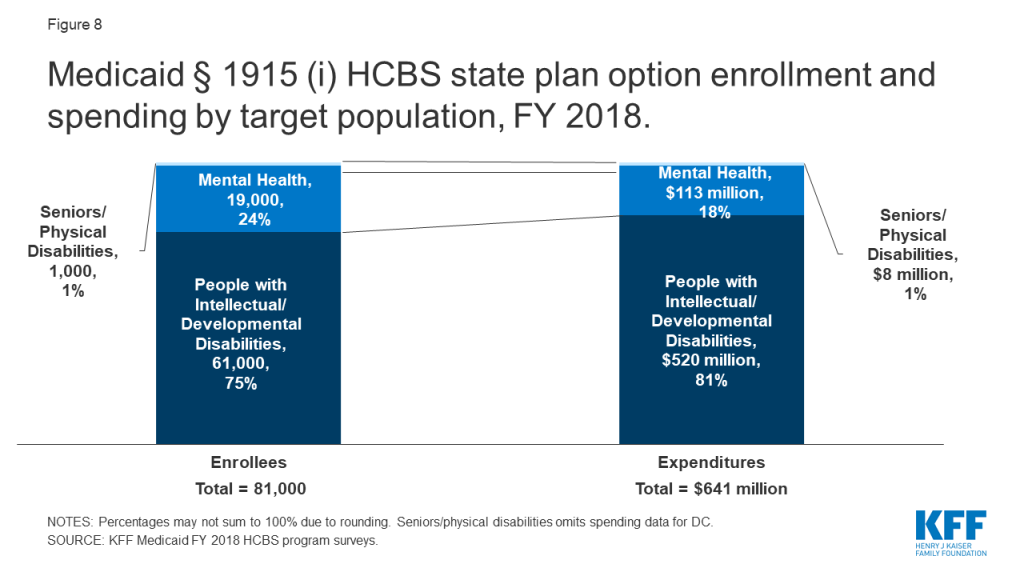
People with I/DD account for the vast majority of enrollment and spending in the Section 1915 (i) state plan option, largely due to California’s program (Figure 8).33 Unlike waivers which require an institutional level of care, Section 1915 (i) state plan HCBS are provided to people with functional needs that are less than an institutional level of care. The next largest Section 1915 (i) target population for both enrollment and spending is people with mental health disabilities.34 Nearly three-quarters of Section 1915 (i) enrollment for this population is in Iowa and Ohio, while Iowa’s program comprises most of the spending ($94 million). Seniors and adults with physical disabilities account for a very small share of Section 1915 (i) enrollment and spending.35
Per enrollee spending is similar across Section 1915 (i) state plan HCBS target populations. Section 1915 (i) state plan HCBS per enrollee spending was nearly $10,000 (in 2 of 3 states reporting)36 for seniors and adults with physical disabilities, less than $9,000 for people with I/DD (in 4 states),37 and under $6,000 for people with mental health disabilities (in 4 states).38 Lower per enrollee spending for Section 1915 (i) state plan HCBS compared to Section 1915 (c) waivers could reflect a more limited scope benefit package and/or the fact that Section 1915 (i) enrollees have fewer and/or less intensive needs (less than an institutional level of care) that Section 1915 (c) waiver enrollees (who must meet an institutional level of care).
Looking Ahead
Medicaid HCBS enrollment ranges from 81,000 individuals receiving Section 1915 (i) state plan services to 1.8 million individuals receiving Section 1915 (c) waiver services, with joint federal and state spending across all HCBS authorities totaling $92 billion in FY 2018. Medicaid HCBS promote independence and self-determination for seniors and people with disabilities and chronic conditions by enabling them to receive assistance with self-care needs and household activities outside an institution. Medicaid provides substantial federal funding to help states meet their community integration obligations under Olmstead and the Americans with Disabilities Act.
Most HCBS enrollees receive services provided through an optional authority, and nearly all HCBS spending is devoted to authorities provided at state option. Although home health state plan services are the only HCBS that states participating in Medicaid must offer, all states elect at least one optional HCBS authority. While nearly all Medicaid HCBS authorities are optional, Medicaid fills a gap by covering HCBS that are typically not available through private insurance or Medicare, and not affordable for many paying out-of-pocket, especially those with lower incomes. The optional nature of most HCBS results in substantial variation across states in enrollment and spending, reflecting states’ different choices about optional authorities, benefit package contents, and scope of covered services. States would lose some of their existing optional HCBS authorities and flexibility if the entire ACA ultimately is struck down in Texas v. Azar.39 Specifically, the option to offer CFC services would cease to exist, as would provisions that provide states with the flexibility to offer the current full scope of Section 1915 (i) services and to target those services to specific populations.40
The optional nature of most HCBS has implications for federal and state spending, especially during economic recessions. States face increasing pressures from revenue shortfalls during times of economic downturn. Optional Medicaid eligibility pathways and services, including HCBS, may be at risk for cuts as states must make difficult choices to balance their budgets.41
The 2020 elections also could have important implications for Medicaid and HCBS as policymakers may consider a range of proposals that could affect these populations and services. At one end of the spectrum, a Medicaid program-wide federal financing cap is proposed in President Trump’s FY 2020 budget, though efforts to repeal and replace the ACA and cap federal Medicaid funding through a block grant or per capita cap were narrowly defeated in Congress in 2017.42 In addition, Tennessee has submitted a proposal to CMS that seeks capped federal Medicaid funding through a Section 1115 waiver pursuant to state legislation that includes some seniors, nonelderly adults with physical disabilities, and children and adults with I/DD receiving HCBS.43 Depending on how they are structured, policies that would cap federal Medicaid funding could affect coverage, services, provider payment rates, and access to care for vulnerable populations.
At the other end of the policy spectrum, continued attention to Medicaid HCBS enrollment and spending is important to understanding proposals from some Democrats to create a single, federal, universal health insurance program known as Medicare-for-all. One of the most fundamental changes under Medicare-for-all would be uniform coverage of community-based long-term care services for all Americans. The current Medicare-for-all proposals would require and explicitly prioritize HCBS over institutional services, eliminating the state variation in eligibility, benefits, and payment and delivery systems that exists today under Medicaid, while also shifting responsibility for designing and implementing much of health policy from states to the federal government.44
While the economy, the litigation challenging the ACA, and the upcoming election all will have implications for Medicaid and HCBS, changing demographics also will result in increased pressure for states to meet the health and LTSS needs of a growing elderly population in the coming years. The number of adults age 65 and older is expected to more than double in size between 2014 and 2060, with the largest increase during this period (18 million) expected in this decade, from 2020 to 2030.45 With the aging of the baby boomers, one in five U.S. residents will be age 65 or older by 2030,46 and for the first time in U.S. history, older adults are projected to outnumber children by 2034.47 All of these factors make continued attention to Medicaid’s role in providing HCBS an important policy area to watch.
MaryBeth Musumeci and Priya Chidambaram are with KFF.Molly O’Malley Watts is with Watts Health Policy Consulting.
Appendix Tables
Appendix Table 1: Medicaid HCBS Enrollment, by State and Authority, FY 2018
Appendix Table 2: Medicaid HCBS Spending, by State and Authority, FY 2018
Appendix Table 3: Medicaid HCBS Spending Per Enrollee, by State and Authority, FY 2018
Appendix Table 4: Medicaid Section 1915 (c) HCBS Waiver Enrollment, by Target Population and State, FY 2018
Appendix Table 5: Medicaid Section 1915 (c) HCBS Waiver Spending, by Target Population and State, FY 2018
Appendix Table 6: Medicaid Section 1915 (c) HCBS Waiver Spending Per Enrollee, by Target Population and State, FY 2018
| Appendix Table 1: Medicaid HCBS Enrollment, By State and Authority, FY 2018 | ||||||
| State | State Plan Services | Waivers | ||||
| Home health | Personal care | Community First Choice | Section 1915 (i) | Section 1915 (c) | Section 1115 | |
| Alabama | 5,900 | 15,100 | ||||
| Alaska | 300 | 3,700 | 4,300 | |||
| Arizona | included in 1115 | 52,400 | ||||
| Arkansas | 5,000* | 13,700 | 15,500* | |||
| California | 37,500* | 273,800 | 228,200 | 55,800 | 149,500 | 474,300* |
| Colorado | 23,500 | 100 | 46,300* | |||
| Connecticut | 30,700 | 3,200 | 600 | 28,300 | ||
| Delaware | 14,000 | 400 | 1,200 | 6,900 | ||
| DC | 8,600* | 6,000* | 200* | 6,900* | ||
| Florida | 20,800 | 3,200 | 102,500 | |||
| Georgia | 6,200 | 42,600 | ||||
| Hawaii | included in 1115 | 2,900 | 8,500 | |||
| Idaho | 1,900 | 8,500 | 4,000 | 20,200 | ||
| Illinois | 14,400 | 161,600* | ||||
| Indiana | 16,300 | 4,700 | 49,100 | |||
| Iowa | 12,400 | 7,100 | 30,400* | |||
| Kansas | 3,300 | included in 1115 | 28,700 | |||
| Kentucky | 15,400 | 24,300* | ||||
| Louisiana | 6,600 | 14,200 | 20,600 | |||
| Maine | 1,900 | 3,300 | 7,500 | |||
| Maryland | 4,000 | 1,000 | 13,500 | 25,800 | ||
| Massachusetts | 52,200 | 45,000 | 30,600* | |||
| Michigan | 3,300 | 60,700 | 24,700 | |||
| Minnesota | 28,900 | 43,700 | 81,500 | |||
| Mississippi | 1,400 | 700 | 25,800 | |||
| Missouri | 4,100 | 65,600 | 33,900 | |||
| Montana | 600 | 500 | 3,400 | 5,700 | ||
| Nebraska | 200^ | 3,800 | 11,800 | |||
| Nevada | 1,300 | 10,300 | 200 | 5,700 | ||
| New Hampshire | 1,400* | 100* | 9,200 | |||
| New Jersey | 50,300 | 49,500 | 10,700* | 25,000 | ||
| New Mexico | 4,000 | included in 1115 | 5,100 | 28,000 | ||
| New York | 101,400* | 116,200* | NR | 98,000* | NR | |
| North Carolina | 9,900 | 44,700 | 25,300* | |||
| North Dakota | 1,100 | 1,300 | 5,800* | |||
| Ohio | 26,900 | 7,000 | 111,400 | |||
| Oklahoma | 3,600 | 3,800 | 26,200* | |||
| Oregon | 300 | 3,100 | 36,500 | 64,200* | ||
| Pennsylvania | 26,300 | 119,700 | ||||
| Rhode Island | 8,800 | 400 | 5,500 | |||
| South Carolina | 500 | 35,200* | ||||
| South Dakota | 11,200 | 1,600 | 5,900* | |||
| Tennessee | 11,200 | 7,800 | 17,500 | |||
| Texas | 11,600^ | 369,700 | 30,000 | 200 | 48,100 | 68,800 |
| Utah | 3,100 | 200 | 9,300 | |||
| Vermont | 3,700 | 1,400 | 10,600 | |||
| Virginia | 1,600 | 51,300* | ||||
| Washington | 4,600 | 1,200 | 77,900 | 64,500 | 1,000 | |
| West Virginia | 8,100 | 5,700 | 10,900 | |||
| Wisconsin | 5,900 | 17,900 | 89,900 | |||
| Wyoming | 400 | 5,300* | ||||
| U.S. TOTAL(51 states): | 616,800(51 states) | 1,173,900(34 states) | 392,700(8 states) | 81,000(11 states) | 1,806,600(48 states) | 698,500(12 states) |
| NOTES: Totals may not sum due to rounding. NR indicates state did not report data. Included in 1115 indicates that state was unable to report state plan services separately from Section 1115 waiver services. Blank cell indicates state does not elect option. Total HCBS enrollment across all authorities is not presented as individuals may receive services under more than one authority. *Data from year other than FY 2018, as noted in table endnotes. ^NE and TX home health data are fee-for-service only and exclude capitated managed care.SOURCE: KFF Medicaid HCBS Program Surveys, FY 2018. | ||||||
| Appendix Table 2: Medicaid HCBS Spending, By State and Authority, FY 2018 ($, in thousands) | |||||||
| State | State Plan Services | Waivers | Total HCBSSpending | ||||
| Home health | Personal care | Community First Choice | Section 1915 (i) | Section 1915 (c) | Section 1115 | ||
| Alabama | 30,700 | 437,500 | 468,200 | ||||
| Alaska | 1,400 | 61,900 | 265,100 | 328,400 | |||
| Arizona | included in 1115 | 1,544,700 | 1,544,700 | ||||
| Arkansas | 11,800* | 94,300 | 389,600* | 495,700 | |||
| California | 153,900* | 2,960,800 | 5,562,600 | 494,600 | 3,810,300 | 4,679,100* | 17,661,300 |
| Colorado | 345,800 | 1,200 | 903,700* | 1,250,700 | |||
| Connecticut | 203,700 | 85,300 | 6,100 | 1,358,600 | 1,653,700 | ||
| Delaware | 63,900 | 500 | 137,200 | 87,200 | 288,800 | ||
| DC | 229,500* | 254,000* | NR | 295,000* | 778,500 | ||
| Florida | 413,100 | 63,200 | 2,103,500 | 2,579,800 | |||
| Georgia | 4,700 | 1,212,900 | 1,217,600 | ||||
| Hawaii | included in 1115 | 135,600 | 104,200 | 239,800 | |||
| Idaho | 5,500 | 58,600 | 17,500* | 364,000 | 445,600 | ||
| Illinois | 73,400 | 1,285,500* | 1,358,900 | ||||
| Indiana | 115,800 | 10,600 | 1,083,500 | 1,209,900 | |||
| Iowa | 44,600 | 94,400 | 647,900 | 786,900 | |||
| Kansas | 7,300 | Included in 1115 | 1,198,300 | 1,205,600 | |||
| Kentucky | 30,500 | 805,100* | 835,600 | ||||
| Louisiana | 30,200 | 170,500 | 571,300 | 772,000 | |||
| Maine | 3,200 | 31,400 | 441,300 | 475,900 | |||
| Maryland | 2,900 | 7,300 | 300,400 | 1,145,200 | 1,455,800 | ||
| Massachusetts | 513,600 | 794,600 | 1,563,900* | 2,872,100 | |||
| Michigan | 3,900 | 328,200 | 789,200* | 1,121,300 | |||
| Minnesota | 67,800 | 1,017,200 | 2,911,800 | 3,996,800 | |||
| Mississippi | 1,600 | 7,600 | 400,800 | 410,000 | |||
| Missouri | 4,800 | 741,700 | 1,024,900 | 1,771,400 | |||
| Montana | 600 | 900 | 45,500 | 161,000 | 208,000 | ||
| Nebraska | 100^ | 15,400 | 365,700 | 381,200 | |||
| Nevada | 23,800 | 111,200 | 2,000 | 133,200 | 270,200 | ||
| New Hampshire | 6,500* | 4,300* | 315,700* | 326,500 | |||
| New Jersey | 61,400 | 557,900 | 605,000* | 183,000 | 1,407,300 | ||
| New Mexico | 12,000 | included in 1115 | 379,900 | 329,400 | 721,310 | ||
| New York | 2,306,700* | 3,274,500* | NR | 6,426,100* | NR | 12,007,300 | |
| North Carolina | 12,800 | 450,500 | 897,500* | 1,360,800 | |||
| North Dakota | 9,800 | 37,000 | 206,800* | 253,600 | |||
| Ohio | 216,700 | 3,200 | 2,871,200 | 3,091,100 | |||
| Oklahoma | 15,700 | 10,900 | 476,400* | 503,000 | |||
| Oregon | 300 | 7,100 | 673,700 | 100,700* | 781,800 | ||
| Pennsylvania | 30,200 | 6,023,100 | 6,053,300 | ||||
| Rhode Island | 115,400 | 6,300 | 71,800 | 193,500 | |||
| South Carolina | 4,200 | 657,700* | 661,900 | ||||
| South Dakota | 15,500 | 7,400 | 145,300* | 168,200 | |||
| Tennessee | 226,500 | 684,400 | 297,400 | 1,208,300 | |||
| Texas | 13,900^ | 3,637,700 | 550,300 | 4,400 | 1,946,400 | 1,245,100 | 7,397,800 |
| Utah | 21,000 | 800 | 357,600 | 379,400 | |||
| Vermont | 7,600 | 13,900 | 401,700 | 423,200 | |||
| Virginia | 1,900 | 1,684,800* | 1,686,700 | ||||
| Washington | 6,000 | 6,400 | 1,432,500 | 728,600 | 1,300 | 2,174,800 | |
| West Virginia | 9,400 | 69,400 | 406,300 | 485,100 | |||
| Wisconsin | 46,000 | 273,700 | 2,451,600 | 2,771,300 | |||
| Wyoming | 2,300 | 163,500* | 165,800 | ||||
| U.S. TOTAL: | 5,530,000(51 states) | 15,070,500(34 states) | 8,650,300(8 states) | 640,900(11 states) | 53,470,000(48 states) | 8,945,000(12 states) | 92,306,600 |
| NOTES: Totals may not sum due to rounding. NR indicates state did not report data. Included in 1115 indicates that state was unable to report state plan services separately from Section 1115 waiver services. Blank cell indicates state did not elect option. *Data from year other than FY 2018, as noted in table endnotes. ^NE and TX home health data are fee-for-service only and exclude capitated managed care.SOURCE: KFF Medicaid HCBS Program Surveys, FY 2018. | |||||||
| Appendix Table 3: Medicaid HCBS Spending Per Enrollee, By State and Authority, FY 2018 ($) | ||||||
| State | State Plan Services | Waivers | ||||
| Home health | Personal care | Community First Choice | Section 1915 (i) | Section 1915 (c) | Section 1115 | |
| Alabama | 5,200 | 29,000 | ||||
| Alaska | 4,500 | 16,900 | 61,100 | |||
| Arizona | included in 1115 | 29,500 | ||||
| Arkansas | 2,300* | 6,900 | 25,200* | |||
| California | 4,100* | 5,400 | 24,400 | 8,900 | 25,500 | 9,900* |
| Colorado | 14,700 | 11,100 | 19,500* | |||
| Connecticut | 6,600 | 26,600 | 9,800 | 48,100 | ||
| Delaware | 4,600 | 1,200 | 119,200 | 12,700 | ||
| DC | 26,800* | 42,000* | NR | 42,500* | ||
| Florida | 19,800 | 20,000 | 20,500 | |||
| Georgia | 800 | 28,500 | ||||
| Hawaii | included in 1115 | 47,400 | 12,200 | |||
| Idaho | 2,900 | 5,400 | 7,600* | 18,000 | ||
| Illinois | 5,100 | 8,000* | ||||
| Indiana | 7,100 | 2,200 | 22,000 | |||
| Iowa | 3,600 | 13,200 | 21,300* | |||
| Kansas | 2,200 | included in 1115 | 41,700 | |||
| Kentucky | 2,000 | 33,100* | ||||
| Louisiana | 4,500 | 12,000 | 27,700 | |||
| Maine | 1,700 | 9,500 | 59,200 | |||
| Maryland | 700 | 7,500 | 22,300 | 44,400 | ||
| Massachusetts | 9,800 | 17,600 | 51,100* | |||
| Michigan | 1,200 | 5,400 | 32,000* | |||
| Minnesota | 2,300 | 23,300 | 35,700 | |||
| Mississippi | 1,100 | 10,500 | 15,500 | |||
| Missouri | 1,200 | 11,300 | 30,300 | |||
| Montana | 1,000 | 1,800 | 13,200 | 28,200 | ||
| Nebraska | 300 | 4,000 | 31,100 | |||
| Nevada | 18,100 | 10,800 | 10,600 | 23,200 | ||
| New Hampshire | 4,700* | 35,200* | 34,300* | |||
| New Jersey | 1,200 | 11,300 | 56,500* | 7,300 | ||
| New Mexico | 3,000 | included in 1115 | 75,200 | 11,800 | ||
| New York | 22,700* | 28,200* | NR | 65,600* | NR | |
| North Carolina | 1,300 | 10,100 | 35,500* | |||
| North Dakota | 8,900 | 29,200 | 35,800* | |||
| Ohio | 8,100 | 500 | 25,800 | |||
| Oklahoma | 4,400 | 2,900 | 18,200* | |||
| Oregon | 1,000 | 2,300 | 18,500 | 1,600* | ||
| Pennsylvania | 1,200 | 50,300* | ||||
| Rhode Island | 13,100 | 15,200 | 13,000 | |||
| South Carolina | 7,900 | 18,700* | ||||
| South Dakota | 1,400 | 4,700 | 24,500* | |||
| Tennessee | 20,200 | 87,400 | 17,000 | |||
| Texas | 1,200 | 9,800 | 18,300 | 27,500 | 40,500 | 18,100 |
| Utah | 6,900 | 5,200 | 38,600 | |||
| Vermont | 2,100 | 9,700 | 37,900 | |||
| Virginia | 1,200 | 32,800* | ||||
| Washington | 1,300 | 5,300 | 18,400 | 11,300 | 1,300 | |
| West Virginia | 1,200 | 12,100 | 37,300 | |||
| Wisconsin | 7,800 | 15,300 | 27,300 | |||
| Wyoming | 5,900 | 30,900* | ||||
| U.S. TOTAL: | 9,000(51 states) | 12,800(34 states) | 22,000(8 states) | 7,900(11 states) | 29,600(48 states) | 12,800(12 states) |
| NOTES: Totals may not sum due to rounding. NR indicates state did not report data. Included in 1115 indicates that state was unable to report state plan services separately from Section 1115 waiver services. Blank cell indicates state did not elect option. *Data from year other than FY 2018, as noted in table endnotes.SOURCE: KFF Medicaid HCBS Program Surveys, FY 2018. | ||||||
| Appendix Table 4: Medicaid Section 1915 (c) HCBS Waiver Enrollment, by Target Population and by State, FY 2018 | |||||||||||
| State | Total No. of§ 1915 (c) Waivers | Enrollment by Target Population | Total | ||||||||
| I/DD | Seniors | Seniors & Adults with Physical Disabilities | Adults with Physical Disabilities | Med. Fragile/Tech Dep. Children | HIV/AIDS | Mental Health | TBI/SCI | ||||
| Alabama | 6 | 5,500 | 8,900 | 600 | 15,100 | ||||||
| Alaska | 4 | 2,200 | 2,000 | 200 | 4,300 | ||||||
| Arkansas | 4 | 4,500* | 11,000 | 15,500 | |||||||
| California | 7 | 129,100 | 10,500 | 4,600 | 3,800 | 300 | 1,200 | 149,500 | |||
| Colorado | 11 | 12,500* | 27,400* | 1,800* | 4,000* | 600* | 46,300 | ||||
| Connecticut | 11 | 10,200 | 15,300 | 1,100 | 300 | 800 | 600 | 28,300 | |||
| Delaware | 1 | 1,200 | 1,200 | ||||||||
| DC | 2 | 3,300* | 3,700* | 6,900 | |||||||
| Florida | 4 | 31,800 | 70,800 | < 50 | 102,500 | ||||||
| Georgia | 4 | 13,000 | 28,100 | 1,500 | 42,600 | ||||||
| Hawaii | 1 | 2,900 | 2,900 | ||||||||
| Idaho | 4 | 8,800 | 11,500 | 20,200 | |||||||
| Illinois | 9 | 22,800* | 84,700* | 10,800* | 36,100* | 900* | 1,500* | 4,900* | 161,600 | ||
| Indiana | 4 | 26,600 | 22,300 | 200 | 49,100 | ||||||
| Iowa | 7 | 12,600 | 12,600 | 2,800 | < 50 | 1,000 | 1,400 | 30,400 | |||
| Kansas | 7 | 9,600 | 6,000 | 6,700 | 600 | 5,300 | 500 | 28,700 | |||
| Kentucky | 6 | 14,800 | 9,000* | < 50 | 500 | 24,300 | |||||
| Louisiana | 7 | 12,100 | 5,900 | 2,600 | 20,600 | ||||||
| Maine | 5 | 5,300 | 1,900 | 200 | 7,500 | ||||||
| Maryland | 6 | 16,200 | 9,200 | 200 | 100 | 25,800 | |||||
| Massachusetts | 10 | 15,600* | 14,600* | 500* | 30,600 | ||||||
| Michigan | 4 | 8,700 | 15,300 | 700 | 24,700 | ||||||
| Minnesota | 5 | 19,900 | 30,300 | 29,400 | 600 | 1,300 | 81,500 | ||||
| Mississippi | 5 | 2,600 | 20,000 | 2,400 | 800 | 25,800 | |||||
| Missouri | 9 | 15,000 | 16,500 | 2,300 | 100 | 33,900 | |||||
| Montana | 4 | 2,700 | 2,600 | 400 | 5,700 | ||||||
| Nebraska | 5 | 4,900 | 6,900 | <50 | 11,800 | ||||||
| Nevada | 3 | 2,200 | 2,700 | 800 | 5,700 | ||||||
| New Hampshire | 4 | 5,100 | 3,900 | 300 | 9,200 | ||||||
| New Jersey | 1 | 10,700* | 10,700 | ||||||||
| New Mexico | 3 | 5,100 | 5,100 | ||||||||
| New York | 9 | 85,400* | 2,500* | 600* | 6,400 | 3,100* | 98,000 | ||||
| North Carolina | 3 | 12,500* | 10,000 | 2,900 | 25,300 | ||||||
| North Dakota | 6 | 5,500* | 300 | < 50 | < 50 | 5,800 | |||||
| Ohio | 7 | 40,200 | 64,600 | 6,600 | 111,400 | ||||||
| Oklahoma | 6 | 5,400* | 20,800 | 100* | 26,200 | ||||||
| Oregon | 6 | 22,500* | 41,400 | 300* | 64,200 | ||||||
| Pennsylvania | 10 | 40,300 | 44,700 | 33,800 | 1,000 | 119,700 | |||||
| South Carolina | 7 | 11,500 | 20,400* | 100* | 1,400 | 800* | 1,100 | 35,200 | |||
| South Dakota | 4 | 3,700* | 2,100 | 100* | 5,900 | ||||||
| Tennessee | 3 | 7,800 | 7,800 | ||||||||
| Texas | 6 | 39,600 | 6,200 | 2,300 | 48,100 | ||||||
| Utah | 8 | 5,500 | 600 | 2,300 | 100 | 700 | 100 | 9,300 | |||
| Virginia | 5 | 13,100 | 38,200* | 51,300 | |||||||
| Washington | 8 | 19,400 | 43,600 | 1,600 | 64,500 | ||||||
| West Virginia | 3 | 4,600 | 6,200 | 100 | 10,900 | ||||||
| Wisconsin | 6 | 28,800 | 61,100 | 89,900 | |||||||
| Wyoming | 5 | 2,600 | 2,500* | 100 | 200* | 5,300 | |||||
| TOTAL(48 states): | 265 | 785,800 (48 states) | 162,500 (8 states) | 667,000(37 states) | 128,200(16 states) | 17,100(18 states) | 3,600(5 states) | 25,100(11 states) | 17,500 (21 states) | 1,806,800 | |
| No Section 1915 (c) Waivers (3 states) | |||||||||||
| Arizona | |||||||||||
| Rhode Island | |||||||||||
| Vermont | |||||||||||
| NOTES: I/DD = intellectual and developmental disabilities. TBI = traumatic brain injury. SCI = spinal cord injury. Totals may not sum due to rounding. States may offer more than one Section 1915 (c) waiver per target population category. Programs with enrollment under 50 individuals are noted as < 50. Blank cell indicates state does not offer Section 1915 (c) waiver for that population. *Data from year other than FY 2018, as noted in table endnotes.SOURCE: KFF Medicaid HCBS Program Surveys, FY 2018. | |||||||||||
| Appendix Table 5: Medicaid Section 1915 (c) HCBS Waiver Spending, by Target Population and by State, FY 2018 ($, in thousands) | ||||||||||
| State | Total No. of § 1915 (c) Waivers | Spending by Target Population | Total | |||||||
| I/DD | Seniors | Seniors & Adults with Physical Disabilities | Adults with Physical Disabilities | Med. Fragile/Tech Dep. Children | HIV/AIDS | Mental Health | TBI/SCI | |||
| Alabama | 6 | 351,300 | 78,400 | 7,800 | 437,500 | |||||
| Alaska | 4 | 186,900 | 69,000 | 9,100 | 265,100 | |||||
| Arkansas | 4 | 240,100* | 149,500 | 389,600 | ||||||
| California | 7 | 3,474,900 | 39,800 | 108,900 | 175,400 | 2,600 | 8,700 | 3,810,300 | ||
| Colorado | 11 | 462,200* | 361,500* | 18,100* | 38,300* | 23,500* | 903,700 | |||
| Connecticut | 11 | 883,000 | 395,400 | 2,100 | 100 | 14,700 | 63,300 | 1,358,600 | ||
| Delaware | 1 | 137,200 | 137,200 | |||||||
| DC | 2 | 226,100* | 68,900* | 295,000 | ||||||
| Florida | 4 | 1,067,000 | 1,036,500 | < 50 | 2,103,500 | |||||
| Georgia | 4 | 639,200 | 493,300 | 80,400 | 1,212,900 | |||||
| Hawaii | 1 | 135,600 | 135,600 | |||||||
| Idaho | 4 | 266,900 | 97,000 | 364,000 | ||||||
| Illinois | 9 | 71,600* | 429,400* | 127,800* | 558,200* | 1,900* | 24,000* | 72,600* | 1,285,500 | |
| Indiana | 4 | 812,100 | 266,700 | 4,700 | 1,083,500 | |||||
| Iowa | 7 | 520,600* | 60,500* | 23,600* | 300* | 10,300 | 32,500 | 647,900 | ||
| Kansas | 7 | 523,400 | 210,900 | 304,300 | 55,900 | 79,000 | 24,900 | 1,198,300 | ||
| Kentucky | 6 | 670,900 | 86,100* | 2,600 | 45,600 | 805,100 | ||||
| Louisiana | 7 | 454,900 | 112,500 | 3,900 | 571,300 | |||||
| Maine | 5 | 385,100 | 40,000 | 16,100 | 441,300 | |||||
| Maryland | 6 | 994,900 | 135,400 | 2,700 | 12,200 | 1,145,200 | ||||
| Massachusetts | 10 | 1,301,200* | 211,900* | 50,900* | 1,563,900 | |||||
| Michigan | 4 | 444,600* | 339,900 | 4,700* | 789,200 | |||||
| Minnesota | 5 | 1,403,400 | 435,600 | 932,600 | 42,400 | 97,900 | 2,911,800 | |||
| Mississippi | 5 | 104,300 | 233,900 | 44,100 | 18,400 | 400,800 | ||||
| Missouri | 9 | 924,200 | 63,300 | 35,000 | 2,400 | 1,024,900 | ||||
| Montana | 4 | 113,600 | 42,000 | 5,400 | 161,000 | |||||
| Nebraska | 5 | 252,700 | 112,400 | 700 | 365,700 | |||||
| Nevada | 3 | 114,400 | 13,900 | 4,900 | 133,200 | |||||
| New Hampshire | 4 | 243,700* | 48,900 | 23,100 | 315,700 | |||||
| New Jersey | 1 | 605,000* | 605,000 | |||||||
| New Mexico | 3 | 379,900 | 379,900 | |||||||
| New York | 9 | 5,970,300* | 158,500* | 5,400* | 97,300 | 194,600* | 6,426,100 | |||
| North Carolina | 3 | 652,100* | 196,000 | 49,500 | 897,500 | |||||
| North Dakota | 6 | 199,500* | 6,900 | 200 | 100 | 206,800 | ||||
| Ohio | 7 | 1,968,100* | 777,500 | 125,600 | 2,871,200 | |||||
| Oklahoma | 6 | 305,900* | 165,900 | 4,600* | 476,400 | |||||
| Oregon | 6 | 58,500* | 41,600 | 600* | 100,700 | |||||
| Pennsylvania | 10 | 3,177,600 | 1,481,600 | 1,331,200 | 32,700 | 6,023,100 | ||||
| South Carolina | 7 | 423,300 | 192,200* | 1,800* | 3,300 | 4,700* | 32,600 | 657,700 | ||
| South Dakota | 4 | 121,000* | 20,600 | 3,700* | 145,300 | |||||
| Tennessee | 3 | 684,400 | 684,400 | |||||||
| Texas | 6 | 1,545,300 | 390,400 | 10,712 | 1,946,400 | |||||
| Utah | 8 | 275,400 | 7,200 | 50,900 | 2,600 | 14,900 | 6,600 | 357,600 | ||
| Virginia | 5 | 908,100 | 776,700* | 1,684,800 | ||||||
| Washington | 8 | 650,100 | 24,700 | 53,800 | 728,600 | |||||
| West Virginia | 3 | 305,400 | 99,400 | 1,500 | 406,300 | |||||
| Wisconsin | 6 | 632,800 | 1,818,800 | 2,451,600 | ||||||
| Wyoming | 5 | 118,100 | 37,400* | < 50 | 7,900* | 163,500 | ||||
| TOTAL(48 states): | 265 | 36,386,500 (48 states) | 1,592,700 (8 states) | 10,132,900 (37 states) | 3,629,900 (16 states) | 604,000(18 states) | 40,000(5 states) | 318,100 (11 states) | 765,900 (21 states) | 53,470,200 |
| No Section 1915 (c) Waivers (3 states) | ||||||||||
| Arizona | ||||||||||
| Rhode Island | ||||||||||
| Vermont | ||||||||||
| NOTES: I/DD = intellectual and developmental disabilities. TBI = traumatic brain injury. SCI = spinal cord injury. Totals may not sum due to rounding. States may offer more than one Section 1915 (c) waiver per target population category. Programs with enrollment under 50 individuals are noted as < 50. Blank cell indicates state does not offer Section 1915 (c) waiver for that population. *Data from year other than FY 2018, as noted in table endnotes.SOURCE: KFF Medicaid HCBS Program Surveys, FY 2018. | ||||||||||
| Appendix Table 6: Medicaid Section 1915 (c) HCBS Waiver Spending Per Enrollee, by Target Population and by State, FY 2018 ($) | ||||||||||
| State | Total No. of Waivers | Per Enrollee Spending by Target Population | Total | |||||||
| I/DD | Seniors | Seniors & Adults with Physical Disabilities | Adults with Physical Disabilities | Med. Fragile/Tech Dep. Children | HIV/AIDS | Mental Health | TBI/SCI | |||
| Alabama | 6 | 63,600 | 13,800 | 12,700 | 29,000 | |||||
| Alaska | 4 | 86,400 | 35,100 | 42,900 | 61,100 | |||||
| Arkansas | 4 | 53,500* | 13,600 | 25,200 | ||||||
| California | 7 | 26,900 | 3,800 | 23,600 | 45,800 | 8,900 | 7,200 | 25,500 | ||
| Colorado | 11 | 37,000* | 13,200* | 9,900* | 9,600* | 41,300* | 19,500 | |||
| Connecticut | 11 | 86,600 | 25,900 | 2,000 | 200 | 17,900 | 106,128 | 48,100 | ||
| Delaware | 1 | 119,200 | 119,200 | |||||||
| DC | 2 | 69,000* | 18,800* | 42,500 | ||||||
| Florida | 4 | 33,600 | 14,600 | 2,600 | 20,500 | |||||
| Georgia | 4 | 49,000 | 17,600 | 53,700 | 28,500 | |||||
| Hawaii | 1 | 47,400 | 47,400 | |||||||
| Idaho | 4 | 30,500 | 8,500 | 18,000 | ||||||
| Illinois | 9 | 3,100* | 5,100* | 11,900* | 15,500* | 2,300* | 15,800* | 14,800* | 8,000 | |
| Indiana | 4 | 30,500 | 12,000 | 24,700 | 22,000 | |||||
| Iowa | 7 | 41,400* | 4,800* | 8,300* | 9,600* | 10,600 | 22,700 | 21,300 | ||
| Kansas | 7 | 54,500 | 35,200 | 45,400 | 93,200 | 14,900 | 46,400 | 41,700 | ||
| Kentucky | 6 | 45,300 | 9,600* | 66,300 | 92,700 | 33,100 | ||||
| Louisiana | 7 | 37,500 | 19,100 | 1.500 | 27,700 | |||||
| Maine | 5 | 72,300 | 20,700 | 80,700 | 59,200 | |||||
| Maryland | 6 | 61,200 | 14,700 | 12,600 | 126,800 | 44,900 | ||||
| Massachusetts | 10 | 83,500* | 14,600* | 108,000* | 51,100 | |||||
| Michigan | 4 | 51,400* | 22,200 | 6,400* | 32,000 | |||||
| Minnesota | 5 | 70,600 | 14,400 | 31,700 | 69,700 | 76,100 | 35,700 | |||
| Mississippi | 5 | 40,200 | 11,700 | 18,200 | 22,500 | 15,500 | ||||
| Missouri | 9 | 61,800 | 3,800 | 15,100 | 31,300 | 30,300 | ||||
| Montana | 4 | 41,400 | 16,100 | 15,000 | 28,200 | |||||
| Nebraska | 5 | 51,800 | 16,400 | 33,400 | 31,100 | |||||
| Nevada | 3 | 51,100 | 5,200 | 5,900 | 23,200 | |||||
| New Hampshire | 4 | 47,900* | 12,700 | 88,600 | 34,300 | |||||
| New Jersey | 1 | 56,500* | 56,500 | |||||||
| New Mexico | 3 | 75,200 | 75,200 | |||||||
| New York | 9 | 69,900* | 63,000* | 9,000* | 15,300 | 62,100* | 65,600 | |||
| North Carolina | 3 | 52,300* | 19,700 | 17,100 | 35,500 | |||||
| North Dakota | 6 | 36,500* | 23,900 | 214,500 | 6,000 | 35,800 | ||||
| Ohio | 7 | 48,900 | 12,000 | 19,100 | 25,800 | |||||
| Oklahoma | 6 | 56,700* | 8,000 | 52,100* | 18,200 | |||||
| Oregon | 6 | 3,800* | 1,000 | 1,900* | 1,600 | |||||
| Pennsylvania | 10 | 78,900 | 33,200 | 39,400 | 33,900 | 50,300 | ||||
| South Carolina | 7 | 36,900 | 9,400* | 30,300* | 2,300 | 5,900* | 30,400 | 18,700 | ||
| South Dakota | 4 | 32,300* | 9,900 | 34,500* | 24,500 | |||||
| Tennessee | 3 | 87,400 | 87,400 | |||||||
| Texas | 6 | 39,000 | 63,500 | 4,600 | 40,500 | |||||
| Utah | 8 | 50,200 | 12,400 | 22,600 | 23,800 | 21,300 | 47,100 | 38,600 | ||
| Virginia | 5 | 69,300 | 20,300* | 32,800 | ||||||
| Washington | 8 | 33,500 | 600 | 33,700 | 11,300 | |||||
| West Virginia | 3 | 65,900 | 16,100 | 18,300 | 37,300 | |||||
| Wisconsin | 6 | 22,000 | 29,800 | 27,300 | ||||||
| Wyoming | 5 | 46,000 | 15,200* | 300 | 48,500* | 30,900 | ||||
| TOTAL(48 states): | 265 | 46,300 (48 states) | 9,800 (8 states) | 15,200(37 states) | 28,300(16 states) | 35,200(18 states) | 11,100(5 states) | 12,700 (11 states) | 43,700 (21 states) | 29,600 |
| No Section 1915 (c) Waivers (3 states) | ||||||||||
| Arizona | ||||||||||
| Rhode Island | ||||||||||
| Vermont | ||||||||||
| NOTES: I/DD = intellectual and developmental disabilities. TBI = traumatic brain injury. SCI = spinal cord injury. Totals may not sum due to rounding. States may offer more than one Section 1915 (c) waiver per target population category Programs with enrollment under 50 individuals are noted as < 50. Blank cell indicates state does not offer Section 1915 (c) waiver for that population. *Data from year other than FY 2018, as noted in table endnotes. SOURCE: KFF Medicaid HCBS Program Surveys, FY 2018. | ||||||||||
Table Notes
Arkansas: Home health data are from 2017. Wavier data are from 2015 (#936 I/DD).
California: Home health data are from 2016. Section 1115 waiver data are from 2015.
Colorado: Waiver data are from 2017 (#6 seniors/adults with physical disabilities, #7 I/DD, #268 mental health, #288 TBI/SCI, #293 I/DD, #305 I/DD, #450 children, #961 TBI/SCI, #4157 children, #4180 I/DD.)
District of Columbia: Home health, personal care, CFC, 1915 (i), and waiver data are from 2017.
Idaho: Section 1915 (i) spending and per enrollee spending data include only the adult DD program and exclude data for the children’s DD program. The state reported 1,700 children with DD enrolled in 2017, but did not report corresponding spending data.
Illinois: Waiver data are from 2015 (#143 seniors), 2016 (#278 children), and 2017 (#142 adults with physical disabilities, #202 HIV/AIDS, #326 seniors/adults with physical disabilities, #329 TBI/SCI, #350 I/DD, #464 I/DD, #473 I/DD).
Iowa: Waiver enrollment data are from 2016 (#345 adults with physical disabilities, #4111 adults with physical disabilities, #4155 seniors) and 2017 (#213 HIV/AIDS, #242 I/DD).
Kentucky: Waiver data are from 2017 (#144 seniors/adults with physical disabilities).
Massachusetts: Waiver data are from 2016 (#59 seniors/adults with physical disabilities) and 2017 (#359 TBI/SCI, #826 I/DD, #827 I/DD, #828 I/DD, #1027 seniors/adults with physical disabilities, #1028 seniors/adults with physical disabilities, #40207 I/DD, #40701 TBI/SCI, #40702 TBI/SCI).
Michigan: Waiver spending data are from 2016 (#167 I/DD, #438 mental health, #4119 I/DD).
New Hampshire: Home health and personal care data are from 2015. Waiver spending data are from 2016 (#397 I/DD).
New Jersey: Waiver data are from 2011 (#31 I/DD).
New York: Home health and personal care data are from 2017. Waiver data are from 2016 (#40176 children) and 2017 (#269 spending-only TBI/SCI, #444 spending-only seniors/adults with physical disabilities, #470 I/DD, and #471 children).
North Carolina: Waiver data are from 2016 (#432 I/DD).
North Dakota: Waiver data are from 2017 (#842 spending-only I/DD, #37 I/DD).
Oklahoma: Waiver data are from 2017 (#179 I/DD, #343 I/DD, #351 I/DD, #399 I/DD, #811 children).
Oregon: Waiver data are from 2017 (#117 I/DD, #375 I/DD, #565 children, #40193 children, #40194 I/DD).
South Carolina: Waiver data are from 2016 (#40181 adults with physical disabilities) and 2017 (#186 HIV/AIDS, #405 seniors/adults with physical disabilities).
South Dakota: Waiver data are from 2016 (#44 I/DD, #264 TBI/SCI, #338 I/DD).
Virginia: Waiver data are from 2017 (#321 seniors/adults with physical disabilities).
Wyoming: Waiver data are from 2017 (#236 seniors/adults with physical disabilities, #370 TBI/SCI).
Endnotes
- AZ delivers home health state plan services through a Section 1115 capitated managed care waiver and is unable to separately report unduplicated home health enrollment data. Instead, AZ’s home health state plan enrollment is included in its Section 1115 waiver enrollment. In FY 2018, Arizona reported that all 52,400 of its Section 1115 waiver enrollees received home health services. ↩︎
- HI delivers home health state plan services through a Section 1115 capitated managed care waiver and is unable to separately report unduplicated home health enrollment data. Instead, HI’s home health state plan enrollment is included in its Section 1115 waiver enrollment. In FY 2018, Hawaii reported that 2,500 of its 8,500 Section 1115 waiver enrollees received home health services. ↩︎
- NE reports home health state plan enrollment only for fee-for-service enrollees. ↩︎
- TX reports home health state plan enrollment only for fee-for-service enrollees. ↩︎
- KS delivers personal care state plan services through a Section 1115 capitated managed care waiver and is unable to separately report unduplicated personal care enrollment data. Instead, KS’s personal care state plan enrollment is included in its Section 1115 waiver enrollment. ↩︎
- NM delivers personal care state plan services through a Section 1115 capitated managed care waiver and is unable to separately report unduplicated personal care enrollment data. Instead, NM’s personal care state plan enrollment is included in its Section 1115 waiver enrollment. ↩︎
- NY is unable to report Section 1115 waiver managed LTSS enrollment by community vs. institutional setting. In 2015 (the most recent year for which NY data are available), 49,930 people received long-term institutional or HCBS in NY’s Section 1115 waiver. ↩︎
- Among the 34 states offering the personal care state plan option, 20 allow self-direction. The 15 states reporting self-directed enrollment data are AK, AR, CA, FL, ID, MA, MI, MO, MT, NJ, OK, TX, UT, VT and WA. The five states that allow self-directed personal care state plan services but do not report enrollment are ME, MN, NV, NH and NY. ↩︎
- For additional information on states’ self-direction policies, see KFF, Key State Policy Choices About Medicaid Home and Community-Based Services (Feb. 2020), https://modern.kff.org/medicaid/issue-brief/key-state-policy-choices-about-medicaid-home-and-community-based-services. ↩︎
- Three of 51 states allow individuals to self-direct home health state plan services. CA and NE allow self-direction but are unable to report enrollment. ↩︎
- AZ delivers home health state plan services through a Section 1115 capitated managed care waiver and is unable to separately report home health spending data. Instead, AZ’s home health state plan spending is included in its Section 1115 waiver spending. Total home health state plan spending was $70 million in AZ in FY 2018. ↩︎
- HI delivers home health state plan services through a Section 1115 capitated managed care waiver and is unable to separately report home health spending data. Instead, HI’s home health state plan spending is included in its Section 1115 waiver spending. Total home health state plan spending was $4 million in HI in FY 2018. ↩︎
- NE reports home health state plan spending only for fee-for-service enrollees. ↩︎
- TX reports home health state plan spending only for fee-for-service enrollees. ↩︎
- KS delivers personal care state plan services through a Section 1115 capitated managed care waiver and is unable to separately report personal care spending data. Instead, KS’s personal care state plan spending is included in its Section 1115 waiver spending. ↩︎
- NM delivers personal care state plan services through a Section 1115 capitated managed care waiver and is unable to separately report personal care spending data. Instead, NM’s personal care state plan spending is included in its Section 1115 waiver spending. ↩︎
- NY is unable to report Section 1115 waiver managed LTSS spending by community vs. institutional setting. In 2015 (the most recent year for which NY data is available), total institutional and HCBS Section 1115 waiver spending was $146,589,000. ↩︎
- Section 1915 (c) waiver participants were enrolled about 300 days a year on average in 2016, the most recent year data are available. KFF analysis based on CMS 372 reports for Section 1915 (c) waivers in 2016. ↩︎
- The FY 2018 survey asked states to update prior years’ (FY 2016 and FY 2017) spending and enrollment data if necessary; therefore, all trend analyses reflected in this report includes the most recently reported FY 2017 data. ↩︎
- Section 1115 waiver enrollment is not presented by target population because, unlike Section 1915 (c) waivers, Section 1115 waivers can include multiple populations, and states only report total Section 1115 waiver enrollment in our survey. ↩︎
- 48 states offer Section 1915 (c) waivers targeted to people with I/DD. The other three states (AZ, RI, and VT) serve their entire I/DD waiver populations under Section 1115. In addition, two states (NY and TN) serve some people with I/DD under Section 1115 and others under Section 1915 (c). ↩︎
- 42 states offer Section 1915 (c) waivers targeted to seniors and/or adults with physical disabilities. The other nine states (AZ, DE, HI, NJ, NM, RI, TN, TX, and VT) serve all senior and adult with physical disabilities waiver populations under Section 1115. In addition, three states (CA, NY, and WA) serve some seniors and adults with physical disabilities under Section 1115 and others under Section 1915 (c). ↩︎
- 11 states offer Section 1915 (c) waivers targeted to people with mental health disabilities. Another two states (DE and RI) serve people with mental health disabilities under Section 1115. In addition, WA serves some people with mental health disabilities under Section 1115 and others under Section 1915 (c). ↩︎
- 21 states offer Section 1915 (c) waivers targeted to people with TBI/SCI. Another four states (DE, RI, VT, and WA) serve people with TBI/SCI under Section 1115. ↩︎
- 18 states offer Section 1915 (c) waivers targeted to children who are medically fragile or technology dependent. Another two states (HI and RI) serve children who are medically fragile or technology dependent under Section 1115. ↩︎
- Five states offer Section 1915 (c) waivers targeted to people with HIV/AIDS. Another three states (DE, HI, and RI) serve people with HIV/AIDS under Section 1115. ↩︎
- Four states (CA, DE, ID, and MS) serve people with I/DD under Section 1915 (i). ↩︎
- Four states (IA, IN, OH and TX) serve people with mental health disabilities under Section 1915 (i). ↩︎
- Three states (CT, DC, and NV) serve seniors and/or people with physical disabilities under Section 1915 (i). DC did not report spending data. ↩︎
- Reporting states include CT and NV; DC did not report. ↩︎
- CA, DE, ID, and MS. ID per enrollee spending includes only the program for adults with I/DD because the state was unable to report spending data for the program for children with I/DD. ↩︎
- IA, IN, OH, and TX. ↩︎
- KFF, Explaining Texas v. U.S.: A Guide to the 5th Circuit Appeal in the Case Challenging the ACA (Jan. 2020), https://modern.kff.org/health-reform/issue-brief/explaining-texas-v-u-s-a-guide-to-the-case-challenging-the-aca/ ↩︎
- KFF, Potential Impact of Texas v. U.S. Decision on Key Provisions of the Affordable Care Act (Jan. 2020), https://modern.kff.org/health-reform/fact-sheet/potential-impact-of-texas-v-u-s-decision-on-key-provisions-of-the-affordable-care-act/. ↩︎
- See also KFF, State Variation in Medicaid Per Enrollee Spending for Seniors and People with Disabilities (May 2017), https://modern.kff.org/medicaid/issue-brief/state-variation-in-medicaid-per-enrollee-spending-for-seniors-and-people-with-disabilities/. ↩︎
- KFF, Medicaid Financing: The Basics (March 2019), https://modern.kff.org/medicaid/issuebrief/medicaid-financing-the-basics/. ↩︎
- KFF, Why It Matters: Tennessee’s Medicaid Waiver Block Grant Proposal (Dec. 2019), https://modern.kff.org/medicaid/issue-brief/why-it-matters-tennessees-medicaid-block-grant-waiver-proposal/. ↩︎
- KFF, How Will Medicare-for-all Proposals Affect Medicaid? (Sept. 2019), https://modern.kff.org/medicaid/issue-brief/how-will-medicare-for-all-proposals-affect-medicaid/. ↩︎
- U.S. Census Bureau, Projections of the Size and Composition of the U.S. Population: 2014 to 2060, Report Number P25-1143, at 5 (March 2015), https://www.census.gov/library/publications/2015/demo/p25-1143.html. ↩︎
- U.S. Census Bureau, Older People Projected to Outnumber Children for First Time in U.S. History, Release Number CB18-41 (March 13, 2018), https://www.census.gov/newsroom/press-releases/2018/cb18-41-population-projections.html. ↩︎
- Id.; U.S. Census Bureau, An Aging Nation: Projected Number of Children and Older Adults (last revised Oct. 9, 2019), https://www.census.gov/library/visualizations/2018/comm/historic-first.html. ↩︎