Medicaid Enrollment & Spending Growth: FY 2015 & 2016
Executive Summary
Beginning in FY 2014, policy changes introduced by the Affordable Care Act (ACA) have been driving Medicaid enrollment and spending growth. This report provides an overview of Medicaid enrollment and spending growth with a focus on state Fiscal Year (FY) 2015 and state Fiscal Year 2016. Findings are based on interviews and data provided by state Medicaid directors as part of the 15th annual survey of Medicaid directors in all 50 states and the District of Columbia conducted by the Kaiser Commission on Medicaid and the Uninsured (KCMU) and Health Management Associates (HMA). Information collected in the survey on policy actions taken during FY 2015 and FY 2016 can be found in the companion report. Key findings related to Medicaid enrollment and spending growth are described below.
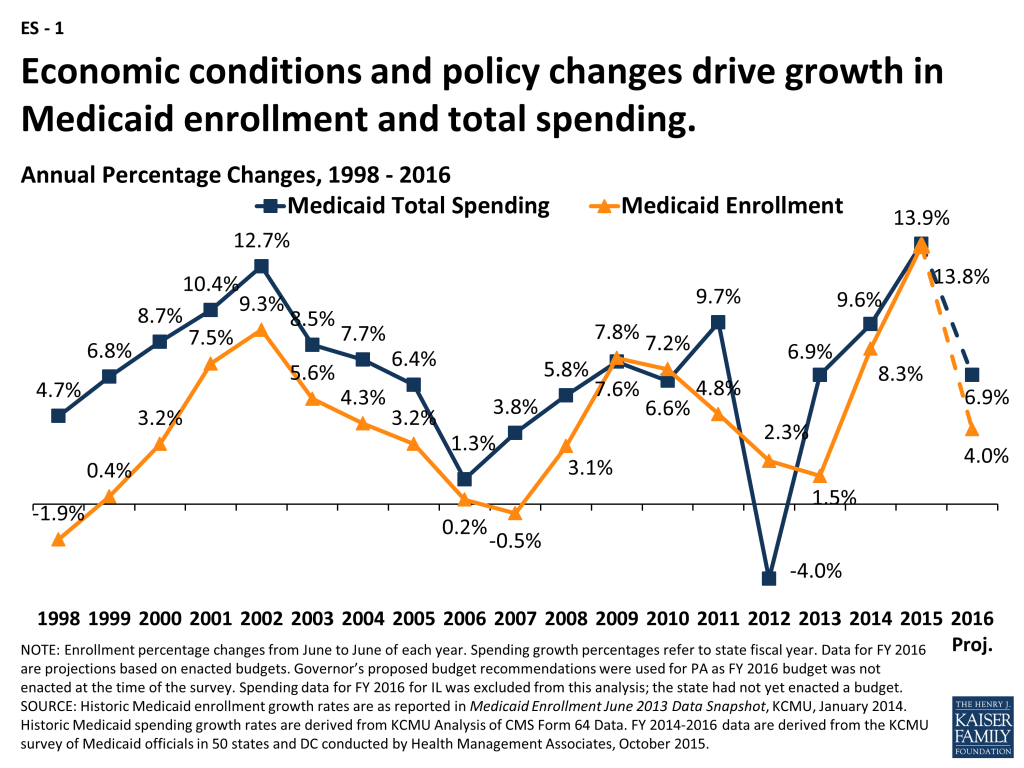
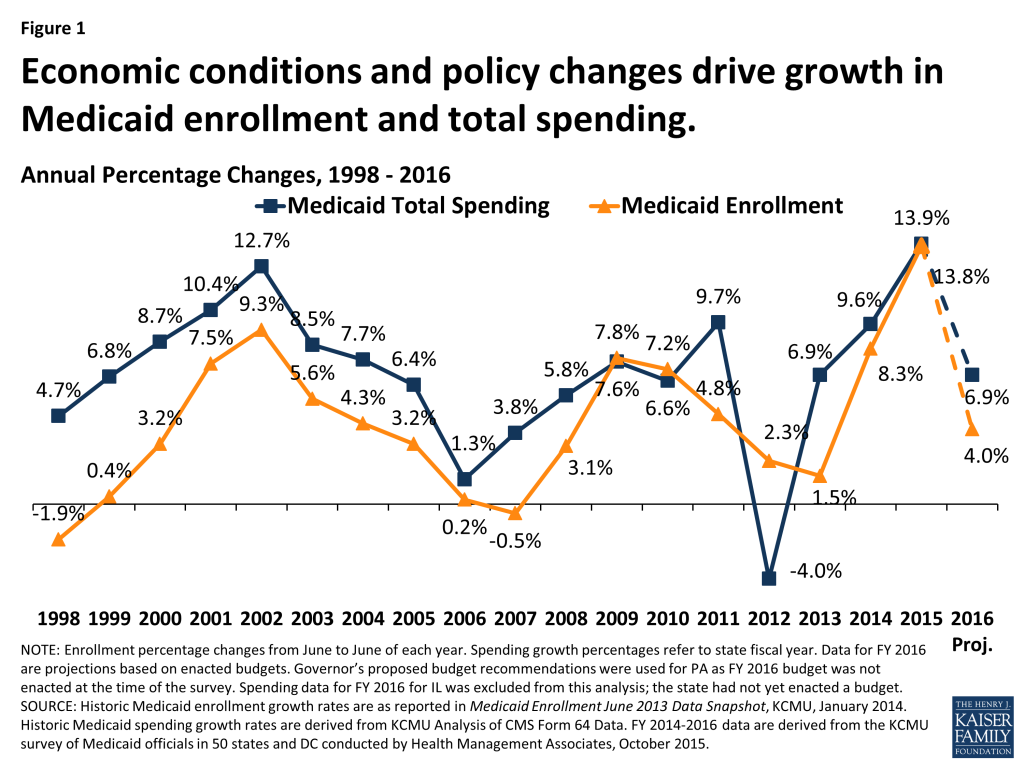
Medicaid enrollment and spending increased substantially in FY 2015, the first full year of implementation of the major ACA coverage expansions. Across all 50 states and DC, Medicaid enrollment increased on average by 13.8 percent in FY 2015, largely due to the ACA coverage expansions. Driven by growth in enrollment, total Medicaid spending increased by 13.9 percent on average in FY 2015. (ES – 1) Beyond enrollment, states reported that the other drivers of increases in spending were provider rate increases and the higher cost of health care, including prescription drugs. Improvements in the economy were a downward pressure on enrollment which affected spending, but downward pressure in enrollment and spending as a result of the improving economy were outweighed by the ACA coverage policy changes.
In FY 2015, Medicaid enrollment and total Medicaid spending growth in expansion states far exceeded growth in non-expansion states. Expansion states reported Medicaid enrollment and total spending growth nearly three times the rate of non-expansion states. (Figure 2) A total of 29 states were implementing the ACA Medicaid expansion in FY 2015, up from 26 states in the previous year (FY 2015 additions include: New Hampshire, Pennsylvania and Indiana).
Across the 29 expansion states in FY 2015, enrollment increased on average by 18.0 percent and total spending increased by 17.7 percent; both enrollment and spending growth were driven by increases in enrollment among adults qualifying under the new expansion group. Of the 29 states expanding Medicaid in FY 2015, more than half (17 states) noted that enrollment initially increased faster than expected. Over two-thirds of expansion states reported that per member per month costs for the expansion population were at or below projections.1 Across the 22 states not implementing the Medicaid expansion in FY 2015,2 enrollment and total spending growth was 5.1 percent and 6.1 percent (respectively), much slower growth compared to the expansion states. Increased enrollment among previously eligible parents and children was the primary reason cited for enrollment growth in non-expansion states. (ES – 2)

State general fund Medicaid spending3 across all states grew at more modest levels in FY 2015 than total Medicaid spending and Medicaid enrollment growth but there was variation across expansion and non-expansion states. Across expansion states, state general fund Medicaid spending grew at more modest levels compared to total Medicaid spending – primarily due to the enhanced federal match rate for those newly eligible for coverage. For non-expansion states, state Medicaid spending growth in FY 2015 slightly outpaced total Medicaid spending growth. Some non-expansion states attributed growth in state Medicaid spending to annual changes in the formula-driven federal Medicaid match rate that resulted in reductions in the federal Medicaid share for some large non-expansion states, including Texas. Across all states, state general fund Medicaid spending for FY 2015 grew at a similar rate as overall general fund growth (4.5 percent for Medicaid compared to 4.6 percent for state general fund growth).4
Total Medicaid enrollment and spending growth is projected to slow in FY 2016; looking ahead, states will monitor the effects of the ACA and other payment and delivery system reforms on spending. The major effects of the ACA were experienced by states in FY 2015; FY 2016 projections for Medicaid enrollment (4.0 percent) and total spending (6.9 percent) across all states indicate much slower growth on average than in FY 2015. Subsequently, the difference in enrollment and total spending growth rates across expansion and non-expansion states are projected to narrow in FY 2016. Expansion states are continuing to monitor and assess the effects of the Medicaid expansion on the state budget (within and beyond Medicaid). For FY 2015 and FY 2016, a number of Medicaid directors reported savings in areas including behavioral health, uncompensated care and criminal justice as well as increased revenue as a result of implementing the Medicaid expansion. Understanding these effects is important as states look ahead to 2017 when the enhanced match rate for newly eligible Medicaid expansion adults begins to decline; starting January 1, 2017 (halfway through FY 2017 for most states) the match rate will drop from 100 percent to 95 percent, resulting in a state fund share of 5 percent. Many states are also engaged in major payment and delivery system reforms that have implications for care delivery as well as program spending going forward.
Issue Brief
Introduction
Medicaid enrollment and spending are primarily affected by economic conditions and policy changes. Over the past 15 years, Medicaid enrollment increased substantially during two major recessions, reflecting the countercyclical nature of the program. During economic downturns, when individuals lose their jobs and incomes decline, more people qualify and enroll in Medicaid, which in turn drives increases in total Medicaid spending. During the most recent economic downturns, Medicaid enrollment peaked in 2002, leveled in 2006 and 2007, and then peaked again in 2009. Following economic downturns, Medicaid enrollment and spending growth may slow in the absence of other policy changes. (For additional information about Medicaid financing, the role of Medicaid in state budgets and Medicaid and the economy, see Appendix).
In each of the past five years, the economy has gradually improved and policy changes at the state and federal levels, including those in the Affordable Care Act (ACA), have been driving enrollment and spending growth. The enactment of the ACA had major implications for Medicaid eligibility, enrollment and spending across states. As enacted, all states were to expand coverage to nearly all adults with incomes up to 138 percent of the poverty level (FPL) ($16,242 per year for an individual in 2015). However, the 2012 Supreme Court ruling on the ACA effectively made the decision to implement the Medicaid coverage expansion an option for states. The ACA also required all states to implement new streamlined and coordinated application, enrollment, and renewal processes, including transitioning to a new income standard (Modified Adjusted Gross Income or MAGI) to determine Medicaid financial eligibility for non-elderly, non-disabled populations.
This report provides an overview of Medicaid enrollment and spending growth with a focus on state Fiscal Year (FY) 2015 and state Fiscal Year (FY) 2016. Findings are based on interviews and data provided by state Medicaid directors as part of the 15th annual survey of Medicaid directors in all 50 states and the District of Columbia conducted by the Kaiser Commission on Medicaid and the Uninsured (KCMU) and Health Management Associates (HMA). For a more detailed description of the Methodology used to calculate enrollment and spending growth, please see the “Methods Box” at the end of this brief.
Medicaid Enrollment and Spending FY 2015 and FY 2016
Medicaid enrollment and spending increased substantially in FY 2015, the first full year of implementation of the major ACA coverage expansions. Across all 50 states and DC, Medicaid enrollment increased on average by 13.8 percent in FY 2015, following growth of 8.3 percent the previous year. The sharp increases in these two years were driven by enrollment growth in states implementing the Medicaid expansion. Driven by growth in enrollment, total Medicaid spending increased by 13.9 percent in FY 2015. Growth in total Medicaid spending is expected to drop to 6.9 percent in FY 2016, as the initial effects of the major ACA coverage expansions are largely completed. (Figure 1) Beyond enrollment, states reported that other drivers of increases in spending are provider rate increases and the higher cost of health care, including prescription drugs. Improvements in the economy were a downward pressure on enrollment which affected spending, but downward pressure in enrollment and spending as a result of the improving economy were outweighed by the ACA coverage policy changes.
Compared to enrollment and total spending growth, state general fund spending for Medicaid across all states grew at more modest levels in FY 2015.5 Historically, state Medicaid spending and total Medicaid spending have increased at similar rates except when there have been statutory changes in the federal Medicaid match rate (officially known as the FMAP, or Federal Medical Assistance Percentage). For example, Congress enacted temporary increases in the federal share of Medicaid during the last two economic downturns that resulted in lower growth in state Medicaid spending compared to total Medicaid spending growth. The magnitude of the federal fiscal relief included in the American Recovery and Reinvestment Act (ARRA) – over $100 billion in additional federal funds over 11 quarters through June 2011 – resulted in declines in state spending for Medicaid in 2009 and 2010. However, the expiration of this relief resulted in higher state Medicaid spending growth in FY 2012 compared to growth in federal Medicaid spending.
More recently, the change in the Medicaid match rate tied to the ACA Medicaid expansion has resulted in a divergence in growth rates for total and state Medicaid spending. For states that expand Medicaid, the federal government pays 100 percent of Medicaid costs of those newly eligible under the Medicaid expansion for calendar years 2014-2016. The federal share phases down to 95 percent in 2017, 94 percent in 2018, 93 percent in 2019 and 90 percent in 2020 and thereafter, well above traditional FMAP rates in every state.
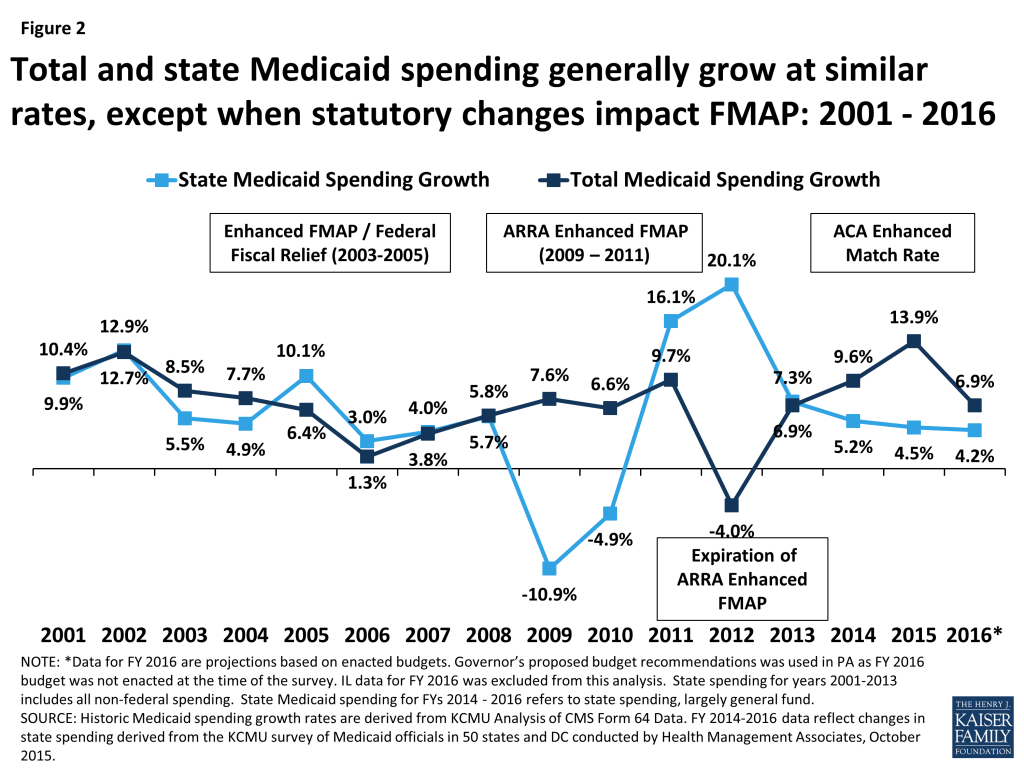
As a result of the 100 percent FMAP for newly eligible enrollees in expansion states, state spending for Medicaid across all states increased on average by 4.5 percent in FY 2015, compared to total Medicaid spending growth across all states of 13.9 percent. (Figure 2) State general fund Medicaid spending for FY 2015 grew at a similar rate as overall general fund growth (4.5 percent for Medicaid compared to 4.6 percent for all state general fund growth).6
State Medicaid directors were remarkably accurate in projecting enrollment and spending for FY 2015. Compared to projections included in this report last year, actual enrollment, total spending and state spending averages were on target with state projections. In each of these areas, states expect to see sharp declines in growth for FY 2016 as the full effects of the implementation of the ACA were experienced primarily in FY 2015. (Figure 3)
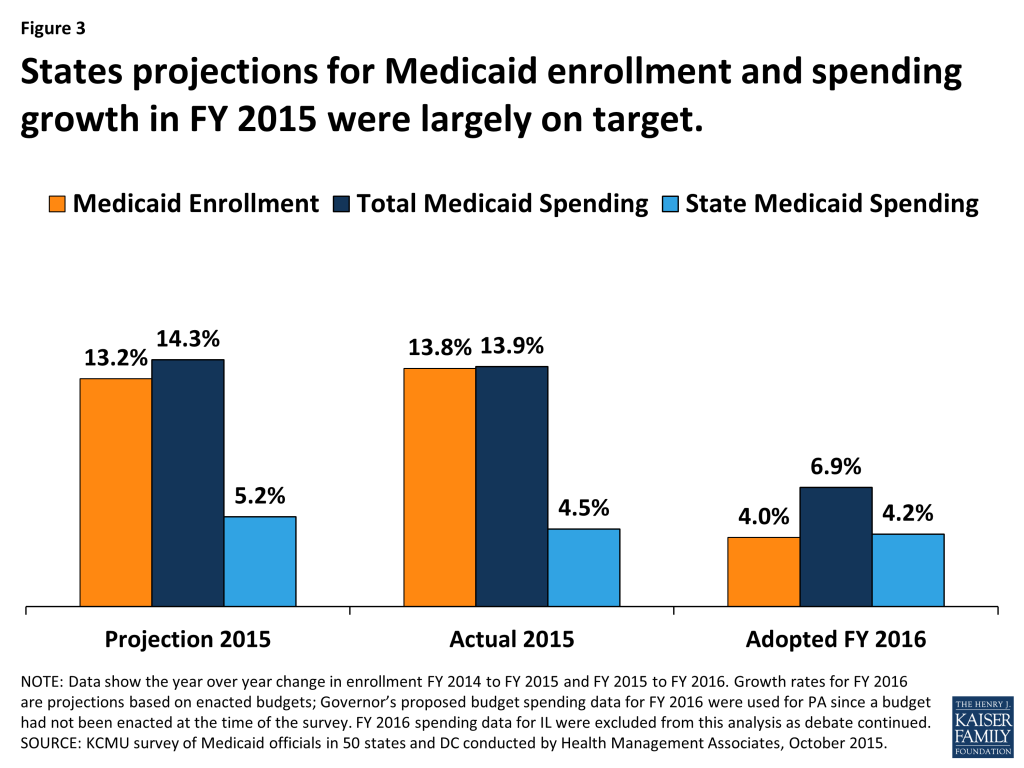
Looking ahead to FY 2016, total enrollment and spending growth are projected to slow. Enrollment growth is projected to average just 4.0 percent across all 50 states and DC. This would be a substantial decline from the previous two years. Some uncertainty remains for FY 2016 since, at the time of the survey, legislatures had not yet enacted a final state budget for FY 2016 in Illinois and Pennsylvania.
FY 2015: Expansion and Non-Expansion States
In FY 2015, Medicaid enrollment and total spending growth in expansion states far exceeded growth in non-expansion states. Expansion states reported enrollment and spending growth nearly three times the rate of non-expansion states. (Figure 4) A total of 29 states were implementing the ACA Medicaid expansion in FY 2015, up from the 26 states in the previous year. The three additional states that implemented the Medicaid expansion in FY 2015 were New Hampshire in August 2014, Pennsylvania in January 2015 and Indiana in February 2015.
Across the 29 states expanding Medicaid in FY 2015, enrollment increased on average by 18.0 percent and total spending by 17.7 percent. Enrollment in expansion states was driven by growth among adults qualifying under the new expansion group, although nearly all expansion states also saw increased enrollment among the elderly and two-thirds saw increased enrollment among children. Some expansion states reported declines in enrollment in the eligibility categories for pregnant women, individuals with disabilities and other non-elderly adults as individuals gained coverage under the Medicaid expansion group instead of qualifying based on categorical requirements or through more limited pathways.
Of the 29 states expanding Medicaid in FY 2015, slightly more than half (17 states) noted that enrollment initially increased faster than expected. For most states, the cost of the new enrollees was less than expected; nearly two-thirds of expansion states reported that per member per month costs for the expansion population were at or below projections.7 Across the 29 states that had implemented the ACA Medicaid expansion as of FY 2015, the rate of growth in total Medicaid spending averaged 17.7 percent, very similar to the 18.0 percent enrollment growth rate. (Figure 4)
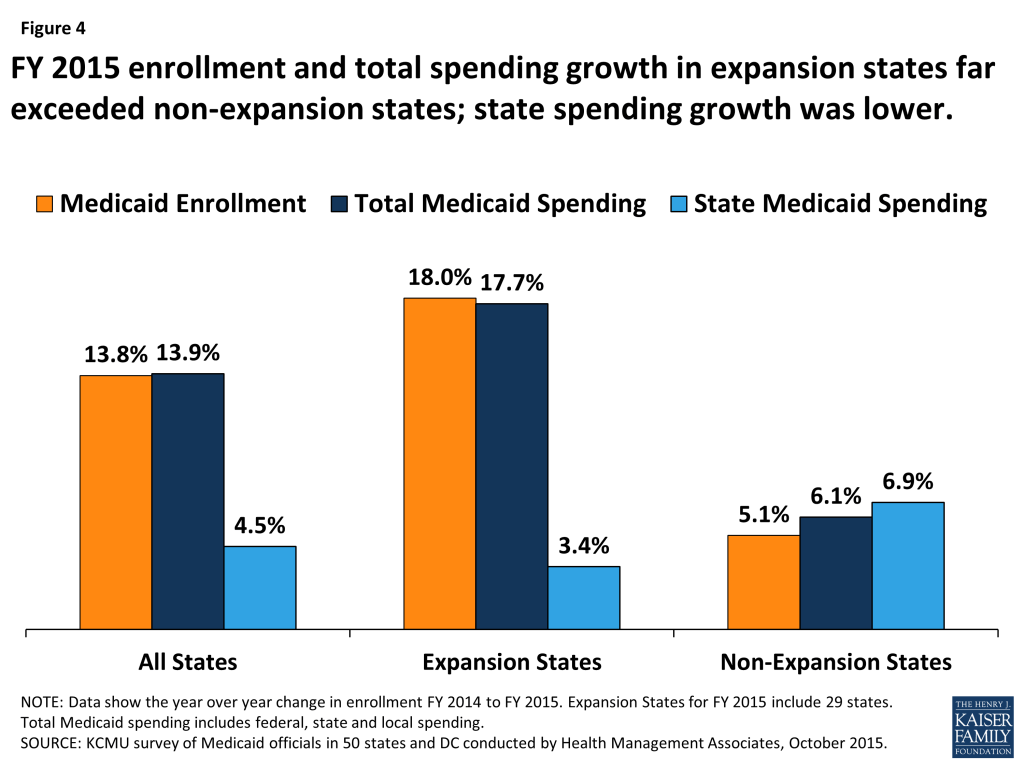
Across the 22 non-expansion states in FY 2015, enrollment and total Medicaid spending grew 5.1 percent and 6.1 percent (respectively), much slower growth than experienced by expansion states. Increased Medicaid enrollment among “previously eligible but not enrolled” parents and children was the primary reason cited for Medicaid enrollment growth in non-expansion states in FY 2015. Additionally, total Medicaid spending increased on average by 6.1 percent across non-expansion states in FY 2015, also primarily due to growth in Medicaid enrollment. (Figure 4)
Growth in state general fund spending for Medicaid in expansion states was much slower than total Medicaid spending in FY 2015, due to the ACA enhanced FMAP. In the 29 states that had implemented the Medicaid expansion in FY 2015, state general fund spending on Medicaid increased on average by 3.4 percent (compared to total Medicaid spending growth of 17.7 percent). States that implement the Medicaid expansion receive 100 percent federal match for those made eligible by the expansion; therefore, the increase in total Medicaid spending in these states was supported primarily by the increase in federal matching funds to these states.
In FY 2015, across the 22 non-expansion states, state general fund spending on Medicaid increased by 6.9 percent on average, slightly higher than total Medicaid spending growth of 6.1 percent. (Figure 4) Differences between total and state Medicaid spending growth in non-expansion states were driven by annual formula-driven changes in the FMAP, particularly for some large non-expansion states. For example, in Texas the FMAP dropped from 58.69 percent to 58.05 percent, necessitating additional state Medicaid spending to maintain current programs.
Enacted Budgets for FY 2016: Expansion and Non-Expansion States
In FY 2016, the Medicaid enrollment growth rate is expected to slow across all states, and the variation in enrollment growth between expansion and non-expansion states is expected to narrow. (Figure 5) Slower overall growth in Medicaid enrollment in FY 2016 is anticipated because of three main factors. First, enrollment growth among those newly eligible under the ACA Medicaid expansion is moderating, after the initial surge in growth in 2014 or 2015. Second, an improving economy has contributed to less demand for Medicaid. Third, in some states, slowing enrollment is tied to the timing of annual renewals. In response to challenges states faced implementing new eligibility and enrollment systems in 2014, CMS granted waivers to a number of states (expansion and non-expansion alike) to postpone eligibility redeterminations and renewals for several months. Many states that postponed redeterminations reported that enrollment growth moderated or declined when renewal backlogs were addressed and regular renewal procedures were resumed.
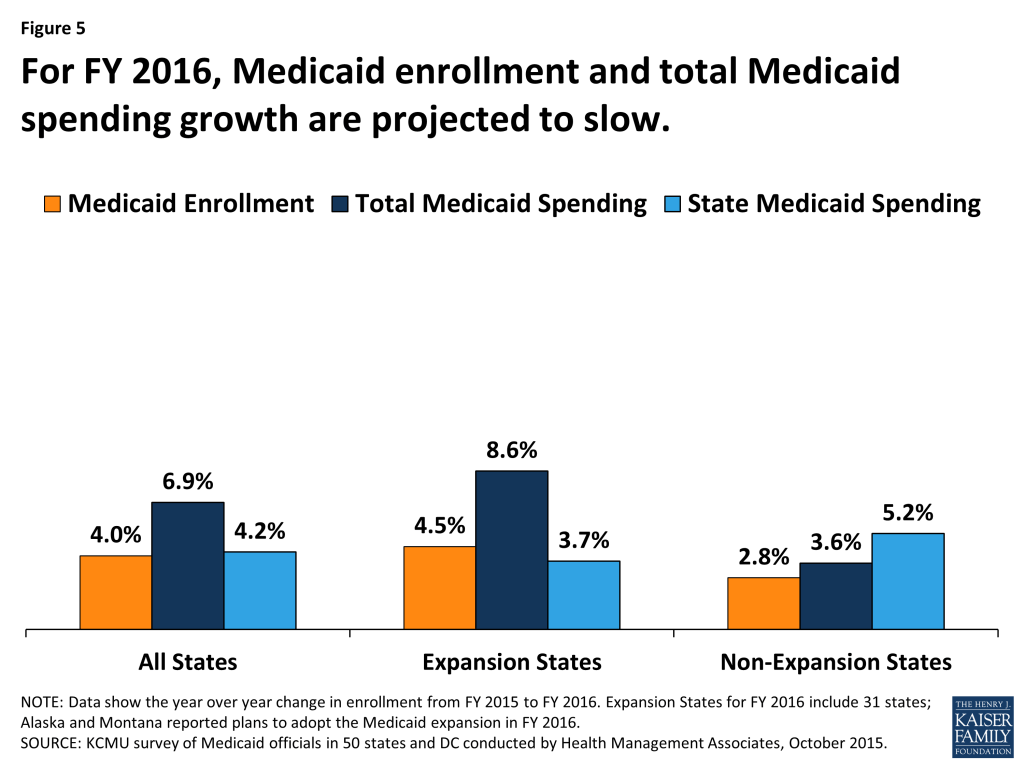
In FY 2016, most expansion states expect Medicaid enrollment and Medicaid spending growth to slow, compared to FY 2015. In FY 2016, two additional states plan to implement the Medicaid expansion. Alaska began implementation in September 2015 and Montana plans to implement in January 2016.8 Across the 31 Medicaid expansion states, enrollment is expected to increase on average by 4.5 percent in FY 2016. New enrollment among expansion adults is projected to drive enrollment growth across all expansion states, but particularly in Alaska and Montana (newly adopting states in FY 2016) and in Indiana and Pennsylvania (states that adopted in late FY 2015). Although the other expansion states expect overall enrollment growth driven by the expansion group to continue in FY 2016, these states expect growth rates to moderate substantially compared to FY 2015.
Three states (Minnesota, Massachusetts and Oregon) project that FY 2016 enrollment will be less than FY 2015 enrollment. Minnesota reported that enrollment in Medicaid is expected to decline primarily because of the implementation of the Basic Health Plan (BHP). Under the state’s Basic Health Plan, individuals with incomes between 138% and 200% FPL previously covered under Medicaid were shifted to BHP coverage. Massachusetts projects enrollment to decline among non-elderly, non-disabled adults. Non-elderly, non-disabled adults were temporarily enrolled in Medicaid while the state resolved issues with its eligibility and enrollment system that prevented the completion of Medicaid and Marketplace eligibility determinations. Oregon also projects enrollment to decline across MAGI adults, due in part to the resumption of redeterminations. As enrollment growth is projected to slow in FY 2016, so is total Medicaid spending growth. Across the 31 expansion states, growth in total Medicaid spending in FY 2016 is projected to be 8.6 percent on average. State Medicaid spending growth in expansion states is projected to increase by less than half that rate, on average by 3.7 percent, due to the enhanced ACA match rate for newly eligible adults. (Figure 5)
Across the 20 non-expansion states in FY 2016, Medicaid enrollment is projected to increase on average by 2.8 percent and total Medicaid spending is expected to increase on average by 3.6 percent. Non-expansion states reported that they expect to continue to see some increased participation among those previously eligible but not enrolled, but the resumption of regular renewals and the improving economy are factors working to slow enrollment growth. Slowing enrollment growth is expected to result in slower total Medicaid spending growth.
Formula-driven changes to the traditional federal Medicaid match rate as well as specific issues in some large states are driving changes in state Medicaid spending projections in non-expansion states in FY 2016. Enacted budgets across the 20 non-expansion states authorized state general fund Medicaid spending increases of 5.2 percent on average, compared to average growth in total Medicaid spending of 3.6 percent. This higher growth for state spending is largely attributed to continued declines in the formula driven FMAP for Texas (a significant drop from 58.05 percent to 57.13 percent) and in other states, as well as other state-specific changes in sources of funding. For example, in Florida, another state where changes have a large effect on the weighted average, state general fund spending for Medicaid is expected to increase at a higher rate than for total spending for Medicaid due to changes in funding for its Low-Income Pool (LIP) program. Under the renewal of the Florida LIP waiver, the federal contribution declined substantially resulting in a need for a larger increase state Medicaid spending.
The Effect of the Medicaid Expansion on State Budgets
In addition to increases in health coverage and reductions in the number of uninsured, state decisions about whether to expand Medicaid have broader economic and fiscal implications.9 This year, Medicaid directors in states that implemented the expansion were asked to report if state budget savings were occurring in specific areas outside of the Medicaid program. Early evidence from some expansion states shows that additional federal Medicaid dollars can result in savings in state general fund spending both within the Medicaid budget as well as for other state programs or agencies. Although states reported that isolating the fiscal impact of expanded Medicaid eligibility from other ACA effects and/or other factors affecting health care costs can be a challenge.10 Some Medicaid directors noted that state “savings” were realized by other programs and were reinvested in those programs. Other states noted that savings were generated but did not accrue at the state-level, but did accrue at the county-level.Other Medicaid directors were not able to report whether savings accrued or not, since they were not familiar with other program budgets. However, a number of Medicaid directors did report seeing savings, suggesting these are areas to continue to watch going forward.
- Behavioral Health: Thirteen (13) states reported savings in either FY 2015 or FY 2016 as individuals who previously received state-funded behavioral health services were now receiving those services under Medicaid.
- Uncompensated Care: Six states reported savings for the state budget related to state funding for uncompensated care costs in either FY 2015 or FY 2016.
- Criminal Justice / Corrections: Fifteen (15) states reported savings related to state funding for criminal justice due to the expansion in either FY 2015 of FY 2016. Under federal law, Medicaid reimbursement is available for care provided to eligible individuals who are admitted to an inpatient facility (not on jail or prison grounds), such as a hospital, for at least 24 hours. Prior to the ACA, few states had pursued Medicaid reimbursement for these services given the limited share of the incarcerated population that could qualify for Medicaid.11 With the expansion, a larger share of the incarcerated population may qualify for Medicaid.12
- Revenue: Twelve (12) states reported either provider tax revenues or general revenues had increased in either FY 2015 or FY 2016 due to the expansion.
Conclusion and Looking Ahead
Historically, Medicaid enrollment and spending have been driven largely by economic conditions as well as state and federal policy decisions. Over the past two decades, two major recessions resulted in periods of significant growth in Medicaid program enrollment and spending, with the rate of growth slowing as the economy improved. Since 2014, the implementation of the ACA has been the primary driver of Medicaid enrollment and spending growth, particularly in states implementing the Medicaid expansion. Looking ahead to FY 2016 and beyond, enrollment and spending growth are expected to slow as the effects of the ACA eligibility changes play out both in states implementing and not implementing the ACA Medicaid expansion. Expansion states are also looking ahead to FY 2017 when new state fund dollars will be needed when the enhanced match rate for newly eligible enrollees starts to decline, dropping from 100 percent to 95 percent starting January 1, 2017 (halfway through FY 2017 for most states.) States will also continue to monitor how the ACA provisions are affecting Medicaid enrollment and spending, other areas of the state budget, overall health insurance coverage, and the health care systems in their state. Many states are also engaged in major payment and delivery system reform efforts that have implications for program performance and spending as well as the health and health care for the millions of beneficiaries served by Medicaid.
The authors express their appreciation to Dennis Roberts, who managed the database. We also thank the Medicaid directors and staff in all 50 states and the District of Columbia who completed the survey on which this brief is based.
Methodology
Methodology
Definition of Medicaid Spending. Total Medicaid spending includes all payments to Medicaid providers for Medicaid covered services provided to enrolled Medicaid beneficiaries. In addition, total Medicaid spending includes special payments to “disproportionate share hospitals” (“DSH payments”) that subsidize uncompensated care for persons who are uninsured and unreimbursed costs related to care for persons on Medicaid. Not included in total Medicaid spending are Medicaid administrative costs and federally mandated state “Clawback” payments to Medicare (to help finance the Medicare Part D prescription drug benefit for beneficiaries who are dually enrolled in both Medicare and Medicaid.) States are also asked to exclude costs for the Children’s Health Insurance Program (CHIP) though a few states provided percentage changes for spending that reflected Medicaid and CHIP combined. Total Medicaid spending includes payments financed from all sources, including state funds, local contributions and federal matching funds. Historical state Medicaid spending refers to all non-federal spending, which may include local funds and provider taxes and fees as well as state general fund dollars. State spending for FYs 2014-2016 collected as part of this survey reflect state spending, largely state general fund dollars.
Methodology. The Kaiser Commission on Medicaid and the Uninsured (KCMU) commissioned Health Management Associates (HMA) to survey Medicaid directors in all 50 states and the District of Columbia to identify and track trends in Medicaid spending, enrollment and policy making. This was the fifteenth annual survey, conducted at the beginning of each state fiscal year from FY 2002 through FY 2016.
The KCMU/HMA Medicaid survey on which this report is based was conducted from June through August 2015. Medicaid directors and staff provided data for this report in response to a written survey and a follow-up telephone interview. The survey was sent to each Medicaid director in June 2015. All 50 states and DC completed surveys and participated in telephone interview discussions in June, July and August 2015. The telephone discussions are an integral part of the survey to ensure complete and accurate responses and to record the complexities of state actions.
At the time of the survey, two states (Illinois and Pennsylvania) had not enacted budgets for FY 2016. For Pennsylvania, the projections for FY 2016 reflect the governor’s estimates provided to NASBO.13 For Illinois, the Governor’s budget anticipated large cuts in Medicaid that may be unachievable given that the timing in the fiscal year so spending data for Illinois is not included in weighted averages for FY 2016.
Annual rates of growth for Medicaid enrollment and spending were calculated as weighted averages across all states, and for states based on state decisions to implement the ACA Medicaid expansion in 2015 or 2016. For FYs 2014, 2015 and 2016, average annual Medicaid spending growth was calculated using weights derived from the most recent state Medicaid expenditure data for fiscal year 2014, based on estimates prepared for KCMU by the Urban Institute using CMS Form 64 reports, adjusted for state fiscal years. These data were also used for historic Medicaid spending. Medicaid enrollment average annual growth rates were calculated using weights based on Medicaid and CHIP monthly enrollment data for June 2014 published by CMS.14 Historical enrollment trend data reflects the annual change from June to June of monthly enrollment data for Medicaid beneficiaries collected from states.15
Because the data reported here for FYs 2015 and 2016 are weighted averages derived from Medicaid enrollment and spending, data reported for states with larger enrollment and spending have a larger effect on the national average. These effects are further amplified when looking at smaller groups of states, such as states implementing the Medicaid expansion and those that have not. Additional information collected in the survey on policy actions taken during FY 2015 and FY 2016 can be found in the companion report at: www.kff.org
Appendix
Appendix: Background on Medicaid Financing
Medicaid Financing Structure
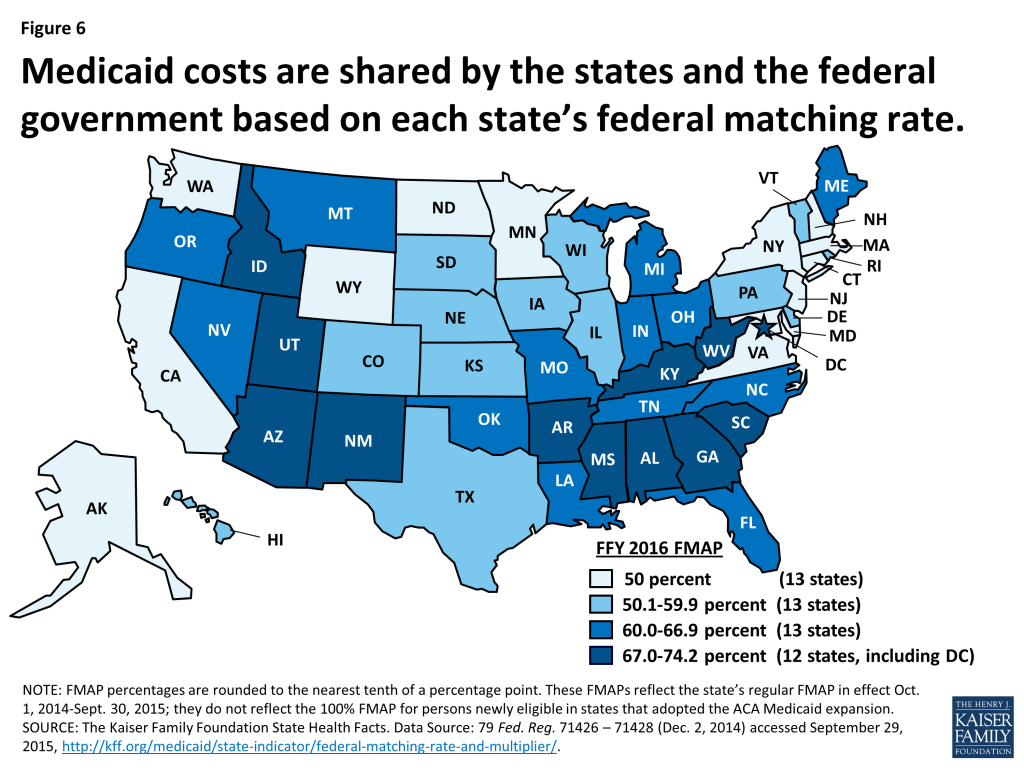
The Medicaid program is jointly funded by states and the federal government. The federal government guarantees match funds to states for qualifying Medicaid expenditures (payments states make for covered Medicaid services provided by qualified providers to eligible Medicaid enrollees.) The federal match rate (Federal Medical Assistance Percentage or FMAP) is calculated annually for each state using a formula set in the Social Security Act which is based on a state’s average personal income relative to the national average; poorer states have higher FMAPs. Personal income data are lagged, so data used for FFY 2016 FMAPs are from the three years of 2011 to 2013. According to the formula, the FMAP in FFY 2015 varies across states from a floor of 50 percent to a high of 74.2 percent. (Figure 6) This means every $1 of state spending on Medicaid is matched with at least $1 of federal funds.16
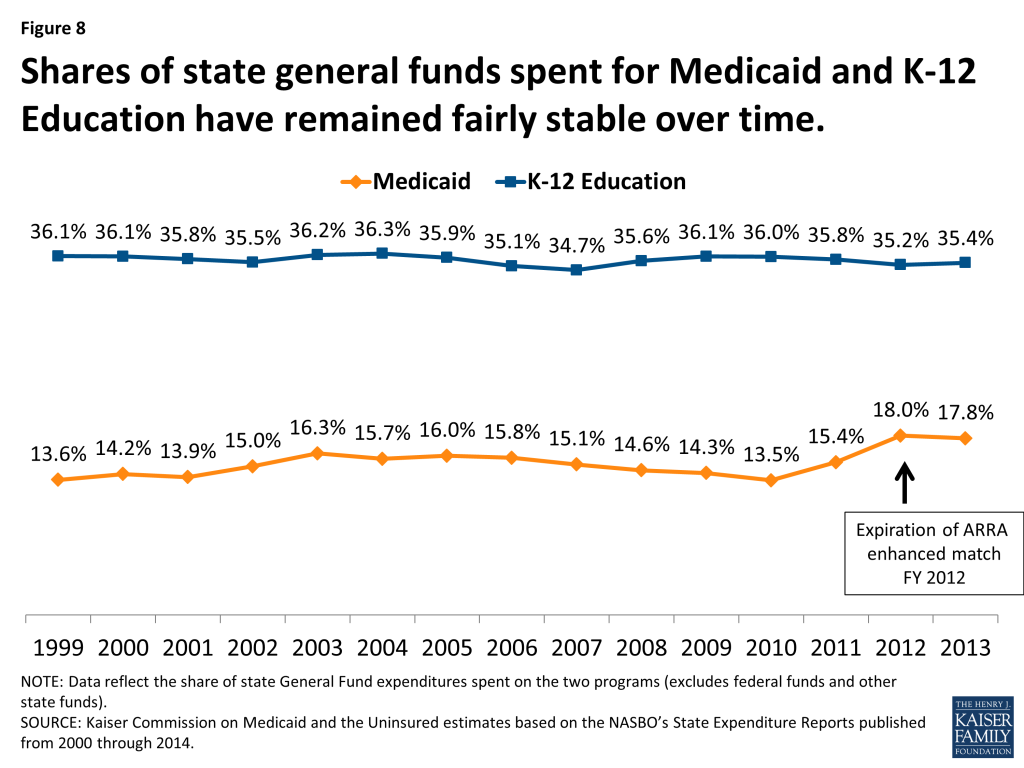
Medicaid’s Role in State Budgets
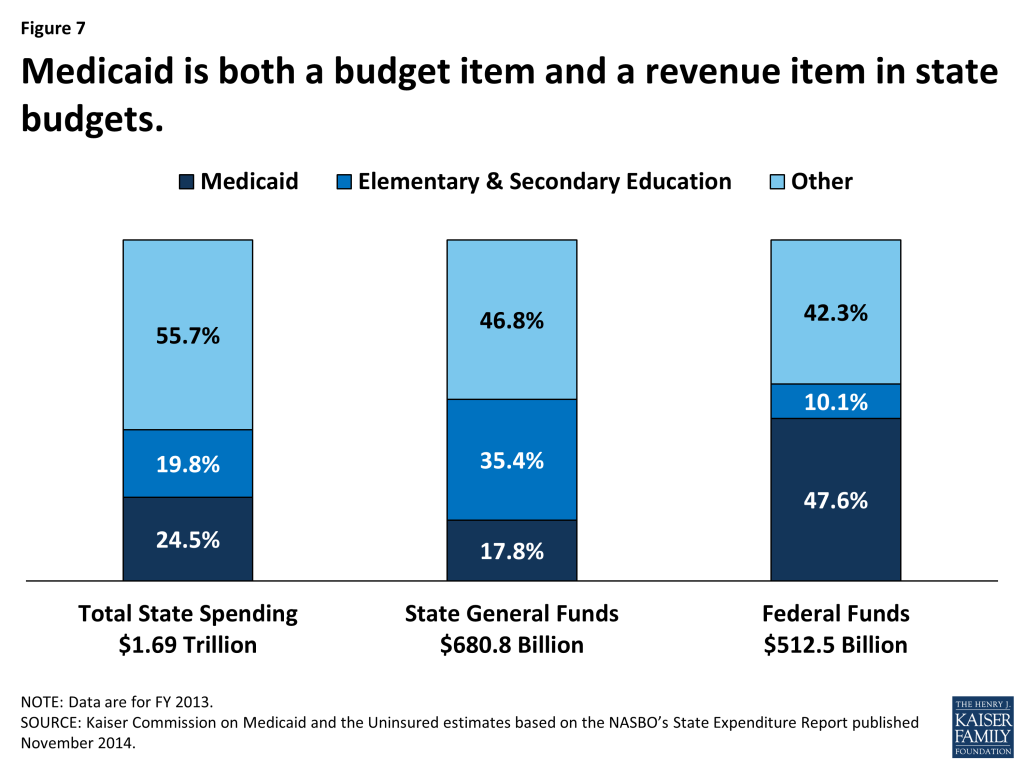
Medicaid has a unique role in state budgets because it is both an expenditure item and a source of federal revenue for states. In FY 2013, Medicaid accounted for 24.5 percent of total spending, but only 17.8 percent of all state general fund spending, a far second to spending on K-12 education (35.4 percent of state general fund spending.)17 Due to the federal match structure for Medicaid, the program is the largest source of federal funds for states, accounting 47.6 percent of all federal funds for states in FY 2013. Over the last decade, shares of general fund spending for Medicaid and K-12 education have remained fairly constant with an uptick in the share of general fund spending on Medicaid since 2010 in part due to the June 2011 expiration of the enhanced FMAP provided by under the American Recovery and Reinvestment Act (ARRA). (Figures 7 and 8)
Medicaid and the Economy
Medicaid is a countercyclical program. During economic downturns individuals lose jobs, incomes decline and more people qualify and enroll in Medicaid which increases program spending. At the same time, economic downturns negatively affect state tax revenues. This places additional pressure on state budgets as demand for other forms of assistance (i.e. food stamps and unemployment benefits) also increases. During economic downturns, states face difficulty balancing these pressures. In response, Congress has twice passed temporary increases to the FMAP rates to help support states during economic downturns, most recently in 2009 as part of the American Recovery and Reinvestment Act (ARRA.) The ARRA-enhanced match rates provided states with the largest source of federal fiscal relief, over $100 billion in additional federal funds over 11 quarters, ending in June 2011.18
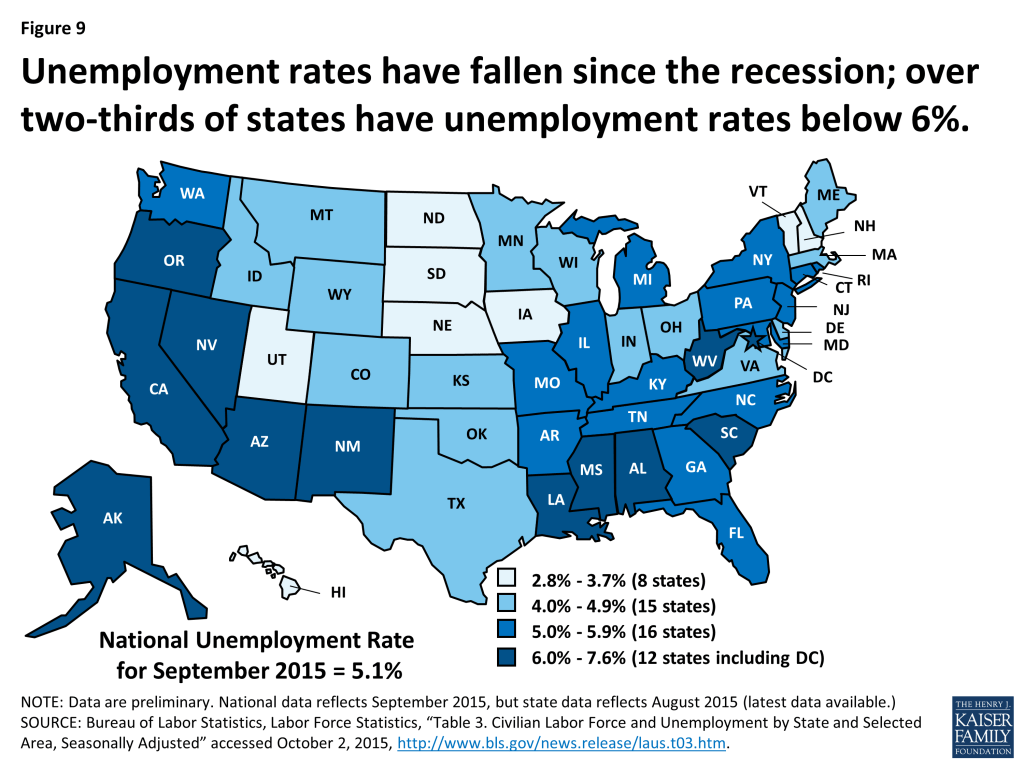
As economic conditions improve, demand for Medicaid coverage moderates. State economies have seen sustained improvement following the worst recession since the Great Depression. The national unemployment rate has continued to decline, falling to 5.1 percent in September 2015, the lowest rate since April 2008.19 Over two-thirds of states had unemployment rates at or below six percent in July 2015. (Figure 9) After 67 months of private-sector job growth, there were over 4.3 million more private sector jobs in September 2015 than before the recession.20 However, an estimated 7.9 million people remain unemployed, nearly 27 percent of whom are long-term unemployed (those actively looking for work for 27+ weeks.21 )
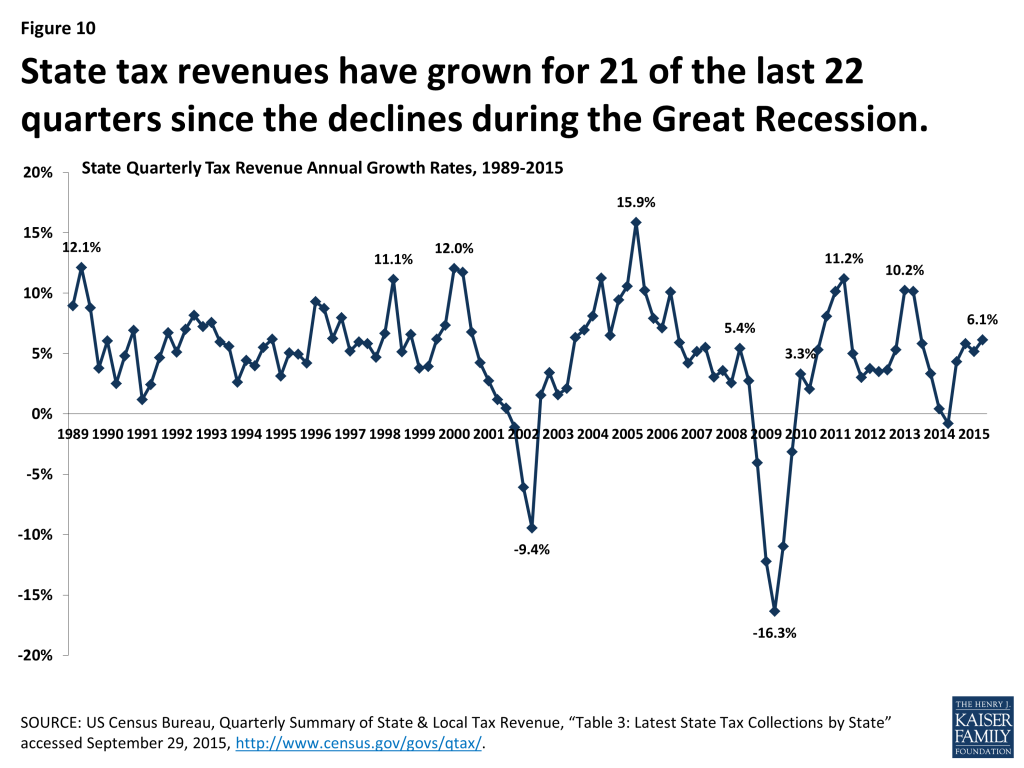
Real gross state product (GSP), a measure of state economic activity, grew by 2.2 percent from 2013 to 2014 at the national level, the fifth year of consecutive growth at the national level. All but two states (Alaska and Mississippi) experienced positive GSP growth from 2013 to 2014, ranging up to 6.3 percent.22 State revenue collections have also improved. After experiencing the sharpest decline in state tax revenues on record during the Great Recession, states had seen tax revenue growth 21 of the last 22 quarters.23 (Figure 10) The improving economic conditions have acted as a downward pressure on Medicaid enrollment growth in recent years. However, the moderating effect of the improving economic conditions has been outweighed by policy changes to expand coverage under the ACA.
Endnotes
- Two expansion states (Arkansas and Pennsylvania) did not respond to this question. Of the remaining 27 states that had implemented the Medicaid expansion at the time of the survey, 20 reported the average per-member per-month costs had come in either below or on target with initial projections. ↩︎
- Alaska and Montana plan to implement the Medicaid expansion in FY 2016; they are therefore counted as not implementing the Medicaid expansion in FY 2015. ↩︎
- Historical state Medicaid spending refers to all non-federal spending, which may include local funds and provider taxes and fees as well as state general fund dollars. State spending for FYs 2014-2016 collected as part of this survey reflect state spending, largely state general fund dollars. ↩︎
- National Association of State Budget Officers, Fiscal Survey of States (Washington, DC: National Association of State Budget Officers, Spring 2015), http://www.nasbo.org/publications-data/fiscal-survey-of-the-states. ↩︎
- Two expansion states (Arkansas and Pennsylvania) did not respond to this question. Of the remaining expansion states, responses were less clear. Some noted higher than expected costs in reference to an earlier period not covered in this survey. Others indicated that they could not disaggregate expansion increases from other MCO increases. Only a few indicated that costs on a pmpm basis were higher than they had originally projected. ↩︎
- The state adopted the Medicaid expansion through legislation that requires federal waiver approval. ↩︎
- Stan Dorn, Norton Francis, Laura Snyder and Robin Rudowitz, The Effects of the Medicaid Expansion on State Budgets: An Early Look in Select States (Washington, DC: Kaiser Commission on Medicaid and the Uninsured, March 2015), https://modern.kff.org/medicaid/issue-brief/the-effects-of-the-medicaid-expansion-on-state-budgets-an-early-look-in-select-states/. Sherry Glied and Stephanie Ma, How States Stand to Gain or Lose Federal Funds by Opting In or Out of the Medicaid Expansion (New York City, NY: The Commonwealth Fund, December 2013), http://www.commonwealthfund.org/Publications/Issue-Briefs/2013/Dec/Federal-Funds-Medicaid-Expansion.aspx. ↩︎
- Stan Dorn, Norton Francis, Laura Snyder and Robin Rudowitz, The Effects of the Medicaid Expansion on State Budgets: An Early Look in Select States (Washington, DC: Kaiser Commission on Medicaid and the Uninsured, March 2015), https://modern.kff.org/medicaid/issue-brief/the-effects-of-the-medicaid-expansion-on-state-budgets-an-early-look-in-select-states/. ↩︎
- State Health Care Spending Project, Managing Prison Health Care Spending (Washington DC: Pew Charitable Trusts and John D. and Catherine T. MacArthur Foundation, October 2013), http://www.pewtrusts.org/~/media/legacy/uploadedfiles/pcs_assets/2014/PCTCorrectionsHealthcareBrief050814pdf.pdf. ↩︎
- Ibid. ↩︎
- National Association of State Budget Officers, Fiscal Survey of States (Washington, DC: National Association of State Budget Officers, Spring 2015), http://www.nasbo.org/publications-data/fiscal-survey-of-the-states. ↩︎
- The Kaiser Family Foundation State Health Facts. Data Source: Centers for Medicare and Medicaid Services, Medicaid & CHIP Monthly Application, Eligibility Determinations, and Enrollment Reports. (Washington, DC: Centers for Medicare and Medicaid Services, August 2014), http://www.medicaid.gov/medicaid-chip-program-information/program-information/medicaid-and-chip-enrollment-data/medicaid-and-chip-application-eligibility-determination-and-enrollment-data.html. ↩︎
- Laura Snyder, Robin Rudowitz, Eileen Ellis and Dennis Roberts, Medicaid Enrollment: June 2013 Data Snapshot (Washington, DC: Kaiser Commission on Medicaid and the Uninsured, January 29, 2014), https://modern.kff.org/medicaid/issue-brief/medicaid-enrollment-june-2013-data-snapshot/. ↩︎
- The Kaiser Family Foundation State Health Facts. Data Source: 79 Fed. Reg. 71426 – 71428 (Dec. 2, 2014) accessed September 29, 2015, https://modern.kff.org/medicaid/state-indicator/federal-matching-rate-and-multiplier/. ↩︎
- Kaiser Commission on Medicaid and the Uninsured estimates based on the data reported in: National Association of State Budget Officers, State Expenditure Report – Examining Fiscal 2012-2014 State Spending (Washington, DC: National Association of State Budget Officers, November 2014), http://www.nasbo.org/publications-data/state-expenditure-report/state-expenditure-report-fiscal-2012-2014-data. ↩︎
- To be eligible for ARRA funds, states could not restrict eligibility or tighten enrollment procedures in Medicaid or CHIP. Vic Miller, Impact of the Medicaid Fiscal Relief Provisions in the American Recovery and Reinvestment Act (ARRA) (Washington, DC: Kaiser Commission on Medicaid and the Uninsured, October 2011), https://modern.kff.org/medicaid/issue-brief/impact-of-the-medicaid-fiscal-relief-provisions/. ↩︎
- Bureau of Labor Statistics, Labor Force Statistics from the Current Population Survey, “(Seas) Unemployment Rate (Series ID: LNS14000000)” accessed October 2, 2015, http://data.bls.gov/timeseries/LNS14000000. ↩︎
- Bureau of Labor Statistics, Employment, Hours, and Earnings from the Current Employment Statistics Survey, “Total Private Employment (Series ID: CES0500000001) December 2007 through September 2015”accessed October 2, 2015, http://data.bls.gov/cgi-bin/dsrv. ↩︎
- Bureau of Labor Statistics, Labor Force Statistics from the Current Population Survey, “A-12. Unemployed persons by duration of unemployment, seasonally adjusted” accessed October 2, 2015, http://www.bls.gov/web/empsit/cpseea12.htm. ↩︎
- Bureau of Economic Analysis, “Broad Growth Across States in 2014 – Advance 2014 and Revised 1997-2013 Statistics of GDP by State” (Washington, D.C.: US Department of Commerce, June 10, 2015), http://www.bea.gov/newsreleases/regional/gdp_state/gsp_newsrelease.htm. ↩︎
- US Census Bureau, Quarterly Summary of State & Local Tax Revenue, “Table 3: Latest State Tax Collections by State” accessed September 29, 2015, http://www.census.gov/govs/qtax/. ↩︎