Medicaid Enrollment & Spending Growth: FY 2020 & 2021
Issue Brief
Key Takeaways
The coronavirus pandemic has generated both a public health crisis and an economic crisis, with major implications for Medicaid, a countercyclical program. During economic downturns, more people enroll in Medicaid, increasing program spending at the same time state tax revenues may be falling. To help both support Medicaid and provide broad fiscal relief as revenues have declined precipitously, the Families First Coronavirus Response Act (FFCRA) authorized a 6.2 percentage point increase in the federal match rate (“FMAP”) (retroactive to January 1, 2020) available if states meet certain “maintenance of eligibility” (MOE) requirements. The health and economic consequences of the pandemic as well as the temporary FMAP increase were major drivers of Medicaid enrollment and spending trends as states finished state fiscal year (FY) 2020 and started FY 2021 (which for most states began on July 1).1
This brief analyzes Medicaid enrollment and spending trends for FY 2020 and FY 2021 based on data provided by state Medicaid directors as part of the 20th annual survey of Medicaid directors in all 50 states and the District of Columbia. Overall, 43 states2 responded to the survey by mid-August 2020, although response rates for specific questions varied. The methodology used to calculate enrollment and spending growth as well as additional information about Medicaid financing can be found at the end of the brief. Key findings include the following:
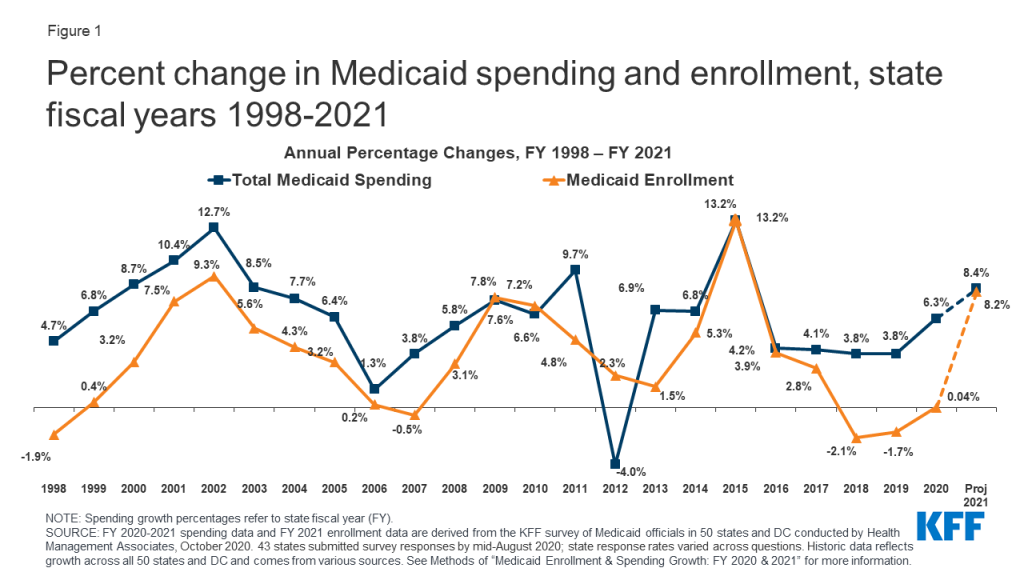
- After relatively flat enrollment growth in FY 2020 (0.04%), states responding to the survey expect Medicaid enrollment to jump in FY 2021 (8.2%) attributed to the FFCRA’s MOE requirements and to the economic downturn that started late in FY 2020.
- Across all reporting states, states were anticipating that total Medicaid spending growth would accelerate to 8.4% in FY 2021 compared to growth of 6.3% in FY 2020. Enrollment was the primary factor identified as putting upward pressure on expenditure growth in FY 2021.
- While expected state spending on Medicaid is crucial to state budgets, the projections in this year’s survey do not provide a clear picture because enhanced federal funding is now slated to expire at the end of March 2021 based on the recent renewal of the Public Health Emergency (PHE), later than states had generally assumed. At the time of the survey, states estimated that state Medicaid spending would decline in FY 2020 (-0.5%) and then sharply increase in FY 2021 (12.2%) with most states assuming that the enhanced matching funds would expire by December 2020.
- Looking ahead, states are faced with many layers of uncertainty about the trajectory of the pandemic and economic downturn as well as the duration of the enhanced FMAP and the outcome of the elections in November.
Context
Medicaid (together with CHIP) provided coverage to about one in five Americans, or about 73.5 million people, as of May 2020. Total Medicaid spending was nearly $604 billion in FY 2019 with 64.4% paid by the federal government and 35.6% financed by states. Medicaid accounts for one in six dollars spent in the health care system and more than half of spending on long-term services and supports.3
Prior to the pandemic, state fiscal conditions were strong in FY 2020. Unemployment was low, states expected revenues to grow for the 10th consecutive year, and state general fund spending was on track to grow by 5.8%. In this context, Governors had developed budget proposals for FY 2021 that included projections for continued revenue and spending growth. Governors’ budgets are generally released early in the calendar year.
The pandemic resulted in a dramatic reversal in state fiscal conditions. Early estimates indicate that states are facing large shortfalls, with some estimates showing state budget shortfalls of up to $110 billion for FY 2020 and up to $290 billion for FY 2021. Other early reports from states similarly show state revenue declines of up to 15% in FY 2020 and up to 30% for FY 2021 compared to pre-pandemic state estimates of state revenue totaling $913 billion for FY 2020 and $944 billion in FY 2021. Faced with continued uncertainty regarding ongoing revenue collections and the possibility of additional federal fiscal relief, several states adopted temporary budgets or continuing resolutions to begin FY 2021 while some other states with previously enacted FY 2021 budgets planned to convene special sessions to adjust appropriation levels.4 Unlike the federal government, states must meet balanced budget requirements. In the face of major revenue shortfalls due to the economic effects of the pandemic, states can use reserves or cut spending if additional federal support is not available. During the Great Recession, states imposed layoffs or furloughs for state workers, reduced funding for state governments, made across the board spending cuts and program cuts to education, higher education, and Medicaid. However, major cuts to state services and workforce can be harmful to state residents facing increased demands for services and can also weaken economic recovery efforts. To reduce Medicaid spending during economic downturns, states typically turn to provider rate and benefit restrictions, however, with providers facing revenue shortfalls and enrollees facing increased health risks due to the pandemic, these methods to control costs may not be as viable.
While the FMAP increase included in the FFCRA supports Medicaid and provides broad fiscal relief to states, it is unlikely to fully offset state revenue declines and fully address state budget shortfalls. In the past, federal fiscal relief provided through increases in the Medicaid FMAP—or the share of Medicaid costs paid by the federal government— during significant economic downturns has helped to both support Medicaid and provide efficient, effective, and timely fiscal relief to states. The Families First Coronavirus Response Act (FFCRA) uses this model as well by providing a temporary 6.2 percentage point increase in the Medicaid FMAP from January 1, 2020 through the end of the quarter in which the public health emergency (PHE) ends. This FMAP increase does not apply to the ACA expansion group, for which the federal government already pays 90% of costs. To be eligible for the funds, states cannot implement more restrictive Medicaid eligibility standards or higher premiums than those in place as of January 1, 2020, must provide continuous eligibility for enrollees through the end of the month of the emergency period, and cannot impose cost sharing for COVID-19 related testing and treatment services including vaccines, specialized equipment, or therapies. States access the enhanced funds by submitting claims for federal reimbursement for Medicaid expenditures.
While all states are experiencing fiscal stress tied to the pandemic, the experience varies across states. For example, while the national unemployment rate in August 2020 was 8.4% (a decline from its initial peak of 14.7% in April 2020 at the start of the pandemic), there was considerable state variation in unemployment with state rates ranging from 4.0% (Nebraska) to 13.2% (Nevada). California, Hawaii, New York, Rhode Island and Nevada reported the highest state unemployment rates, exceeding the national rate by three percentage points or more. Similarly, projected revenue shortfalls vary across states, with states reporting revenue declines ranging from 1% to 15% in FY 2020 and from 1% to 30% for FY 2021.
Key Findings
Trends in Enrollment Growth FY 2020 and FY 2021
After declines in FY 2018 and 2019 followed by relatively flat enrollment growth in FY 2020, states expect Medicaid enrollment to jump in FY 2021 (Figure 1). Medicaid enrollment growth peaked in FY 2015 due to the implementation of the ACA and has tapered each year since. Enrollment declined in FY 2018 (-2.1%) and FY 2019 (-1.7%) and was relatively flat in FY 2020 (0.04%). However, for FY 2021, reporting states project a sharp increase in enrollment to 8.2%. A few states noted that the projections were completed prior to the pandemic and did not account for the economic downturn so were likely to change. Others noted uncertainty regarding when the PHE and related maintenance of effort (MOE) requirements would end, which would allow redeterminations and eligibility terminations to resume for beneficiaries who no longer meet eligibility standards (although fewer enrollees are likely to see income increase due to the economic downturn). A few states that recently adopted or implemented the Medicaid expansion anticipated larger increases in enrollment.
States largely attributed projected enrollment increases in FY 2021 to the FFCRA’s MOE requirements and to the economic downturn. All reporting states responded that the MOE was an upward or significant upward pressure on enrollment and nearly all reporting states noted that the economy was an upward or significant upward pressure on enrollment. The two factors (the MOE and the economy) are likely linked. Outside of the MOE, individuals may lose Medicaid coverage because they have a change in circumstance (such as an increase in income), because they fail to complete renewal processes or paperwork even when they remain eligible, or because they age out of a time- or age-limited eligibility category (e.g., pregnant women or former foster care youth). Due to the economic downturn, fewer enrollees are likely to see income increase, meaning they would remain eligible for Medicaid irrespective of the MOE. States anticipate that groups more sensitive to changes in economic conditions (e.g., children, parents, and other expansion adults) will grow faster than the elderly and people with disabilities; however, an aging state population was also identified as a key factor driving enrollment in almost half for reporting states. In last year’s survey, states tied declines in enrollment growth prior to the pandemic to a more robust economy, but also to process and systems changes including changes to renewal processes, upgraded eligibility systems, and enhanced data matching efforts to verify eligibility.
Trends in Spending Growth FY 2020 and FY 2021
Among reporting states, growth in total Medicaid spending was 6.3% in FY 2020, but is expected to jump to 8.4% in FY 2021 (Figure 1). High rates of enrollment growth, tied first to the Great Recession and later to the implementation of the ACA, were the primary drivers of total Medicaid spending growth over the last decade. Similarly, declining enrollment driven by a strong economy was the primary driver identified by states for slow total Medicaid spending growth in FY 2019. Even though enrollment growth was nearly flat in FY 2020, spending was in line with median spending growth over the last two decades. In last year’s survey, Medicaid officials indicated growth in total Medicaid expenditures for FY 2020 was largely tied to increasing costs for prescription drugs (particularly for specialty drugs), rate increases (most often for managed care organizations, hospitals, and nursing facilities), overall medical inflation, pressures from an aging state population, and a higher acuity case-mix.
For FY 2021, nearly all states expect enrollment increases to put upward pressure on total Medicaid expenditure growth, with additional upward pressure coming from spending on long-term services and supports and provider rate changes. Further, about three-quarters of states noted that utilization was a factor for Medicaid spending: slightly more than half of these states identified utilization as an upward pressure on projected spending while the remaining states indicated utilization was expected to be a downward pressure (likely due to pandemic-related utilization reductions). Overall, while many reporting states were uncertain or thought that the chance of a Medicaid budget shortfall was “50-50,” more states anticipated that a budget shortfall was “likely” or “almost certain” compared to “unlikely”; so, it is possible that current expenditure growth projections could be lower than what states actually experience.
Estimates that state Medicaid spending would decline in FY 2020 (-0.5%) and then sharply increase in FY 2021 (12.2%) were made prior to the most recent renewal of the PHE that extends the enhanced FMAP through March 2021 (Figure 2). The enhanced FMAP under FFCRA was retroactive to January 1, 2020 (halfway through most state fiscal years). The fiscal relief expires at the end of the quarter in which the Public Health Emergency (PHE) ends. On October 2, 2020 the PHE was extended from October 23, 2020 to January 21, 2021, leaving the enhanced FMAP in place through March 2021. However, states adopted budgets for FY 2021 prior to the most recent extension of the PHE, with most states anticipating that the enhanced FMAP would end by December 2020 or before. The anticipated expiration of the enhanced FMAP in 2020 along with overall increases in base Medicaid spending expected in FY 2021 resulted in a spike in projected state spending.
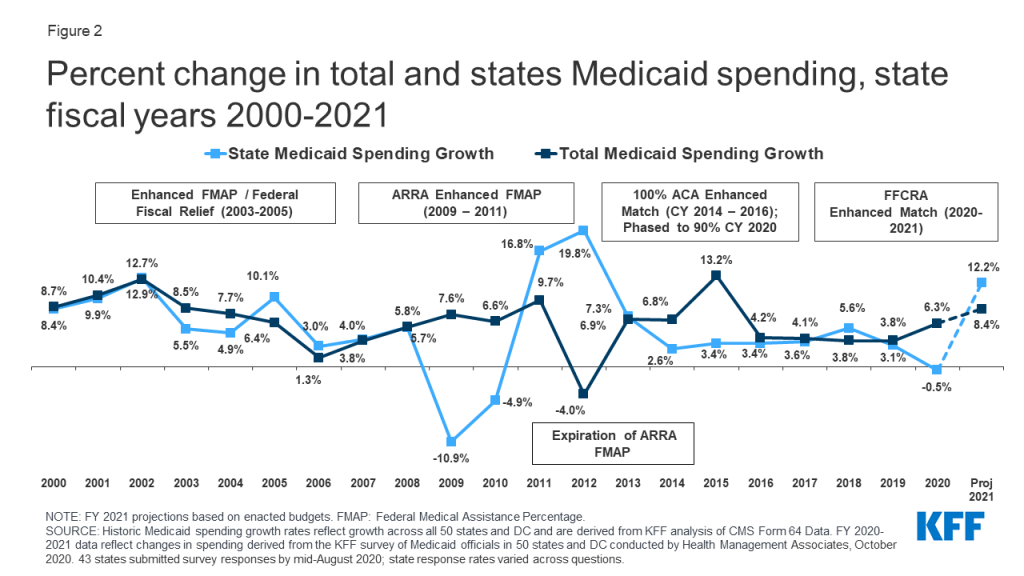
Nearly all reporting states indicated that federal fiscal relief is being used to support costs related to increased Medicaid enrollment and to help address Medicaid or general budget shortfalls. About two-thirds of reporting states said the fiscal relief is also being used to mitigate provider rate and/or benefit cuts. The state share of Medicaid spending typically grows at a similar rate as total Medicaid spending growth, unless there is a change in the federal matching rate. During the Great Recession, state spending for Medicaid declined in FY 2009 and FY 2010 due to fiscal relief from a temporary increase in the federal match rate provided in the American Recovery and Reinvestment Act (ARRA). State spending increased sharply when that fiscal relief ended. In other economic downturns (including the Great Recession), states typically turn to provider rate and benefit restrictions to reduce Medicaid spending, however, with providers facing revenue shortfalls and enrollees facing increased health risks due to the pandemic, these methods to control costs may not be as viable.
Conclusion and Looking Ahead
States are faced with many layers of uncertainty about the trajectory of the pandemic and economic downturn. Several states had adopted temporary budgets or continuing resolutions to start FY 2021, while other states noted FY 2021 state budgets had not yet been enacted. Some states planned to convene special sessions to make budget adjustments and noted further FY 2021 budget reductions were planned or likely. Unlike the federal government, states must meet balanced budget requirements. In the face of major revenue shortfalls due to the economic effects of the pandemic, states can use reserves or cut spending if additional federal support is not available. To reduce spending during economic downturns, states typically turn to provider rate and benefit restrictions, however, with providers facing revenue shortfalls and enrollees facing increasing health risks due to the pandemic, these methods to control costs may not be as viable. For now, states cannot restrict enrollment and must provide continuous coverage for current enrollees to access the enhanced Medicaid match rate in the FFCRA.
Looking ahead, states are also unsure about the duration of the PHE and the enhanced FMAP, whether Congress will consider additional fiscal relief, and the outcome of the elections. It is unclear if the PHE will be extended beyond the January 21, 2021. States have called for and the House passed legislation to increase the amount and duration of this federal fiscal relief, but to date the Senate has not considered these provisions. In addition, the US presidential election in November could have major implications for Medicaid, with a sharp contrast in goals for Medicaid and the ACA between President Trump and former Vice President Biden. Beyond the presidential election, the outcome of state elections (both governors and the make-up of state legislatures) will be important to watch.
Methods
Methods
Definition of Medicaid Spending. Total Medicaid spending includes all payments to Medicaid providers for Medicaid-covered services provided to enrolled Medicaid beneficiaries. Medicaid spending also includes special disproportionate share hospital (DSH) payments that subsidize uncompensated hospital care for persons who are uninsured and unreimbursed costs of care for persons on Medicaid. Not included in total Medicaid spending are Medicaid administrative costs and federally mandated state “Clawback” payments to Medicare (to help finance the Medicare Part D prescription drug benefit for Medicaid beneficiaries who are also enrolled in Medicare). States are also asked to exclude costs for the Children’s Health Insurance Program (CHIP). Total Medicaid spending includes payments financed from all sources, including state funds, local contributions, and federal matching funds. Historical state Medicaid spending refers to all non-federal spending, which may include local funds and provider taxes and fees as well as state general fund dollars.
Methodology. KFF commissioned Health Management Associates (HMA) to survey Medicaid directors in all 50 states and DC to identify and track trends in Medicaid spending, enrollment, and policymaking. Given differences in the financing structure of their programs, the U.S. territories were not included in this analysis. This is the 20th annual survey, conducted at the beginning of each state fiscal year from FY 2002 through FY 2021. The KFF/HMA Medicaid survey for this report was sent to each Medicaid director in June 2020. Forty-three states provided survey responses by mid-August 2020. The eight states that did not respond by this time are Delaware, the District of Columbia, Illinois, New Mexico, New York, Ohio, Rhode Island, and Utah.
For FY 2020 and FY 2021, annual rates of growth for Medicaid spending were calculated as weighted averages across all states. For FY 2020, 42 states reported Medicaid expenditure growth rates. For FY 2021, 40 states reported projected Medicaid expenditure growth rates. Weights for spending were derived from the most recent state Medicaid expenditure data for FY 2019, based on estimates prepared for KFF by the Urban Institute using CMS Form 64 reports, adjusted for state fiscal years. These CMS-64 data were also used for historic Medicaid spending and include all 50 states and DC. For FY 2018 and 2019, spending for New York was adjusted to reflect unexplained anomalies in the state spending on the CMS-64 data.
The average annual Medicaid enrollment growth rate for FY 2021 was calculated using weights based on Medicaid and CHIP preliminary monthly enrollment data for June 2020 published by CMS. For FY 2021, 41 states reported Medicaid enrollment growth rates. The data reported for FY 2019 and FY 2020 for Medicaid spending and FY 2020 for Medicaid enrollment are weighted averages, and therefore, data reported for states with larger enrollment and spending have a greater effect on the national average.
Historical enrollment trend data for FY 1998 to FY 2013 reflects the annual percentage change from June to June of monthly enrollment data for Medicaid beneficiaries collected from all states and DC. Enrollment trend data for FY 2014 to FY 2020 reflects growth in average monthly enrollment based on KFF analysis of the Medicaid & CHIP Monthly Applications, Eligibility Determinations, and Enrollment Reports from CMS for all 50 states and DC. Note that several states have revised monthly enrollment data as far back as June 2017 to better align with reporting criteria for the CMS, Medicaid & CHIP Monthly Applications, Eligibility Determinations, and Enrollment Reports. Data for months prior to June 2017 have not been revised and may use slightly different criteria for reporting monthly enrollment and generally result in larger enrollment totals.
Appendix
Appendix
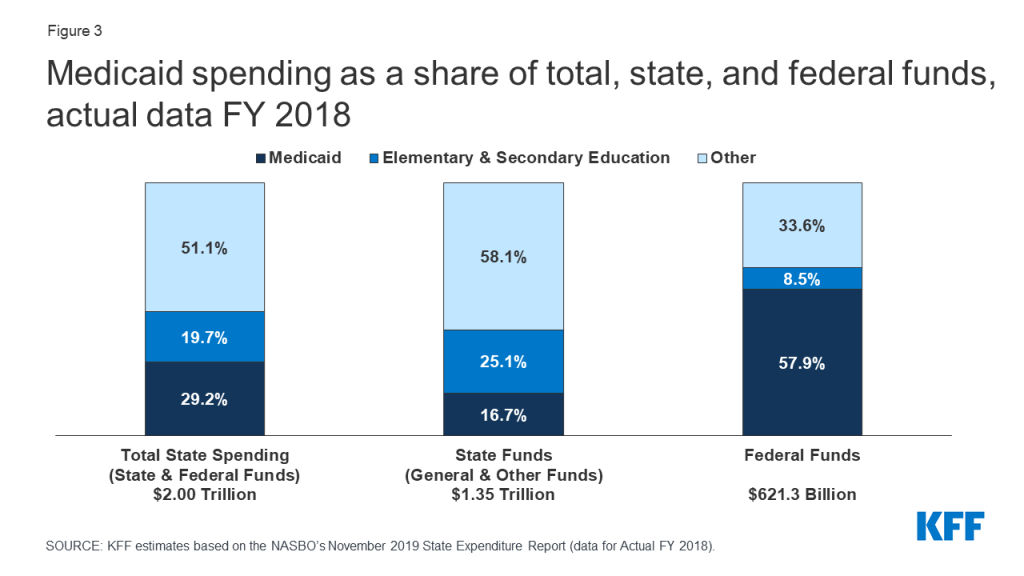
Medicaid Financing Structure. The federal government jointly funds the Medicaid program with states by matching qualifying state Medicaid expenditures. The federal match rate (known as the Federal Medical Assistance percentage, or FMAP) is calculated annually for each state using a statutory formula based on a state’s average personal income relative to the national average which results in higher FMAP rates for poorer states. The FMAP formula relies on three years of lagged personal income data, so data for federal fiscal years (FFYs) 2017 to 2019 was used to calculate FFY 2021 FMAP rates, which range from a floor of 50% (applicable to 13 states) to a high of 78% (for Mississippi). Because of the federal matching structure, Medicaid is both a state budget expenditure item and a source of federal revenue for states. In FY 2018 (the latest year of actual data), Medicaid accounted for 29.2% of total state spending, but 16.7% of state funds (general fund plus other state funds), a far second to spending on K-12 education (25.1% of state funds). Medicaid is the largest single source of federal funds for states, accounting for over half (57.9%) of all federal funds received by states (Figure 3).
Medicaid and the Economy. Medicaid is a countercyclical program. During economic downturns, more people qualify and enroll in Medicaid, increasing program spending at the same time that state tax revenues may be stagnating or falling. Prior to the current pandemic, to mitigate these budget pressures, Congress had twice passed temporary FMAP increases to help support states during economic downturns, most recently in 2009 as part of the American Recovery and Reinvestment Act (ARRA). The ARRA-enhanced FMAP rates provided states over $100 billion in additional federal funds over 11 quarters, ending in June 2011.5
Medicaid and the ACA. Effective January 1, 2014, the ACA expanded Medicaid eligibility to millions of non-elderly adults with income at or below 138% of the federal poverty level (FPL) –$17,609 per year for an individual in 2020.6 The law also provided 100% federal funding for expansion adults through 2016, phasing down to 90% in 2020 and future years. The June 2012 Supreme Court ruling on the ACA effectively made the Medicaid expansion optional for states; as of October 2020, 39 states (including DC) had adopted the expansion, including Missouri and Oklahoma, which have adopted the expansion through ballot measures and plan to implement in state fiscal year 2022.
Endnotes
- State fiscal years begin on July 1 except for these states: New York on April 1; Texas on September 1; Alabama, Michigan, and District of Columbia on October 1. ↩︎
- The eight states that did not respond by mid-August 2020 are: Delaware, District of Columbia, Illinois, Ohio, New Mexico, New York, Rhode Island, and Utah. ↩︎
- U.S. Centers for Medicare & Medicaid Services (CMS). National Health Expenditure Data Fact Sheet: Table 4, National Health Expenditures by Source of Funds and Type of Expenditure: Calendar Years 2011-2018 (CMS, March 2020), https://www.cms.gov/Research-Statistics-Data-and-Systems/Statistics-Trends-and-Reports/NationalHealthExpendData/NHE-Fact-Sheet.html. ↩︎
- National Association of State Budget Officer, States Work to Finalize Fiscal 2021 Budgets, Budget Blog, Updated August 4, 2020, http://budgetblog.nasbo.org/budgetblogs/blogs/brian-sigritz/2020/06/26/states-work-to-finalize-fiscal-2021-budgets-update. ↩︎
- To be eligible for ARRA funds, states could not restrict eligibility or tighten enrollment procedures in Medicaid or CHIP. Vic Miller, Impact of the Medicaid Fiscal Relief Provisions in the American Recovery and Reinvestment Act (ARRA) (Washington, DC: Kaiser Commission on Medicaid and the Uninsured, October 2011), http://kff.org/medicaid/issue-brief/impact-of-the-medicaid-fiscal-relief-provisions/. ↩︎
- U.S. Department of Health & Human Services, Office of the Assistant Secretary for Planning and Evaluation. U.S. Federal Poverty Guidelines Used to Determine Financial Eligibility for Certain Federal Programs (January 2020), https://aspe.hhs.gov/poverty-guidelines ↩︎