Insurance Coverage and Viral Suppression Among People with HIV, 2018
Data Note
Key Findings
- Health insurance and access to care improve health outcomes, including viral suppression, for people with HIV in the United States (U.S.). Our prior research documented an increase in insurance coverage among people with HIV, after implementation of the Affordable Care Act (ACA). In this update, we find that in 2018, just 1 in 10 (11%) nonelderly people with HIV were uninsured, a rate on par with that of the general population (10%).
- While the overall rate of uninsurance is now similar for people with HIV and the population overall, there are substantial differences in the type of coverage. Medicaid plays a much more significant role for people with HIV compared to the general population (40% v. 15%), and it is their single largest source of coverage, and people with HIV are much less likely to be covered by private insurance (35% v. 56%).
- The main driver of coverage increases for people with HIV has been the ACA’s expansion of the Medicaid program. As with our earlier research, in 2018, we continue to find that adults with HIV in sampled expansion states are significantly more likely to be covered by Medicaid (46% v. 30%) and less likely to be uninsured (6% v. 20%), compared to those in non-expansion states sampled.
- We observed coverage differences among adults with HIV by a range of demographic indicators. For example, men with HIV were almost twice as likely to have private coverage than women. Whites were also more likely to have private coverage compared to Blacks and Hispanics, who were more than three times as likely to be uninsured. We also noted differences by income, place of birth, and sexual orientation.
- The Ryan White HIV/AIDS Program plays a major role in providing outpatient care and support services to people with HIV, regardless of insurance coverage. In 2018, almost half of all people with HIV (46%) relied on Ryan White, including more than eight in ten (82%) of those who are uninsured.
- Finally, we find that sustained viral suppression rates varied by payer, and were higher among those with private insurance or Medicare, compared to the uninsured. Viral suppression among those with Medicaid was not significantly different from the uninsured, a finding that could reflect the equalizing role of the Ryan White Program for the uninsured and lower incomes among individuals in these coverage groups. Additionally, those with Ryan White support were significantly more likely to have sustained viral suppression compared those without, regardless of payer.
Introduction
Health insurance coverage and access to care improve health outcomes, including viral suppression, for people with HIV in the United States. Our previous work, based on analysis of nationally representative data from the Centers for Disease Control (CDC) and Prevention’s Medical Monitoring Project (MMP), demonstrated that implementation of the Affordable Care Act’s (ACA) 2014 coverage provisions increased insurance coverage among adults with HIV. In this analysis, using the same data source and building on recent work, we provide a detailed analysis of coverage in 2018, including by state Medicaid expansion status, race/ethnicity, gender, and income. For the first time, we include data on coverage among people with HIV by place of birth and sexual orientation.
Findings
Overall Coverage Findings
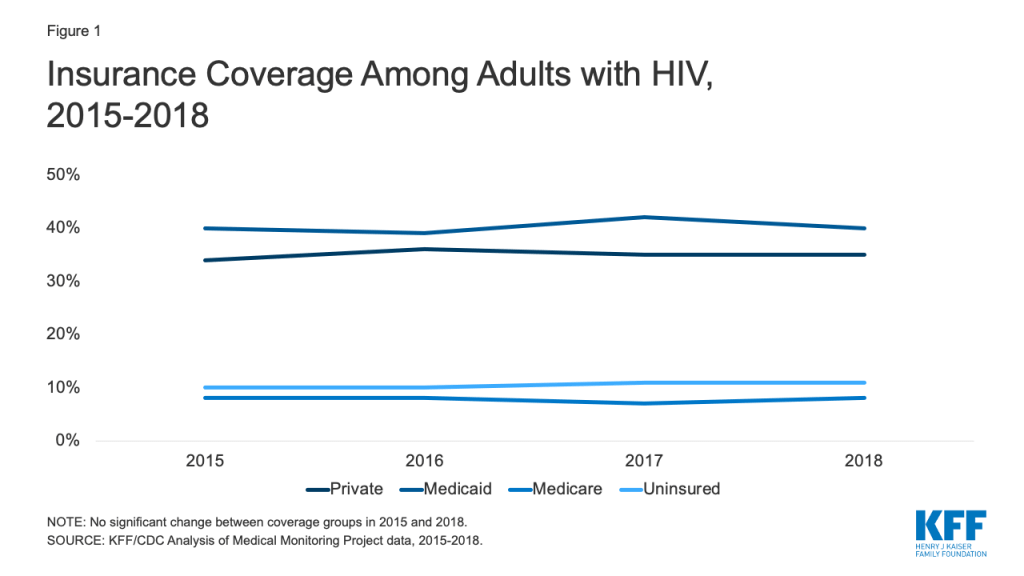
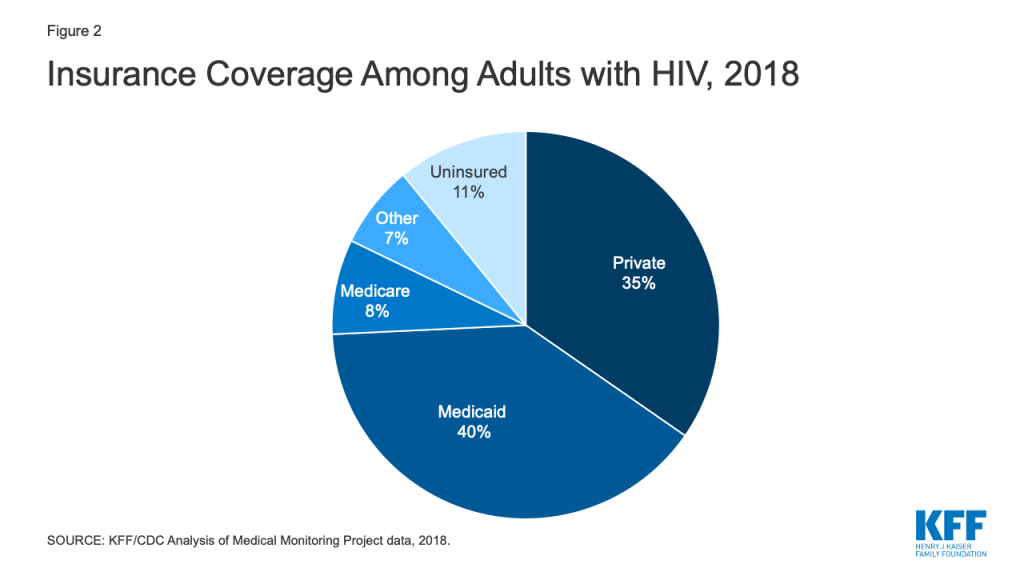
Our earlier research found that prior to the ACA’s major coverage reforms, approximately 18% of people with HIV were uninsured in 2012. While not directly comparable to the current dataset, the share of people with HIV without insurance was just 11% in 2018, suggesting a substantial decline in uninsurance rates among this population. Indeed, implementation of the ACA resulted in a significant increase in coverage and since that time, rates have remained stable (Fig. 1). 1 In 2018, Medicaid was the single largest source of insurance coverage for adults with HIV, covering 4 in 10. Private insurance was the second largest source of coverage, reaching more than one-third of the population (35%) and as noted, just 1 in 10 (11%) were uninsured (Fig. 2), on par with the general population).
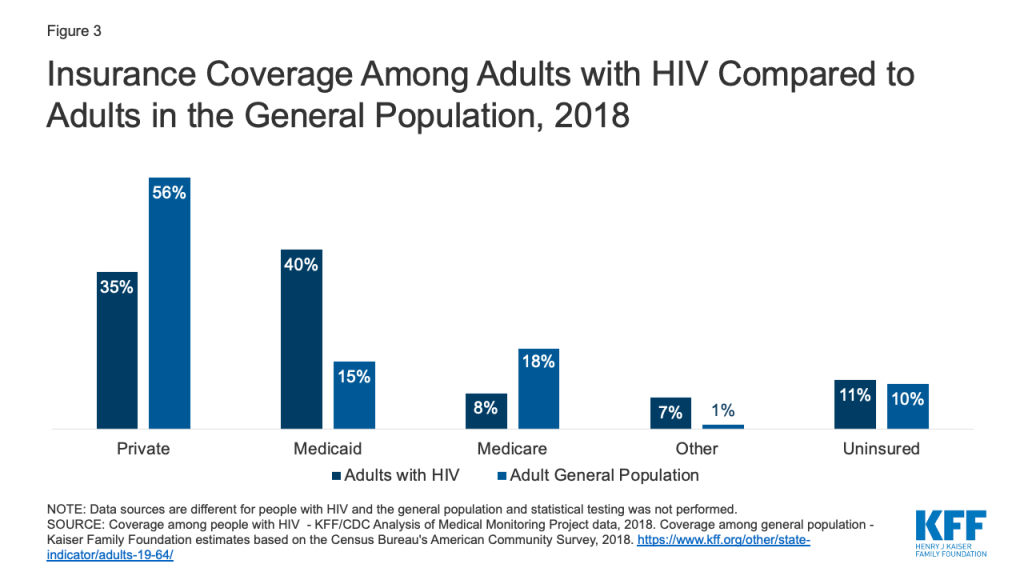
Coverage patterns among adults with HIV differ from those of the general population (Fig. 3). Medicaid plays a much larger role (40% v. 15%) and private insurance a smaller role (35% v 56%) among those with HIV compared to the general population. In addition, people with HIV are less likely to have private coverage through an employer (26% v. 49%) and more likely to have it through the individual market, including the ACA’s marketplaces (7% v. 4%) (not shown). As noted above, uninsurance rates are comparable between the two populations (about 10%).
Coverage and Medicaid Expansion Status
Our earlier analysis found that Medicaid coverage among adults with HIV grew under the ACA and that this shift was driven by coverage gains in states that expanded their Medicaid programs. In 2018, the outsized role Medicaid plays in expansion states remains; adults with HIV in the expansion states sampled are significantly more likely to be covered by Medicaid compared to those in the sampled states that have not expanded (46% v. 30%). In addition, uninsurance rates in expansion states sampled are nearly three times lower than those in non-expansion states sampled (6% v. 20%). (Fig. 4)

Coverage by Key Demographics
We observed coverage differences among adults with HIV by a range of demographic indicators, including, race/ethnicity, gender, income, and, for the first time, place of birth and sexual orientation.
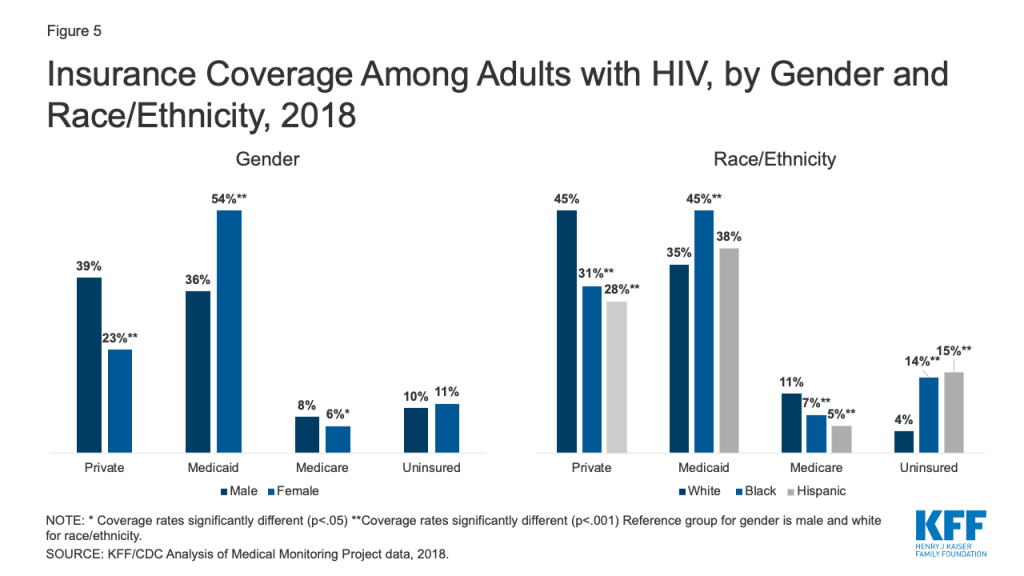
Gender: Male adults with HIV were almost twice as likely to have private coverage (39% v. 23%) and more likely to have Medicare than females (8% v. 6%), while females were more likely to have Medicaid (54% v. 36%). Women’s greater likelihood of Medicaid coverage could reflect eligibility based on lower incomes and categorical eligibility based on being pregnant, parent of a dependent child, higher rates of disability. Rates of uninsurance do not differ significantly by gender. (Fig. 5)
Race/ethnicity: White adults with HIV were more likely than Blacks and Hispanics to have private insurance (45% v. 31% and 28%, respectively) and Medicare (11% v. 7% and 5%, respectively) and less likely than Blacks to have Medicaid (35% v 45%). Notably, Blacks and Hispanics were more than three times as likely as Whites to be uninsured (14% and 15%, respectively vs. 4%). These trends reflect in part, disparities seen in coverage by race/ethnicity nationwide, including that people of color are more likely than White to live in non-expansion states, (Fig. 5)
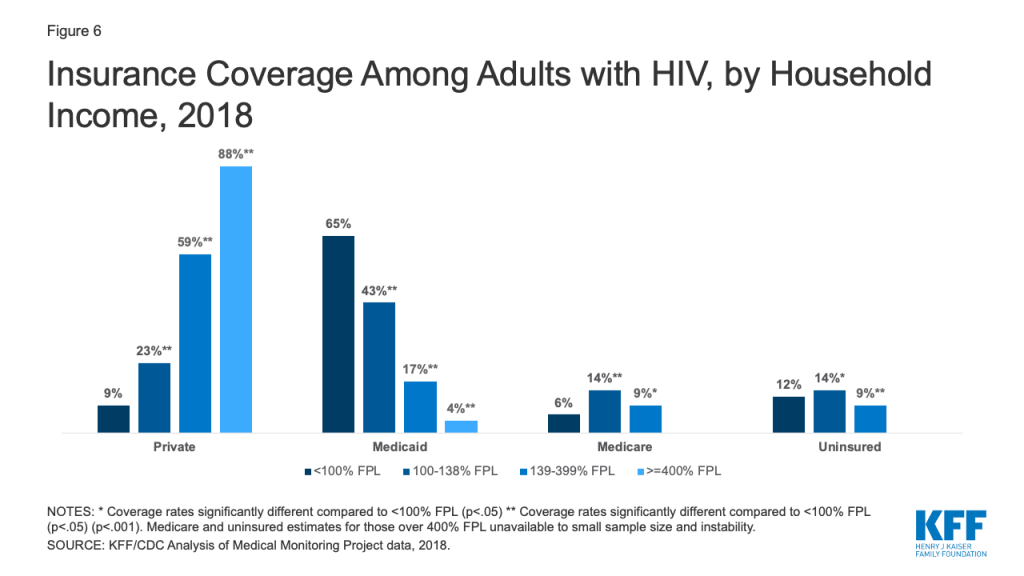
Income. Those with household incomes <100% of the federal poverty level (FPL) ($12,140 for an individual in 2018) were significantly less likely to have private coverage compared to all other income groups and most likely to have Medicaid coverage. This likely reflects the association between income and access to employment benefits and marketplace subsidies. The percentage of people with HIV with private healthcare coverage increased, and Medicaid coverage decreased, with increasing household income. (Fig. 6)
U.S. Born. Nine in 10 adults (86%) with HIV in the U.S. were born in country whereas 15% were born abroad.2 These individuals were significantly less likely to have the publicly funded health coverage sources, Medicaid and Medicare, than those born in the U.S (28% v. 42% and 4% v. 8%, respectively), potentially reflecting citizenship and residency requirements in public coverage. This group was also three times as likely to be uninsured compared to U.S. born counterparts (24% v. 8%). (Fig. 7)

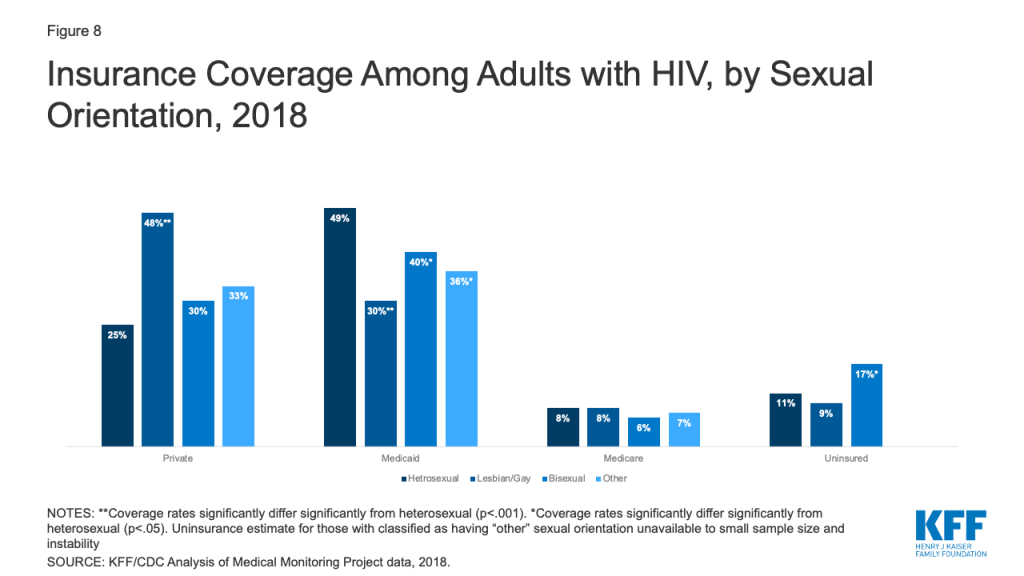
Sexual Orientation. Overall, 47% of adults with HIV identify as heterosexual and 41% as lesbian or gay. Smaller shares identify as bisexual (9%) or as “something else” (3%). Heterosexual adults with HIV, who are disproportionally Black and Latina women, were less likely than lesbian and gay adults with HIV to have private insurance coverage (25% v. 48%) and more likely to have Medicaid (49% v. 30%). Bisexual adults with HIV were less likely to have Medicaid (40% v. 49%) and more likely to be uninsured than heterosexuals (17% v. 11%). (Fig. 8)
Coverage and Ryan White
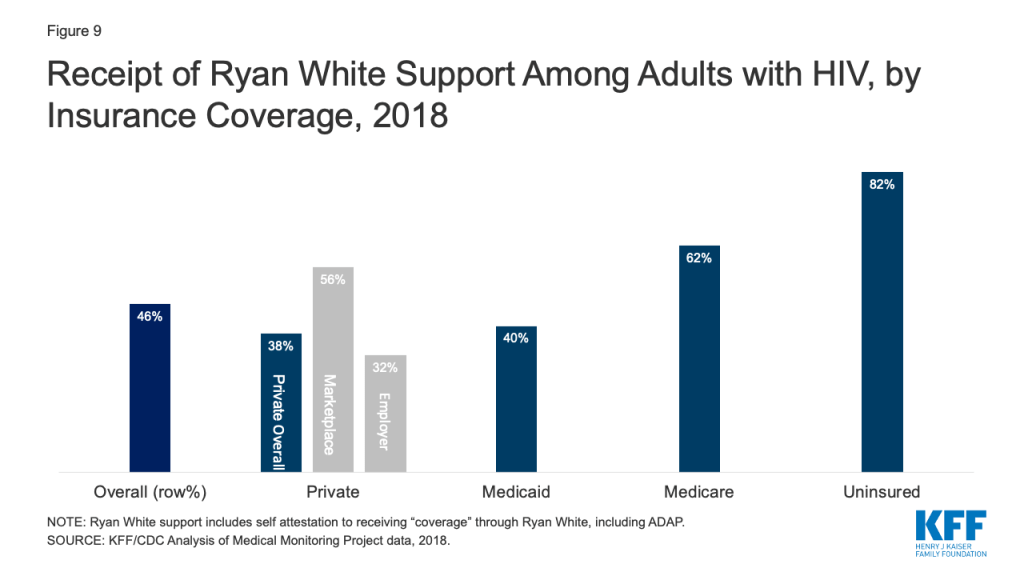
The federal Ryan White HIV/AIDS Program provides outpatient HIV care, treatment, and support services to people with HIV who are underinsured and uninsured. In 2018, nearly half (46%) of adults with HIV received support from the program. The program provides assistance to those with and without coverage but plays an especially significant role for the uninsured, 82% of whom receive program services. Those who are uninsured may receive direct medical care and prescription drugs through the program, as well as support services. Ryan White also plays a meaningful role for those with insurance coverage, addressing gaps in coverage (e.g. providing support services not included in traditional coverage) and assisting with costs associated with insurance (e.g. insurance premiums and out-of-pocket costs related to HIV medication). Sixty-two percent (62%) of those with Medicare receive Ryan White support. Among those with private insurance, almost 4 in 10 (38%) receive assistance through the program. This share was significantly higher among those with marketplace coverage (56%) compared to employer-based coverage (32%), potentially reflecting the role Ryan White plays in helping clients purchase individual insurance coverage. It could also reflect higher cost-sharing for many in individual insurance (Fig. 9).
Coverage and Viral Suppression
Viral suppression (defined as having an undetectable viral load at the time of last available laboratory data) is a critical health indicator, affording optimal health outcomes at the individual level and, because when an individual is virally suppressed they cannot transmit HIV, significant public health benefit. However, because viral suppression can change over time, especially depending on treatment adherence, it is particularly important to look at sustained viral suppression (defined as having an undetectable viral load over all tests in the preceding 12 months), a stronger indicator of long-term adherence antiretroviral treatment and its associated preventive benefits. In 2018, 68% of people with HIV were virally suppressed at last test and 62% had sustained viral suppression, the same share as in 2015. (Fig. 10)
Certain insurance types were positively associated with sustained viral suppression. The proportion of people with sustained viral suppression was significantly higher among those with private insurance, including those with employer-sponsored and marketplace coverage, and among those with Medicare, compared to the uninsured. Viral suppression rates among those with Medicaid were not significantly different from the uninsured, a finding that could reflect the equalizing role of the Ryan White Program for the uninsured. Lower viral suppression rates among those with Medicaid and the uninsured compared to those with other coverage types, could be accounted for by lower household income, among other, largely related, factors. (Fig. 10)

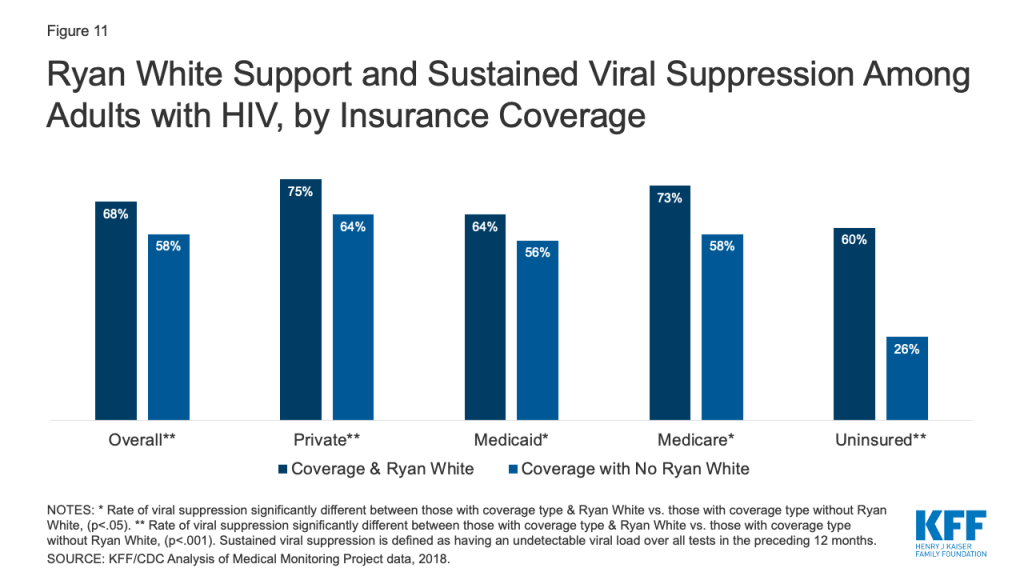
Ryan White support appears to make a significant difference in achieving sustained viral suppression. Overall, those with Ryan White support were significantly more likely to have sustained viral suppression compared to those without (68% v. 58%) and this pattern was observed across all coverage types, and was especially apparent among the uninsured (60% v 26%). (Fig. 11)
Discussion
In 2018, the uninsurance rate among people with HIV was similar to that of the public at large. Medicaid represented the single largest source of coverage for people with HIV, particularly in Medicaid expansion states, followed closely by private insurance. We observed significant differences in coverage by gender, income, and race/ethnicity, with notable disparities related to rates of uninsurance by race/ethnicity. We also provide the first national data on adults with HIV and insurance coverage by place of birth and sexual orientation. The Ryan White Program is a significant source of care, treatment, and support for people with HIV, especially for the uninsured but also for a substantial share of those with coverage. Certain insurance sources and support from Ryan White were associated with greater rates of sustained viral suppression, a crucial indicator of optimizing the individual and public health benefits associated with antiretroviral treatment.
The ACA has made a significant difference in expanding insurance coverage for people with HIV, yet its future continues to be contested terrain. On the one hand, the Trump Administration is seeking to invalidate the law before the Supreme Court, while on the other hand, states, including states with leadership that has opposed the ACA, continue to adopt Medicaid expansion through voter led ballot initiatives; as of September 2020, 39 states (including D.C.) have adopted Medicaid expansion. In addition, health care could be a major issue in the 2020 elections with candidates President Trump and Democratic nominee Joe Biden holding deeply diverging views on the issue. Their different policy perspectives and positions stand to significantly impact coverage, and likely care outcomes, for people with HIV, as well as the success of the administration’s “Ending the HIV Epidemic” initiative.
Acknowledgments
The authors wish to thank Dr. Sharoda Dasgupta, Dr. Linda Beer, and Dr. Yunfeng Tie of the CDC, who were instrumental in this work in providing access to data, guidance, and conducting statistical analysis.
This work was supported in part by the Elton John AIDS Foundation. We value our funders. KFF maintains full editorial control over all of its policy analysis, polling, and journalism activities.
Methods
Data Sources
Coverage Data on General Population
All general population coverage data, except for marketplace coverage, is limited to adults and comes from KFF analysis of the 2018 American Community Survey (ACS).
General population marketplace coverage is an estimate based off the number of nonelderly adults with effectuated marketplace enrollment in 2018. Overall marketplace enrollment in 2018 was 9,895,197. The share estimated to be nonelderly adults was based off data on characteristics of individuals who selected a marketplace plan, whereby 9% of marketplace plan selectors were under 18. We assumed that age characteristics of those with effectuated marketplace enrollment were similar to those who had selected plans and subtracted 9% (890,568) from the effectuated enrollment total to obtain an estimated adult marketplace enrollment of 9,004,629 or 4% of the non-elderly adult ACS population (242,620,816).
Data on People with HIV
Data on people with HIV are based on 2015-2018 data from the Medical Monitoring Project (MMP), a Centers for Disease Control and Prevention (CDC) surveillance system which produces national and state-level representative estimates of behavioral and clinical characteristics of adults with diagnosed HIV in the United States.
Between 2015 and 2018, MMP employed a two-stage, complex sampling design. First, jurisdictions are selected from all U.S. states, the District of Columbia, and Puerto Rico using a probability proportional to size sampling strategy based on AIDS prevalence at the end of 2002, such that areas with higher prevalence had a higher probability of selection. Next, adults (aged 18 years and older) with diagnosed HIV were sampled from selected jurisdictions from the National HIV Surveillance System (NHSS), a census of US persons with diagnosed HIV. During 2015-2018, data come from: California (including the separately funded jurisdictions of Los Angeles County and San Francisco), Delaware, Florida, Georgia, Illinois (including the separately funded jurisdiction of Chicago), Indiana, Michigan, Mississippi, New Jersey, New York (including the separately funded jurisdiction of New York City), North Carolina, Oregon, Pennsylvania (including the separately funded jurisdiction of Philadelphia), Puerto Rico, Texas (including the separately funded jurisdiction of Houston), Virginia, and Washington.
Data used in this analysis were collected via telephone or face-to-face interviews and medical record abstractions during the following periods.
- 2015 data was collected between June 1, 2015 – May 31, 2016
- 2016 data was collected between June 1, 2016 – May 31, 2017
- 2017 data was collected between June 1, 2017- May 31, 2018
- 2018 data was collected between June 1, 2018 – May 31, 2019
In 2018, the primary year of analysis, of 9,700 sampled persons, 4,050 participated. Adjusted for eligibility, the response rate was 45%. Data were weighted based on known probabilities of selection at state or territory and patient levels. In addition, data were weighted to adjust for non-response using predictors of person-level response, and post-stratified to NHSS population totals by age, race/ethnicity, and sex at birth. Although characteristics associated with nonresponse varied among states and territories, the weighting classes for the national data were informed by sex at birth, age of most recent contact information, and the person’s frequency of receipt of care (as indicated by NHSS records). This analysis includes information on 4,050 participants who represent all adults with diagnosed HIV in the United States and Puerto Rico.
Analysis
For all respondents in MMP, we examined self-reported insurance coverage. Response options included insurance programs (Medicaid, Medicare, private insurance – employer and marketplace -, Ryan White HIV/AIDS Program – Ryan White or the AIDS Drug Assistance Program-, Veteran’s Administration, Tricare or CHAMPUS coverage, other public insurance, and other unspecified insurance). “Other specify” responses were recoded to reflect the most accurate coverage type when possible. It is important to note that respondents may not be aware of all the services they receive that are paid for by the Ryan White HIV/AIDS Program (the program provides funding directly to service organizations in many cases) and therefore, the estimates of the number of individuals who receive Ryan White HIV/AIDS Program services is likely an underestimate.
We estimated weighted percentages of individuals with the following types of health care coverage: no coverage (uninsured), private insurance (with breakouts for employer coverage and marketplace coverage), Medicaid, Medicare, and other. Because respondents in MMP may indicate more than one type of coverage, we relied on a hierarchy to group people into mutually exclusive coverage categories. Specifically, the hierarchy groups people into coverage types in the following order:
- Private coverage overall (with breakouts for employer coverage and marketplace coverage)
- Medicaid coverage, including those dually eligible for Medicare
- Medicare coverage only
- Other public coverage, including Tricare/CHAMPUS, Veteran’s Administration, or city/county coverage
In most cases, this hierarchy classified individuals according to the coverage source that served as their primary payer. People who did not report any of the sources of insurance coverage were classified as uninsured. We separately assess weighted percentages of persons receiving assistance through the Ryan White HIV/AIDS Program by health coverage type.
Statistical comparisons were made using Rao-Scott chi-square tests to account for complex survey design.
Limitations
MMP only allows for extrapolation to the national level when using the full sample. Similar extrapolation is not possible when examining coverage changes in and contrasting Medicaid expansion states and non-expansion states. The Medicaid expansion and non-expansion coverage data presented here are representative only of the subset of states sampled that fell into each group. Insurance coverage data is self-reported by respondents and not verified. By relying on a hierarchy to group individuals into coverage categories, it is possible individuals were grouped into a coverage category that was not their dominant payer over the course of a year.
Endnotes
- We believe this stability in part reflects the fact that the states with greatest HIV prevalence have not changed their expansion status since 2014 (i.e. CA, NY, FL, GA, and TX). While several states have expanded since then, some did so after 2018 (the end year for the data in this report). Those that did expand between 2015 and 2018, had relatively low high HIV prevalence. In addition, we are limited by the states in the MMP sample. ↩︎
- Percentages do not add to 100% due to rounding. ↩︎