Data Note: Effect of State Decisions on State Risk Scores
Several health insurers, including United Healthcare and Aetna, are scaling back their participation in the Affordable Care Act (ACA) health insurance marketplaces, and in some cases exiting the broader individual market, due to substantial losses in these markets. A commonly cited reason for these losses is a sicker-than-expected risk pool, meaning that on average enrollees in this market may have been sicker or higher-cost than insurers expected or priced for. There are a number of related factors that could contribute to losses for insurers in the individual and exchange markets, including competition to offer a low-cost plan and lower-than-expected benchmark premiums, changes to risk corridors payments, and some insurers having less effective cost control than their competitors.
It is also possible that state policy decisions – in particular, on Medicaid expansion and allowing transitional (“grandmothered”) plans to continue for a period of time – have had an effect on the risk pool in the private individual market. A recent Health and Human Services Assistant Secretary for Planning and Evaluation (ASPE) brief finds that premiums were lower in states that expanded Medicaid, controlling for demographics and other factors. In states without Medicaid expansion, a sizable share of marketplace enrollees would have been enrolled in Medicaid had their state expanded the program, and it is possible these enrollees had greater health needs and higher costs than higher-income marketplace enrollees. In addition, a recent report from Milliman suggests that marketplace insurers in states that allowed transitional plans to continue in 2014 were less profitable than insurers in states that did not allow transitional plans to renew. In these states, transitional plan holders (generally expected to be healthier than the average enrollee because they were subject to medical underwriting by insurers prior to 2014) were not added to the individual risk pool, perhaps resulting in a sicker-than-expected individual market risk pool.
To gauge whether individual market risk pools are healthier in states that have expanded Medicaid and did not allow transitional plans, this data note compares average state risk scores using data from the Centers for Medicare & Medicaid Services Summary Report on Risk Adjustment for the 2015 benefit year. We find that states that expanded Medicaid and did not allow transitional plans had lower average risk scores, suggesting the risk pools in those state’s markets are healthier than in non-expansion states and in states that allowed transitional plans.
How Medicaid Expansion Could Affect the Risk Pool
Generally, marketplace subsidies are available to people with incomes between 100% and 400% of the federal poverty level (FPL), but actual subsidy eligibility varies depending on the state’s decision whether or not to expand Medicaid.
In states that opted to expand the program, Medicaid coverage is available to households with incomes up to 138% of poverty. In these states, marketplace subsidies are therefore available to people with household incomes between 138% and 400% of poverty. (In certain cases, such as legal immigrants who have been in the U.S. for less than five years and are therefore ineligible for Medicaid, some people with incomes below 138% of poverty may still receive marketplace subsidies in these states.)
As of July 2016, 19 states have decided not to expand Medicaid. Individuals living in non-expansion states must meet state eligibility requirements for Medicaid, which can be quite limited and many people fall into a “coverage gap,” meaning their incomes are too high for Medicaid yet too low for subsidies. In these states, marketplace subsidies are available to enrollees with incomes between 100% and 400% of poverty. Therefore, many people with household incomes between 100% and 138% of poverty are enrolled in the marketplace in non-expansion states, whereas they would be enrolled in Medicaid had their state expanded the program.
As a result, many more low-income individuals are in the private individual market risk pool in non-expansion states. A recent ASPE analysis estimates that individuals with incomes between 100% and 138% FPL make up close to 40% of the Marketplace population in non-expansion states, versus 6% in expansion states. Because low-income individuals, on average, report having worse health than those with higher incomes, this may lead to a sicker, and thus costlier, individual market risk pool in states that have not expanded Medicaid.
How Transitional Plans Could Affect the Risk Pool
Transitional coverage – also referred to as “grandmothered” coverage – includes plans that were purchased in the four years after the enactment of the ACA but before the beginning of the first open enrollment period in October 2013. Following controversy over these plans being cancelled because they did not comply with new insurance market rules taking effect in 2014 under the ACA, the Obama Administration issued guidance that ultimately permitted these plans to remain in effect until December 31, 2017. However, the federal rules granted discretion to states and individual insurers, so transitional plans were not allowed to continue in all cases. In 2015, 13 states did not allow transitional plans to continue. In the states that did allow transitional plans to continue, the ultimate decision was left to issuers whether to renew transitional policies. All transitional plans will be phased out by the end of 2017.
Transitional plans are non-ACA compliant and transitional policy holders are not considered a part of the individual risk pool under the ACA. In states that did not allow transitional plans to renew, transitional plan holders were obligated to switch to ACA-compliant plans. Because transitional plan holders may be healthier on average than the population in the ACA individual risk pool (because they were pre-screened by insurers before the ACA prohibited insurers from denying coverage based on pre-existing conditions), bringing these enrollees into the individual market could have resulted in a healthier, and less costly, individual market risk pool in states that did not allow transitional plans to continue.
Gauging the Effect of Medicaid Expansion and Transitional Policies on State Risk Scores
Under the ACA’s risk adjustment program, individual risk scores – based on the individual’s age, sex, and diagnoses – are assigned to each enrollee in individual and small group market plans. Health plans with relatively low average risk scores (and thus “healthier” enrollees) make payments into the system, while plans with relatively high average risk scores (“sicker” enrollees) receive payments.
For this analysis, we compared states’ average individual market risk score for the 2015 benefit year based on state decisions to expand Medicaid and to allow transitional plans. The state average plan liability risk score (state risk score) is the weighted average risk score across all plans in the state’s individual marketplace. Higher state risk scores are associated with sicker state risk pools. The difference in risk scores between states likely translates as a difference in average premiums. In states with higher average risk scores (“sicker” enrollees), insurers will likely need to set higher premiums to account for higher expected health costs.
In our analysis, we compare the average state risk score across three groups (see Table 1):
- Medicaid Expansion, Non-Transitional States: states that expanded Medicaid and did not allow transitional plans to continue in 2015 (11 states)
- Medicaid Expansion, Transitional States: states that expanded Medicaid and allowed transitional plans to continue in 2015 (15 states)
- Non-Expansion, Transitional States: states that did not expand Medicaid and allowed transitional plans to continue in 2015 (22 states)
Note: All states that did not expand Medicaid allowed transitional plans through 2015 –in other words, there were zero non-expansion, non-transitional states.
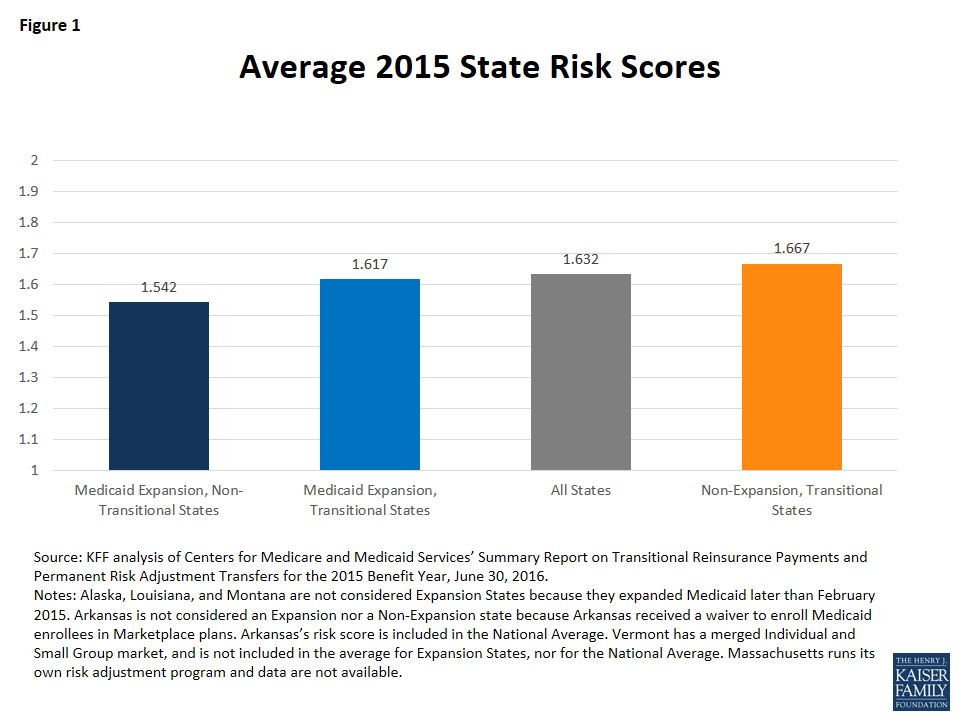
We find that in 2015 the average risk score across non-expansion, transitional states (1.667) was 3% higher than the average risk score across Medicaid expansion, transitional states (1.617) and 8% higher than Medicaid expansion, non-transitional states (1.542) (Figure 1). This trend was consistent in the 2014 benefit year as well. This suggests that, on average, non-expansion states have sicker risk pools than expansion states, and expansion states that allowed transitional plans have sicker risk pools than expansion states that did not allow transitional plans. This relationship is not necessarily causal, nor are states’ decisions on Medicaid expansion and transitional plans the only factors that could explain differences between these groups of states. For example, it is possible that non-expansion, transitional states have sicker-than-average populations overall, regardless of income. Risk scores can also be influenced by new enrollment (as new enrollees may not have a well-documented medical history, states with larger shares of new enrollees in 2015 may have lower risk scores) and similarly by new insurers (as new entrants with less experience may lack the ability to adequately code diagnoses, states with inexperienced plans may have lower average risk scores). However, it is possible that state policy decisions may have affected the insurance risk pool.
Risk scores in Medicaid expansion, non-transitional states ranged from a low of 1.344 in California to a high of 1.785 in Delaware. Meanwhile risk scores in Medicaid expansion, transitional states ranged from a low of 1.369 in Colorado to a high of 1.798 in Kentucky. In non-expansion, transitional states, state average risk scores range from lows of 1.416 in Montana and 1.455 in Utah to a high of 1.990 in Wisconsin in 2015 (Table 1). In states that allowed transitional plans to continue through 2015, the ultimate decision whether to renew transitional policies was left to issuers. In at least one transitional state (Montana), all individual market carriers ultimately decided to discontinue transitional policies in 2015 and switch to ACA-compliant plans. Montana’s state risk score is the lowest of the non-expansion states at 1.416, which is consistent with the general finding that states without transitional plans on average had lower risk scores. If we were to exclude Montana from our analysis, the average risk score for non-expansion, transitional states would increase from 1.667 to 1.693.
For the purpose of this analysis we do not include Arkansas as either a Medicaid expansion state or a non-expansion state because the state expanded Medicaid through a “private option” waiver, thereby enrolling all newly eligible Medicaid enrollees in marketplace plans. Arkansas also allowed transitional plans in 2015. Arkansas has the highest average risk score of all states at 2.08, which is consistent with the general finding that states that expanded Medicaid through traditional means (without a private option waiver) on average had lower risk scores.
| Table 1: State Average Plan Liability Risk Scores for the 2015 benefit year | ||||||
| Medicaid Expansion States | Non-Expansion States | Private Option States | ||||
| Transitional States | Colorado | 1.369 | Montana* | 1.416 | Arkansas* | 2.075 |
| North Dakota | 1.395 | Utah | 1.455 | |||
| New Hampshire | 1.418 | Nebraska | 1.463 | |||
| Oregon | 1.445 | Wyoming | 1.515 | |||
| Arizona | 1.584 | Maine | 1.537 | |||
| Iowa | 1.587 | Idaho | 1.539 | |||
| Illinois | 1.603 | Virginia | 1.541 | |||
| New Jersey | 1.626 | Alaska* | 1.575 | |||
| Michigan | 1.674 | Georgia | 1.613 | |||
| Indiana | 1.728 | South Dakota | 1.616 | |||
| Ohio | 1.756 | Texas | 1.658 | |||
| Hawaii | 1.756 | Kansas | 1.681 | |||
| West Virginia | 1.760 | Florida | 1.699 | |||
| Pennsylvania | 1.762 | Oklahoma | 1.716 | |||
| Kentucky | 1.798 | North Carolina | 1.725 | |||
| Average | 1.617 | Missouri | 1.734 | |||
| South Carolina | 1.762 | |||||
| Mississippi | 1.786 | |||||
| Louisiana* | 1.816 | |||||
| Alabama | 1.909 | |||||
| Tennessee | 1.924 | |||||
| Wisconsin | 1.990 | |||||
| Average | 1.667 | |||||
| Non-Transitional States | California | 1.344 | ||||
| District of Columbia | 1.359 | |||||
| Minnesota | 1.413 | |||||
| Washington | 1.451 | |||||
| Connecticut | 1.516 | |||||
| Maryland | 1.547 | |||||
| New Mexico | 1.559 | |||||
| Nevada | 1.559 | |||||
| Rhode Island | 1.702 | |||||
| New York | 1.731 | |||||
| Delaware | 1.785 | |||||
| Average | 1.542 | |||||
National Average: 1.632 | ||||||
| SOURCE: KFF analysis of CMS Summary Report on Transitional Reinsurance Payments and Risk Adjustment Transfers for the 2015 Benefit Year, June 30, 2016.*NOTES: Alaska, Louisiana, and Montana are not considered Expansion States because they expanded Medicaid later than February 2015. Arkansas is not considered an Expansion State nor a Non-Expansion state because Arkansas received a waiver to enroll Medicaid enrollees in Marketplace plans. Arkansas’s risk score is included in the National Average. Vermont has a merged Individual and Small Group market, so we do not include the state’s risk score in our calculation of the average for Expansion States, nor for the National Average. Massachusetts runs its own risk adjustment program; data not available. | ||||||
Discussion
There is some evidence that state decisions on Medicaid expansion and transitional plans have affected the state individual market risk pools. Namely, individual market risk pools may be “sicker” in states that have not expanded Medicaid and allowed transitional plans to continue. Transitional plans will be phased out in all states by the end of 2017, likely leading to some improvement in the individual market risk pool. States will continue to have discretion over whether to expand Medicaid. It is important to keep in mind that a number of demographic and policy factors, apart from Medicaid expansion and transitional policy, may explain why non-expansion states have sicker risk pools than expansion states on average. For example, it is possible that regardless of income non-expansion states have sicker average populations than states that did expand Medicaid. While this analysis does not attempt to control for any demographic factors, and does not prove a causal relationship between the state’s decisions and health of the state’s risk pool, it does suggest that state policy decisions may have had a noticeable effect on risk pools.
Methods
This analysis uses data from the Centers for Medicare and Medicaid Services’ Summary Report on Risk Adjustment for the 2015 benefit year. Appendix A of the report includes a state-by-state table of states’ average plan liability risk score (state risk score) for 2015. For the purpose of this analysis, we calculated the un-weighted average state risk score across three groups: 1) Medicaid expansion, non-transitional states (states that had expanded Medicaid by February 1, 2015 and did not allow transitional plans to continue into 2015); 2) Medicaid expansion, transitional states (states that had expanded Medicaid by February 1, 2015 and allowed transitional plans to continue in 2015), and 3) non-expansion, transitional states (states that had not expanded Medicaid by February 1, 2015 and allowed transitional plans to continue in 2015). All non-expansion states chose to allow transitional plans through 2015 – in other words, there were no non-expansion, non-transitional states. We calculated the simple average of state risk scores across these three groups of states. Since the focus of this analysis is on the effect of state decisions independent of the size of the state’s individual risk pool, we did not weight the group averages by billable member months. Compared to simple averages, weighted averages by billable member months show the same if not a stronger effect of state decisions on Medicaid expansion and transitional plans on the average state risk pool. Table 1 shows the state risk scores for the 2015 benefit year.
This analysis defines Medicaid expansion and non-expansion states using Kaiser Family Foundation’s report on the current status of state action on the Medicaid expansion decision. We consider states that expanded Medicaid before February 1, 2015 to be “expansion” states. For the purpose of this analysis we do not group Arkansas with expansion or non-expansion states because Arkansas expanded Medicaid through a “private option” waiver, thereby enrolling all newly eligible Medicaid enrollees in marketplace plans. Arkansas’s risk score is included in the national average. Two other states, New Hampshire and Iowa, received similar waivers, however, New Hampshire did not begin enrolling Medicaid expansion enrollees on exchange until 2016 and Iowa started phasing out this practice in 2014.
State decisions on whether to allow transitional plans were obtained from an Association of Health Insurance Plans (AHIP) map of state responses to administration policy on individual and small group coverage extensions. For the purpose of this analysis, we consider states that allowed transitional policies to continue in the individual marketplace through December 31, 2015 to be “transitional” states. In states that allowed transitional plans to continue through 2015, the ultimate decision whether to renew transitional policies was left to issuers. In at least one transitional state (Montana), all individual market carriers ultimately decided to discontinue transitional policies in 2015 and switch to ACA-compliant plans. Since the focus of this analysis is the effect of state policy decisions rather than carrier decisions, we consider Montana a transitional state.
This analysis excludes Vermont and Massachusetts. Vermont has a merged Individual and Small Group Market. Massachusetts ran its own state risk adjustment program in 2015 and data are not available.