Which PEPFAR Investments Drive HIV Outcomes? Informing PEPFAR Transition and Scale-Down
Overview
As PEPFAR faces increased pressure to transition and scale down, understanding which of its investments most effectively drive HIV outcomes can help inform future directions. This analysis examines PEPFAR spending and HIV viral suppression rates in 22 countries from 2018–2023, looking at spending in three areas: (1) core-services; (2) targeted/stand-alone programs; and (3) non-service delivery/institutional strengthening. Overall, it finds that targeted program spending, which accounts for the smallest share of PEPFAR spending, was associated with the biggest improvement in viral suppression, followed by spending on core-services. Further, targeted programs appear to be most important for “last-mile” gains (in countries closer to sustained epidemic control) while core-services appear to be most important in countries where HIV outcomes remain below optimal levels and are lower income. By contrast, spending on non-service delivery was negatively associated with viral suppression, suggesting diminishing returns at this point in PEPFAR’s trajectory. These findings provide new information about how future PEPFAR investments could best be tailored to support transition while maintaining HIV outcomes. Additional research on the relationship between specific activities within each spending category and HIV outcomes could further aid these efforts. Finally, it is important to note that despite the strength of the analytic model, it is possible that other factors may be contributing to the results.
Introduction
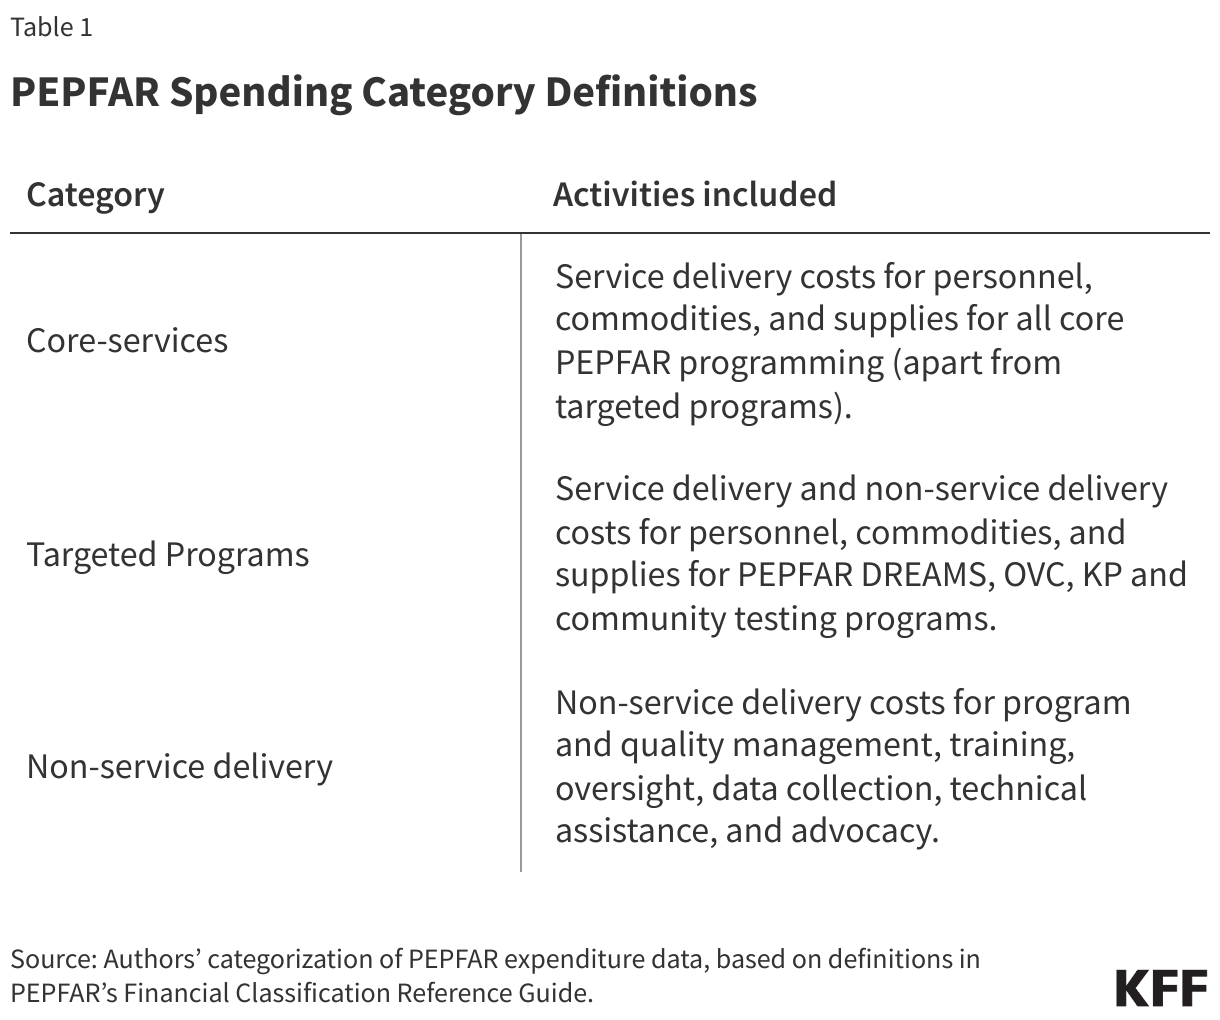
The Trump administration’s foreign aid review and related actions have resulted in significant changes to PEPFAR, the U.S. global HIV/AIDS program. These actions have included reductions in PEPFAR programming and steps to accelerate the scale-down of the program at a more rapid pace. Although PEPFAR had been working to develop transition plans, Congress and other stakeholders had been increasingly encouraging the program to develop more ambitious timelines for transitioning responsibility to countries. Still, how such planning is pursued, including which services are transitioned and when, can affect HIV outcomes and the sustainability of the HIV response. To help inform current discussions, this analysis examines the relationship between bilateral PEPFAR spending and HIV viral suppression rates in 22 PEPFAR countries between 2018 and 2023. The outcome measure – the share of people with HIV on treatment who are virally suppressed (to undetectable levels) – is used because viral suppression supports individual health and those who are virally suppressed cannot transmit HIV to their partner. The analysis looks at the association between viral suppression by country and year and PEPFAR spending in three areas (also see Table 1):
(1) core-services (e.g., commodities, supplies, health care work force);
(2) targeted/stand-alone programs (e.g., for key and vulnerable populations, including the DREAMS program and services for orphans and vulnerable children, and community-based testing); and
(3) non-service delivery/institutional strengthening (e.g., technical assistance, training, data collection)
It further stratifies countries into lower and higher achievement groups (based on a composite measure of the share of people with HIV who know their status, the share who know their status and are on treatment, and the share on treatment who are virally suppressed) and lower and higher income groups (based on GDP per capita) to better understand where different types of investments may be most needed. The first stratification reflects countries’ current performance and potential to improve HIV outcomes, while the second highlights their financial capacity to sustain HIV efforts independently. Importantly, findings here represent PEPFAR’s 2018-2023 period and may not reflect the relationship between investments and HIV outcomes earlier on in the program. They also may not be directly applicable to the current period, given the pause in activities and terminations of many PEPFAR projects as part of the administration’s foreign aid review. Still, they can serve to provide an indication of where future investments could promote stronger outcomes.
Findings
- The share of people with HIV on treatment who were virally suppressed increased in all but two countries over the period. Viral suppression went up, on average, by 8 percentage points and increased in 20 of the 22 countries between 2018 and 2023. Increases ranged between 2 and 23 percentage points, depending on the country. Decreases occurred in Ethiopia (-1 percentage point) and the Dominican Republic (-6). See Appendix Table.
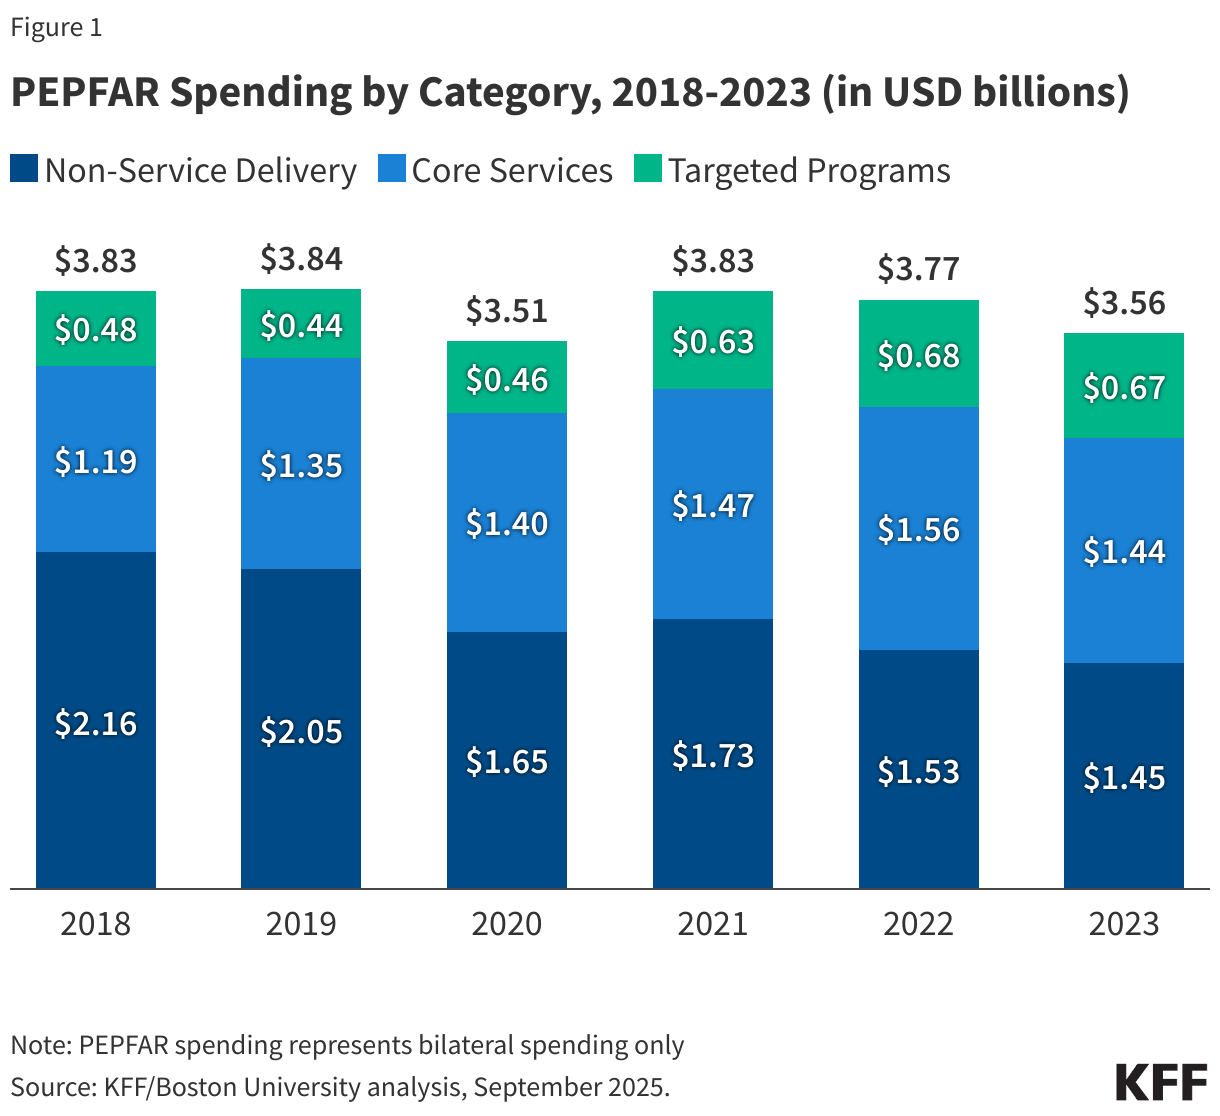
- Across the 22 countries analyzed, bilateral PEPFAR spending averaged $3.7 billion per year, during the 2018 to 2023 period. Spending fluctuated somewhat and was highest in 2019 and lowest in 2020. It was $275 million lower in 2023 compared to 2018 and spending declined in 14 of the 22 countries. See Figure 1.
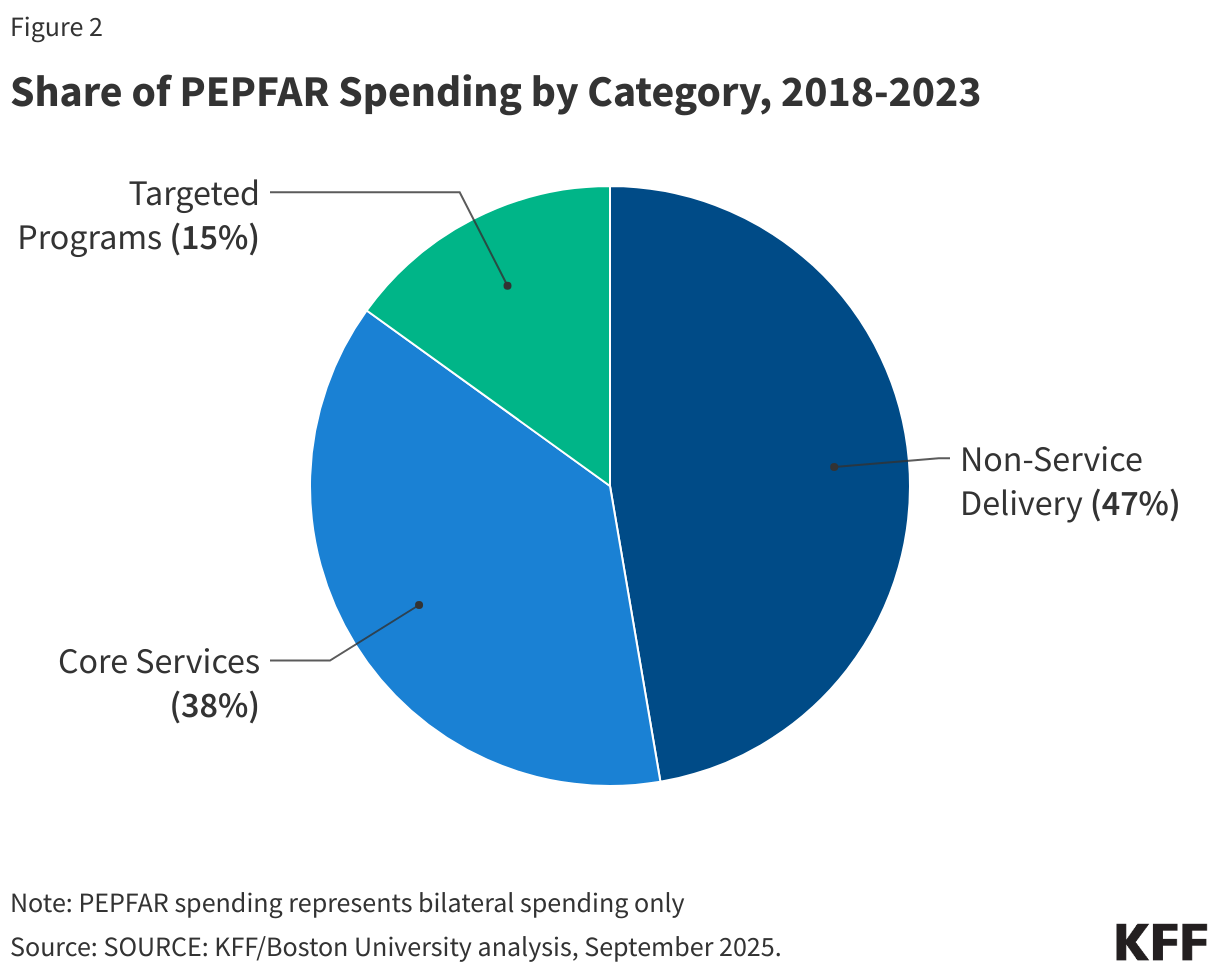
- Spending on non-service delivery accounted for the largest category of PEPFAR spending, followed by core-services and then targeted programs. Spending on non-service delivery averaged $1.76 billion per year in the 22 countries and accounted for 47% of spending over the period. Core-services averaged $1.40 billion per year (38%). Targeted programs accounted for the smallest share of spending (15%), averaging $560.7 million per year. See Figure 2.
- Declines in spending between 2018 and 2023 were driven entirely by non-service delivery. Non-service delivery spending declined by $714 million overall and fell in 19 of the 22 countries. By contrast, spending on core-services and targeted programs increased between the two periods (by $250.3 million and $188.8 million, respectively) and in most countries (17 and 19, respectively). See Appendix Table.
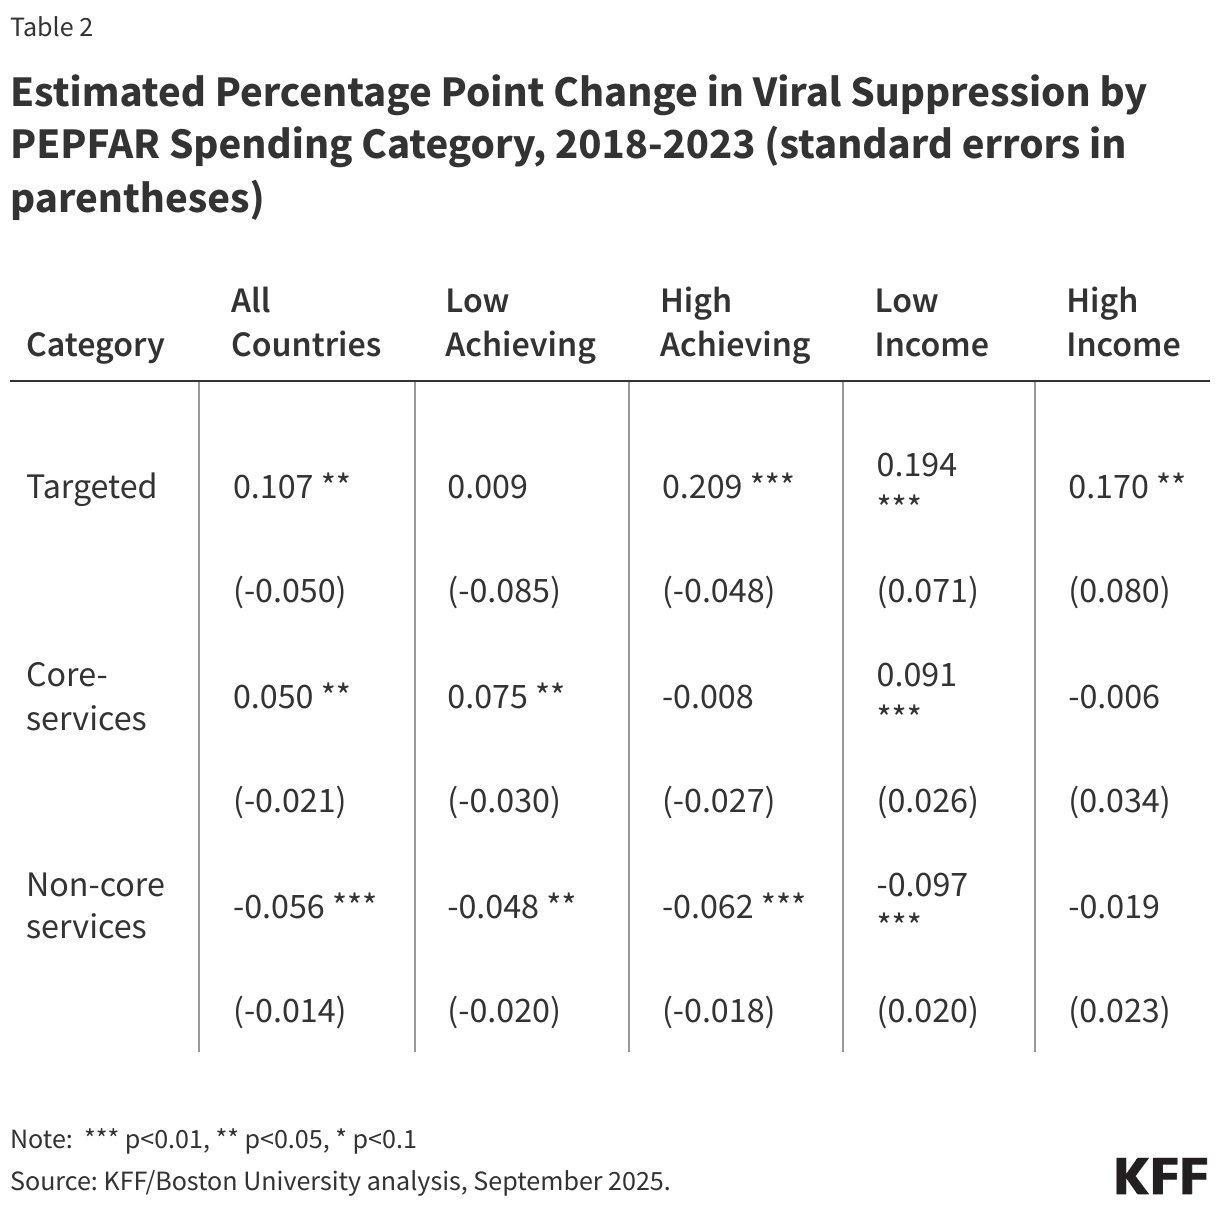
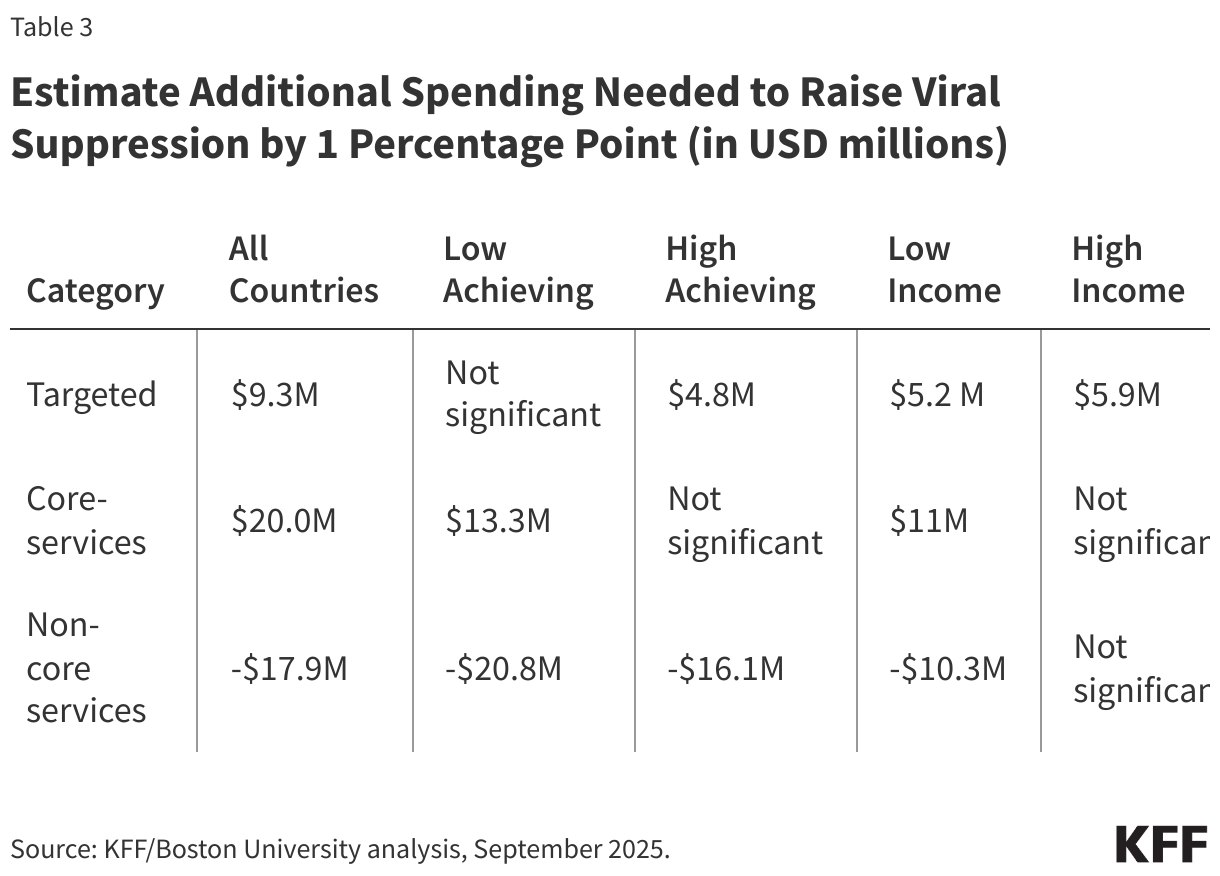
- The results of the model indicate that despite accounting for just 15% of PEPFAR spending, targeted programs were associated with the greatest improvement in viral suppression. Between 2018 and 2023, viral suppression increased by 0.11 percentage points, on average, for every $1 million spent on targeted programs. This translates into a one percentage point increase in viral suppression for every $9.3 million spent in a country.
- This association was strongest in countries closer to epidemic control, suggesting their importance for “last mile” gains. Targeted spending was associated with twice the gain in viral suppression (a 0.21 percentage point increase) in the high achieving country group (those closer to sustained epidemic control), compared to .011 percentage points for all countries. There was no significant association in the lower achieving country group. Significant improvement was found in both lower (0.19) and higher (0.17) income country groups. These findings suggest that targeted investments may be most important for “last mile” gains (those needed to fully reach and sustain epidemic control), regardless of country income. See Table 2.
- Core-services spending was also associated with improvement in viral suppression, although of a lesser magnitude. Overall, core-services spending was associated with a .05 percentage point increase in viral suppression, on average, for every $1 million spent. This translates into a 1 percentage point increase in viral suppression for every $20 million spent in a country.
- In addition, spending on core-services was only associated with viral suppression improvement in lower achieving and lower income country groups. Viral suppression increased in both lower achieving (0.08) and lower income (0.09) country groups. There was no significant association in higher achieving and higher income countries. This suggests that core-services investments yield the biggest returns in countries still needing to make more progress towards sustained epidemic control and those more likely to be in need of external financial assistance.
- By contrast, spending on non-service delivery, the largest category of spending, was associated with a reduction in viral suppression. Every $1 million spent on non-service delivery was associated with a .06 percentage point decrease in viral suppression. This was true regardless of country progress toward epidemic control or income. This finding suggests that spending in this area, which likely contributed to scale-up earlier on in PEPFAR’s evolution, may now have diminishing returns when it comes to HIV outcomes. While some spending on non-service delivery (such as for surveillance and other monitoring efforts) may aid in transitioning PEPFAR programming to country governments, this analysis suggests that reductions can be made without sacrificing program outcomes.
Implications
These findings support prior analyses that point to the importance of tailoring transition efforts to country-specific factors, including epidemiology and income. Approaches that are responsive to these factors are likely to be more effective than uniform strategies. More specifically, the findings suggest that targeted, stand-alone investments – those focused on specific populations – are associated with the strongest improvement in viral suppression, particularly for “last mile” gains, those needed to fully reach and sustain epidemic control. For example, spending an additional $9.3 million on targeted programs is predicted to increase the share of people with HIV on treatment who are virally suppressed by one percentage point; spending $100 million would increase viral suppression by 11 percentage points. On the other hand, a $100 million cut would decrease viral suppression by the same magnitude. Targeted programs, which represent a relatively small share of PEPFAR spending, are also those least likely to be assumed by country governments, highlighting the potential ongoing role for PEPFAR in this area. Core-services investments were associated with somewhat smaller improvements, and these were concentrated in lower-income countries and those further away from sustained epidemic control. By contrast, non-core investments appear to have diminishing returns at this point in PEPFAR’s trajectory. This suggests opportunities to adjust spending in this area, while recognizing that some non-core activities, such as monitoring and support for transition processes, may still be useful in the near term.
There are some limitations to these findings. The results reflect average effects across countries and do not capture within-country variation. Additional country-level analyses could provide a more nuanced approach to transition, as could further disaggregation of activities within each spending category to provide a more complete picture of the specific types of investments most closely associated with improvements in HIV outcomes. It is also the case that PEPFAR investments in all three categories are not necessarily independent of one another. For example, the success of targeted program investments is also likely predicated on delivery of core services, particularly commodities for HIV treatment and prevention. In addition, despite the strength of the analytic model, which included controls for country income and health service coverage (a proxy for the strength of a health system strength), it is possible that other factors may be contributing to the results. It is also possible that these findings may not be directly applicable to the current PEPFAR environment given the pause in activities and terminations of many PEPFAR projects as part of the foreign aid review. Despite these limitations, the findings contribute to the evidence base on how different types of PEPFAR spending align with progress toward epidemic control and may help inform decisions about future allocation, including potential re-allocations, and transition planning.
Methods
We obtained data on bilateral PEPFAR expenditures by country over the 2018-2023 time period from PEPFAR’s program expenditure database which includes data for 33 operating units (26 countries and 7 regions). We excluded four countries (Cameroon, India, South Sudan and Vietnam) due to poor data availability across HIV outcome indicators and excluded the 7 regions. Our final dataset included 22 countries (Angola, Botswana, Burundi, Côte d’Ivoire, DRC, Dominican Republic, Eswatini, Ethiopia, Haiti, Kenya, Lesotho, Malawi, Mozambique, Namibia, Nigeria, Rwanda, South Africa, Tanzania, Uganda, Ukraine, Zambia, and Zimbabwe) containing 132 country/year observations over the period.
Spending was divided into three, broad categories (see Table 1 for further details):
(1) core-services (e.g., commodities, supplies, health care work force);
(2) targeted/stand-alone programs (e.g., for key and vulnerable populations, including the DREAMS program and services for orphans and vulnerable children, and community-based testing); and
(3) non-service delivery/institutional strengthening (e.g., technical assistance, training, data collection)
Our main outcome of interest was the share of people living with HIV who were on HIV treatment and were virally suppressed. These data were obtained from UNAIDS. While this was the dependent variable we modeled, we used other HIV outcome data from UNAIDS to generate composite scores to allow us to create country strata based on progress toward sustained epidemic control for further analysis. The composite scores included the share of people living with HIV who were aware of their HIV status, the share on treatment, and the share virally suppressed. The score was generated by giving equal weight to each of the three outcomes and was based solely on data from the latest year, 2023. Countries below the median were assigned to the lower achievement stratum, while countries above the median were assigned to the higher achievement stratum. We also divided countries into two strata based on income, using GDP per capita (current international $) for the most recent year, 2023. Countries below the median were categorized as lower-income and those above the median as higher-income. For observations with a few missing outcome values, the missing data were generated using linear interpolation.
We ran five models with PEPFAR financial data expressed in USD millions and the dependent variable expressed as a percentage. Model 1 included all 22 countries over the 2018-2023 period (for a total of 132 observations). Models 2 and 3 divided countries into two strata based on composite scores of the three HIV outcomes (resulting in 11 countries in each stratum, each with 66 observations). Models 4 and 5 divided countries into the two economic group strata based on GDP per capita. Our models included controls for GDP per capita, PPP (current international $) and the WHO Service Coverage Index, which measures coverage of essential health services and serves as a proxy for health system strength, for the median year (2021).
To analyze the panel data, we tested both fixed and random effects models. Fixed effects models control for all time-invariant differences between countries. Random effects models control for unobserved heterogeneity. The Hausman test was used to determine that the random effects model was the preferred specification for the data.
Appendix
| Appendix Table # 1 | ||||||||||
| PEPFAR Spending by Category and Percent Virally Suppressed, 2018 and 2023 | ||||||||||
| Country | Targeted | Core | Non-Core | Total | Targeted | Core | Non-Core | Total | % Virally Suppressed | |
| 2018 | 2023 | 2018 | 2023 | |||||||
| Angola | $3,841,633 | $478,898 | $8,471,700 | $12,792,231 | $438,279 | $0 | $3,765,634 | $4,203,913 | 55.0 | 78.0 |
| Botswana | $9,188,688 | $12,759,114 | $24,870,282 | $46,818,084 | $17,646,565 | $5,389,744 | $22,789,597 | $45,825,907 | 97.0 | 99.0 |
| Burundi | $1,801,767 | $1,874,579 | $11,335,090 | $15,011,436 | $3,600,810 | $6,158,745 | $10,631,531 | $20,391,086 | 87.3 | 89.0 |
| Cote d’Ivoire | $17,303,080 | $22,024,735 | $71,241,076 | $110,568,891 | $26,935,252 | $28,148,513 | $28,998,007 | $84,081,772 | 77.0 | 88.0 |
| DRC | $10,523,645 | $15,373,773 | $29,605,903 | $55,503,321 | $9,611,968 | $45,223,754 | $31,965,084 | $86,800,805 | 73.3 | 89.0 |
| Dominican Republic | $3,656,850 | $786,187 | $5,196,748 | $9,639,785 | $4,501,686 | $4,829,020 | $9,829,188 | $19,159,894 | 93.0 | 87.0 |
| Eswatini | $11,172,727 | $11,275,208 | $33,105,932 | $55,553,867 | $17,866,238 | $14,758,439 | $28,178,327 | $60,803,004 | 93.0 | 99.0 |
| Ethiopia | $19,499,477 | $17,495,821 | $103,477,386 | $140,472,684 | $20,097,637 | $19,334,925 | $44,500,139 | $83,932,701 | 90.0 | 89.0 |
| Haiti | $14,181,119 | $34,372,263 | $51,749,891 | $100,303,273 | $14,611,550 | $30,106,447 | $43,048,408 | $87,766,405 | 77.0 | 85.0 |
| Kenya | $56,591,156 | $146,132,514 | $234,030,849 | $436,754,519 | $63,807,040 | $120,456,513 | $112,541,769 | $296,805,321 | 90.0 | 97.0 |
| Lesotho | $10,462,376 | $20,843,626 | $31,703,237 | $63,009,239 | $14,050,868 | $21,140,546 | $26,020,807 | $61,212,221 | 93.0 | 99.0 |
| Malawi | $14,321,280 | $23,050,062 | $84,731,219 | $122,102,561 | $31,084,406 | $52,502,078 | $68,613,196 | $152,199,680 | 89.0 | 95.0 |
| Mozambique | $32,009,703 | $103,055,070 | $240,274,822 | $375,339,595 | $39,102,228 | $149,534,500 | $166,514,020 | $355,150,748 | 76.1 | 90.0 |
| Namibia | $5,860,629 | $10,539,001 | $40,584,784 | $56,984,415 | $19,372,076 | $15,965,548 | $31,591,075 | $66,928,699 | 82.4 | 99.0 |
| Nigeria | $47,420,855 | $136,018,210 | $171,857,733 | $355,296,799 | $67,789,733 | $158,063,694 | $122,508,397 | $348,361,824 | 82.9 | 96.0 |
| Rwanda | $8,942,243 | $42,042,538 | $16,625,175 | $67,609,956 | $13,038,878 | $25,660,903 | $17,576,226 | $56,276,007 | 92.0 | 99.0 |
| South Africa | $53,379,111 | $142,389,246 | $257,463,135 | $453,231,491 | $85,711,833 | $178,734,528 | $124,817,074 | $389,263,436 | 88.0 | 91.0 |
| Tanzania | $64,427,213 | $88,685,437 | $266,269,079 | $419,381,729 | $60,038,096 | $155,506,898 | $200,291,101 | $415,836,095 | 80.0 | 97.0 |
| Uganda | $42,291,465 | $144,480,428 | $211,712,274 | $398,484,167 | $49,130,305 | $147,510,953 | $152,084,226 | $348,725,484 | 88.0 | 94.0 |
| Ukraine | $3,968,162 | $9,741,849 | $18,967,369 | $32,677,380 | $8,752,342 | $12,800,280 | $14,803,193 | $36,355,815 | 93.0 | 98.0 |
| Zambia | $31,912,365 | $160,009,043 | $177,411,909 | $369,333,318 | $53,606,148 | $174,679,809 | $133,148,050 | $361,434,007 | 89.2 | 97.0 |
| Zimbabwe | $21,706,311 | $43,324,946 | $73,841,291 | $138,872,548 | $52,470,392 | $70,552,100 | $56,255,761 | $179,278,253 | 84.0 | 96.0 |
| Notes: PEPFAR spending represents bilateral spending only. Viral suppression is percent of people with HIV on antiretroviral treatment who are virally suppressed. Sources: PEPFAR’s program expenditure database; UNAIDS 2024 HIV estimates. | ||||||||||
Moaven Razavi, Collins Gaba, and Allyala Nandakumar are with Boston University. Jen Kates is with KFF. The authors would like to acknowledge assistance provided by William Crown and Deborah Stenoien from Boston University.