Sustainability Readiness in PEPFAR Countries
Data Note
Overview
PEPFAR’s latest 5-year strategy puts a premium on sustainability as one of its five strategic pillars, and the program reports that it is working to develop sustainability roadmaps with countries. Achieving and maintaining sustainability of the HIV response, with the goal of countries taking on more ownership of their HIV response, is complex, multidimensional, and dependent on numerous factors that are not always within PEPFAR or the U.S. government’s control. To help inform discussions about PEPFAR’s work on sustainability, this data note arrays and groups PEPFAR countries by their level of “sustainability readiness.” Specifically, it assigns “sustainability scores” according to how countries perform relative to targets on 14 indicators and combines those scores with their HIV epidemic control status to group countries into several categories. The analysis shows that traditional measures of sustainability, such as those that assess financial independence or the strength of the basic health system, are not necessarily indicative of HIV epidemic control status. Countries that have achieved epidemic control and reached higher sustainability thresholds are likely best placed to take on more of their HIV response.
Introduction
PEPFAR’s latest 5-year strategy puts a premium on sustainability as one of five strategic pillars. The program defines sustainability as “a country having and using its enabling environment, capable institutions, functional systems, domestic resources, and diverse capacities within the national system…to sustain achievement of 95-95-95 goals; to ensure equity in its HIV response; and to protect against other public health threats.”1 Sustainability is to be assessed across three broad areas: political, programmatic, and financial – and a PEPFAR process has been launched to develop measurable country sustainability “roadmaps,” with the goal of having them in place by the end of 2024. This current approach joins a much longer history in PEPFAR’s attention to sustainability but marks a new point in this evolution, informed by the impact of COVID-19, progress in the HIV response, projected budget constraints, and the changing U.S. view of its role in development and of the “donor/recipient” relationship.
Achieving and maintaining sustainability of the HIV response, however, is complex, multidimensional, and not static, and is ultimately dependent on numerous factors that are sometimes within but often outside of PEPFAR and the U.S. government’s control. Country contexts vary and may change over time due to economic conditions, shifts in political and legal landscapes, and the impact of other pandemics or health issues, conflicts, and other challenges. Moreover, considerations for ensuring sustainability are particularly delicate in the context of an infectious disease, where there is risk of resurgence if programs are not maintained. This has been seen historically with both malaria and tuberculosis, as well as more recently with service disruptions due to COVID-19.2
To help inform discussions about PEPFAR’s work on sustainability, this analysis seeks to identify potential indicators of “sustainability readiness” in PEPFAR countries – that is, how prepared PEPFAR countries are to take on more of their HIV response. Specifically, it assigns “sustainability scores” according to how countries perform relative to targets3 on 14 indicators, spanning four broad areas (see Appendix Table 1 and Methods).
At the same time, because the ultimate goal of PEPFAR is to achieve and maintain HIV epidemic control (see definitions in Box 1), we also combined these sustainability scores with HIV epidemic control status in each country. The resulting “sustainability readiness matrix” helps point to potential pathways or emphases for future sustainability efforts while maintaining a focus on HIV. We limited the analysis to the 25 PEPFAR countries that are required to prepare Country Operational Plans (COPs) in 2023.
It is important to note that while a range of indicators were included in this analysis, there are others that may also be important to assess, such as indicators of equity (another of PEPFAR’s five strategic pillars) and/or more specific programmatic measures, such as HIV commodity security. In addition, while this analysis applied equal weights to each of the indicators (and indicator areas) used here, it may be desirable to assign greater importance to some areas, such as those describing the HIV policy environment or financial independence. Finally, this analysis focuses on only one point in time, but country contexts change and continual monitoring of these indicators as well as HIV epidemic control status will be important.
Box 1: Epidemic Control Status Groups for PEPFAR Countries
PEPFAR categorizes countries into three groups4 based on their progress toward reaching control of their HIV/AIDS epidemic using two metrics:
- The trend in the incidence to mortality ratio (IMR)5 (whether increasing or decreasing), and
- Whether a country has reached the global target of 73%6 viral load suppression (VLS) among people living with HIV.
The three epidemic control status groups are:
- At Epidemic Control – new infections and deaths are low and declining, and the global target for people virally suppressed has been reached7
- Near Epidemic Control – new infections and deaths are low and declining, but the global target for people virally suppressed has not yet been reached 8
- Not Near Epidemic Control – new infections and deaths are not declining, and in some cases increasing, and the global target for people virally suppressed has not yet been reached9
Key Takeaways
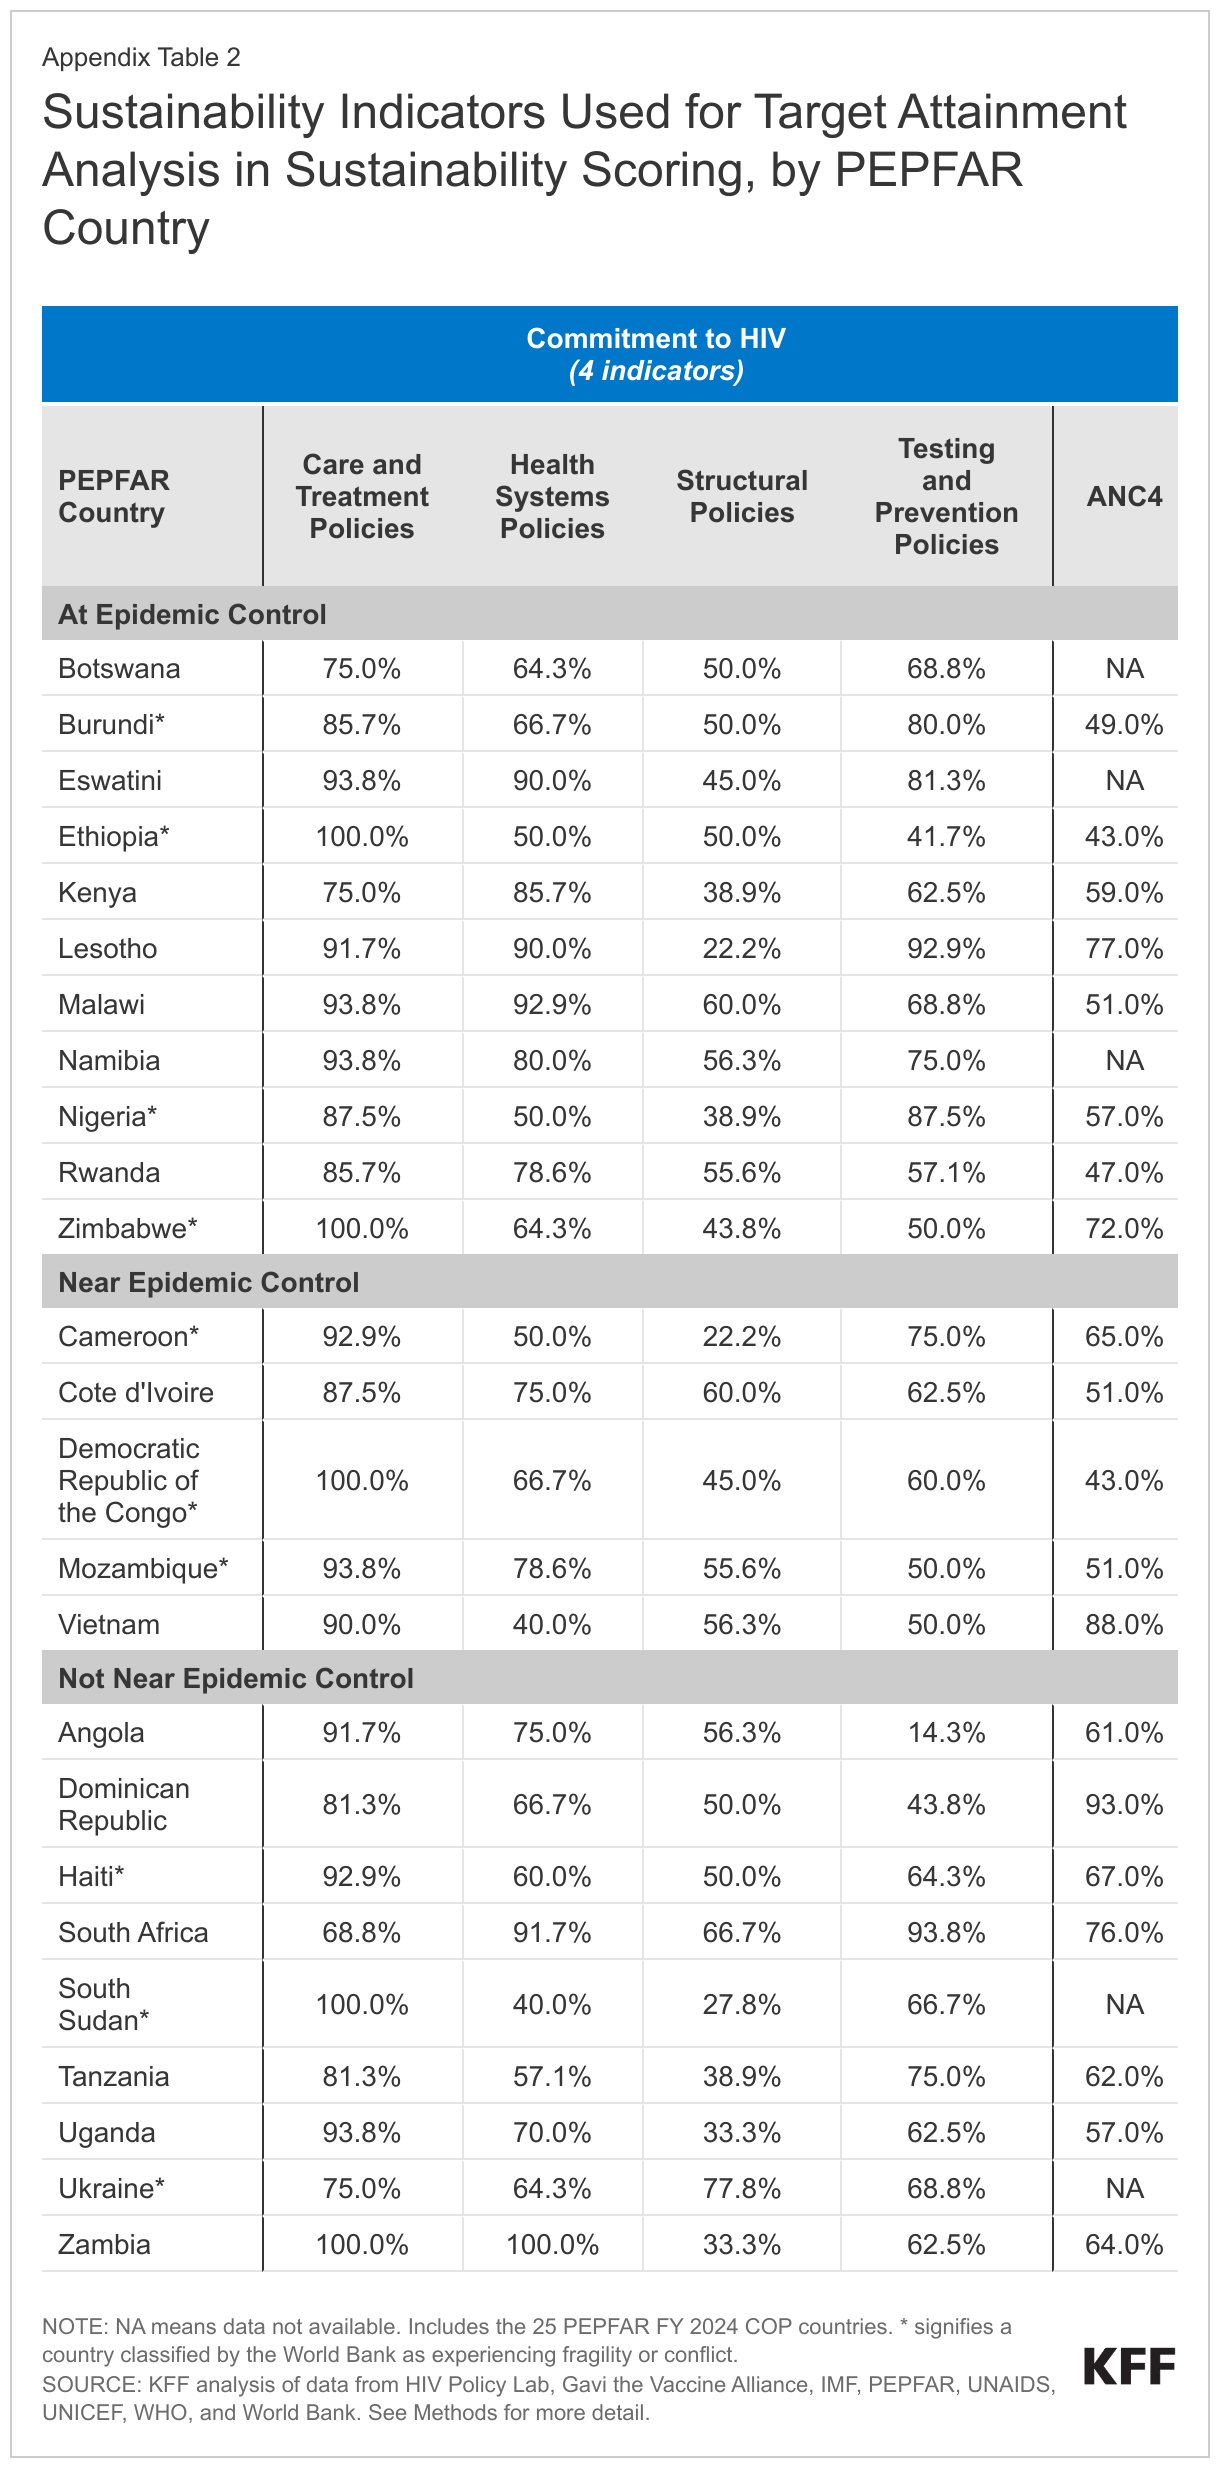
- PEPFAR countries are at varying points along the sustainability glidepath. They vary in their levels of economic growth and financial independence, the extent to which their policy environments align with international HIV standards, and the strength of their basic health system, among other factors. For example, central government debt as a percentage of GDP, a measure of financial burden faced by countries, ranges from 20% in Botswana to 119% in Zambia. Alignment of HIV testing and prevention policies with international standards ranges from 14% in Angola to 94% in South Africa. See Appendix Tables 2-3.
- As such, sustainability scores ranged significantly across PEPFAR countries, and no country attained the highest possible score. South Africa ranked the highest (10), followed by Botswana and the Dominican Republic (9) and then Namibia and Ukraine (8). At the other end of the spectrum, eight countries had scores of 3, and one country (Ethiopia) had a score of 1. See Figure 1.
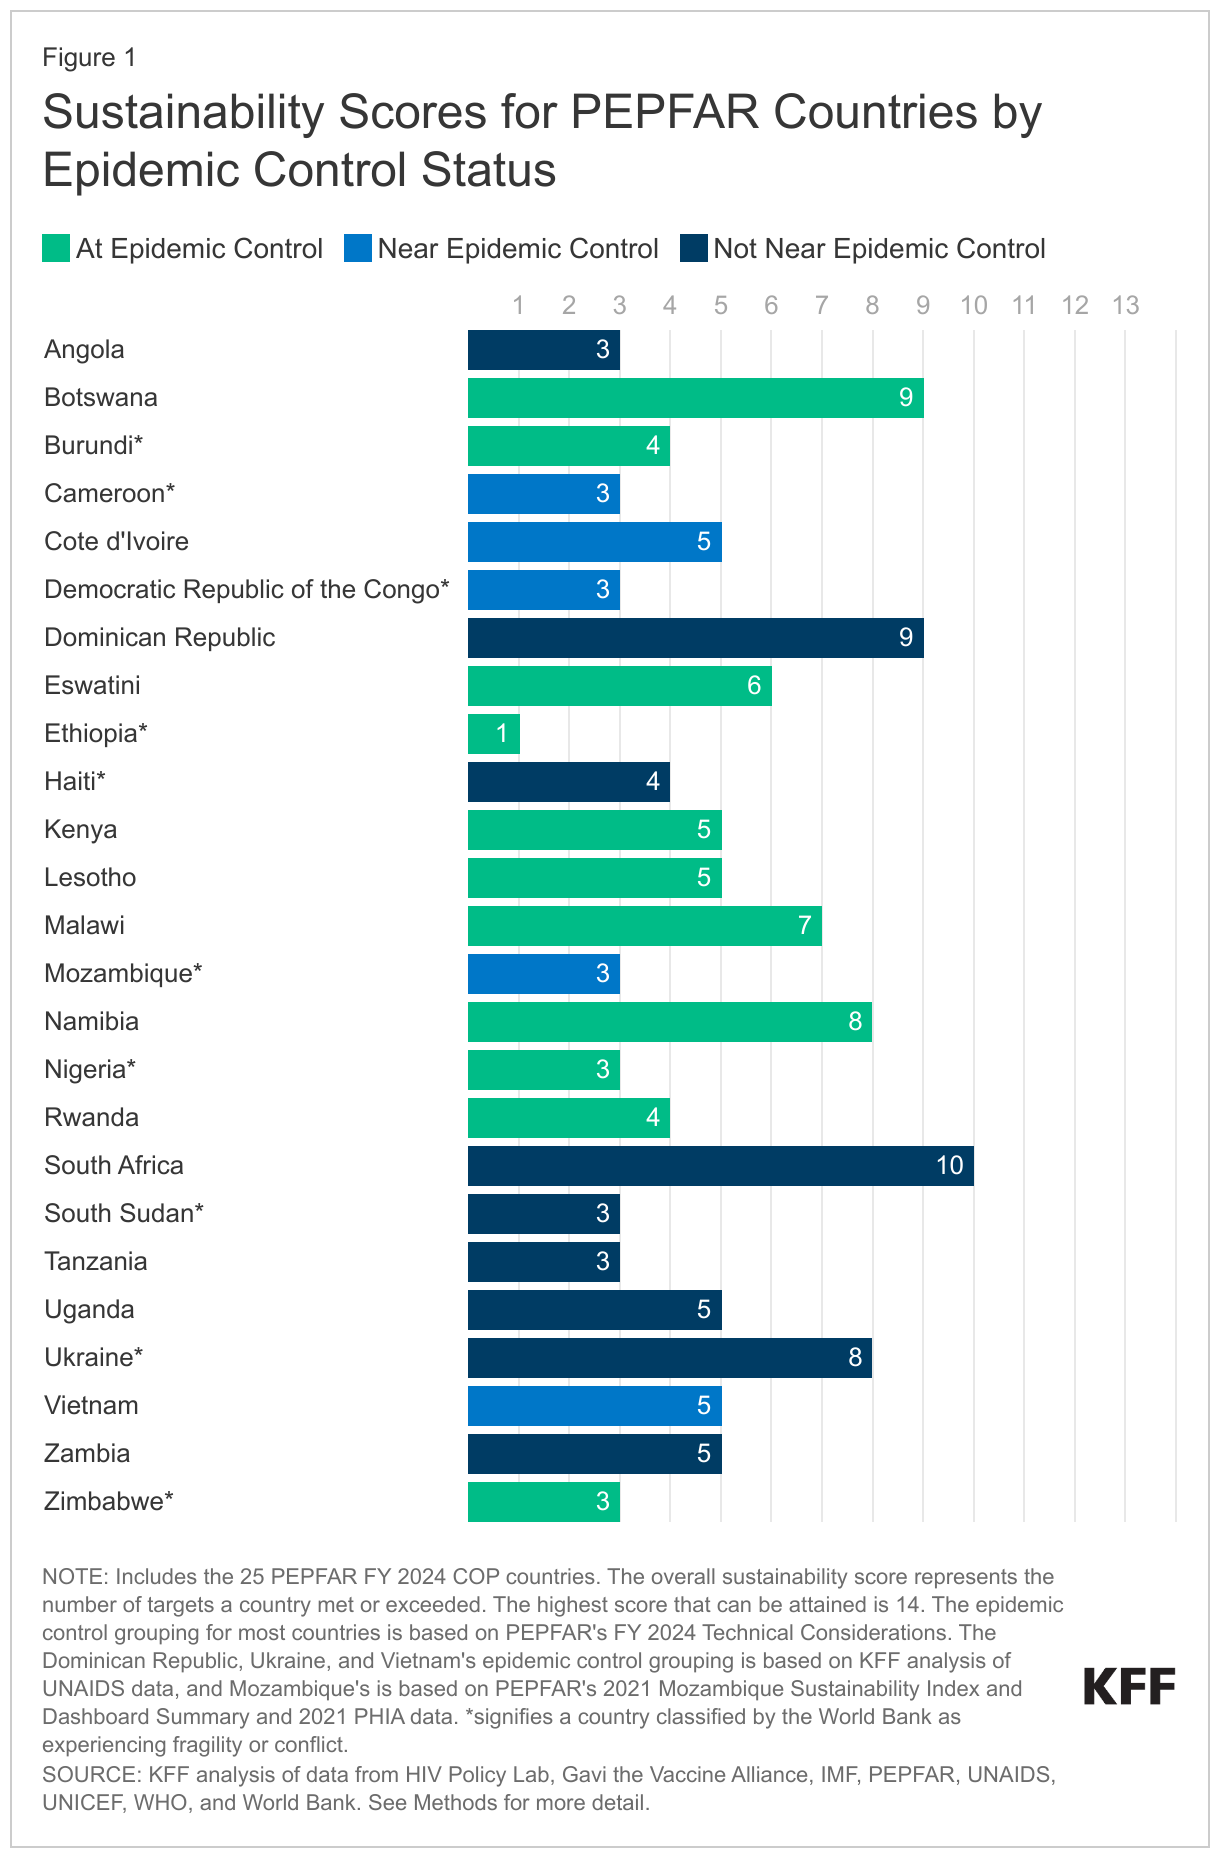
- The role of conflict and fragility is an important element to consider, as most of the countries with the lowest sustainability scores face such challenges. Of the 10 countries characterized by the World Bank as conflict-affected or fragile, nine have sustainability scores of four or less (Burundi, Cameroon, the Democratic Republic of the Congo, Ethiopia, Haiti, Mozambique, Nigeria, South Sudan, and Zimbabwe). The exception is Ukraine, with a score of 8 (which could reflect the timing of data available for this assessment, which largely pre-date the current crisis in that country). See Figure 1.
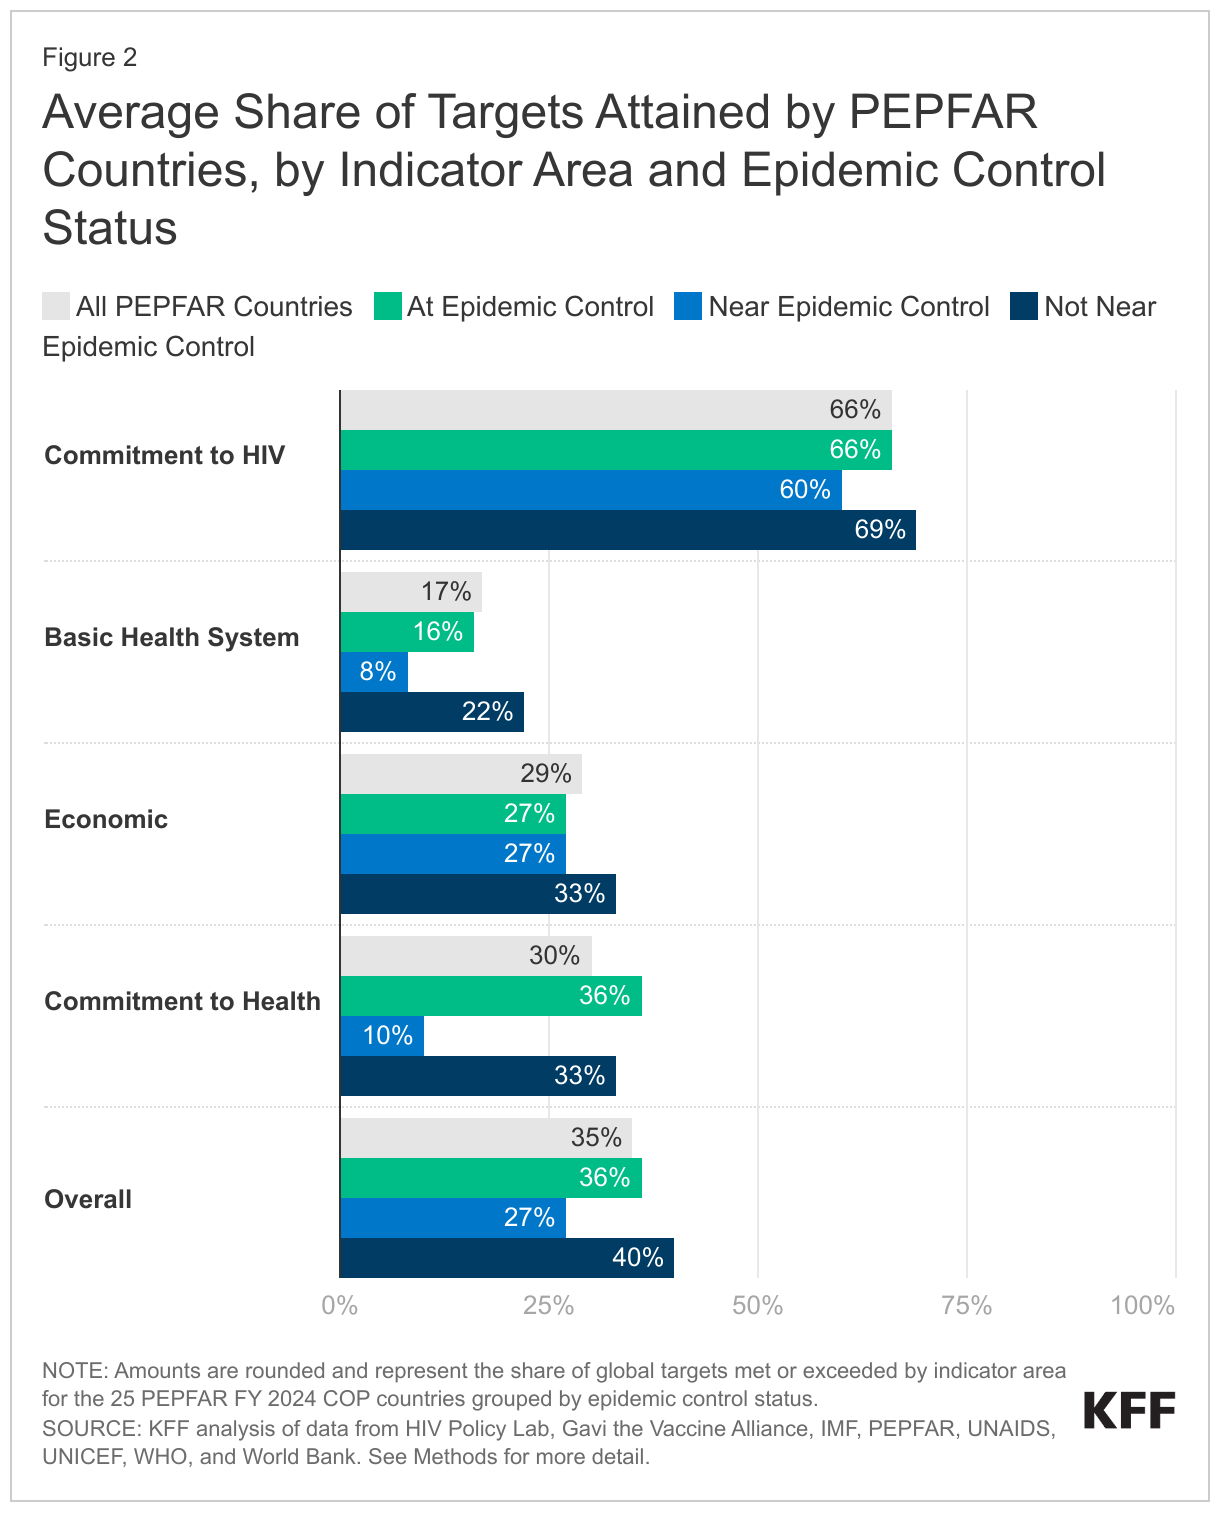
- Looking across the four sustainability indicator areas (commitment to HIV, basic health system, economic, and commitment to health indicators), PEPFAR countries scored, on average, highest on “commitment to HIV” and lowest on “basic health system” measures. Overall, PEPFAR countries were most likely to meet or exceed commitment to HIV indicators (66%), which assess how fully countries have adopted internationally-recommended policies for addressing the epidemic. By contrast, only 17% of basic health system measures were met or exceeded. For the other two indicator areas – economic and commitment to health – PEPFAR countries met or exceeded 29% and 30% of targets, respectively. This suggests that the areas of focus for promoting sustainability rest largely in the realm of further strengthening the basic health system and in addressing economic vulnerability. See Figure 2 and Appendix Table 4.
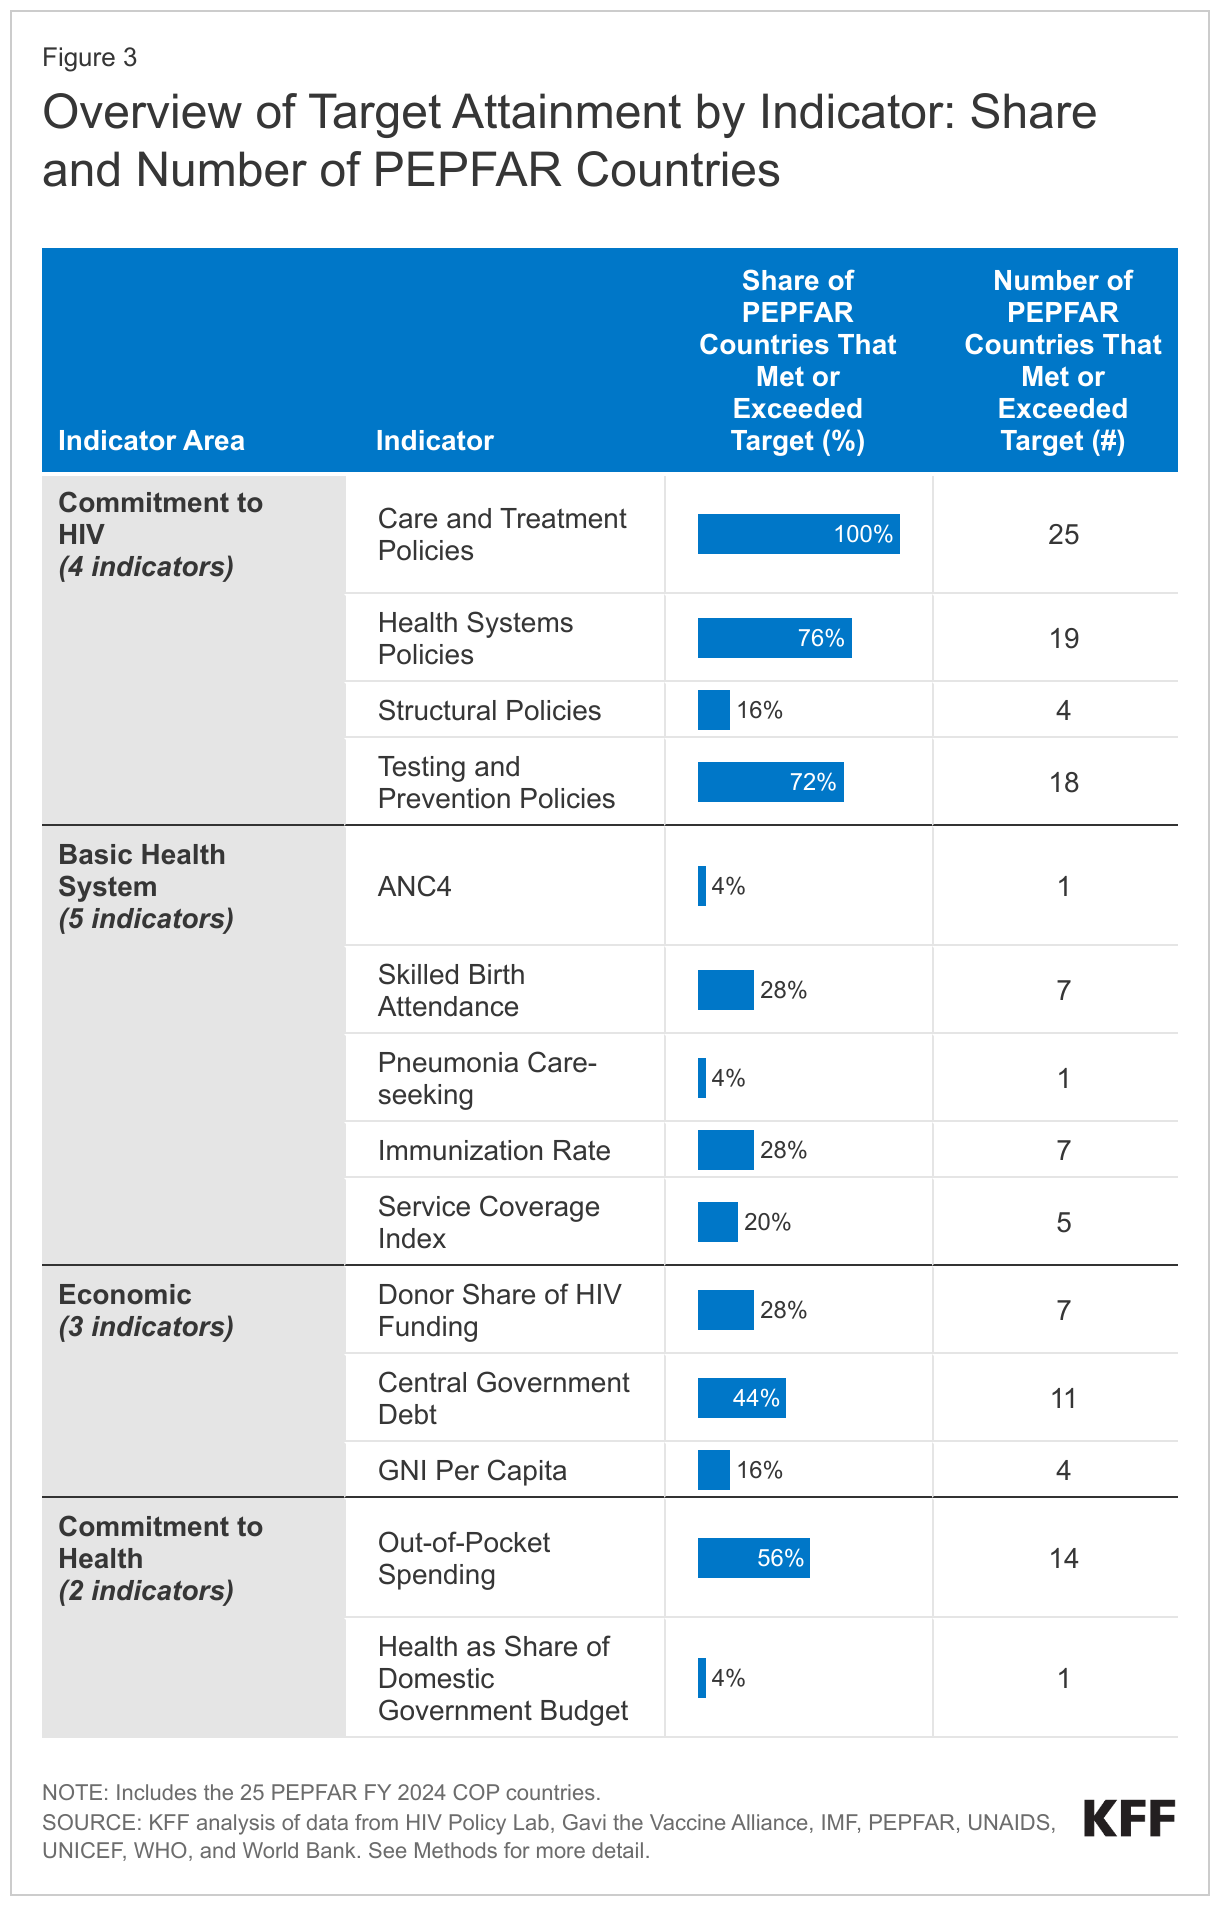
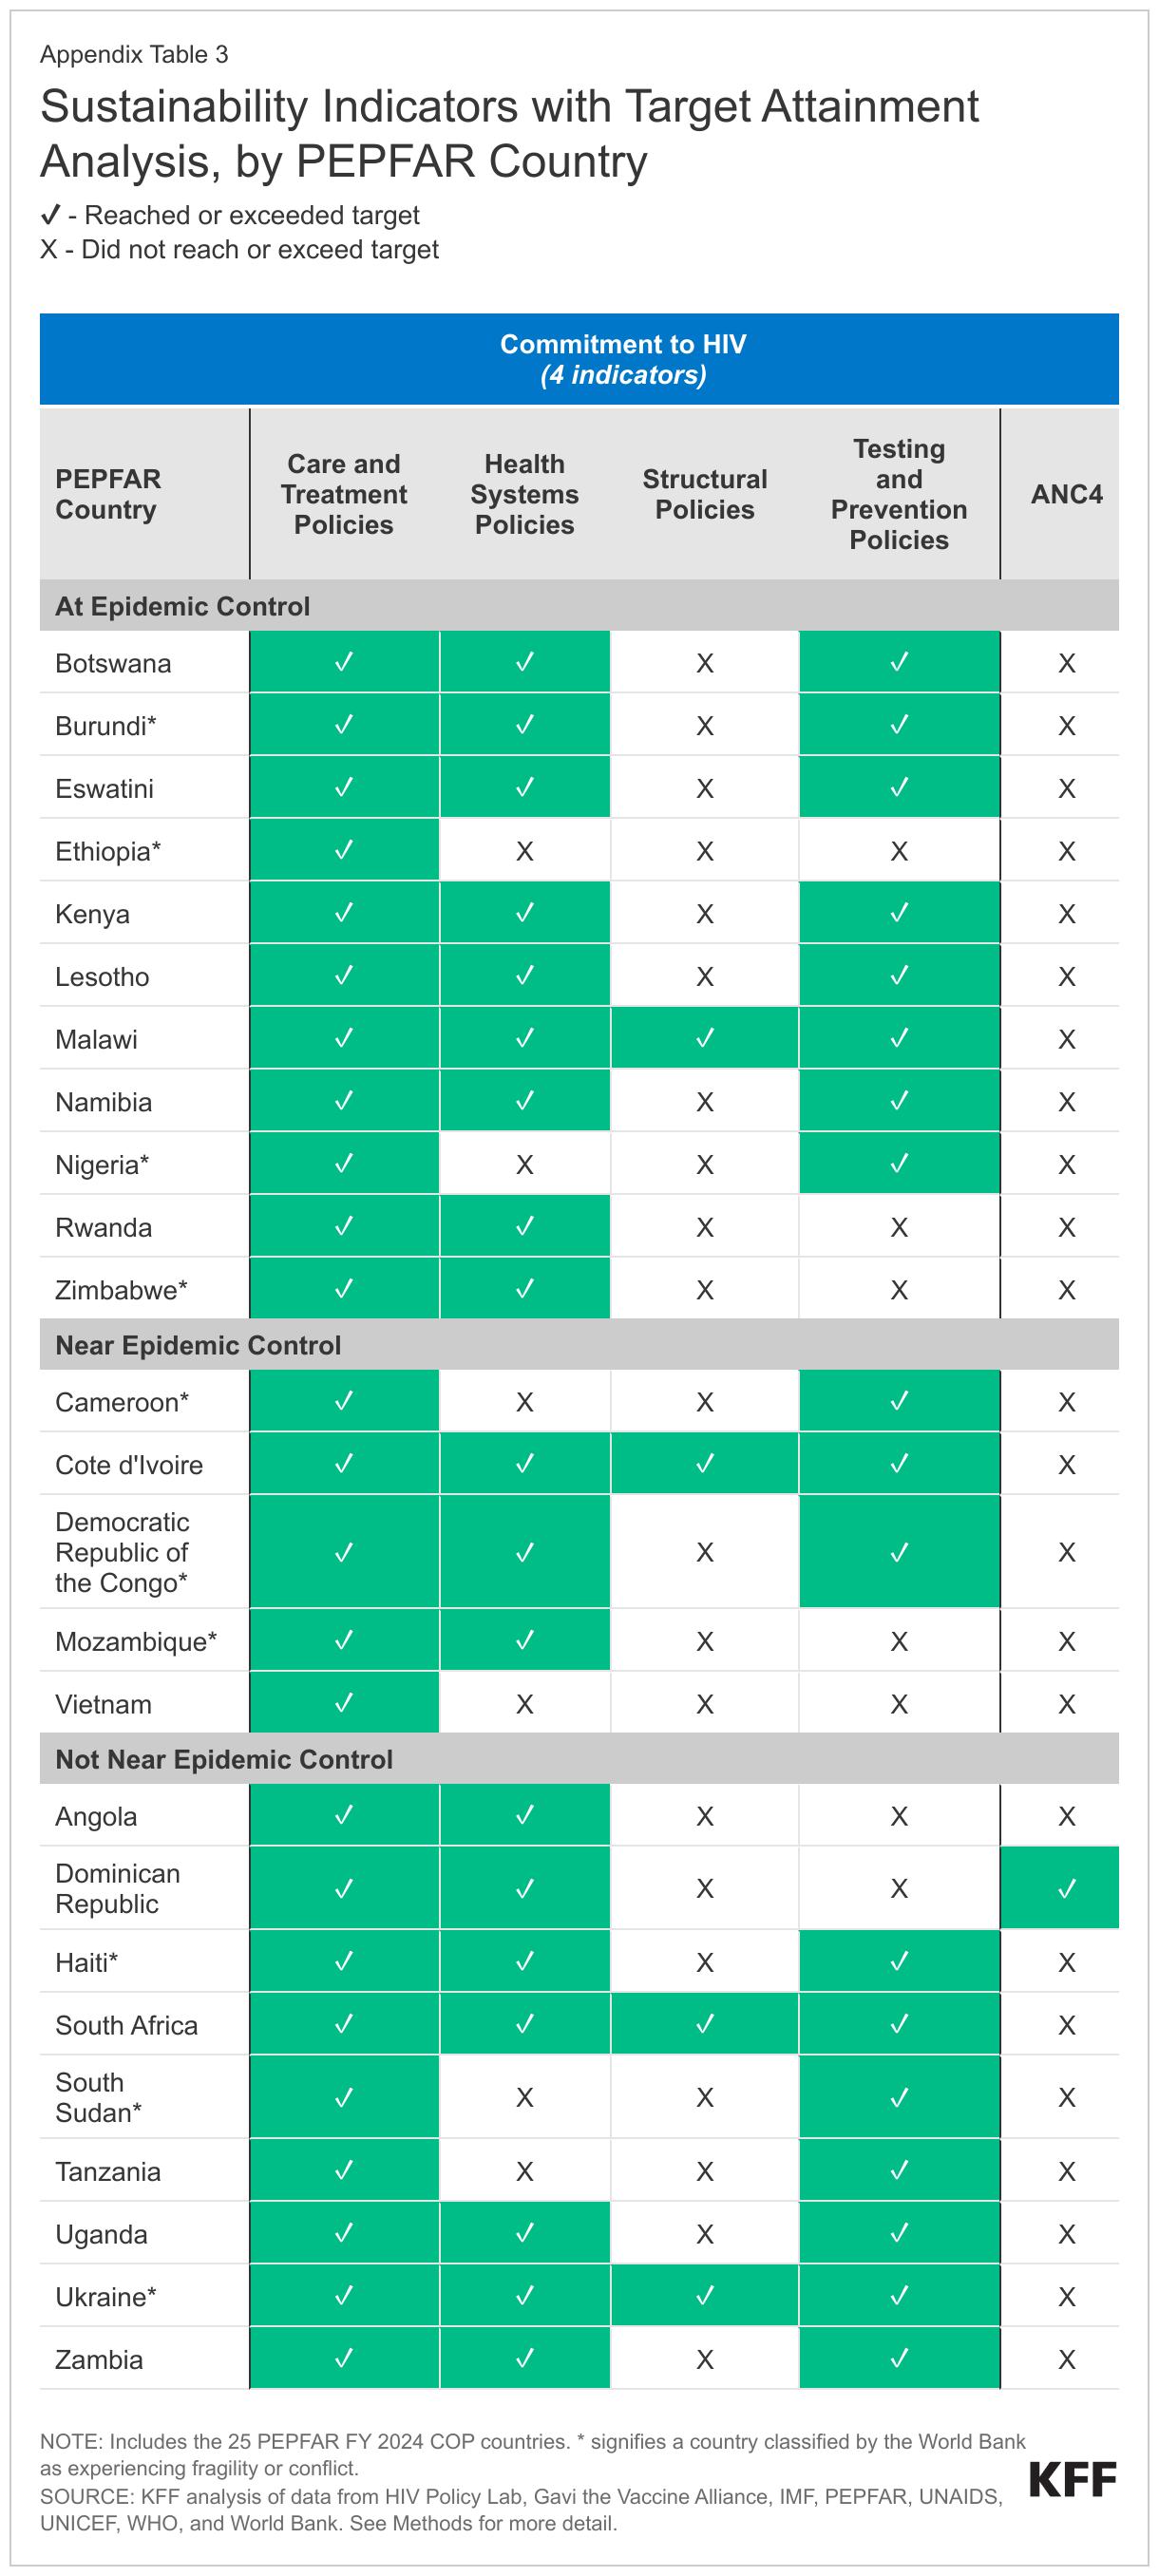
- There is also some notable variation in indicator scores within each of these broader areas. For example, despite the relatively high score for commitment to HIV policy indicators, the individual indicator addressing structural challenges (e.g., laws and policies), lags far behind with only 16% of countries meeting or exceeding its target. By contrast, all PEPFAR countries met or exceeded the indicator for care and treatment policies (100%), and almost three-quarters (72%) did so for testing and prevention policies. In the area of basic health, only 4% of countries met or exceeded targets for delivering recommended antenatal care and for seeking care for children suspected of having pneumonia. Similarly, in the area of commitment to health, only 4% met or exceeded the target for health as a share of the domestic government’s budget. See Figure 3 and Appendix Tables 2-3.
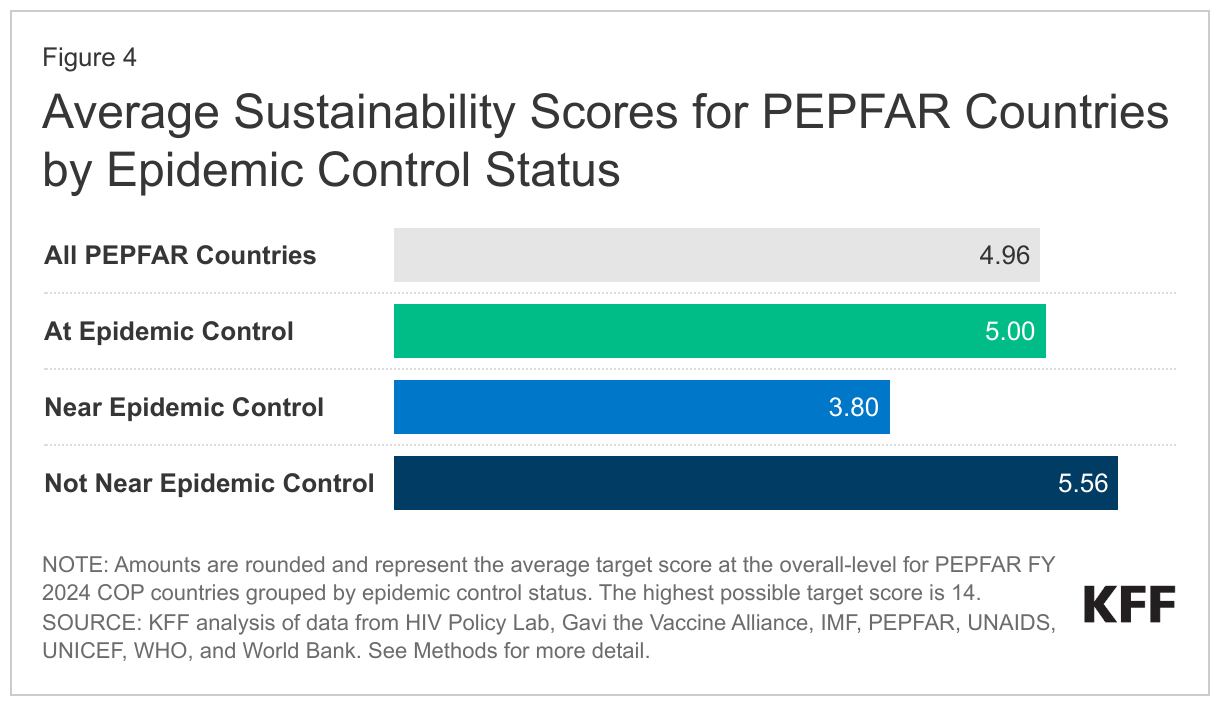
- Sustainability scores alone, however, do not tell the whole story, as they are not indicative of HIV epidemic control status. In fact, the average sustainability score was highest (5.6) for the group of countries “not near epidemic control,” largely driven by scores for South Africa and the Dominican Republic, and lowest (3.8) for countries “near epidemic control.” The average for countries “at epidemic control” was five. See Figure 4.
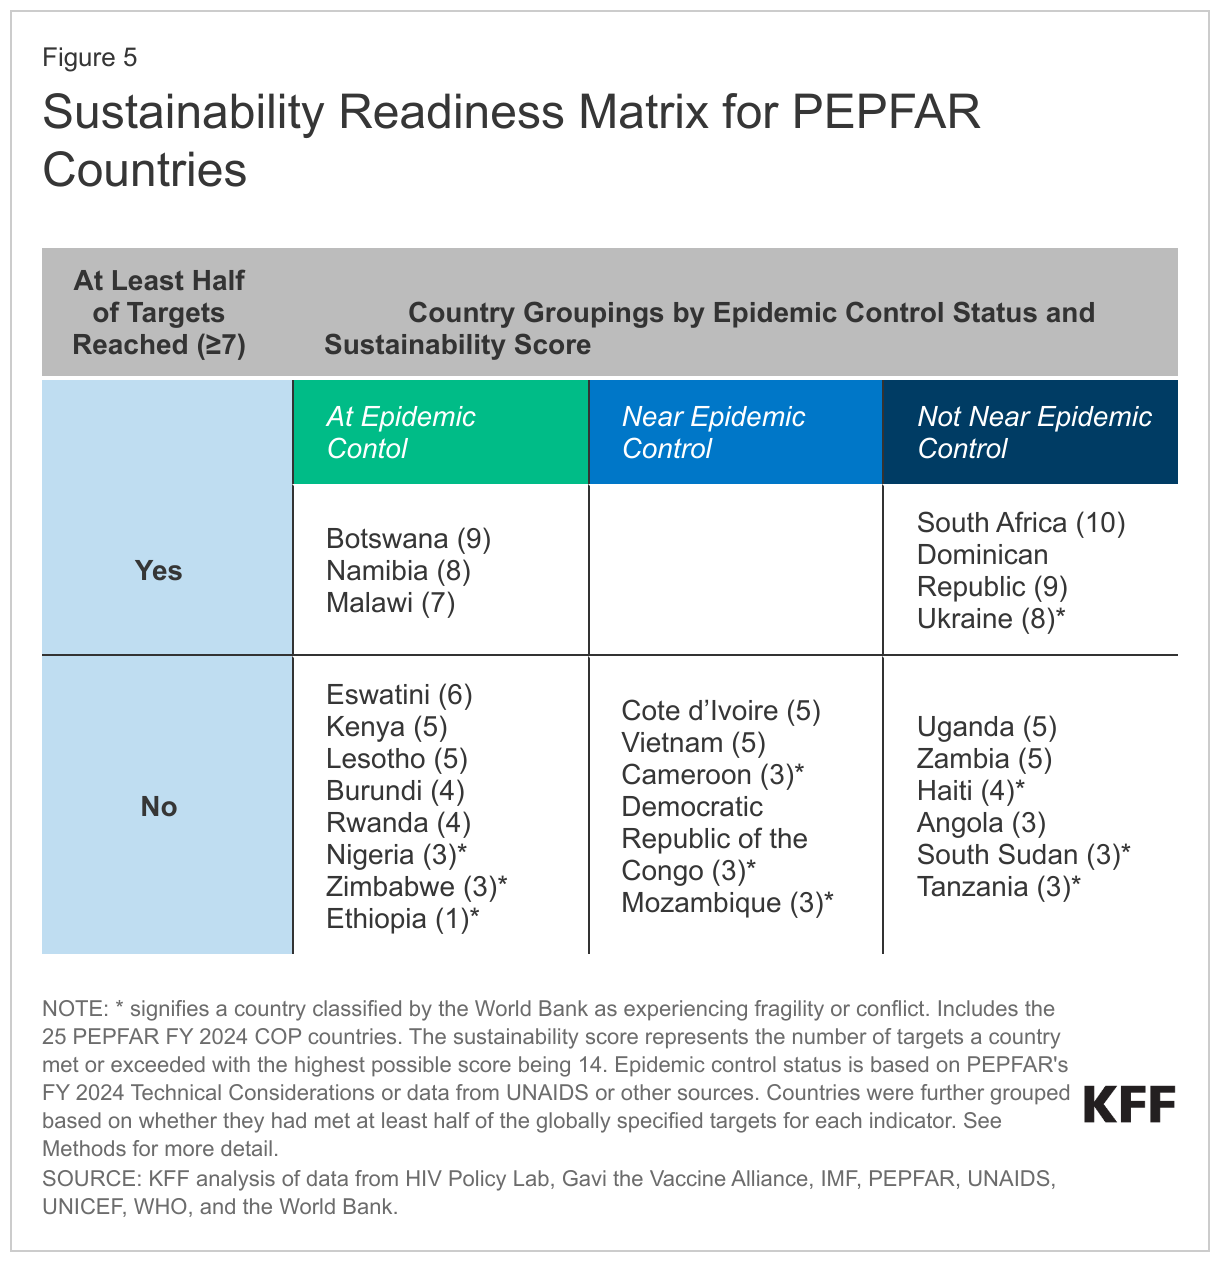
- Therefore, grouping countries by both epidemic control status and sustainability score may help point to potential pathways or emphases for future sustainability planning and strengthening, while maintaining a focus on HIV. Countries that have achieved epidemic control and reached higher sustainability thresholds (those that are in the top left of the sustainability readiness matrix) are likely best placed to take on more of their HIV response, while those that are not yet near epidemic control and have not reached higher sustainability thresholds (the bottom right of the matrix) are least prepared (see Figure 5). Specifically, three countries – Botswana, Malawi, and Namibia – have not only achieved epidemic control but have some of the highest sustainability scores. This suggests that the focus of PEPFAR’s effort in these countries, as well as the timeline for achieving greater sustainability, could be substantially different than in countries that have high scores but are not near epidemic control (e.g., South Africa), those that are at epidemic control but have low sustainability scores (e.g., Ethiopia, Nigeria, and Zimbabwe), and finally, those that are not near epidemic control and have low sustainability scores (e.g., Angola, South Sudan, and Tanzania).
This analysis, designed to help inform discussions about sustainability of the HIV response in PEPFAR countries, presents one framework for assessing countries by their sustainability readiness. A key takeaway is that traditional measures of sustainability, such as those that assess financial independence or the strength of the basic health system, are not necessarily indicative of HIV epidemic control status. This underscores the delicate nature of sustainability efforts, which alone may not secure success in combatting HIV. Therefore, grouping countries across both dimensions – sustainability scores and HIV epidemic control status – may help to identify potential pathways for future sustainability planning while maintaining a focus on HIV.
Jen Kates, Kellie Moss, Stephanie Oum, and Anna Rouw are with KFF. Allyala Nandakumar is with Brandeis University.
Appendix


Methods
Countries Included
We limited our analysis to the 25 PEPFAR countries that are required to prepare Country Operational Plans (COPs) in 2023. We grouped these countries by epidemic control status, as defined by PEFPAR. For four countries where epidemic control status was not defined by PEPFAR (the Dominican Republic, Mozambique, Ukraine, and Vietnam), we determined their group using PEPFAR’s definition (see Box 1) and by relying on data from UNAIDS’ AIDSinfo, PEPFAR’s Sustainability Index and Dashboard (SID), and the Population-Based HIV Impact Assessment (PHIA) from Columbia University; we used the latest year of data available.10 Lastly, we identified PEPFAR countries that are considered fragile or conflict-affected using the World Bank’s FY 2023 Fragile and Conflict-Affected Situations (FCS) List.
Indicators and Targets
We selected 14 indicators across four broad indicator areas to analyze each PEPFAR country’s level of “sustainability readiness”. The four areas include:
- Commitment to HIV - indicators on the status of policies and laws that either enable or hamper the HIV response;
- Basic Health System - indicators, like immunization rates and share of births attended by skilled health personnel, that shed light on the general strength or weakness of a country's health system;
- Economic - indicators that point to country economic growth or vulnerability broadly, as well as financial independence of HIV programs from donor support; and
- Commitment to Health - indicators of financial commitment to health by country governments, such as how much of a government’s budget is spent on health.
In order to measure sustainability readiness, we assessed whether a country had met or exceeded the globally set target for each indicator, where such targets were available. In two cases – Central Government Debt and GNI Per Capita – we used an alternate approach. For Central Government Debt, we used the COP country average as the target. For GNI Per Capita, we used the World Bank income classification cutoff for upper-middle-income economies for FY 2023 as the target.
Sustainability Scoring
Each country was scored according to how many global targets it had met or exceeded for the 14 indicators (one point for each target met), with the sum resulting in a total country score (14 was the highest possible total score for any given country). Instances of missing data were counted as not having met the target for that indicator. To group and array countries by sustainability readiness, we used a “Majority Target Score” approach where we grouped countries by epidemic control status and whether or not they had a score of at least 7 (a majority of indicators).
| Definitions & Sources | ||||
| Indicator Area | Indicator Name | Indicator Description and Source | Global Target | Global Target Description and Source |
| Commitment to HIV | Care and Treatment Policies | HIV policy alignment score for policies on HIV treatment and related health services. Source: HIV Policy Lab, using 2021 data. Accessed February 23, 2023. https://www.hivpolicylab.org/data. | ≥ 60% | According to the HIV Policy Lab, countries that have policy adoption scores greater than or equal to 60% are considered to have “many” or “most” of the recommended policies adopted. Source: HIV Policy Lab, https://www.hivpolicylab.org/compare. |
| Commitment to HIV | Health Systems Policies | HIV policy alignment score for policies on financing and management of the health system. Source: HIV Policy Lab, using 2021 data. Accessed February 23, 2023. https://www.hivpolicylab.org/data | ≥ 60% | According to the HIV Policy Lab, countries that have policy adoption scores greater than or equal to 60% are considered to have “many” or “most” of the recommended policies adopted. Source: HIV Policy Lab, https://www.hivpolicylab.org/compare. |
| Commitment to HIV | Structural Policies | HIV policy alignment score for policies on political and social drivers of HIV, including criminalization, gender, and human rights issues. Source: HIV Policy Lab, using 2021 data. Accessed February 23, 2023. https://www.hivpolicylab.org/data | ≥ 60% | According to the HIV Policy Lab, countries that have policy adoption scores greater than or equal to 60% are considered to have “many” or “most” of the recommended policies adopted. Source: HIV Policy Lab, https://www.hivpolicylab.org/compare. |
| Commitment to HIV | Testing and Prevention Policies | HIV policy alignment score for policies on biomedical and socio-behavioral HIV prevention and testing. Source: HIV Policy Lab, using 2021 data. Accessed February 23, 2023. https://www.hivpolicylab.org/data | ≥ 60% | According to the HIV Policy Lab, countries that have policy adoption scores greater than or equal to 60% are considered to have “many” or “most” of the recommended policies adopted. Source: HIV Policy Lab, https://www.hivpolicylab.org/compare. |
| Basic Health System | ANC4 | Percentage of women aged 15-49 attended by any provider (antenatal care or ANC) at least four times during pregnancy. Source: UNICEF global database of antenatal care based on MICS, DHS, and other nationally representative household survey data, using 2022 data. Accessed February 23, 2023. https://data.unicef.org/topic/maternal-health/antenatal-care/#data. | ≥ 90% | In 2021, the World Health Organization (WHO) and United Nations Population Fund (UNFPA) launched five coverage targets, for achievement by 2025, to help countries track progress toward the Sustainable Development Goals (SDGs) and to reduce preventable maternal deaths. One of those targets was 90% of pregnant women attending four or more ANC visits. Source: World Health Organization, “New global targets to prevent maternal deaths,” https://www.who.int/news/item/05-10-2021-new-global-targets-to-prevent-maternal-deaths. |
| Basic Health System | Skilled Birth Attendance | Percentage of births attended by skilled health personnel. Source: WHO Global Health Observatory, using 2013-2021 data. Accessed March 13, 2023. https://www.who.int/data/gho/data/indicators/indicator-details/GHO/births-attended-by-skilled-health-personnel-(-). | ≥ 90% | In 2021, WHO and UNFPA launched five coverage targets, for achievement by 2025, to help countries track progress toward the SDGs and to reduce preventable maternal deaths. One of those targets was 90% of births to be attended by skilled health personnel. Source: World Health Organization, “New global targets to prevent maternal deaths,” https://www.who.int/news/item/05-10-2021-new-global-targets-to-prevent-maternal-deaths. |
| Basic Health System | Pneumonia Care-seeking | Percentage of children under 5 with suspected pneumonia taken to an appropriate health facility or provider. Source: WHO Global Health Observatory, using 2000-2021 data. Accessed March 13, 2023. https://www.who.int/data/maternal-newborn-child-adolescent-ageing/indicator-explorer-new/mca/proportion-of-children-under-5-years-with-acute-respiratory-infection-taken-to-a-health-facility. | ≥ 90% | In 2013, WHO and the United Nations Children’s Fund (UNICEF) launched the integrated Global Action Plan for Prevention and Control of Pneumonia and Diarrhea (GAPPD) to develop targets to reduce mortality related to pneumonia and diarrhea, for achievement by 2025. One of those targets was 90% access to appropriate pneumonia care and diarrhea case management. Source: World Health Organization, The Integrated Global Action Plan for Prevention and Control of Pneumonia and Diarrhea (GAPPD), https://www.who.int/publications/i/item/the-integrated-global-action-plan-for-prevention-and-control-of-pneumonia-and-diarrhoea-(gappd). |
| Basic Health System | Immunization Rate | Immunization rate, calculated as the simple average of the 2021 diphtheria-tetanus-pertussis (DPT3) coverage rate and the 2021 measles (MCV) coverage rate. Immunization rates calculated according to the Millennium Challenge Corporation methodology for estimating immunization coverage. Source: KFF analysis of UNICEF immunization data, using 2021 data. Accessed February 21, 2023. https://data.unicef.org/topic/child-health/immunization/. | ≥ 90% | As part of the Immunization Agenda 2030, one of the targets is 90% global coverage for selected essential vaccines, including DTP3 and MCV, to be achieved by 2030. Source: Immunization Agenda 2030, https://scorecard.immunizationagenda2030.org/ig3.1. |
| Basic Health System | Service Coverage Index | Coverage of essential health services as an index on a scale of 0 to 100 which is computed as the geometric mean of the 14 tracer indicators of health coverage. Source: WHO Global Health Observatory, using 2019 data. Accessed March 13, 2023. https://www.who.int/data/gho/data/indicators/indicator-details/GHO/uhc-index-of-service-coverage. | ≥ 60 | According to the World Bank, countries with Service Coverage Index scores above 60 are considered as having “high” service coverage. Source: The World Bank, “Universal Health Coverage as a Sustainable Development Goal,” https://datatopics.worldbank.org/world-development-indicators/stories/universal-health-coverage-as-a-sustainable-development-goal.html. |
| Economic | Donor Share of HIV Funding | Share of domestic HIV funding contributed by donor governments and other donors, such as the Global Fund to Fight AIDS, TB and Malaria. Source: PEPFAR, PEPFAR 2022 Country and Regional Operational Plan (COP/ROP) Guidance for all PEPFAR-Supported Countries, Jan. 2022; KFF special data request fulfilled by Office of the Global AIDS Coordinator (OGAC), May 6, 2022. | ≤ 65% | Based on Gavi, the Vaccine Alliance’s (Gavi) co-financing policies in which countries reach an ‘accelerated transition phase’ after meeting certain GNI per capita requirements and co-financing at least 35% of its vaccine costs. The target used, therefore, is the remaining donor share (less than 65%) when at least 35% of costs are financed by the country. Source: Gavi, “Co-financing policy,” https://www.gavi.org/programmes-impact/programmatic-policies/co-financing-policy. |
| Economic | Central Government Debt | Total stock of debt liabilities issued by the central government as a share of gross domestic product (GDP). Source: International Monetary Fund (IMF), using 2021 data. Accessed March 13, 2023. https://www.imf.org/external/datamapper/CG_DEBT_GDP@GDD/SWE. | ≤ 60%* | Average value of PEPFAR COP country’s central government debt data due to unavailability of widely accepted global standard. Average was 60%. Source: KFF data analysis. |
| Economic | GNI Per Capita | Estimated gross national income (GNI) per capita. Source: World Bank, using 2021 data. Accessed March 1, 2023. https://data.worldbank.org/indicator/NY.GNP.PCAP.CD. | ≥ $4,256* | Using the World Bank’s FY 2023 Country and Lending Groups, $4,256 is the cut-off value for GNI per capita for upper-middle income countries. Source: World Bank, “World Bank Country and Lending Groups,” https://datahelpdesk.worldbank.org/knowledgebase/articles/906519-world-bank-country-and-lending-groups. |
| Commitment to Health | Out-of-Pocket Spending | Household out-of-pocket expenditure as a percentage of total current health expenditure. Source: WHO Global Health Observatory, using 2020 data. Accessed March 13, 2023. https://www.who.int/data/gho/data/indicators/indicator-details/GHO/out-of-pocket-expenditure-as-percentage-of-current-health-expenditure-(che)-(-). | ≤ 25% | As part of the SDGs, households spending 25% or more of household expenditure on health are considered as having ‘catastrophic health spending.’ Source: World Health Organization, “Global monitoring report on financial protection in health 2021,” https://www.who.int/publications/i/item/9789240040953. |
| Commitment to Health | Health as Share of Domestic Government Budget | Domestic general government health spending as a percentage of general government expenditures. Source: WHO Global Health Observatory, using 2020 data. Accessed March 13, 2023. https://www.who.int/data/gho/data/indicators/indicator-details/GHO/domestic-general-government-health-expenditure-(gghe-d)-as-percentage-of-general-government-expenditure-(gge). | ≥ 15% | As part of the Abuja Declaration, adopted in 2001 by the African Union, countries pledged to dedicate at least 15% of domestic government budgets to the health sector. Source: World Health Organization, “The Abuja Declaration: Ten Years On,” https://apps.who.int/iris/bitstream/handle/10665/341162/WHO-HSS-HSF-2010.01-eng.pdf?sequence=1. |
Endnotes
- PEPFAR 2023 Country and Regional Operational Plan (COP/ROP) Guidance for all PEPFAR-Supported Countries. ↩︎
- See, for example: Cohen JM, Smith DL, Cotter C. et al., “Malaria resurgence: a systematic review and assessment of its causes”, Malaria Journal, 11(122), 2012; Greenwood B, Zongo I, Dicko A, Chandramohan D, Snow RW, Ockenhouse C, “Resurgent and delayed malaria”, Malaria Journal, 21(1), 2022; Institute of Medicine, Ending Neglect: The Elimination of Tuberculosis in the United States, 2000; WHO, Global Tuberculosis Report, 2022; WHO World Malaria Report, 2022. ↩︎
- In most cases, the targets used for benchmark scoring are globally set standards; however, there were a few exceptions. See Methods for more details about these. ↩︎
- Most countries are identified by PEPFAR as belonging to a specific epidemic control status grouping, but four were not; we categorized these countries into epidemic control groups using PEPFAR’s definition/metrics approach. See Methods for more details. ↩︎
- Incidence-to-mortality (IMR) are defined as the ratio of new HIV infections to the total number of deaths from all causes among people living with HIV. As part of PEPFAR’s efforts to help countries reach epidemic control, the target for this value is at or below 1. For more information on countries’ progress in reaching this target, see the KFF dashboard Progress Toward Global HIV Targets in PEPFAR Countries. ↩︎
- The global viral load suppression target is defined as at least 73% of people living with HIV having suppressed viral loads. This target is part of the UNAIDS 90-90-90 targets which had a target date of 2020. For more information on countries’ progress in reaching this target, and the updated 95-95-95 targets, see the KFF dashboard Progress Toward Global HIV Targets in PEPFAR Countries. ↩︎
- Countries that have a stabilized HIV/AIDS epidemic, as shown by a trend of decreasing IMR, and have reached a VLS of 73% or higher among all people living with HIV, per the PEPFAR 2023 COP Guidance/FY 2024 Technical Considerations. ↩︎
- Countries that have a stabilized HIV/AIDS epidemic, as shown by a trend of decreasing IMR, but have not yet reached a VLS of at least 73% among all people living with HIV, per the PEPFAR 2023 COP Guidance/FY 2024 Technical Considerations. ↩︎
- Countries that show a trend of increasing or flat IMR and have not yet achieved a VLS of at least 73% among all people living with HIV, per the PEPFAR 2023 COP Guidance/FY 2024 Technical Considerations. ↩︎
- For the Dominican Republic, Ukraine, and Vietnam, we relied on UNAIDS data for incidence-to-mortality ratio (IMR) and viral load suppression (VLS) among people living with HIV estimates using the latest year of data available (2021). For Mozambique, we relied on PEPFAR’s 2021 SID for Mozambique for an IMR estimate and Mozambique’s PHIA for an estimate of VLS among people living with HIV. Mozambique and Vietnam were categorized as “Near Epidemic Control” due to decreasing IMR trends, but viral load suppression rates below the global target of 73%. The Dominican Republic and Ukraine were categorized as “Not Near Epidemic Control” due to increasing IMR trends and viral load suppression rates below the global target of 73%. ↩︎