KFF COVID-19 Vaccine Monitor: January 2022 Parents And Kids Update
Findings
The KFF COVID-19 Vaccine Monitor is an ongoing research project tracking the public’s attitudes and experiences with COVID-19 vaccinations. Using a combination of surveys and qualitative research, this project tracks the dynamic nature of public opinion as vaccine development and distribution unfold, including vaccine confidence and acceptance, information needs, trusted messengers and messages, as well as the public’s experiences with vaccination.
Key Findings
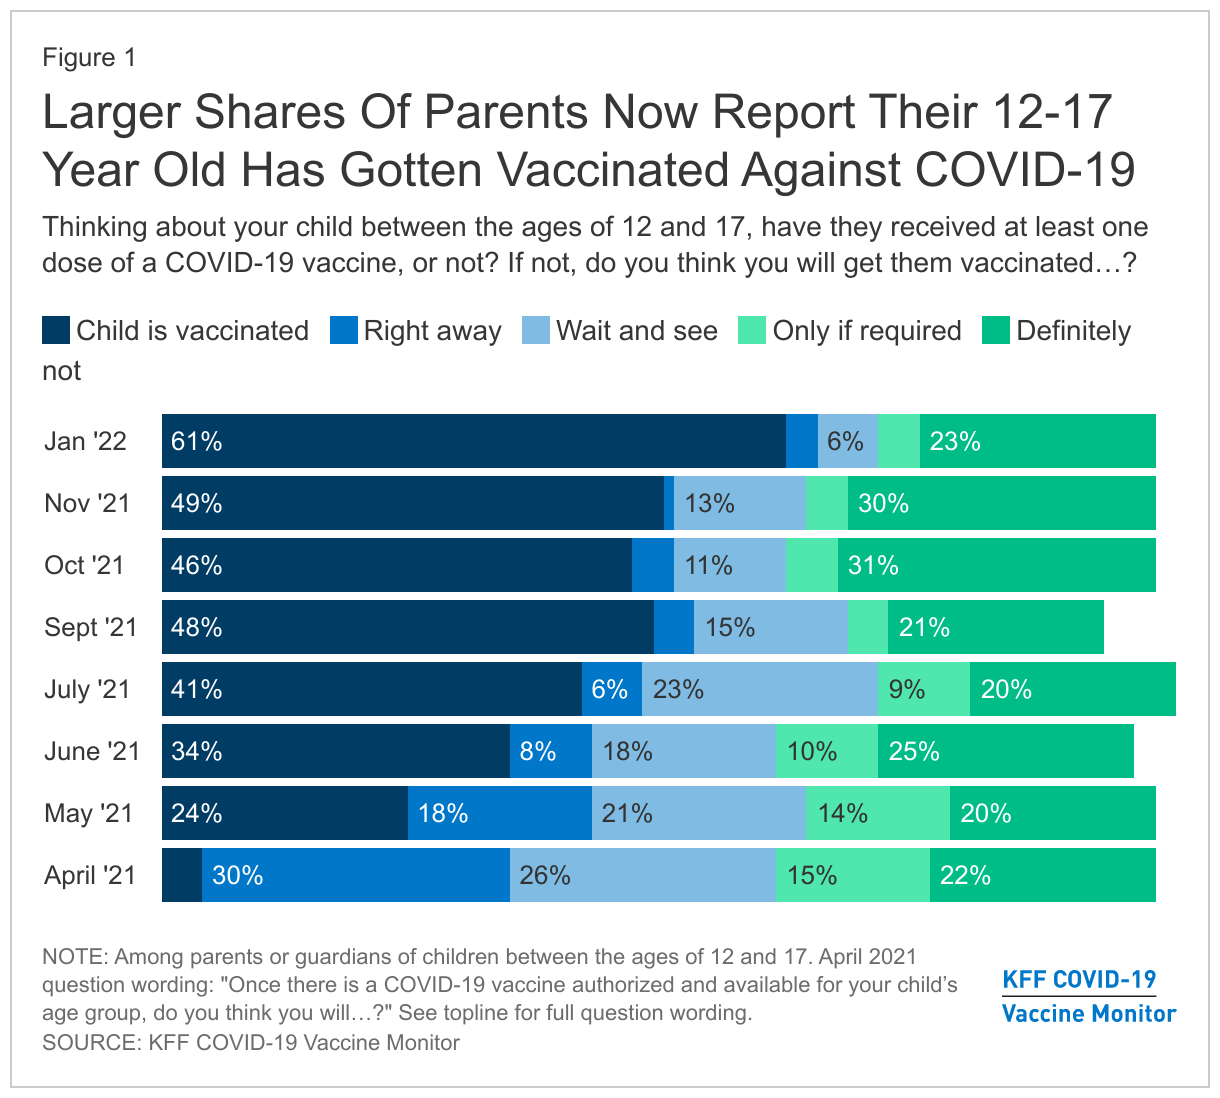
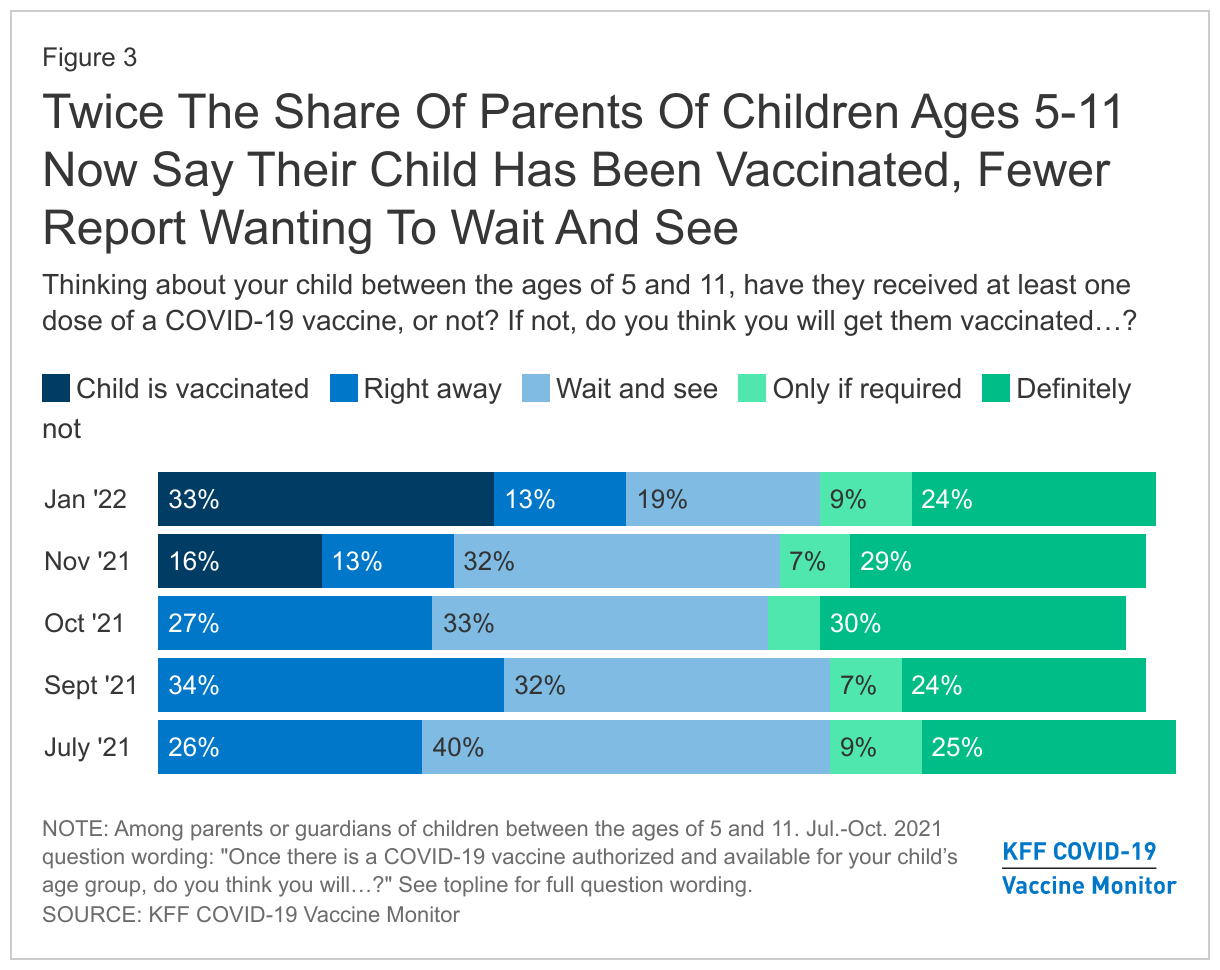
- In the midst of the latest surge of the omicron COVID-19 variant, the share of parents who say their child has gotten at least one shot of a COVID-19 vaccine increased between November and January. Six in ten parents of 12-17 year-olds now say their child has received at least one shot (61%, up from 49% in November), as do one-third of parents of 5-11 year-olds (33%, up from 16% in November). Three in ten parents of children under 5 say they’ll get their child vaccinated right away once a vaccine is approved for their age group, up somewhat from one in five in July.
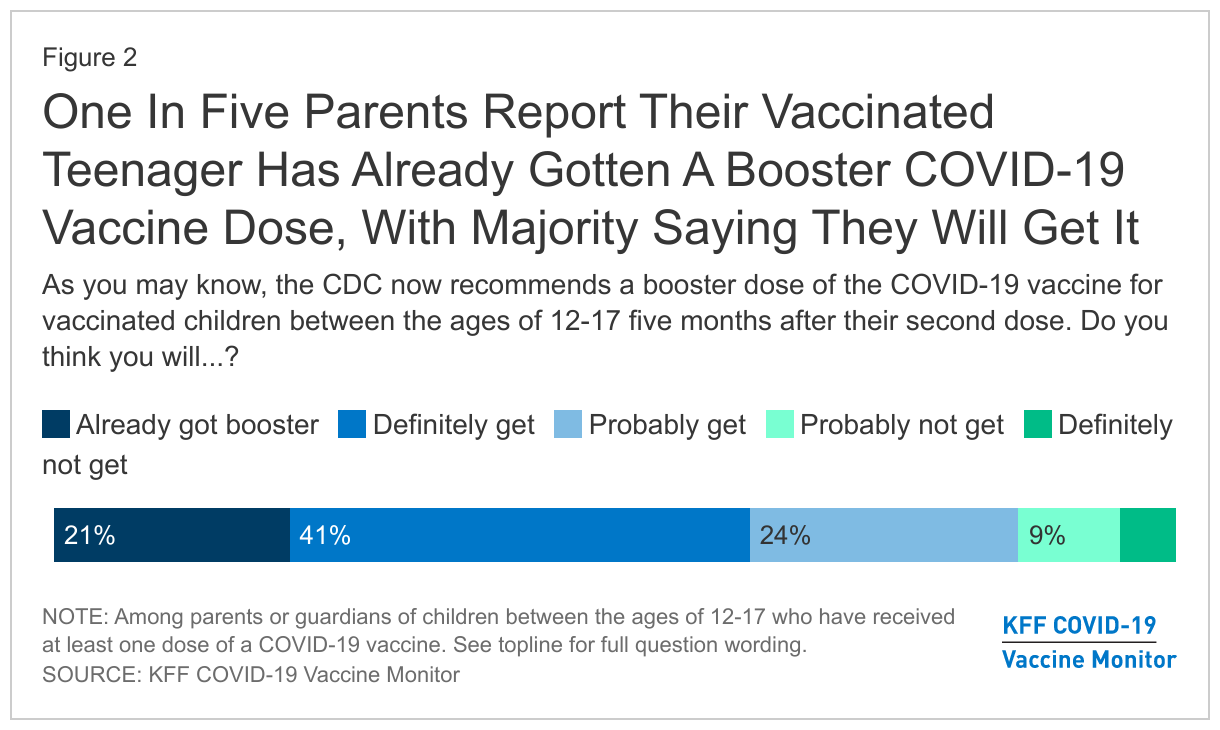
- One in five (21%) parents of vaccinated teens say their child has already received a COVID-19 booster, and around two-thirds (65%) say they will “definitely” or “probably get” one. Just one in seven parents of vaccinated 12-17 year-olds say their teen “probably” or “definitely won’t” get the booster (14%).
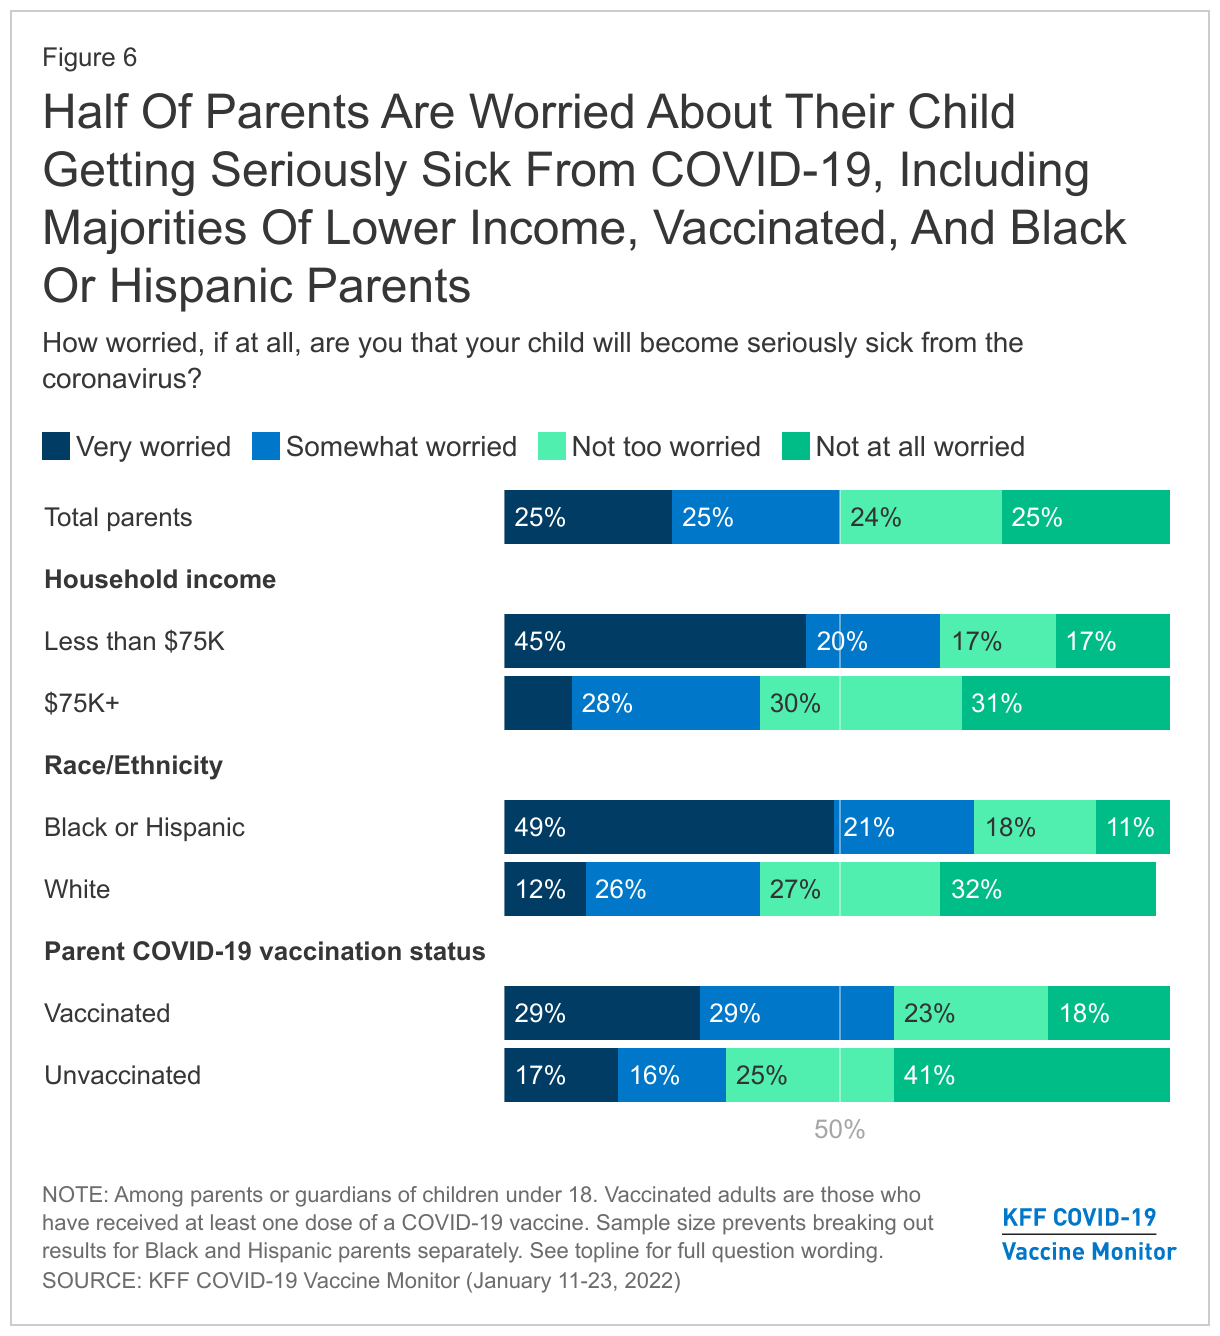
- Half of parents report being worried about their child becoming seriously sick from the coronavirus, including substantially higher shares among parents who are Black or Hispanic and those with lower incomes.
- Four in ten parents of school-age children report some type of disruption to their child’s in-person learning in the first month of the year, including needing to quarantine, schools shutting down in-person classes, or parents choosing to keep children home due to safety concerns. Most (63%) say their child’s school did not provide access to COVID-19 testing before returning to classes in January.
Parents’ Intentions Regarding COVID-19 Vaccines For Children
The latest KFF COVID-19 Vaccine Monitor reports an uptick this month in the share of parents who says their child is or will be vaccinated for COVID-19, across child age groups.
After holding fairly steady for several months, the share of parents who say their 12-17 year-old has gotten at least one shot of a COVID-19 vaccine increased, from 49% in November to 61% in January. At the same time, the share of parents who say they want to “wait and see” before getting their teen vaccinated fell to a new low of 6%. One-quarter (23%) of parents still say they will “definitely not” get their 12-17 year-old vaccinated for COVID-19, while a further 4% say they will only get their teen vaccinated if they are required to do so for school.
The CDC recently expanded eligibility of COVID-19 Pfizer-BioNTech booster doses to those ages 12-17, and 21% of parents of vaccinated 12-17 year-olds report their teenager has already received the booster shot. Around two-thirds of parents say their vaccinated teenager will “definitely” or “probably get” their booster shot (65%), with a much small number saying they “probably” or “definitely won’t” get the booster (14%).
COVID-19 vaccine uptake also appears to have increased for younger children over the past two months, though remaining much lower than among teens. One-third of parents of 5-11 year-olds now say their child is vaccinated (33%), double the share of parents who said so in November (16%). The biggest change comes in the share who say they will “wait and see” before getting their child vaccinated, decreasing from 32% in November to 19% now. Another 13% say they’ll get their 5-11 year-old vaccinated right away, while 24% will “definitely not” get them vaccinated, and 9% will only do it if required.
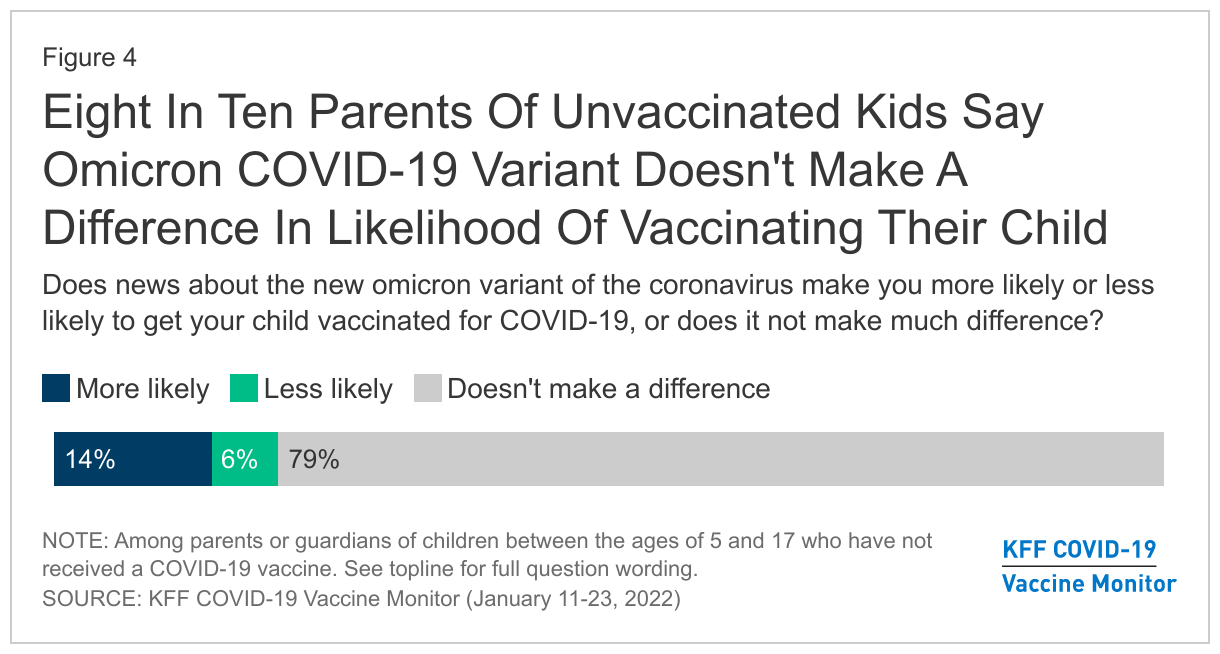
Despite many parents being worried about their child getting sick from COVID-19, 79% of parents of unvaccinated children ages 5-17 say news of the Omicron variant doesn’t make a difference in the likelihood that they’ll get their child vaccinated. Around one in seven (14%) parents of unvaccinated kids say the news makes them “more likely” to get their child vaccinated and 6% say it makes them “less likely.”
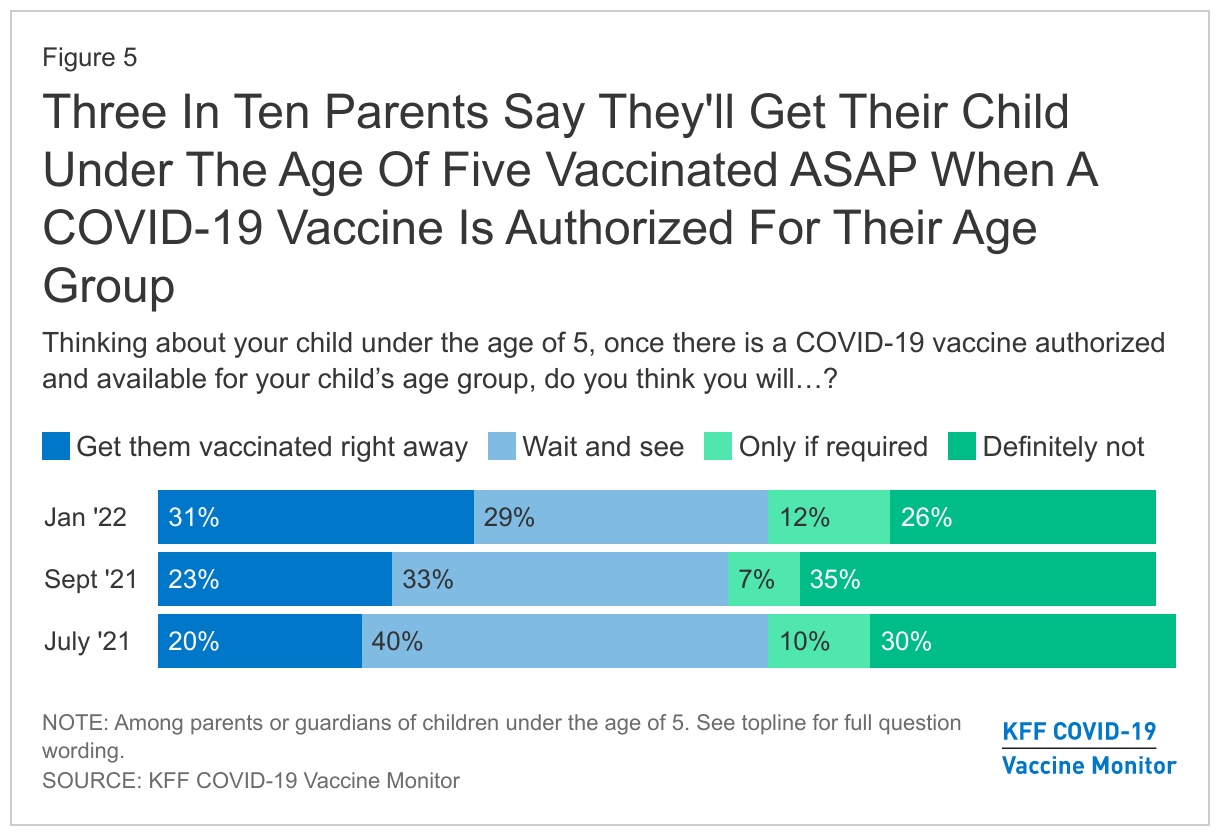
While there is not yet a COVID-19 vaccine authorized for use in children under the age of five, 31% of parents of children in this age range say they’ll get their child vaccinated right away when a vaccine is authorized, up from 20% last July. Another 29% say they will “wait and see” before getting their child under 5 vaccinated, down from 40% in July. Around one in ten parents say they’ll vaccinate their child under five “only if required” (12%), while a quarter (26%) say they will “definitely not” vaccinate their young child.
Parents’ Concerns And Experiences As Children Returned To School
With children going back to school in January, many after travel and holiday gatherings amid the omicron surge, many parents report concerns about illness, exposures, and shutdowns.
Half of parents report being worried that their child will become seriously sick from the coronavirus, with 25% saying they are “very worried.” Despite the omicron surge, this level of worry is similar to the level of worry parents reported in October (when 24% said they were very worried and 21% somewhat worried). Significantly more parents who have a household income of less than $75,000 a year are worried about serious illness (65%) than those who earn $75,000 or more (37%). Similarly, parents who are Hispanic or Black are more likely than White parents to say they are worried about their child getting seriously ill (70% vs. 39%). Echoing differing level of personal worries among adults by vaccination status, 57% of vaccinated parents are worried about their kid becoming seriously sick, compared to 32% of unvaccinated parents.
Many parents of school-aged children say their child has experienced some disruption in their schooling during January, including having to quarantine, having the school shut down or move to online learning, or parents choosing to keep their child home due to COVID-19 concerns.
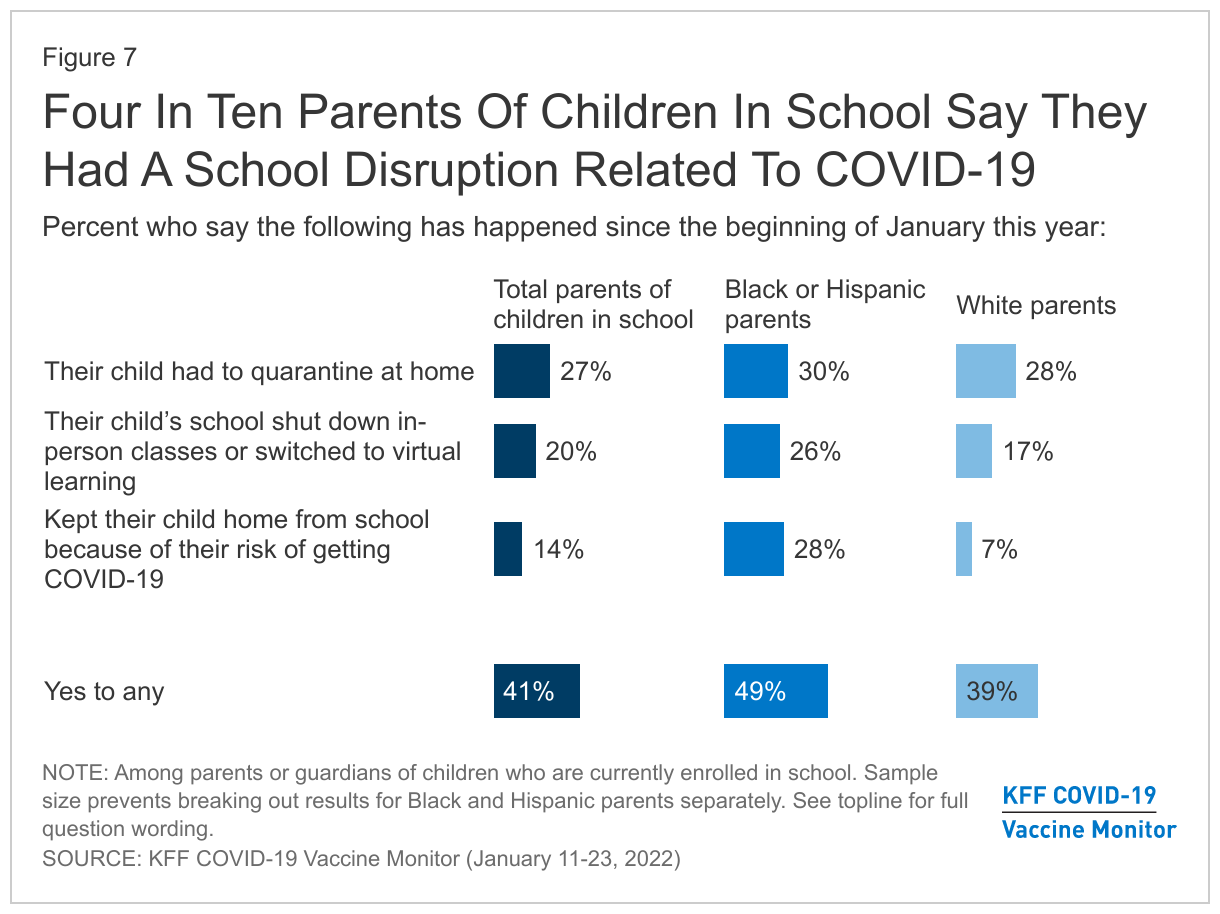
Since returning to school in January, a quarter of parents (27%) report that their child has had to quarantine at home because they tested positive or were exposed to someone who tested positive for COVID-19. Another one in five say their child’s school shut down in-person classes or switched to virtual learning because of COVID-19, and 14% say they’ve kept their child home from school because they were worried about their risk of getting COVID-19. Overall, 41% of parents say at least one of these disruptions has happened in January.
Notably, four times the share of parents who are Black or Hispanic (28%) say they’ve kept a child home from school because of concerns about their COVID-19 risk, compared to 7% of White parents.
With many adults across the U.S. reporting difficulty finding tests over the past month, access to COVID-19 testing is also an issue for parents and children. Notably, 39% of parents of school-age children say they tried to purchase an at-home test kit in the past month compared to 24% of adults without children. Around two-thirds of parents who tried to purchase an at-home testing kit had difficulty doing so (64%).
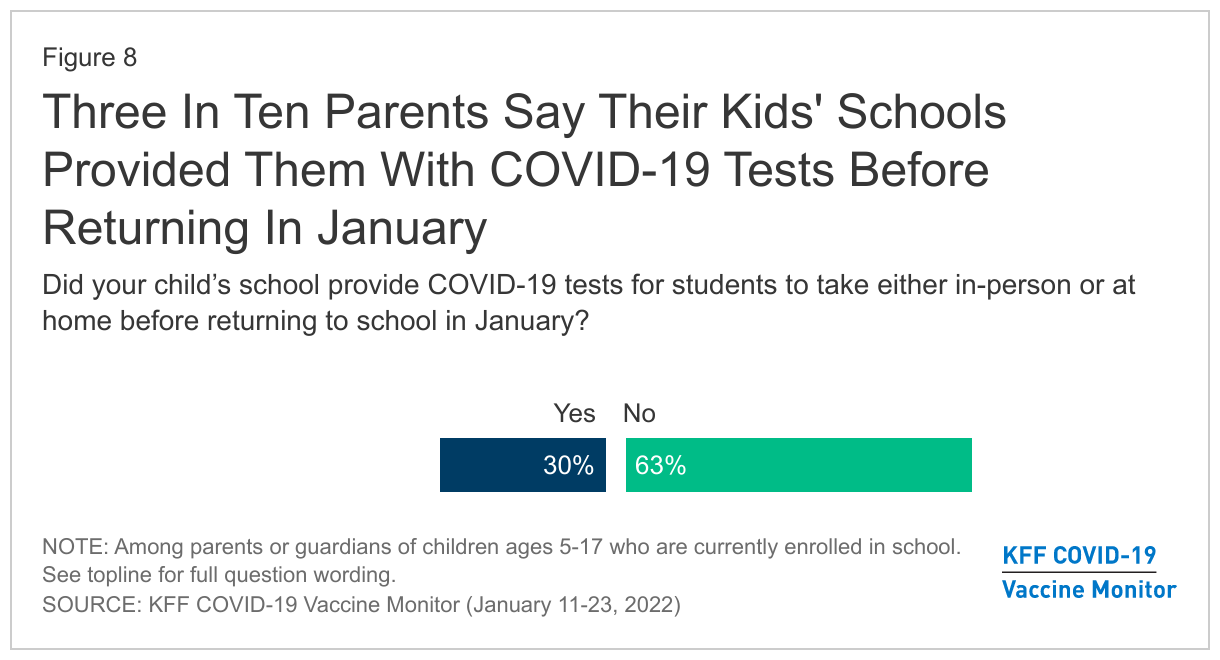
While three in ten parents of children who attend school say their child’s school provided access to in-person or at-home testing before returning to school in January, the majority (63%) say the school did not provide either before returning to school in January.
Methodology
This KFF COVID-19 Vaccine Monitor was designed and analyzed by public opinion researchers at the Kaiser Family Foundation (KFF). The survey was conducted January 11-23, 2022, among a nationally representative random digit dial telephone sample of 1,536 adults ages 18 and older (including interviews from 327 Hispanic adults and 303 non-Hispanic Black adults), living in the United States, including Alaska and Hawaii (note: persons without a telephone could not be included in the random selection process). Phone numbers used for this study were randomly generated from cell phone and landline sampling frames, with an overlapping frame design, and disproportionate stratification aimed at reaching Hispanic and non-Hispanic Black respondents as well as those living in areas with high rates of COVID-19 vaccine hesitancy. Stratification was based on incidence of the race/ethnicity subgroups and vaccine hesitancy within each frame. High hesitancy was defined as living in the top 25% of counties as far as the share of the population not intending to get vaccinated based on the U.S. Census Bureau’s Household Pulse Survey. The sample also included 98 respondents reached by calling back respondents that had previously completed an interview on the KFF Tracking poll six months ago or more. Another 82 interviews were completed with respondents who had previously completed an interview on the SSRS Omnibus poll (and other RDD polls) and identified as Hispanic (n=33; including 12 in Spanish) or non-Hispanic Black (n=49). Computer-assisted telephone interviews conducted by landline (165) and cell phone (1,371; including 1,070 who had no landline telephone) were carried out in English and Spanish by SSRS of Glen Mills, PA. To efficiently obtain a sample of lower-income and non-White respondents, the sample also included an oversample of prepaid (pay-as-you-go) telephone numbers (25% of the cell phone sample consisted of prepaid numbers) Both the random digit dial landline and cell phone samples were provided by Marketing Systems Group (MSG). For the landline sample, respondents were selected by asking for the youngest adult male or female currently at home based on a random rotation. If no one of that gender was available, interviewers asked to speak with the youngest adult of the opposite gender. For the cell phone sample, interviews were conducted with the adult who answered the phone. KFF paid for all costs associated with the survey.
The combined landline and cell phone sample was weighted to balance the sample demographics to match estimates for the national population using data from the March 2021 U.S. Current Population Survey (CPS) on sex, age, education, race, Hispanic origin, region, and marital status, within race-groups, along with data from the 2010 Census on population density. The sample was also weighted to match current patterns of telephone use using data from the January-June 2021 National Health Interview Survey. The sample is also weighted to account for the possibility of partisan nonresponse based on three months of KFF national polls and this current survey. The weight takes into account the fact that respondents with both a landline and cell phone have a higher probability of selection in the combined sample and also adjusts for the household size for the landline sample, and design modifications, namely, the oversampling of potentially undocumented respondents and of prepaid cell phone numbers, as well as the likelihood of non-response for the recontacted sample. All statistical tests of significance account for the effect of weighting.
The margin of sampling error including the design effect for the full sample is plus or minus 3 percentage points. Numbers of respondents and margins of sampling error for key subgroups are shown in the table below. For results based on other subgroups, the margin of sampling error may be higher. Sample sizes and margins of sampling error for other subgroups are available by request. Sampling error is only one of many potential sources of error and there may be other unmeasured error in this or any other public opinion poll. Kaiser Family Foundation public opinion and survey research is a charter member of the Transparency Initiative of the American Association for Public Opinion Research.
This work was supported in part by grants from the Chan Zuckerberg Initiative DAF (an advised fund of Silicon Valley Community Foundation), the Ford Foundation, and the Molina Family Foundation. We value our funders. KFF maintains full editorial control over all of its policy analysis, polling, and journalism activities.
| Group | N (unweighted) | M.O.S.E. |
| Total Parents | 420 | ± 6 percentage points |
| Child Age Groups | ||
| Has child/children ages 12-17 | 232 | ± 8 percentage points |
| Has child/children ages 5-11 | 212 | ± 9 percentage points |
| Has child/children under the age of 5 | 162 | ± 10 percentage points |