Medicare

New & Noteworthy

Data Visualization

The Facts About Medicare Spending

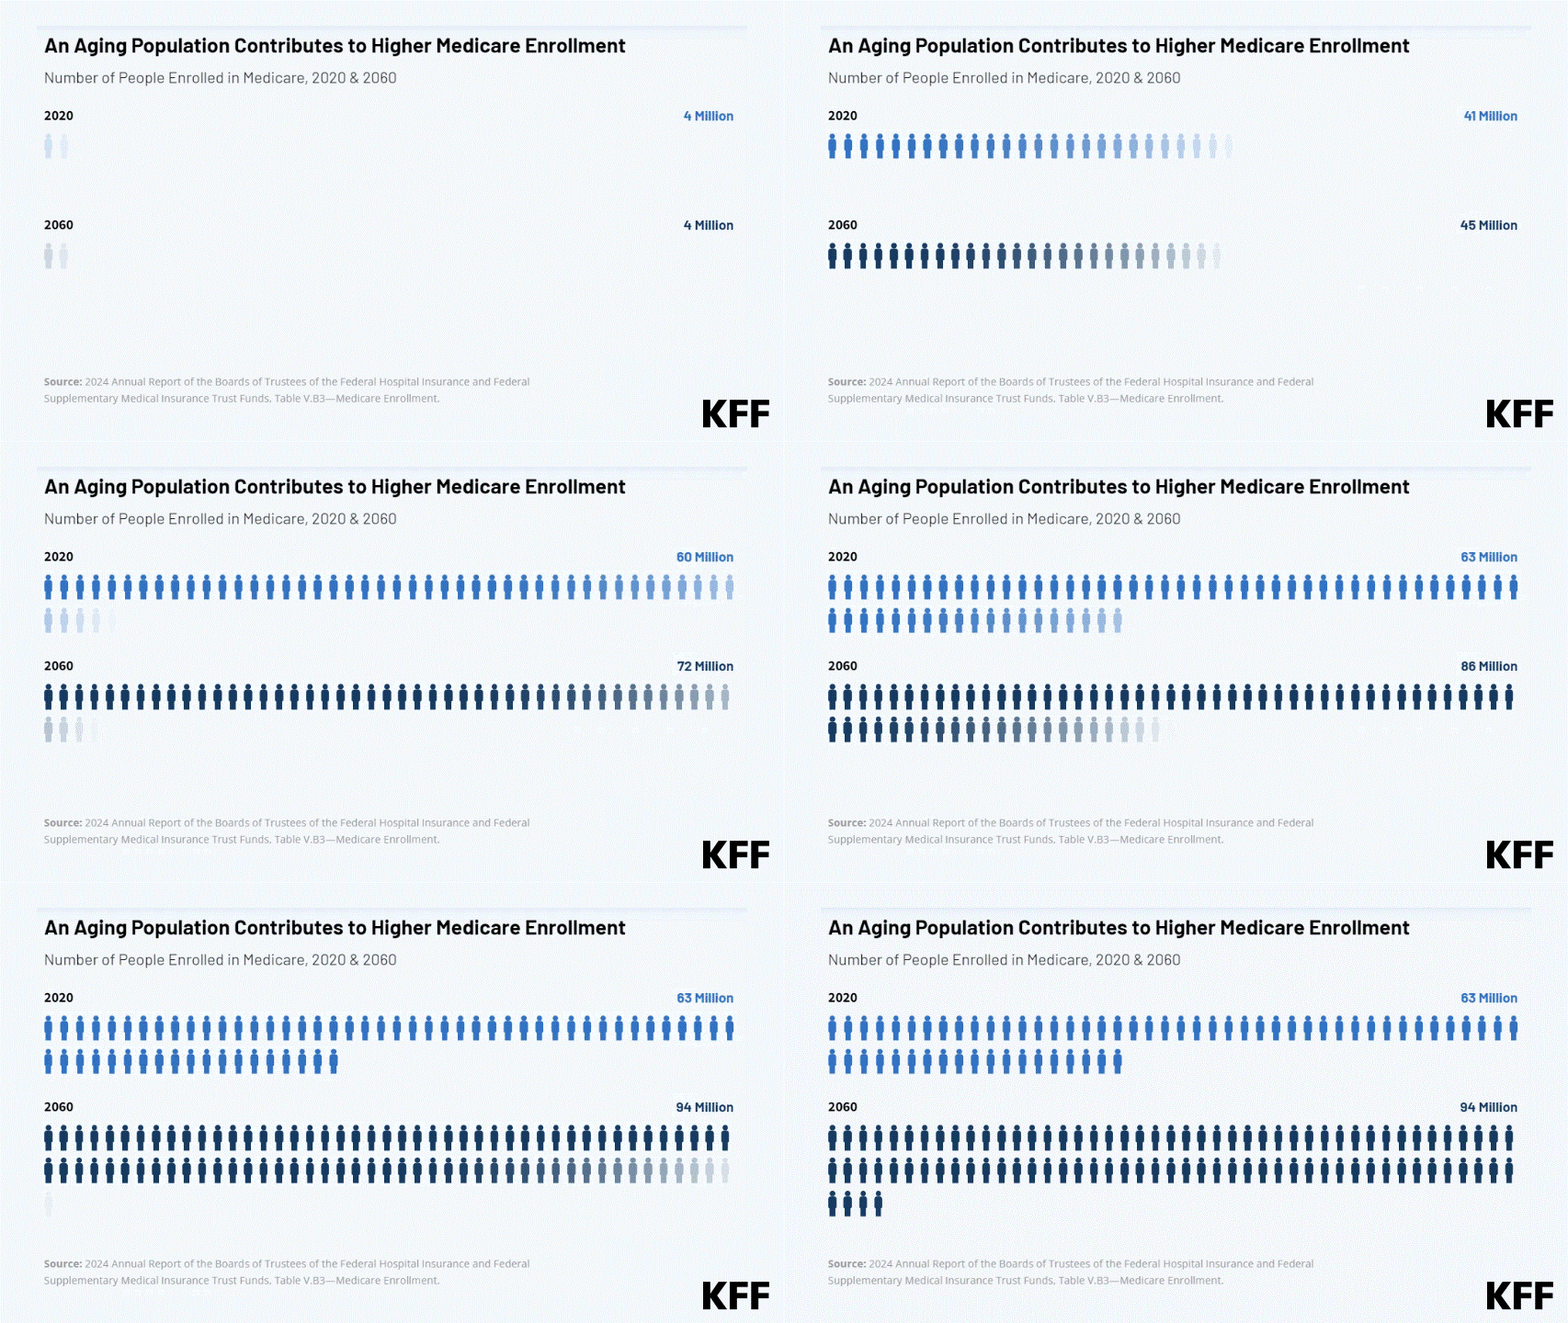
This interactive provides the facts on Medicare spending. Medicare, which serves 67 million people and accounts for 12 percent of the federal budget and 21 percent of national health spending, is often the focus of discussions about health expenditures, health care affordability and the sustainability of federal health programs.

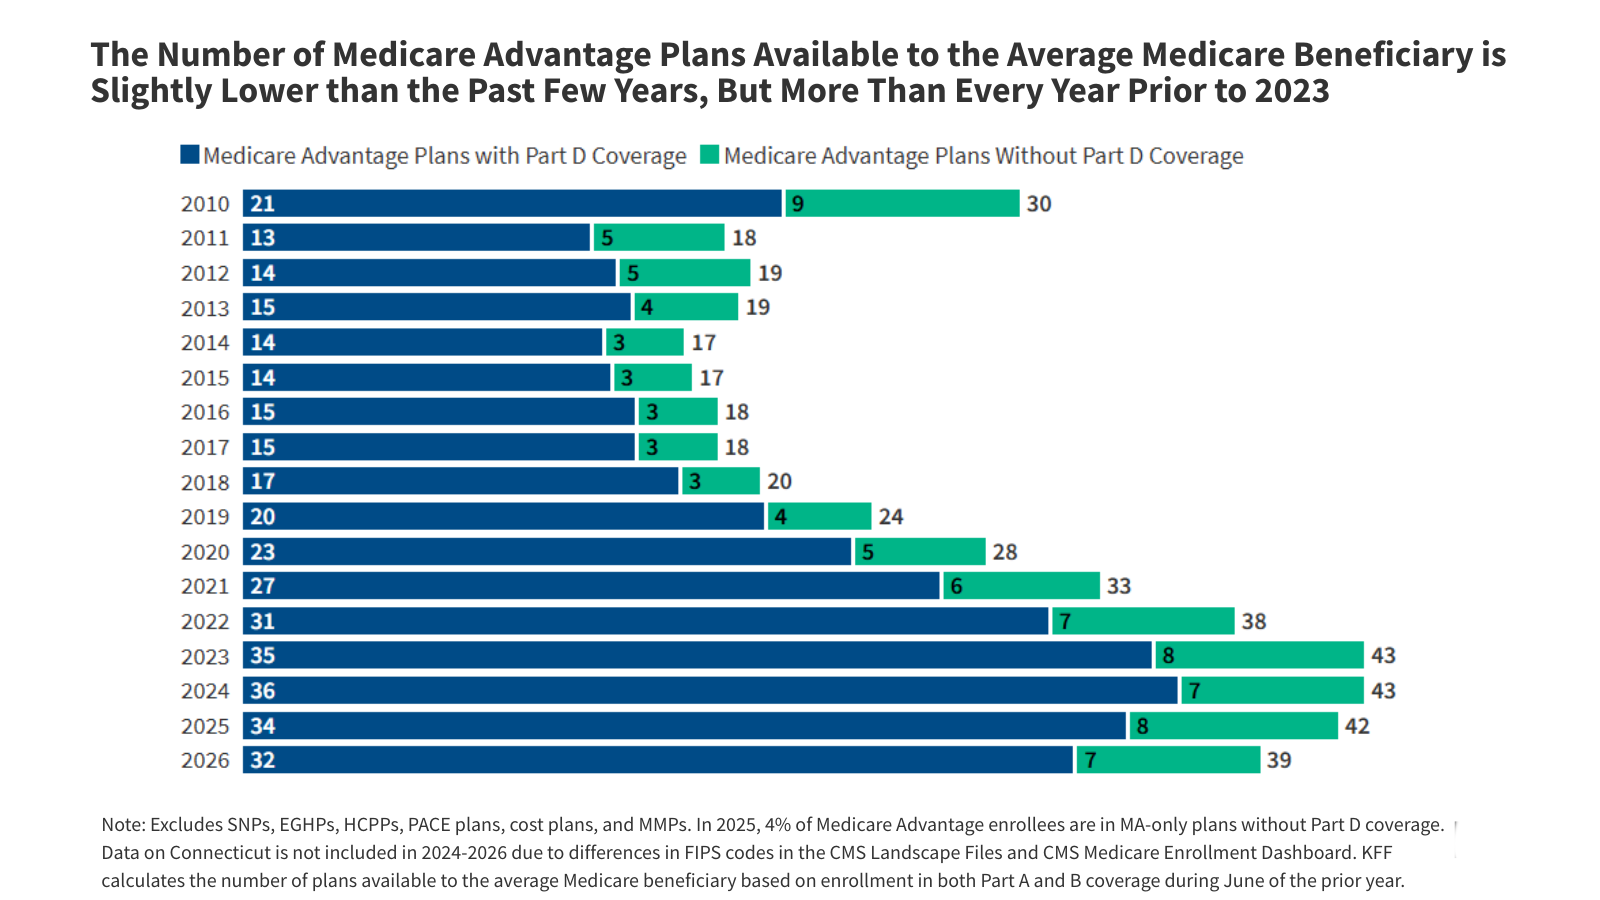
Explore data on enrollment growth, Medicare spending trends overall and per person, growth in Medicare spending relative to private insurance, spending on benefits and Medicare Advantage, Part A trust fund solvency challenges, and growth in out-of-pocket spending by beneficiaries.

Related: FAQs on Medicare Financing and Trust Fund Solvency

Read More

Subscribe to KFF Emails

Choose which emails are best for you.
Sign up here

Filter

271 - 280 of 1,568 Results

  • Snapshot of Where Hillary Clinton and Donald Trump Stand on Seven Health Care Issues

    Issue Brief

    Where do the 2016 Presidential candidates, Hillary Clinton and Donald Trump, stand on key health care issues? This snapshot outlines the candidates' positions and policy statements on issues such as health insurance, the ACA, Medicaid, Medicare, the opioid epidemic, prescription drug costs, women's reproductive health, and Zika.

  • How Much Has Medicare Spent on the EpiPen Since 2007?

    Issue Brief

    This data note examines the effects of rising EpiPen prices on Medicare and beneficiaries. We analyze EpiPen spending, in the aggregate and per user, in Medicare Part D between 2007 (the year after the Part D drug benefit took effect, and the year Mylan acquired the product) and 2014 (the most recent year of data available).

  • Medicare Advantage Plan Switching: Exception or Norm?

    Issue Brief

    The Medicare open enrollment period allows enrollees to compare plans, stick with their current plan, switch to another plan, or shift to traditional Medicare. This analysis examines the extent to which Medicare Advantage enrollees change plans when given the opportunity. It also analyzes the variation in the rate of plan switching by enrollee and plan characteristics and whether people who voluntarily switch plans tend to move to plans with lower premiums, lower out-of-pocket limits, or higher quality ratings.

  • The Gap in Medigap

    Perspective

    This policy insight examines the low rate of Medigap coverage among people under age 65 with disabilities on Medicare and the federal law that governs consumer rights and protections related to Medigap open enrollment.

  • Medicare Part D in 2016 and Trends over Time

    Report

    This chartpack presents a summary of Part D enrollment, premiums, cost sharing, benefit design and other key trends in 2016 and changes over time. For 2016, the analysis finds that 40% of Part D enrollees are now in Medicare Advantage drug plans, and over half of all enrollees are in plans offered by just three firms. The chartpack also highlights some concerning trends in the Low-Income Subsidy market, with the fewest number of premium-free plans available since Part D started, and 1.5 million LIS enrollees paying premiums for coverage, even though they have premium-free options available.

  • Medicare’s Role for People Under Age 65 with Disabilities

    Issue Brief

    This issue brief examines the role of Medicare for people under age 65 with disabilities, including how this group qualifies for Medicare, the characteristics of people under age 65 with disabilities compared to those age 65 or older, and how sources of supplemental coverage and prescription drug coverage, spending and use of services, and access to care differ for Medicare beneficiaries under age 65 with disabilities and older beneficiaries.