Year Two of the ACA Coverage Expansions: On-the-Ground Experiences from Five States
Executive Summary
As of Spring 2015, states had completed the second open enrollment period for the new Health Insurance Marketplaces established by the Affordable Care Act (ACA) and most of the 30 states that have adopted the Medicaid expansion to low-income adults were well into their second year of implementation. Two years into implementation, interest remains high in understanding enrollment under the coverage expansions and the extent to which enrollment problems that plagued the initial open enrollment period have been resolved. A range of other questions also have emerged, including how Marketplaces are evolving and impacting consumer choices, the extent to which State-based Marketplaces (SBMs) have achieved financial stability, whether newly insured individuals are accessing care, and what the costs of care have been for Medicaid expansion adults. This brief provides insight into these questions through an on-the-ground view of ACA implementation in five states that identifies areas of progress as well as issues to be addressed. It is based on 40 in-person interviews conducted with a range of stakeholders during April and May 2015 in three states (Colorado, Kentucky, and Washington) that have a SBM and adopted the Medicaid expansion and two states (Utah and Virginia) that rely on the Federally-facilitated Marketplace (FFM) for enrollment of individuals into qualified health plans (QHPs) and have not adopted the Medicaid expansion to date.
Key findings from stakeholders in the study states are highlighted on Table 1. In sum, they show that, as of the second year, most major enrollment systems issues had been resolved. The states that expanded Medicaid continued to experience enrollment growth, and Marketplace enrollment goals were met or surpassed in four of the five states, although affordability remains a key enrollment challenge. In all five states, broad efforts are underway to increase health insurance and health care literacy among newly insured individuals. Per enrollee costs of care for expansion enrollees have been lower than anticipated in the three states that expanded Medicaid. Expansion enrollees generally are able to access needed care, although there are access challenges for some services. Access to care for individuals enrolled in QHPs varies based on their choice of plan.
Looking ahead, the states are focused on a range of priorities, including continued improvements to enrollment systems and efforts to enhance access to care and care coordination. Moreover, in Colorado and Washington, there is significant pressure on the Marketplaces to achieve financial sustainability; in Utah and Virginia, debate around the Medicaid expansion and the outcome of the King v. Burwell Supreme Court case remain the most significant issues; and, in Kentucky, the upcoming gubernatorial election could have significant implications for implementation given the opposition to the ACA among potential candidates.
| Table 1: Key Findings on the Second Year of ACA Implementation from Stakeholders in Five States:Colorado, Kentucky, Utah, Virginia, and Washington | |
| Enrollment |
|
| Marketplace Plans and Premiums |
|
| Outreach |
|
| Access, Utilization, and Costs |
|
| Priorities Looking Ahead |
|
Introduction
Introduction
As of Spring 2015, states had completed the second open enrollment period for the new Health Insurance Marketplaces established by the ACA and most of the 30 states that have adopted the Medicaid expansion to low-income adults were well into their second year of implementation, with a few implementing the expansion more recently. With the experience of two open enrollment periods under their belt, states can provide key lessons learned about outreach and enrollment experiences under the ACA. Moreover, with new coverage options now in place for over two years, state experiences can offer early insights into how health care access and utilization is changing as a growing number of people have gained coverage.
This brief provides an on-the-ground view of ACA implementation after completion of the second open enrollment period. It is based on 40 in-person interviews conducted in five states that have made different implementation choices, including three states (Colorado, Kentucky, and Washington) that have developed a SBM and adopted the Medicaid expansion and two states (Utah and Virginia) that rely on the FFM for enrollment of individuals into QHPs and that have not adopted the Medicaid expansion to date. The interviews were conducted by the Kaiser Family Foundation’s Commission on Medicaid and the Uninsured and Perry Undem Research/Communication with a range of stakeholders in each state, including Medicaid and Marketplace officials, consumer advocates, assisters, and hospital and community health center (CHC) representatives, during April and May 2015.
This work builds on previous analysis that examined states’ preparation for implementation prior to the beginning of the initial ACA open enrollment period in October 2013 and a subsequent report that identified key lessons learned from four states leading enrollment efforts at the completion of that first open enrollment period. Together, this body of work provides an in-depth, local level understanding of ACA implementation from multiple perspectives, tracking and documenting experiences and providing key lessons learned to help shape efforts moving forward.
The report presents key findings related to enrollment systems; enrollment and renewal; outreach, marketing, and enrollment assistance; and access to and utilization of care. It concludes with key priorities identified by stakeholders looking head.
Background
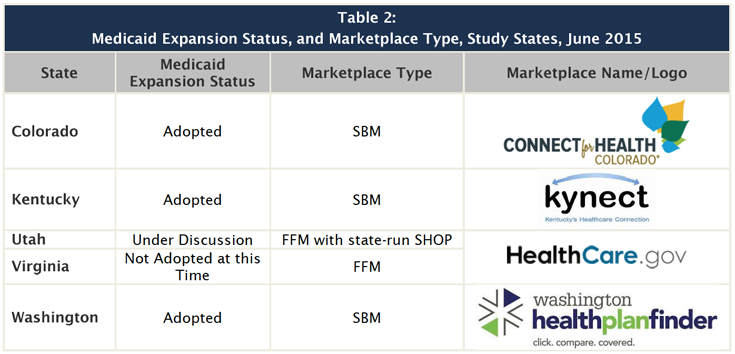
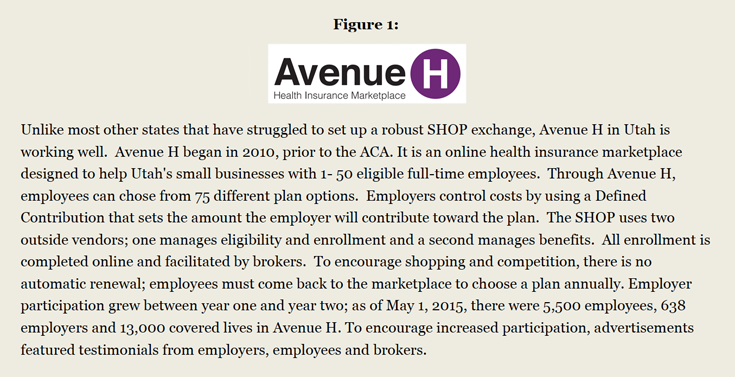
The study states included in this report represent a mix of implementation approaches (Table 2). The ACA expanded health coverage through two key vehicles, new Health Insurance Marketplaces offering QHPs, which provide premium tax credit subsidies to offset the cost of coverage for moderate income adults, and a Medicaid expansion to low-income adults with incomes up to 138% of the federal poverty level. However, the 2012 Supreme Court ruling on the constitutionality of the ACA effectively made the Medicaid expansion optional for states. States have implemented the ACA in varied ways, with some establishing SBMs and others relying on the FFM or a partnership model. For the second open enrollment period, 17 states including the District of Columbia operated a SBM, though three of these states (New Mexico, Nevada, and Oregon) used the federal healthcare.gov website for enrollment; 7 states operated a Partnership Marketplace; and 27 states relied on the FFM. As of June 2015, 30 states, including DC, have adopted the Medicaid expansion, while the remaining 21 states have not, although debate continues in several states. Among the study states, Colorado, Kentucky, and Washington each established their own SBMs and have adopted the Medicaid expansion. Utah and Virginia rely on the FFM, healthcare.gov, to enroll individuals into QHPs, although Utah has its own state-operated Small Business Health Options (SHOP) Marketplace, Avenue H (See Figure 1). Neither state has adopted the Medicaid expansion to date, although there has been ongoing debate about the expansion in both states. Governors in both states put forward proposals for expansion but faced legislative opposition. Virginia’s legislative session concluded without adoption of the expansion, although the Governor continues to support it; Utah’s session concluded with the creation of a committee to continue work this summer followed by a possible special session.
Issue Brief
Key Findings
Enrollment Systems
All three of the SBM study states had single integrated Medicaid/Marketplace enrollment systems during the second open enrollment period, while the two FFM states coordinate enrollment between healthcare.gov and their state Medicaid enrollment systems. The three SBM study states (Colorado, Kentucky, and Washington) each rely on their own state-based enrollment systems for enrollment into Marketplace QHPs and MAGI-based Medicaid. Kentucky and Washington each have had a fully integrated Marketplace and Medicaid system since the initial open enrollment period. Colorado moved from separate Marketplace and Medicaid systems to a single shared eligibility determination system just prior to the second open enrollment period to address challenges coordinating between two systems that it encountered during the first open enrollment period. Virginia and Utah both rely on the FFM to process enrollment in QHPs and maintain separate systems to process Medicaid eligibility determinations.
Many of the major enrollment system issues that affected the initial open enrollment period had been resolved by the beginning of the second open enrollment period. In Kentucky and Washington, stakeholders reported that the state-based enrollment systems functioned very smoothly during year two. Similarly, stakeholders in Virginia and Utah indicated that the FFM functioned significantly better during the second open enrollment period and that problems communicating between the FFM and state Medicaid systems that led to delays and backlogs of applications during the first open enrollment period were mitigated during the second year. However, stakeholders in Utah reported some remaining transfer issues during the early part of the second open enrollment period, and, in Virginia, there were reports of some remaining backlogs. Across these four states, stakeholders noted that more individuals were able to self-enroll because the systems were operating more smoothly, which freed up assistance resources to address more complex cases. In contrast to the other four study states, Colorado experienced system problems after transitioning to a new shared eligibility determination portal. Because building the shared portal took longer than anticipated, it was launched just prior to the second open enrollment period, limiting opportunities to test or train on it. Stakeholders commented that the system had a number of glitches, particularly related to calculating eligibility for advance premium tax credits.
The states continued to improve and refine their enrollment systems leading up to and throughout the second open enrollment period. In Kentucky, the state implemented several enhancements prior to the second open enrollment period. These enhancements included allowing consumers to see premium costs with the advance premium tax credits applied when shopping for plans. In addition, for people who qualify for cost-sharing reductions, the system now displays silver plans at the top of the plan list, given that these plans have the best value for these consumers by providing access to the cost-sharing reductions. In Washington, stakeholders noted continued improvements in real-time determinations for Medicaid, with many individuals now receiving a determination in as little as 15-20 minutes. Similarly, despite the system challenges in Colorado, stakeholders noted that there was a notable increase in the share of Medicaid applications that received real-time determinations, with nearly eight in ten now receiving a real-time decision. Virginia also made improvements to its Medicaid eligibility system to facilitate online enrollment by consumers and stakeholders indicated that there have been fewer delays in Medicaid enrollment during the second year.
Despite major improvements to systems, stakeholders identified a range of remaining issues to address as well as planned further enhancements for the future. For example, in Kentucky, stakeholders noted that there are some continued system problems affecting enrollment for immigrants and refugees and with consumers changing QHPs at renewal. State officials indicated data fixes are being completed in the short-term with a permanent solution to be implemented later this summer. Looking ahead, the state plans to further enhance the system by making improvements to SHOP and the enrollment dashboard available to insurance agents and kynector enrollment assisters. It also will launch a kynect tablet-based application for the individual (Medicaid and QHP) and small group markets. In Washington, while the system functioned smoothly in terms of determining eligibility for QHPs and tax credit subsidies, notable problems were encountered with processing premium payments for QHPs. Unlike most other states, the Washington Healthplanfinder collects premiums from consumers, called premium aggregation, rather than consumers paying their health plans directly. Given the challenges experienced with this process, the Healthplanfinder plans to move away from premium aggregation prior to the next open enrollment period. With regard to Medicaid, the state has enhanced the system by integrating selection of a Medicaid managed care plan into the enrollment process. In Colorado, the Connect for Health Colorado board has allocated funding to address system glitches and improve technology processes. Officials noted that they will prioritize fixes to facilitate a smoother enrollment experience by the next open enrollment period but that improvements will continue beyond that time period.
Enrollment and Renewal
Medicaid
Table 3 below presents Medicaid and CHIP enrollment data reported by the Centers for Medicare and Medicaid (CMS) as of March 2015. As seen in the data, the three study states that implemented the Medicaid expansion (Colorado, Kentucky, and Washington), experienced significantly greater enrollment growth relative to pre-ACA levels, compared to the two study states (Utah and Virginia) that did not expand. Moreover, reflecting that much of this growth was likely among newly eligible adults, children account for a smaller share of total enrollment in these expansion states. According to state-reported data from Kentucky, a total of 375,174 individuals enrolled in the Medicaid expansion by the end of 2014.1 Data from Washington show that 549,000 adults have enrolled in the Medicaid expansion as of May 2015.2
Stakeholders in the three study states that implemented the Medicaid expansion (Colorado, Kentucky, and Washington) noted continued growth in Medicaid enrollment during the second open enrollment period. Stakeholders in Kentucky and Colorado indicated that, although growth has continued, the pace has started to slow. It was noted that this likely is because they achieved such significant enrollment success during the first open enrollment period, leaving a smaller universe of eligible individuals to enroll. Stakeholders in Colorado further noted that Medicaid enrollment during the initial open enrollment period was concentrated among adults, but that, during the second year, they have seen an increase in the share of new enrollees who are children. In Kentucky, stakeholders indicated that they have seen some reductions in the number of people enrolling through disability-based and medically needy eligibility pathways, since individuals no longer have to be disabled or have medical expenses to qualify for coverage. In Washington, Medicaid enrollment continued at a fast pace, exceeding expectations. Stakeholders indicated that enrollment grew among both newly eligible adults and children, noting that the rate of growth in children’s enrollment was the highest it has been in the past five years.
| Table 3: Medicaid/CHIP Enrollment | ||||||
| US | Colorado | Kentucky | Utah | Virginia | Washington | |
| Total Enrollment | ||||||
| Pre-ACA Average Monthly Medicaid/CHIP Enrolment | 57,794,096 | 783,420 | 606,805 | 294,029 | 935,434 | 1,117,576 |
| Total Monthly Medicaid/CHIP enrollment as of March 2015 | 71,050,561 | 1,232,504 | 1,140,261 | 301,200 | 952,536 | 1,685,329 |
| Percent Change in Enrollment | 21% | 57% | 88% | 2% | 2% | 51% |
| Child Enrollment | ||||||
| Medicaid/CHIP Child Enrollment as of March 2015 | 29,401,734 | 586,939 | 489,540 | 211,629 | 645,829 | 781,303 |
| Child Enrollment as a % of Total Medicaid/CHIP Enrollment | 54% | 48% | 43% | 70% | 68% | 46% |
| SOURCE: Medicaid & CHIP Monthly Applications, Eligibility Determinations, and Enrollment Report: March 2015. Centers for Medicare and Medicaid Services. Medicaid and CHIP Application, Eligibility Determination and Enrollment Data. | ||||||
Utah and Virginia have not adopted the Medicaid expansion and stakeholders in both states reported very little change in Medicaid enrollment. Stakeholders in Utah said there have been some modest increases in Medicaid enrollment beyond regular program growth, largely as a result of more children enrolling in Medicaid as families apply through the Marketplace. In Virginia, stakeholders felt there has been no real change in Medicaid enrollment, which they attributed to the significantly limited eligibility levels for adults in the absence of the expansion.
The study states are in varied stages of implementing new streamlined Medicaid renewal processes established by the ACA. Washington has fully implemented the new processes, under which the state conducts electronic data matches and automatically renews individuals who are found still eligible based on the data match. It also has completed moving all MAGI-eligible cases from its old eligibility system to its new system. State officials noted that the new processes are working well and that its rates of automated renewals have exceeded expectations. The remaining four states are still in the process of transitioning to these processes. Currently, enrollees in these states are sent a letter and/or pre-populated form and requested to report any changes. In Colorado and Utah, individuals are automatically renewed if nothing has changed. In Virginia and Kentucky, individuals need to sign and return the form to continue coverage. Kentucky plans to move to an automated renewal process in July. Stakeholders in these states did not identify any major problems with renewal, although officials in Virginia said they remain delayed in processing some renewals. In addition, assisters in several of the states noted that some consumers had questions about renewal or needed help providing requested information to the state.
Marketplaces
There was variation across the study states in the level of changes they experienced in plan participation and premium costs within their Marketplaces between year one and year two. Reflecting the still evolving nature of the Marketplaces, Kentucky, Virginia, and Washington saw new insurers enter the market, while Colorado and Utah had high continuity in plan offerings. In addition, Marketplaces in Colorado, Kentucky, Utah, and Virginia experienced changes in the second lowest cost silver, or benchmark, plan. The benchmark plan determines how much assistance eligible consumers can receive in the form of premium tax credits. In Colorado, the change in the benchmark plan led to a reduction in the level of tax credit subsidies, which stakeholders indicated was very confusing for consumers. They reported that it was difficult to explain to individuals why the subsidy amounts changed and why their premium share may have increased even though overall premium costs decreased. In Virginia and Kentucky, low cost plans with large market shares adopted large premium increases for 2015, leaving consumers to either renew their current plan with a large premium increase or switch to a lower cost plan. In Washington, there were some additions of new plans and carriers to the Marketplace. Stakeholders noted that, because of the large number of plan choices, it will be important to improve the shopping experience for individuals to enable them to sort and filter plans by different criteria. Overall, premium amounts held fairly steady in the state with a small average increase.
Marketplace enrollment goals were met or surpassed in four of the five study states (Colorado, Kentucky, Utah and Virginia). Table 4 below presents Marketplace enrollment data based on data reported by the Office of the Assistant Secretary for Planning on Evaluation (ASPE). Stakeholders in Kentucky reported that QHP enrollment continued at a strong pace and the balance between QHP enrollment and Medicaid enrollment was evening out. In the first year, less than 20% of new enrollees were eligible for QHPs compared to over 80% who enrolled in Medicaid. In the second open enrollment period, the share of QHP enrollment had increased to 35%. Despite its challenges with launching a new eligibility system, Colorado achieved its QHP enrollment goals. Virginia surpassed its QHP enrollment goals, which stakeholders attributed to heightened state leadership under the new Governor and new state funding to support both a state-based outreach campaign and additional outreach workers. Stakeholders in Utah also viewed the second open enrollment period as a success, with a number indicating that it exceeded expectations.
In contrast, stakeholders in Washington were disappointed with overall Marketplace enrollment numbers, which fell below enrollment goals. Stakeholders indicated that several factors may have contributed to lower enrollment levels. First, the system problems with premium payments diminished consumer confidence in the Marketplace, which may have suppressed enrollment. It was noted that it remains unclear how many individuals who could potentially be brought into the Marketplace are currently purchasing coverage outside of the Marketplace. Secondly, a number of individuals did not make their first premium payment at renewal, which contributed to higher than anticipated disenrollments. Lastly, some stakeholders suggested that enrollment goals may have been overstated due to assumptions used to develop the projections. For example, it was noted that the projections assumed a 100% renewal rate, which was not realistic. In addition, officials pointed out that, because the Marketplace collects premium payments directly, its enrollment data reflect effectuated enrollment numbers (i.e., the number that have made a premium payment), which are lower than enrollment counts in other states that are based on the number of individuals that have selected a plan.
| Table 4: Marketplace Enrollment Data | |||||
| Colorado | Kentucky | Utah | Virginia | Washington | |
| Enrollment | |||||
| Total Marketplace enrollment | 122,976 | 92,372 | 128,220 | 335,033 | 159,124 |
| Marketplace enrollment as share of potential population | 22% | 35% | 34% | 40% | 32% |
| New vs. Re-enrolling Consumers | |||||
| Percent new consumers | 28% | 26% | 49% | 54% | 37% |
| Percent re-enrolled consumers | 72% | 73% | 51% | 46% | 63% |
| % of re-enrollees actively renewing | 47% | 53% | 47% | 56% | Not reported |
| % of re-enrollees auto renewing | 53% | 48% | 53% | 44% | Not reported |
| Financial Assistance | |||||
| Total Marketplace enrollees receiving financial assistance | 68,027 | 63,975 | 86,330 | 285,938 | 124,505 |
| Percent of individuals enrolled with financial assistance | 55% | 69% | 67% | 85% | 78% |
| Marketplace enrollees receiving financial assistance as share of subsidy-eligible population | 26% | 36% | 39% | 55% | 38% |
| SOURCE: March 31, 2015 Effectuated Enrollment Snapshot, Centers for Medicare and Medicaid Services and Kaiser analysis. Data on New vs. Re-enrolling Consumers reflect individuals who had selected or reenrolled in a 2015 plan but may not have paid the first month’s premium and are from Health Insurance Marketplaces 2015 Open Enrollment Period: March Enrollment Report. Office of the Assistant Secretary for Planning and Evaluation. | |||||
Many consumers successfully renewed their QHP coverage, with about half of re-enrollees shopping for new plans, but stakeholders also identified some challenges with renewal. While renewals generally went smoothly in Kentucky, stakeholders noted that some individuals had problems with the system freezing when they tried to select a new plan. As noted, Washington experienced significantly more disenrollments at renewal than anticipated. Stakeholders noted that, although many individuals were auto-renewed, a number did not pay their first premium and were disenrolled. Marketplace officials thought that this situation may have been exacerbated by their inability to continue premium auto-payments at renewal as well as potentially confusing notices from insurance carriers that told consumers they did not need to take any action. In Utah and Colorado, the drop in tax credit subsidy amounts as a result of the change in the benchmark plan created some confusion among individuals. In addition, some individuals in Utah shifted plans because the lowest cost plan has a very narrow provider network. Lastly, some stakeholders in Virginia noted that there were problems related to matching income to verify continued eligibility for some individuals. Across all five study states, stakeholders pointed to the need for improved consumer education and outreach about renewal, noting that individuals were confused about their need to renew and/or by notices they received from insurers or the Marketplace.
A number of stakeholders highlighted the importance of the tax-related Special Enrollment Period (SEP), particularly given the shorter enrollment period. The federal Marketplace and most SBMs provided a tax-related SEP to allow consumers who were subject to a penalty for not having insurance when they filed their 2014 taxes to enroll outside the normal open enrollment period. Stakeholders in Kentucky, Washington, and Utah noted that the tax penalties played a role in encouraging enrollment, indicating that a number of individuals enrolled during the SEP to avoid future penalties. However, Colorado did not provide a tax-related SEP, and several stakeholders indicated that some individuals were upset they could no longer enroll and that the state had not provided the SEP.
Coverage Transitions
Stakeholders did not identify significant issues related to coverage transitions between Medicaid and Marketplace coverage. In Colorado, although data were not available to measure coverage transitions, stakeholders reported that they had not encountered any major issues. They did indicate that more education is needed to encourage individuals to report life changes during the year and to inform individuals about the ability to enroll in Medicaid throughout the year. In Washington, state and Marketplace officials reported that movement between coverage types has been lower than anticipated, at less than 1% per month. Data show that more individuals move from QHPs to Medicaid than from Medicaid to QHPs. Stakeholders suggested this may be reflective of greater incentives for individuals to report decreases in income as well as the fact that individuals with income increases may gain employer-sponsored insurance rather than enrolling in a QHP. The data also show that there was a significant uptick in the number of coverage transitions during the open enrollment period when many individuals came up for renewal. Medicaid and Marketplace officials in Washington are planning to do a focused study of coverage transitions to better understand the changes. In Kentucky, officials reported that rates of churn in Medicaid (about 20,000-30,000 disenrolling per month) have not increased under the ACA; however, they plan further study of movement from Medicaid to Marketplace coverage. Kentucky sends quarterly reminders to encourage individuals to report changes in income and circumstances throughout the year. Stakeholders suggest that these reminders could lead to increased churn but also fewer issues with reconciliation. In Virginia and Utah, few individuals would likely transition between coverage types given the gap in coverage for adults without the Medicaid expansion.
Outreach, Marketing, and Enrollment Assistance
Consumer Awareness and Messaging
Stakeholders in all five study states indicated that there was greater awareness among consumers about the new ACA coverage options during the second open enrollment period. Some also noted there was greater awareness of the tax penalty for not having insurance. In addition, a number of stakeholders felt there was increased acceptance among some consumers that the new coverage options and requirements are going to remain in place, which contributed to a greater willingness to participate during year two among some individuals who may have been reluctant to enroll during the first year. Some stakeholders also felt that the coverage was less politicized because there was less media coverage. For example, in Utah, some stakeholders suggested that less national media attention allowed there to be some distance from negative feelings tied to “Obamacare,” which may have spurred enrollment. Stakeholders said that, because of the increased consumer awareness, they did not need to devote as much outreach and education to raising awareness and could instead focus on encouraging individuals to enroll and directing them to assistance resources. However, at the same time, stakeholders felt that the reduced media attention at the national, state, and local levels limited that avenue as an information source for individuals.
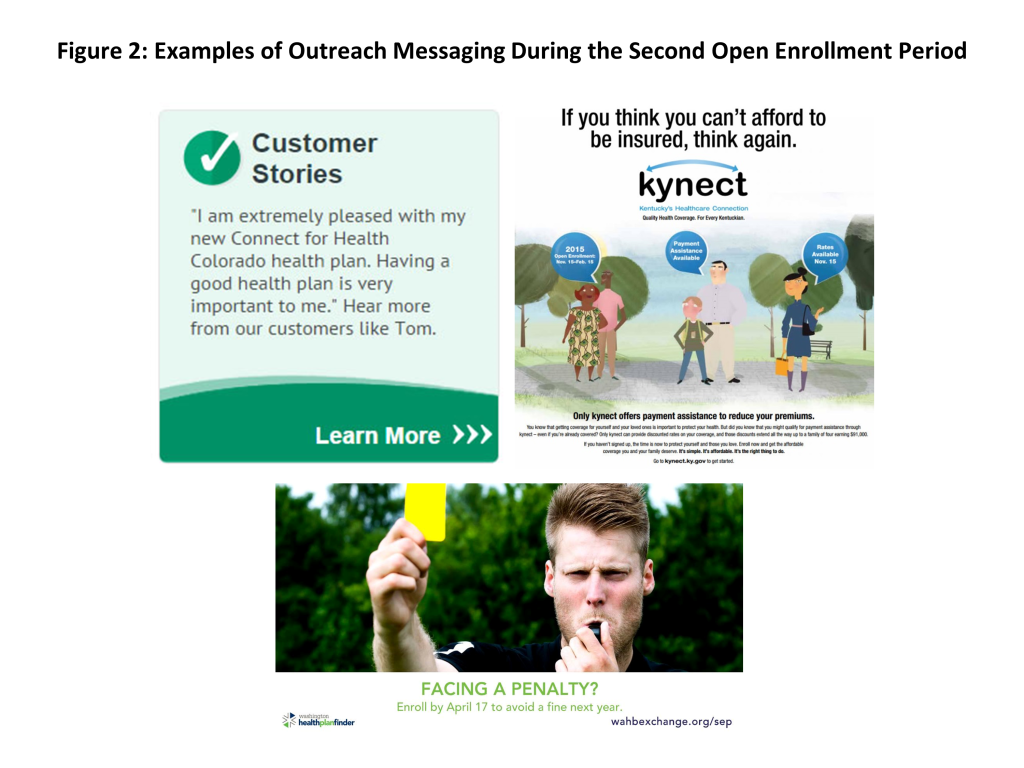
In year two, outreach messaging shifted away from raising awareness to personal testimonials and emphasis on the importance and value of coverage (Figure 2). For example, Connect for Health Colorado launched a, “We all need health insurance campaign,” in both English and Spanish and shared stories of consumers who have benefited from gaining coverage on their website and through social media. Stakeholders also indicated that messaging focused more on the availability of financial help and affordable coverage options during year two. For example, kynect’s advertising included the phrase, “If you think you can’t afford to be insured, think again.” Similarly, Virginia launched a state campaign that emphasized the availability of financial help to reduce health insurance costs. Some stakeholders also incorporated information on the tax penalty, the shorter enrollment period, the tax-related SEP, and renewals into their messaging efforts.
Outreach and Enrollment Efforts
Mass marketing campaigns remained important during the second open enrollment period, although the study states varied in the scope of their marketing and how it compared to year one. In the SBM states (Colorado, Kentucky, and Washington), stakeholders indicated that there was somewhat less marketing through mass media outlets during year two, in part, due to more limited marketing budgets. However, there still was a significant media presence through television, radio, and print advertisements. In Utah, which relies on the FFM, stakeholders noted that there were no state media efforts. The only advertising was via federal marketing, which a number of stakeholders indicated was challenging for outreach efforts. Health plans in Utah were able to do direct marketing to encourage enrollment in QHPs but not Medicaid. The major plans also are allowed to conduct community awareness events at health fairs and enrollment events which may increase their brand recognition if the state were to move forward with the Medicaid expansion. In Virginia, which is also an FFM state, federal funding was redirected and accessed under the new Governor to support a state media campaign, which a number of stakeholders felt facilitated outreach and enrollment efforts. However, some stakeholders indicated that this marketing did not reach certain areas of the state.
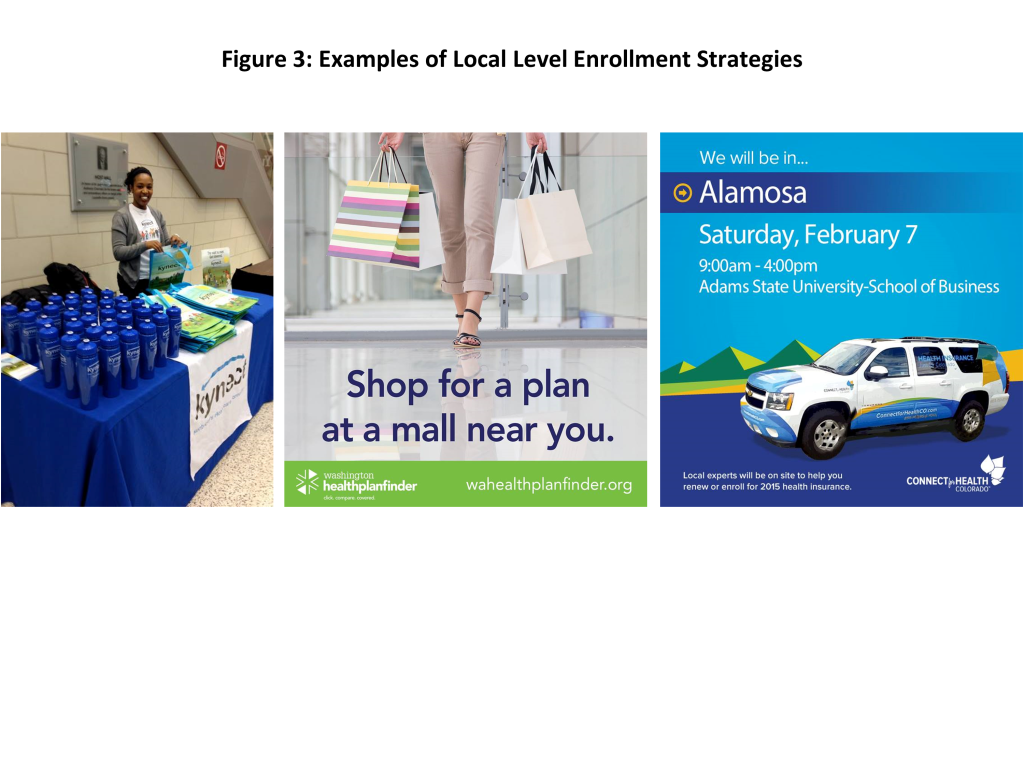
Local level outreach and enrollment assistance also remained vital during year two. Stakeholders across the five states described a range of activities to connect with individuals through community locations such as schools, libraries, and churches. In Kentucky, kynect repeated its most successful local level enrollment strategies from year one, which included providing kynect-branded giveaways to consumers and conducting outreach and providing enrollment assistance at state fairs and festivals (Figure 3). Kynect also established an enrollment storefront in the community that was staffed with assisters, brokers, and kynect and Medicaid staff. Stakeholders noted this storefront was enormously successful, serving over 7,500 clients during the open enrollment period, and that it was particularly helpful for handling complex cases because all the people with the needed expertise were in the same room. Connect for Health Colorado also built upon its previous success with temporary enrollment sites, establishing more sites during year two, including sites in rural areas. It also replicated its mobile enrollment tour, traveling around the state in Connect for Health Colorado vans. In addition, it repeated its direct outbound email campaign to individuals who initiated an account with Connect for Health Colorado but did not finish enrollment. Washington Healthplanfinder launched a mall enrollment tour, with enrollment events at several malls across the state during the beginning of the second open enrollment period. In Northern Virginia, assisters conducted “sign up Saturday” events and assisters throughout the state organized other enrollment events to reach individuals. In Utah, TakeCareUtah, a partnership between the Association for Utah Community Health, the Utah Health Policy Project, and the United Way, helped connect individuals with trained enrollment specialists in their communities and neighborhoods. Individuals can call the United Way 2-1-1 number to be directed to resources in their area.
Targeted enrollment efforts became increasingly important. In addition to broad outreach and enrollment events, stakeholders noted that, as the group of uninsured individuals they are trying to reach narrows, targeted strategies to reach specific groups increase in importance. As one assister in Kentucky commented, outreach tactics “changed from big net to spear fishing.” Across the study states, stakeholders described focused efforts to reach the Latino community, including utilizing more Spanish-speaking assisters and volunteers and marketing through Spanish media channels. Assisters also referenced targeted outreach to immigrant communities, African Americans, young adults, and veterans. In Colorado and Kentucky, stakeholders highlighted efforts to reach the LGBT community. For example, the Connect for Health Colorado Marketplace worked with the LGBT community to develop advertising that would resonate with individuals. In addition, a new initiative in Kentucky has been launched to enroll individuals in coverage as they re-enter the community upon release from prison or jail. In Utah, where the church plays a significant role in the lives of many residents, it was noted that, although the church has not been actively engaged in outreach and enrollment, information has been traveling by word of mouth as more members have gained coverage.
Enrollment Assistance
A mix of different types of individuals were involved in outreach and enrollment, including navigators, assisters, brokers, and CHC staff. Stakeholders noted that there was improved coordination across these groups during year two, which facilitated resource sharing, trouble shooting, and joint decision making. In particular, stakeholders in Colorado, Kentucky, and Washington highlighted increasingly strong relationships between assisters and brokers. There was somewhat less connection between brokers and assisters in Virginia and Utah due, in part, to federal regulations that limit referrals from assisters to brokers. However, stakeholders in Utah indicated that they are beginning to develop closer relationships. In all five states, assisters at CHCs played a key role in outreach and enrollment. In the states that expanded Medicaid, these assisters conducted both in-reach to their CHCH patients as well as outreach to the broader community and were able to enroll a significant share of their CHC patients into Medicaid coverage. However, in the non-expansion states, few CHC patients qualified for coverage since most fall into the coverage gap. As such, the CHC assisters in these states focused their enrollment efforts on the broader community outside of the CHCs.
Many of the individuals providing outreach and enrollment assistance during year two had also served this role during year one. As such, many were well-prepared and could utilize their experience and knowledge to “hit the ground running” with outreach and enrollment efforts. Largely stable funding for assisters across the study states also proved important to ensuring an adequate number of experienced assisters were available to help consumers. In Virginia, new funding to support outreach and education specialists and enrollment assisters at CHCs resulted in a significant uptick in the number of outreach and enrollment workers, which stakeholders indicated improved enrollment efforts.
Expanded capacity and fewer system problems improved the ability of call centers to serve individuals. Colorado, Kentucky, and Washington all expanded call center capacity during year two. This helped improve operations and reduce wait times and abandonment rates in Kentucky and Washington. In Colorado, there remained high demand for call center help as a result of its system problems and, as such, call center capacity remained strained. Stakeholders in Virginia and Utah indicated fewer issues with consumers accessing the healthcare.gov call center help during year two, reflecting a decrease in system problems that drove many calls during year one.
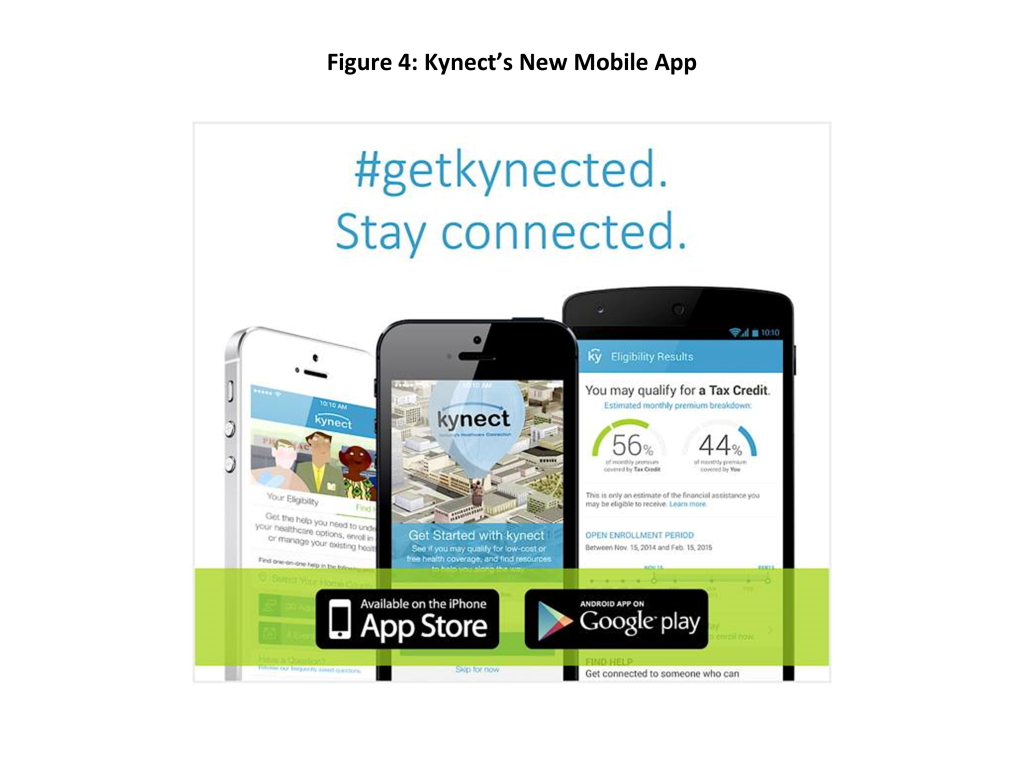
Online tools continue to be utilized and developed to support outreach and enrollment. Although Virginia relies on the FFM for QHP enrollment, it re-launched its state Cover Virginia website, which serves as a landing page for consumers to learn more about coverage options and help direct them to either apply through healthcare.gov or directly to Medicaid, depending on their circumstances. It includes an online screening tool, information about QHPs and Medicaid eligibility, and a tool to help connect individuals with local assistance resources. Kynect launched a new mobile app that allows individuals to identify enrollment events, find an agent or assister, complete a pre-screen for eligibility, and anonymously shop (Figure 4). It plans to enhance the app moving forward to allow individuals to create and access an account, take images of documentation and browse for plans, including Medicaid managed care plans.
Greater education of tax preparers will be key for helping consumers moving forward. For the first time this year, consumers faced new health insurance reporting requirements on their taxes. All consumers were required to report their health insurance coverage status for the year, and those receiving premium tax credits had to complete forms to reconcile the advance tax credit payments they received last year with their annual income. Stakeholders noted that a number of individuals were confused about these tax questions and forms and that many tax preparers had limited understanding of these issues. In Kentucky, it was noted that some Medicaid enrollees were confused about whether they needed the health coverage-related tax forms to file their taxes, resulting in lots of questions for tax preparers and assisters. Efforts were made by stakeholders to educate tax preparers. For example, kynect sent information to tax preparers and included answers to tax questions on its website, and assisters in Virginia shared information with tax preparers. However, there still appeared to be confusion and knowledge gaps among preparers, particularly those working for smaller, independent firms. At the same time, navigators and assisters indicated that they were nervous and hesitant to provide individuals any information or help to consumers related to tax questions.
Enrollment Challenges
Stakeholders indicated that despite attempts to inform and educate consumers about total out-of-pocket costs, many selected plans based on the lowest premium, leaving them with high deductibles and other cost sharing requirements that are unaffordable for them. It was noted that some individuals who purchased bronze plans did not maintain their coverage because of the high out of pocket costs. In Kentucky, stakeholders described an increased effort to educate eligible consumers about the availability of cost-sharing reductions, which they felt contributed to more consumers choosing silver plans during year two. In Utah, one of the major insurance carriers said they provided a lot of front-end consumer assistance to help individuals pick a plan that was best for them in terms of affordability and benefits, which stakeholders felt may have resulted in fewer plan changes. It also was noted that purchasing coverage would actually increase out-of-pocket costs for some individuals who previously relied on CHCs that charge a sliding fee, since a plan’s cost sharing requirements would exceed the sliding fees. One clinic noted that, moving forward, they will focus on educating individuals that the clinic can continue to discount individuals’ out-of-pocket charges based on the sliding fee scale even if they have coverage.
Stakeholders also said that premiums remain unaffordable for some consumers even with the tax credit subsidies. Moreover, they pointed out that, although an individual may have resources to pay the first month’s premium, he or she may not be able to continue to pay them over time. Marketplace officials in Washington noted that many consumers do not understand that premium payments are prospective for the following month, leading many to fall behind on their payments.
Some stakeholders noted that the shorter enrollment period compressed enrollment efforts. In most of the study states, the impact of the shorter enrollment period was somewhat mitigated by the tax-related SEP. However, a number of stakeholders indicated that the shortened time period, which spanned the holiday season, limited opportunities to reach individuals.
As more people are enrolled in coverage, it is becoming increasingly challenging to find and enroll eligible individuals. Across the study states, stakeholders felt that the remaining uninsured include a mix of the Hispanic community, immigrants, individuals living in rural areas, and harder-to-find or transient populations that are not well connected to resources. It was noted that low enrollment levels among Hispanics may be reflective of multiple factors, including access to translated materials, lack of trust, and cultural barriers. Looking ahead, they noted that targeted efforts will be required to reach the remaining uninsured and that some will not be possible to reach or will not be interested or willing to enroll in coverage.
In Virginia and Utah, which did not expand Medicaid, many individuals who tried to enroll in coverage fell into the coverage gap. Stakeholders in both states noted that the coverage gap created challenges to conducting broad outreach and messaging and led to significant confusion among people seeking health insurance. Stakeholders in Virginia noted that the gap was particularly confusing for individuals living in border areas next to states that did expand, like Kentucky, since they would hear messages encouraging them to apply and that everyone is eligible but then find out that they did not qualify for assistance. In Utah, stakeholders noted that the coverage gap makes it difficult to reach the remaining uninsured individuals who are eligible for coverage because it limits the ability to conduct broad-based marketing efforts. Assisters noted that when they identified people who fell into the coverage gap, they would connect with available resources for care for the uninsured. However, they said that it was often very difficult to deal with this situation and that some individuals would be very upset and distraught after learning they did not qualify for coverage.
Access to and Utilization of Care
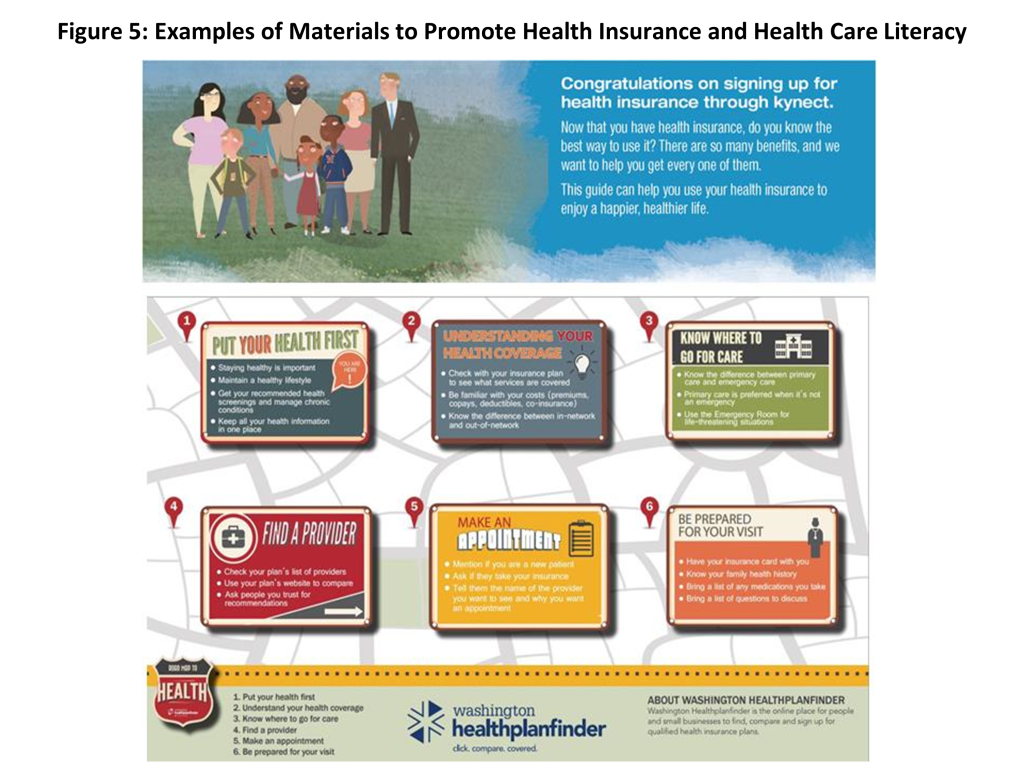
Stakeholders in all five states referenced efforts underway at multiple levels to help increase health insurance and health care literacy among individuals. For example, a number of the Marketplaces have produced printed materials and videos designed to explain basic insurance concepts like deductible and copayment and provide information on how to access care and choose a provider. For example, the “how to kynect” brochure in Kentucky provides a glossary, information on how to find a primary care provider and how to use care, as well as healthy living tips (Figure 5). Similarly, Washington Healthplanfinder, has created a Roadmap to Health brochure. A number of stakeholders also noted that the “From Coverage to Care” materials developed by the Centers for Medicare and Medicaid Services have been helpful in supporting these efforts. State Medicaid agencies also are engaging in education. For example, the Washington state Medicaid agency created a first-time user guide which is mailed to the home with the enrollment packet and includes basic information on what is covered, how to arrange a doctor’s visit, and who to call for assistance with different issues. Assisters also developed materials to explain key health insurance concepts and noted that this education is most effective when provided on a one-on-one basis with the individual. The Marketplace insurance carriers and Medicaid managed care plans are also working directly with their members on education and providing information to support enrollment assisters. However, overall, most stakeholders noted that efforts to increase literacy are still in the early stages and more work is needed in this area.
Among the three study states that implemented the Medicaid expansion (Colorado, Kentucky, and Washington), per enrollee costs of care for expansion adults have been lower than anticipated. In Colorado, most expansion adults are enrolled in a coordinated care initiative. The state observed higher emergency room use among expansion enrollees during the first six months of enrollment, but this use fell off over the subsequent six months to levels below that of individuals enrolled in fee-for-service Medicaid, and the costs of care for expansion adults has been lower than anticipated. The state is conducting analysis to gain a better understanding of why costs are lower than expected and whether they might be related to the connection to a medical home and greater understanding of how to use insurance. In Kentucky, there has not been as large a spike in emergency room use due to pent-up demand as was anticipated; however, the expansion population is accessing more care particularly for diabetes, heart disease, and other chronic conditions. An independent analysis of the first year of the expansion in Kentucky found that, compared to individuals previously enrolled in Medicaid, those in the Medicaid expansion group accessed providers at a higher rate and had increased utilization of preventive services.3 Part of this might be due to the previous lack of health insurance leading to first-time screenings and appointments. In Washington, Medicaid officials reported that, because of the large enrollment within the state, the overall health of the population is better than anticipated, leading to lower per capita costs.
Stakeholders in the three Medicaid expansion states (Colorado, Kentucky, and Washington) felt that enrollees are generally able to access needed care, although they pointed to access challenges for certain types of services and providers. In Colorado, stakeholders commented that the increased demand for care has led to longer wait times in some cases, particularly for specialty services. Similarly, stakeholders in Washington and Kentucky noted difficulty finding providers for certain specialties and behavioral health services. In each of these states, stakeholders also noted access challenges in rural areas, but pointed out that these challenges are reflective of overall provider shortages and not specific to Medicaid. Kentucky has been engaged in efforts to expand access to behavioral health providers by allowing Medicaid to contract with additional provider types (such as licensed drug alcohol counselors) and adding new services to Medicaid (such as substance abuse). Both Colorado and Washington added adult dental benefits to Medicaid in the past year, but stakeholders noted that there is a limited supply of dentists to provide these services, particularly given the high demand for them. Stakeholders in Kentucky also pointed to challenges recruiting dental providers, although they noted that access varied across the state, with greater provider availability in Louisville where there is a dental school. In Colorado, the Medicaid agency added a unit focused exclusively on provider recruitment and is examining potential rate changes to support improved access. To facilitate access to dental care, the state made targeted rate increases for dental benefits this year. The state is also using state-only funds to extend the increase in rates for primary care that was originally funded under the ACA. In contrast, Washington did not extend the primary care rate increase; stakeholders noted that there is some lag time before providers will feel the impact, and they are waiting to see if that will result in any changes in access.
In the three Medicaid expansion states (Colorado, Kentucky, and Washington), stakeholders highlighted cost savings or improved value resulting from the expansion. Stakeholders in Kentucky and Washington highlighted analyses that have documented substantial state savings that have accrued from the Medicaid expansion. In Kentucky, a recent analysis estimated a net positive fiscal impact from the Medicaid expansion of $919.1 million from SFY 2014 through SFY 2021 compared to what the state would have spent had it not expanded resulting from increased employment, increased revenues to providers and decreased uncompensated care.4 Similarly, officials in Washington noted that the state has saved about $350 million from the expansion in its first 18 months. In Colorado, officials noted that as individuals gain coverage they are costing less, for example due to lower re-admission rates.
Access to care for individuals enrolled in QHPs varies based on their choice of plan. For example, a number of stakeholders noted that some individuals who selected lower cost plans with limited networks experienced challenges getting appointments and finding providers. They suggested that some of these challenges have moderated over time as individuals have adjusted their expectations and some plans have made adjustments to better accommodate member needs. In response to narrow networks among some plans in 2014, the Department of Insurance in Washington established new requirements on network adequacy for 2015 and is drafting additional regulations to provide tools to ensure plans comply with the requirements. In Virginia, it was noted that there are some access issues in border areas where individuals are seeking to visit doctors across state lines, but unable to do so because the providers are not in-network. Stakeholders also said there were some problems with the websites not being up to date with provider networks and prescription formularies. In Utah, stakeholders indicated that those newly insured through QHPs have been high utilizers of care, and several of the plans have initiated efforts to help individuals understand how to use their insurance and manage their care, directing them away from use of the emergency room and encouraging use of primary and preventive care.
A number of care coordination and integration initiatives are underway in the study states. As noted, in Colorado, expansion enrollees are enrolled in a new coordinated care program that is designed to provide individuals a medical home and manage their care. Looking ahead, this initiative will collaborate with social services to address social determinants of health. In Washington, the state has received a State Innovation Model grant, under which the state will be integrating physical and behavioral services at both a financing and service delivery level in Medicaid. By 2020, Washington will have fully integrated managed care contracts in place across the state. The state is also aligning Medicaid quality and performance measures across plans and implementing these measures through their managed care contracts; the first shared measures will be in place in 2016. In addition, the initiative will establish linkages between clinical care and community services to address social determinants of health through Accountable Communities of Health. Kentucky is focusing on Medicaid enrollees who are super-utilizers of emergency department care through increased case management. In addition, Kentucky added behavioral health services to the Medicaid managed care contract in 2014 and holds regular meetings with the plans and educational forums with behavioral health providers to support integration of these services.
In the study states that expanded Medicaid, clinics that historically served uninsured populations reported a significant increase in their share of patients with coverage, particularly Medicaid coverage, which has led to increases in third-party reimbursements. However, they noted that a share of patients still remains uninsured, including undocumented immigrants, individuals who still cannot afford coverage and transitory individuals who are difficult to enroll in coverage. As such, other funding streams remain important. To accommodate the shift in coverage patterns, clinics have added clinical and administrative staff to meet increased demand for services as well as increased administrative demands associated with billing. Some are also increasing infrastructure to expand their capacity. One clinic reported that the coverage increases have led to a rise in provider satisfaction because coverage has facilitated their ability to refer patients out for the services they need.
In contrast, clinics in Virginia and Utah reported very little to no change in the share of patients they serve with coverage, because most fell into the coverage gap. One clinic reported an increase in their share of uninsured patients since their outreach and enrollment workers were identifying uninsured people through their ACA outreach efforts and then referring them to the clinic for services. This increase in demand has led to strained capacity at the clinic and longer waits for appointments. Some clinics also noted that they have lost some patients that enrolled in a QHP. Because clinics in these states have not seen any gains in coverage among their patients, they have not realized any increases in reimbursement. However, the clinics have benefited from enhanced funding in the ACA for operations and stressed the importance of maintaining this funding in the future. Similarly, hospitals in these states reported that they are continuing to see uncompensated care costs rise while facing cutbacks in Medicare payments and the planned reductions in Medicaid Disproportionate Share Hospital Funding, and, as such, are significantly concerned about their financial stability moving forward in the absence of the Medicaid expansion.
Looking Ahead
Looking ahead, stakeholders identified several key priority areas of focus, including the following:
- Improvements in enrollment systems. As noted, stakeholders in the study states indicated continued enrollment system work in the future to both address remaining problems and continue to enhance functions and capabilities to improve the enrollment experience.
- Reductions in marketing and outreach resources. A number of stakeholders indicated that they anticipated more limited funding to support marketing and outreach in the following year. They noted that as resources are reduced, it will be important to target them effectively and efficiently. Some stakeholders suggested that a greater share of resources should be directed to local level enrollment assistance activities versus broader media campaigns.
- Increasing health insurance and health care literacy. Across all five study states, stakeholders emphasized the need for continued work to increase individuals’ understanding of health insurance and how to appropriately utilize care. This understanding will be key for ensuring individuals enroll in the best health plan to meet their needs, holding down health care costs, and eventually improving health outcomes over the longer-term. It was recognized that care management and care coordination initiatives will play an important role in these efforts.
- Delivery system reform. The study states are each engaged in a range of different types of delivery system reforms through a variety of vehicles, including Medicaid options and waivers and the State Innovation Model grants. Increased integration of physical and behavioral care, improved care management and care coordination, and addressing social determinants of health will all be key priorities moving forward.
- Financial sustainability of the SBMs. Stakeholders in Colorado and Washington noted that there is significant pressure on their Marketplaces to achieve financial sustainability. Options are being explored to increase revenues and decrease operation budgets to achieve greater financial stability. In contrast, kynect’s financial outlook is stable, as funding through a broad-based assessment on plans both inside and outside the Marketplace covers its budget.
- Medicaid expansion debate. In Utah and Virginia, debate around adopting the Medicaid expansion remains the most significant issue moving forward. Stakeholders indicated that they cannot achieve greater progress on reducing the uninsured without the expansion. Most remained optimistic that the expansion would occur. In Virginia, a number of stakeholders noted that they thought the likelihood of expansion may increase after the next round of state legislative elections or after the next Presidential election. It was noted that as debate continues, stakeholders must make future plans considering both expansion and non-expansion scenarios, which can complicate planning efforts.
- King v. Burwell. Stakeholders in Utah and Virginia also cited the uncertainties surrounding the outcome of the King v. Burwell Supreme Court case as a key issue. It was noted that, without subsidies, many individuals would no longer be able to afford coverage. In Virginia, stakeholders are exploring potential contingency plans if the ruling determines that subsidies can no longer be provided through the FFM. In Utah, there is a lot of concern about the case, and state officials and plans are working on contingency plans. However, stakeholders noted that it is very hard to predict how to respond.
- Elections. In Kentucky, stakeholders emphasized that the upcoming gubernatorial election could have significant implications for the ACA. They noted that much of the success of ACA implementation in the state has been due to the Governor’s leadership and strong collaboration across state agencies, advocates, navigators and providers. However, there remain pockets of strong opposition to the ACA in the state and a number of candidates are running on platforms to repeal kynect and the Medicaid expansion, which stakeholders are concerned could threaten the accomplishments realized to date.
Conclusion
In sum, these findings show that, as of the second year of ACA implementation, most major enrollment system issues had been resolved. The states that expanded Medicaid continued to experience enrollment growth, and Marketplace enrollment goals were met or surpassed in four of the five states, although affordability remains a key enrollment challenge. In all five states, broad efforts are underway to increase health insurance and health care literacy among newly insured individuals. Overall, costs of care for Medicaid expansion enrollees have been lower than anticipated in the three states that expanded Medicaid. Expansion enrollees generally are able to access needed care, although there are access challenges for some services. Access to care for individuals enrolled in QHPs varies based on their choice of plan.
Looking ahead, the states are focused on a range of priorities, including continued improvements to enrollment systems and efforts to enhance access to care and increase care coordination. Moreover, in Colorado and Washington, there is significant pressure on the Marketplaces to achieve financial sustainability; in Utah and Virginia, debate around the Medicaid expansion and the outcome of the King v. Burwell Supreme Court case remain the most significant issues; and, in Kentucky, the upcoming gubernatorial election could have significant implications for implementation given the opposition to the ACA among potential candidates.
The authors gratefully acknowledge Michael Perry, Sean Dryden, and Naomi Mulligan Kolb with Perry Undem Research/Communication for their work managing the fieldwork logistics, conducting the interviews, and assisting in identifying key themes for this project. They also extend their deep appreciation to all the participants for sharing their time and perspectives to inform this project.
Endnotes
- “Medicaid Expansion Report, 2014.” (Deloitte Commissioned by the Commonwealth of Kentucky,) February 2015. http://governor.ky.gov/healthierky/Documents/medicaid/Kentucky_Medicaid_Expansion_One-Year_Study_FINAL.pdf. ↩︎
- “Apple Health Enrollment June 2014 through May 2015,” available at http://www.hca.wa.gov/medicaid/reports/Documents/enrollment_totals.pdf ↩︎
- Medicaid Expansion Report, op cit. ↩︎
- Ibid. ↩︎