How Were Hospital Admissions Impacted by COVID-19? Trends in Overall and Non-COVID-19 Hospital Admissions Through August 8, 2020
Issue Brief
Approximately seven months after the coronavirus sparked social distancing measures and concerns about hospital capacity, new medical records data help shed light on the magnitude of the drop in hospital admissions and the more recent rebound in hospitalizations. These new data provide additional information to help assess the economic impact of the COVID-19 pandemic on hospitals and insurers and also provide more information to help assess the extent to which people are still delaying or forgoing care. We analyze trends in total hospital admissions and then separately analyze non-COVID-19 admissions by patient sex, age, and region. We calculate actual admissions as a share of total predicted admissions in 2020 based on trends from past years. Key findings include:
- Total hospital admissions dropped to as low as 68.6% of predicted admissions during the week of April 11, 2020 and then increased to a high of 94.3% of predicted levels by the week of July 11, 2020. As of August 8, 2020, admission volume has dipped slightly to 90.8% of predicted levels.
- Overall, the number of hospitalizations lost due to declines in admissions between March 8 and August 8, 2020, represent 6.9% of the total expected admissions for 2020.
- When looking specifically at non-COVID-19 admissions, people age 65 and older had about half as many admissions in late March and April compared to what was predicted. While their admissions have increased somewhat, they stabilized at approximately 80-85% of their predicted level in late July and early August—while admissions for people under age 65 were at about 90% of predicted levels during the same period.
This new analysis is based on electronic medical record (EMR) data from Epic Health Research Network (EHRN) and includes all inpatient hospital admission volume from Dec 31, 2017 to August 8, 2020, involving patients who either were discharged or died, as of September 13, 2020. Data are aggregated weekly and pooled from 27 health care organizations in the United States, representing 162 hospitals that span 21 states and cover 22 million patients. These states represent 67.0% of COVID-19 cases as of September 23, 2020 and also represent 66.5% of the U.S. population.1 Predicted volume was calculated using historical data from Dec 31, 2017 to Jan 25, 2020.2 COVID-19 admissions were identified as admissions with either a documented COVID-19 diagnosis (U07.01) or other respiratory diagnosis involving a patient who either had tested positive or presumptive positive for COVID-19 or received a COVID-19 diagnosis within 14 days of the admission.
Background and prior studies on 2020 health care trends
Several recent studies show that, beginning in March 2020, social distancing measures, concerns over hospital capacity, and fears of contracting COVID-19 led to sharp declines in health care spending.3 Across all health care services, not including pharmaceutical drugs, expenditures were down 38% in April 2020, compared to April 2019. More recently, overall spending on health care has started to rebound and, by June, spending was only 10% lower than the previous year.4
An earlier EHRN analysis of EMR data found similar patterns for emergency department visits for acute myocardial infarctions and stroke, with sharp declines followed by increases that brought those emergency department visits roughly back to expected rates. In late March to early April, the incidence of these conditions as reported in hospital emergency department records was down by 45% for AMIs and 38% for strokes.5 By the end of May, the weekly incidence of acute myocardial infarction admissions had returned to approximately 92% of the pre-pandemic trend (prior to March 13, 2020). Similarly, the incidence of emergency department visits for stroke returned to approximately 87% of the historical trend.6 Analysis of EMR data for breast, cervical, and colon cancer screenings showed an even sharper decline beginning in early March followed by an increase in screenings; even so, screening rates have remained far below 2019 levels.7 By mid-June, weekly volumes for these cancer type screenings remained roughly 30-35% lower than their pre-COVID-19 levels.
A recent analysis of outpatient office visits published by the Commonwealth Fund found that visits fell nearly 60% by early April and then increased, plateauing as of July at 10% below the pre-pandemic baseline.8 Another analysis of outpatient visits that included data through May 15, 2020 found that non-COVID-19 outpatient visits dropped by almost 40 percent by mid-April and then started to increase by mid-April.9 An analysis of data from 18 states that was published by the Health Care Cost Institute found similar patterns for childhood vaccinations and cancer screenings.10 A study published in September in Health Affairs used data from a national medical group specializing in hospital medicine to analyze hospital admissions.11 That study reported similar patterns to ours—with all medical admissions in April having declined by 34.1%, and by June/July they were 8.3% lower relative to baseline volume.
Trends in overall hospital admissions
Our analysis of EMR data shows a precipitous drop in hospital admissions starting the week of March 14, 2020, falling to a low of roughly 70% of predicted admissions by the week of April 11 (Figure 1)—just four weeks after the March 13, 2020 national emergency proclamation. Admissions gradually began to increase soon after that date and, by July 11, admissions were back to approximately 95% of their predicted level. More recently, total admissions dipped slightly and are now at about 90% of predicted levels.
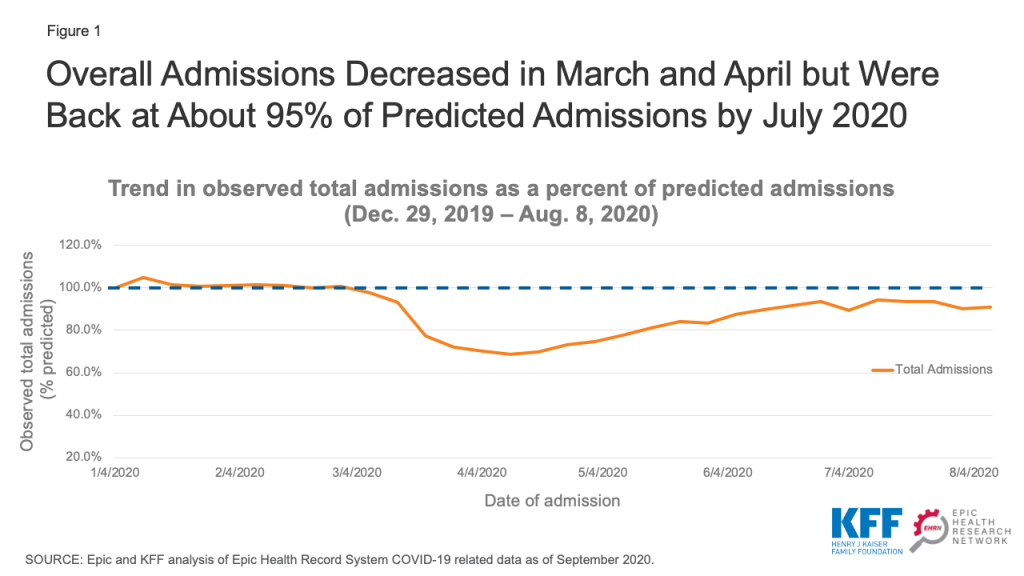
The “lost” admissions between March 8 and August 8, 2020 account for 6.9% of the total number of admissions predicted during the 2020 calendar year. If the number of admissions remains at about 90% of predicted admissions (as they were on August 8) through the end of the year, total admissions will be 10.5% below predicted volume for the entire year. If there are new restrictions on non-emergency procedures in the latter part of 2020, the share of “lost” admissions likely will be higher.
Implications for hospital finances
This drop in admissions was not something that hospitals could have anticipated at the beginning of the year and suggests revenue losses that may be difficult for some hospitals to weather. Hospitals’ financial strength differs widely. One recent study found that the median hospital had enough cash on hand to pay its operating expenses for 53 days in 2018, but the 25th percentile hospital only had enough cash on hand for 8 days.12 Smaller hospitals and rural hospitals are among those most likely to face financial challenges in the wake of revenue loss related to COVID-19. These hospitals may be more likely to close or merge if they do not have the financial resources to make up for declines in revenue caused by the declines in admissions shown in our data.
Hospitals and other health care providers have qualified for various types of federal assistance during the coronavirus pandemic. However, much of this money was not targeted to safety net hospitals operating on narrow margins.13 Most notably, hospitals and other Medicare and Medicaid providers received grants from the $175 billion provider relief fund that is being distributed by the Department of Health and Human Services (HHS). Hospitals qualified for grants that were the equivalent to a minimum of 2% of revenue and on average received grants that amounted to about 5.6% of revenue.14 Hospitals that qualified for additional grants either qualified by seeing a high number of COVID-19 inpatients by June 10 or were children’s hospitals, rural hospitals and/or safety net hospitals. About $30 billion remains available for future grant allocations as of October 8, 2020.15 It is unclear how the Department of Health and Human Services will allocate that money. How declines in admissions translates into lost hospital revenue depends on the type of admissions that were missed and which insurers paid for those admissions. Private insurers typically reimburse at higher rates than Medicare or Medicaid, and reimbursement widely varies by type of admission.16
Hospitals and other providers that participate in traditional Medicare were also eligible for loans through the Medicare Accelerated and Advance Payment Programs, which are designed to help hospitals facing cash flow disruptions during an emergency. About 80% of the $100 billion in loans went to hospitals.17 Repayment for the loans was originally set to begin in August, but Congress later delayed when repayments would begin and extended the period for repayment.18
Hospitals are also receiving a 20% increase in inpatient reimbursement for COVID-19 patients during the current public health emergency. The Congressional Budget Office estimated that this change will increase Medicare spending by about $3 billion.19 Hospitals may also be eligible for loans being distributed by the Treasury department, the Federal Reserve, and Small Business Administration.
Implications for insurer finances
Health insurers, in contrast, may be benefiting financially from this decline in hospital admissions. Many insurers have been reporting large profits despite voluntarily eliminating cost sharing for patients with COVID-19.20 The Affordable Care Act’s (ACA) Medical Loss Ratio limits the share of premiums that insurers can keep for overhead and profit. This means that beneficiaries get a refund check from their insurer if it did not spend a sufficient share of premiums on health care costs for beneficiaries. Using preliminary data reported by insurers to state regulators and compiled by Market Farrah Associates, KFF estimated insurers will be issuing a total of about $2.7 billion in rebates across all markets in 2020—nearly doubling the previous record high of $1.4 billion last year.21
Trends in non-COVID-19 admissions
We used EMR data from EHRN to look specifically at non-COVID-19 admissions by patient sex, age and region. By looking specifically at non-COVID-19 admissions, we can more easily assess declines in the use of health care due to voluntary and mandatory delays in non-emergency care. This analysis does not include specific diagnoses or procedures to assess which types of admissions had the steepest declines. Declines in certain types of admissions—such as car crashes—may be explained by changes in habits due to the coronavirus pandemic. However, as discussed earlier in this paper, declines in cancer screenings suggest that the overall decline in admissions is also a sign of patients delaying or foregoing preventive care and therefore not starting necessary treatments. Some cancer treatments were also delayed earlier in the pandemic,22 although those treatments may now have resumed in many cases.
Non-COVID-19 admissions by sex
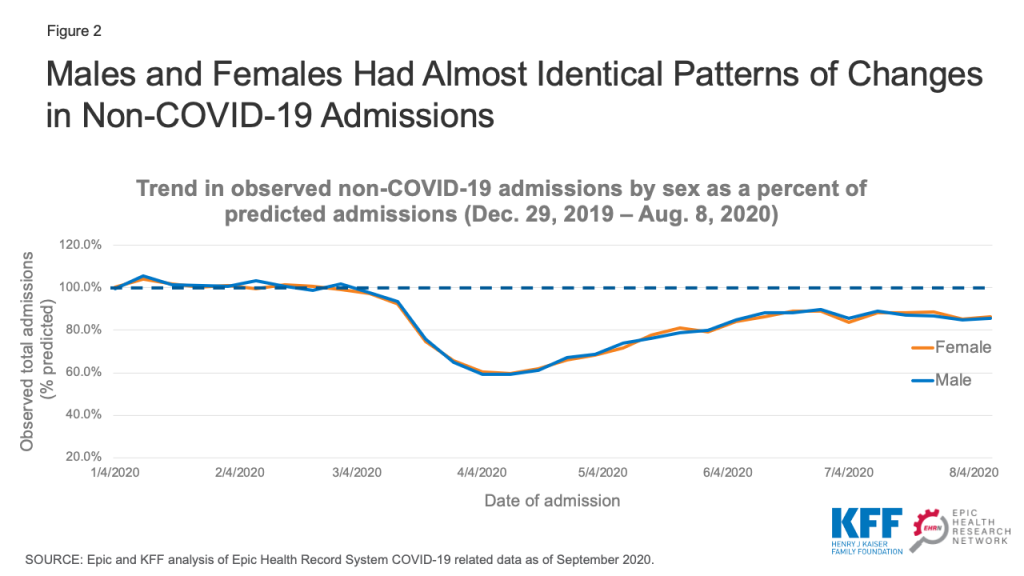
Non-COVID-19 admissions for both male and female patients dropped to about 60% of predicted admissions in April 2020 and then increased to roughly 85-90% of predicted admissions by the summer (Figure 2). On an absolute level, admissions for female patients remained about 20% higher than for male patients (data not shown). Much of this differential is likely due to women’s admissions for childbirth.
Non-COVID-19 admissions by age
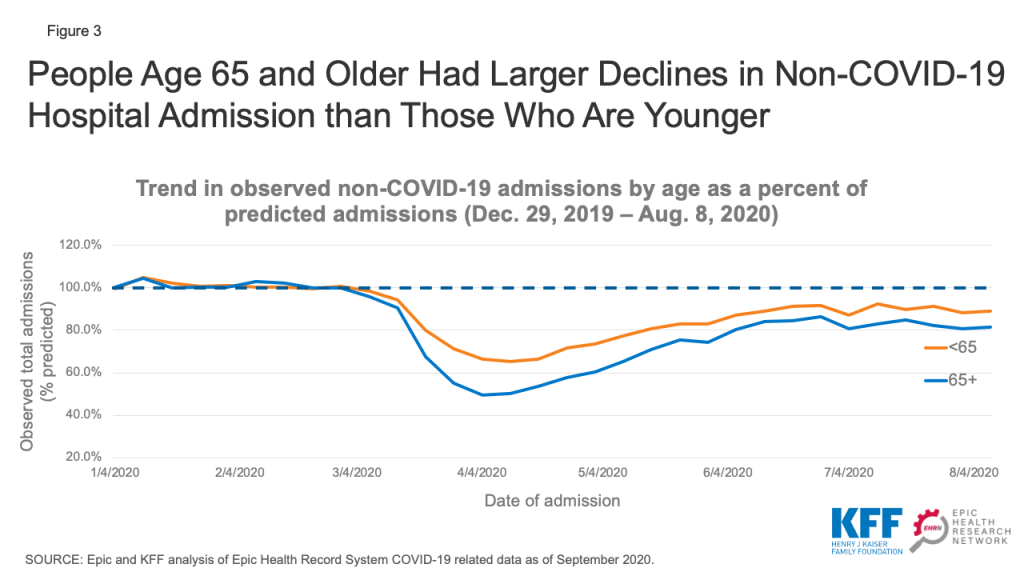
We stratified the EHRN admissions data by age to assess trends in non-COVID-19 admissions for patients age 65 and older compared to younger patients. We found that admissions for patients age 65 and older was just 50-55% of predicted levels in April 2020, compared to 65-70% of predicted levels for younger patients (Figure 3). Admissions among patients age 65 and older have not rebounded as quickly as younger patients. Admissions for patients age 65 and older were at roughly 80% of their predicted level in late July and early August, while admissions for patients under age 65 were at approximately 90% of predicted levels during the same time period. Individuals age 65 and older may be more reluctant to schedule non-emergency procedures given that they are at higher risk of serious illness if infected with the coronavirus.23
The slower return to normal among older patients may lead to a change in hospitals’ payer mix. While patients age 65 and older typically have Medicare, the majority of younger patients have private insurance, which typically reimburses at a higher rate than Medicare.24 If hospitals experience an increase in the share of patients with private insurance, that could help mitigate some of the revenue declines they are likely to see from a drop in overall admissions.
Non-COVID-19 admissions by region
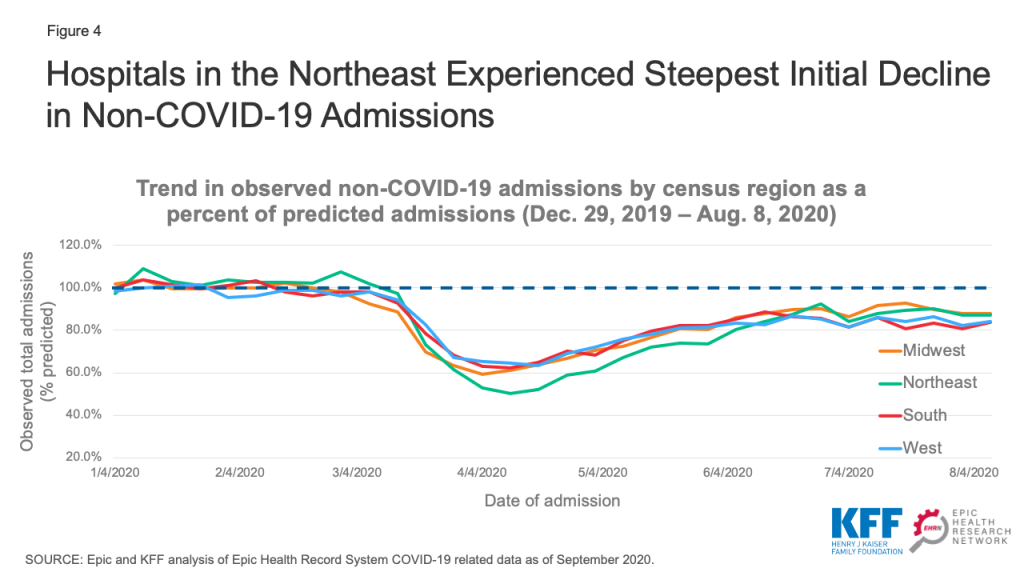
We next examined how non-COVID-19 admission trends differed across geographic regions, using the regions defined by the U.S. Census Bureau. To give a sense of the geographic distribution of our dataset, admissions from the Northeast, Midwest, South, and West regions account for 22%, 37%, 28%, and 13% of overall admissions, respectively. Hospitals in the Northeast experienced the steepest decline in non-COVID-19 admissions, with those admissions decreasing to a low of roughly 50% of predicted admissions the week of April 11 (Figure 4). Admissions in the Northeast have since increased and were at 87% of predicted levels in early August. Hospitals in the Midwest followed a similar pattern but did not experience quite as steep an initial decline in admissions. In the South, where the number of cases increased in some states during the summer, there has been less of a rebound in non-COVID-19 admissions and those admissions were about 82% of predicted levels in early August. Hospitals in the West did not experience as large a decline in admissions, but also have not experienced as large of a rebound. By early August, admissions in the West were at about 83% of predicted levels.
Implications
This new analysis from the Epic Health Research Network provides additional insights into patterns of hospital admissions during the COVID-19 pandemic. This adds to a body of research showing the steep decline in admissions in the spring followed by a more recent rebound in admissions. By looking at the patterns in non-COVID-19 admissions, we can see how changes in behavior had a differential impact by region, age, and sex. If overall hospital admissions remain at or above 90% of predicted admissions, hospital revenues may stabilize at a somewhat sustainable level. However, if the coronavirus begins to spread more rapidly later in the fall and non-emergency procedures are once again delayed, it could have serious consequences both for hospitals’ financial stability and the health of patients.
Tyler Heist, Ph.D., and Sam Butler, M.D., are with the Epic Health Research Network. Karyn Schwartz, M.P.H., is with KFF.
Endnotes
- Epic data was compared to COVID-19 data from KFF, “State Data and Policy Actions to Address Coronavirus (available at: https://modern.kff.org/coronavirus-covid-19/issue-brief/state-data-and-policy-actions-to-address-coronavirus/) and U.S. population data from the U.S. Census Bureau, “State Population Totals and Components of Change: 2010-2019” (available at: https://www.census.gov/data/tables/time-series/demo/popest/2010s-state-total.html). ↩︎
- The predictive model was based on data through Jan 25, 2020 because that was the first week with a reported COVID-19 case in the United States. We used a generalized additive model and fit it to weekly admission volume, combining long term trend, yearly seasonal, and holiday effects. Forecasts were then obtained for Jan 26, 2020 through Dec 26, 2020. ↩︎
- Cynthia Cox, Rabah Kamal, and Daniel McDermott, “How have healthcare utilization and spending changed so far during the coronavirus pandemic?” Peterson-KFF Health System Tracker, Aug. 6, 2020. ↩︎
- Cynthia Cox, Rabah Kamal, and Daniel McDermott, “How have healthcare utilization and spending changed so far during the coronavirus pandemic?” Peterson-KFF Health System Tracker, Aug. 6, 2020. ↩︎
- Jeff Trinkl, and Owen Sizemore, “Return to Near Average Number of ED Visits for Acute MI and Strokes 12 Weeks Post COVID-19 Emergency Declaration,” Epic Health Research Network, July 7, 2020. ↩︎
- Jeff Trinkl, and Owen Sizemore, “Return to Near Average Number of ED Visits for Acute MI and Strokes 12 Weeks Post COVID-19 Emergency Declaration,” Epic Health Research Network, July 7, 2020. ↩︎
- Christopher Mast and Alejandro Munoz del Rio, “Delayed Cancer Screenings—A Second Look,” Epic Health Research Network, July 17, 2020. ↩︎
- Ateev Mehrotra, Michael Chernew, David Linetsky, Hilary Hatch, David Cutler, and Eric C. Schneider, “The Impact of the COVID-19 Pandemic on Outpatient Visits: Changing Patterns of Care in the Newest COVID-19 Hot Spots,” Commonwealth Fund, August 13, 2020 ↩︎
- Engy Ziedan, Kosali I. Simon and Coady Wing, “Effects of State Covid-19 Closure Policy on Non-Covid-19 Health Care Utilization,” National Bureau of Economic Research, July 2020. ↩︎
- Katie Martin, Daniel Kurowski, Phillip Given, Kevin Kennedy, Elianna Clayton, “The Impact of COVID-19 on the Use of Preventive Health Care,” Health Care Cost Institute, Sept. 9, 2020 ↩︎
- John D. Birkmeyer, Amber Barnato, Nancy Birkmeyer, Robert Bessler, and Jonathan Skinner. “The Impact Of The COVID-19 Pandemic On Hospital Admissions In The United States.” Health Affairs September 24, 2020. ↩︎
- Dhruv Khullar, Amelia M. Bond and William L. Schpero. “COVID-19 and the Financial Health of US Hospitals.” JAMA. 2020;323(21):2127–2128. ↩︎
- Karyn Schwartz and Anthony Damico, “Distribution of CARES Act Funding Among Hospitals,” KFF, May 13, 2020. ↩︎
- This was calculated using 2019 National Health Expenditure data to estimate total revenue. We assumed that hospitals received 50% of the $10.2 billion allocated to rural providers and assumed that hospitals did not get any of the $20 billion in Phase 3 funding. ↩︎
- Karyn Schwartz and Jennifer Tolbert, “Limitations of the Program for Uninsured COVID-19 Patients Raise Concerns,” KFF, Oct. 8, 2020. ↩︎
- Eric Lopez, Gary Claxton, Karyn Schwartz, Matthew Rae, Nancy Ochieng, and Tricia Neuman, “Comparing Private Payer and Medicare Payment Rates for Select Inpatient Hospital Services,” KFF, July 7, 2020; Eric Lopez, Tricia Neuman, Gretchen Jacobson and Larry Levitt, “How Much More Than Medicare Do Private Insurers Pay? A Review of the Literature,” KFF, April 15, 2020; MACPAC, “Medicaid Hospital Payment: A Comparison across States and to Medicare,” MACPAC, April 2017. ↩︎
- Juliette Cubanski, Karyn Schwartz, Jeannie Fuglesten Biniek and Tricia Neuman, “Medicare Accelerated and Advance Payments for COVID-19 Revenue Loss: Time to Repay?” KFF, Aug. 7, 2020. ↩︎
- Section 2501 of H.R. 8337. ↩︎
- CBO, “Preliminary Estimate of the Effects of H.R. 748, the CARES Act, Public Law 116-136, Revised, With Corrections to the Revenue Effect of the Employee Retention Credit and to the Modification of a Limitation on Losses for Taxpayers Other Than Corporations,” CBO, April 27, 2020. ↩︎
- Reed Abelson, “Major U.S. Health Insurers Report Big Profits, Benefiting From the Pandemic,” New York Times, Aug. 5, 2020; KFF, “When Cost-Sharing Waivers for COVID-19 Treatment Expire for People with Private Insurance Plans,” KFF, Aug. 24, 2020. ↩︎
- Rachel Fehr and Cynthia Cox, “Data Note: 2020 Medical Loss Ratio Rebates,” KFF, April 17, 2020. ↩︎
- American Cancer Society – Cancer Action Network, “COVID-19 Pandemic Impact on Cancer Patients and Survivors Survey Findings Summary,” American Cancer Society – Cancer Action Network, Available at: https://www.fightcancer.org/sites/default/files/National%20Documents/Survivor%20Views.COVID19 %20Polling%20Memo.Final_.pdf (accessed Oct. 8, 2020). ↩︎
- Centers for Disease Control and Prevention, “Your Health: Older Adults,” Centers for Disease Control and Prevention, Available at: https://www.cdc.gov/coronavirus/2019-ncov/need-extra-precautions/older-adults.html (accessed Oct. 8, 2020). ↩︎
- Eric Lopez, Gary Claxton, Karyn Schwartz, Matthew Rae, Nancy Ochieng, and Tricia Neuman, “Comparing Private Payer and Medicare Payment Rates for Select Inpatient Hospital Services,” KFF, July 7, 2020. ↩︎