How Might Medicaid Adults with Disabilities Be Affected By Work Requirements in Section 1115 Waiver Programs?
Issue Brief
Medicaid provides health insurance for over 80 million Americans, including pregnant women, low-income parents, children, seniors, and people with disabilities, while Supplemental Security Income (SSI) is a monthly cash payment to help low-income people with disabilities pay for housing, food, and other basic needs. SSI does not include health insurance, but people who receive SSI generally automatically qualify for Medicaid. SSI enrollees are a subset of all Medicaid enrollees with disabilities. People who receive SSI cash assistance must meet stringent income, asset, and medical eligibility criteria. Many people with disabilities do not receive cash assistance from SSI but still qualify for health insurance from Medicaid through other eligibility pathways.
Proponents of Medicaid work requirements often describe these policies as applying to “able-bodied” adults. Recent guidance from the Centers for Medicare and Medicaid Services (CMS), allowing states for the first time to condition Medicaid eligibility on meeting a work requirement, permits states to target only people who are “eligible on a basis other than disability.” Kentucky’s waiver, the first to include a work requirement (referred to as community engagement),1 applies to Medicaid expansion adults and traditional adults, including low-income parents. As of mid-January, 2018, nine other states have submitted waiver proposals to CMS seeking work requirements (AR, AZ, IN, KS, ME, MS, NH, UT, and WI).
Although the CMS work guidance excludes people who are eligible for Medicaid based on a disability, many adults with disabilities will face Medicaid work requirements because they are eligible for Medicaid on another basis. While Medicaid work requirements could apply to all expansion adults and/or low-income parents, this issue brief focuses on the subset of those with disabilities because they may have difficulty meeting the work requirement or obtaining an exemption due to their health needs. We examine the implications of work requirements for nonelderly Medicaid adults with disabilities who do not receive SSI (referred to as non-SSI adults with disabilities) and compare their work status and functional limitations to those who do receive SSI. The Appendix contains 50-state data.
Key Findings
How Many Medicaid Adults Have a Disability?
Three in 10 nonelderly adults with Medicaid report having a disability, according to data from the American Community Survey (ACS) (Figure 1). The ACS classifies a person as having a disability if the person reports serious difficulty with hearing, vision, cognitive functioning (concentrating, remembering, or making decisions), mobility (walking or climbing stairs), self-care (dressing or bathing), or independent living (doing errands, such as visiting a doctor’s office or shopping, alone).2 The ACS definition of disability is intended to capture whether a person has a functional limitation that results in a participation limitation and is similar to measures used in other federal surveys, such as the National Health Interview Survey.
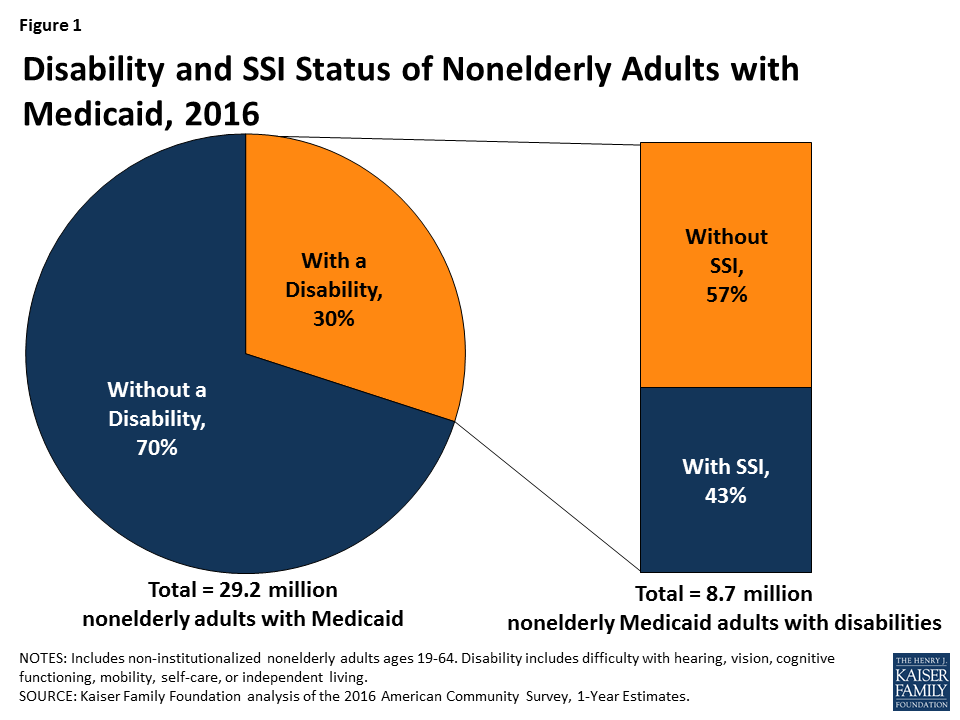
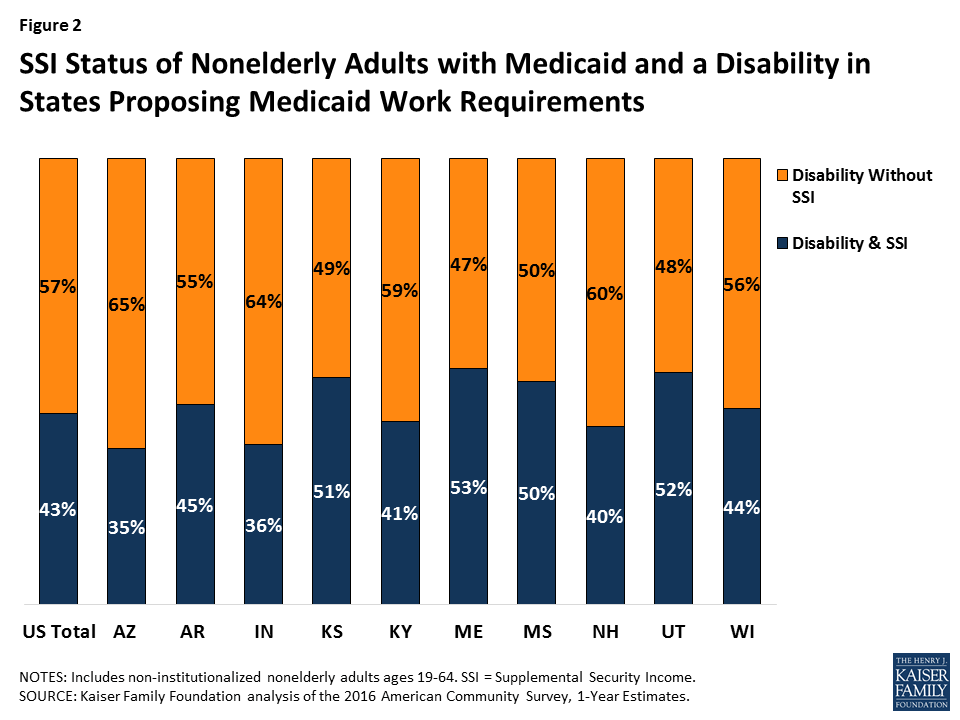
Despite reporting serious difficulty in at least one ACS functional area, nearly six in 10 (57%) nonelderly Medicaid adults have a disability but do not receive SSI cash assistance (Figure 1). Box 1 below provides an overview of SSI eligibility criteria and the various Medicaid eligibility pathways available to people with disabilities. Many of the nonelderly Medicaid adults with disabilities in Kentucky and the nine states with work requirement proposals do not receive SSI (Figure 2 and Appendix Table 1). The share of nonelderly Medicaid adults with a disability who do not receive SSI in these states ranges from 47 percent in Maine to 65 percent in Arkansas.
Box 1: SSI vs. Medicaid Eligibility Criteria for People with Disabilities
In order to qualify for SSI, individuals must have low incomes, limited assets, and an impaired ability to work at a substantial gainful level as a result of old age or significant disability. The SSI disability standard is more stringent than the ACS definition of disability, which requires serious difficulty in at least one of the six functional areas described above. In addition, SSI income and asset limits are more restrictive than those required for Medicaid expansion adults and many optional disability-related Medicaid coverage pathways.3 People who meet the ACS definition of disability but do not receive SSI can be eligible for Medicaid as expansion adults or Section 1931 parents (based solely on their low income). They also may be eligible for Medicaid through an optional disability-related pathway (such as the state option to cover people with disabilities up to the federal poverty level or a home and community-based services waiver).4
How Many Medicaid Adults with Disabilities are Working?
Despite reporting functional limitations, non-SSI adults with disabilities are more than three times as likely to be in the workforce than adults with disabilities who receive SSI (Figure 3). Less than one-quarter (23%) of non-SSI adults with disabilities work, compared to about seven percent of adults with disabilities who receive SSI (Figure 3). About one in five (19%) non-SSI adults with disabilities usually work 20 or more hours per week in the weeks they work, and another four percent usually work less than 20 hours per week (Figure 3). For comparison, Kentucky’s waiver requires non-exempt enrollees to work 80 hours per month (equivalent to 20 hours per week). Appendix Table 2 contains state-level data on the work status and usual hours worked for non-SSI adults with disabilities.
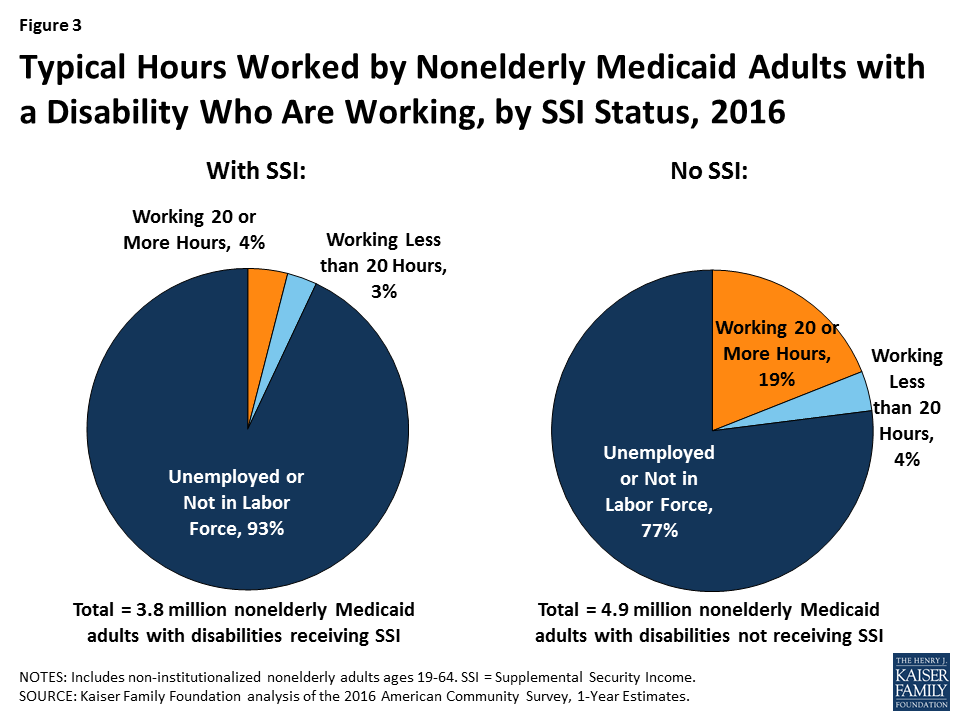
Over three-quarters (77%) of non-SSI adults with disabilities are not in the workforce (77%) (not working or unemployed but looking for work) (Figure 3). Their absence from the workforce is likely at least in part due to the serious functional difficulties they report in areas such as cognitive functioning, mobility, self-care, and independent living, as described above.
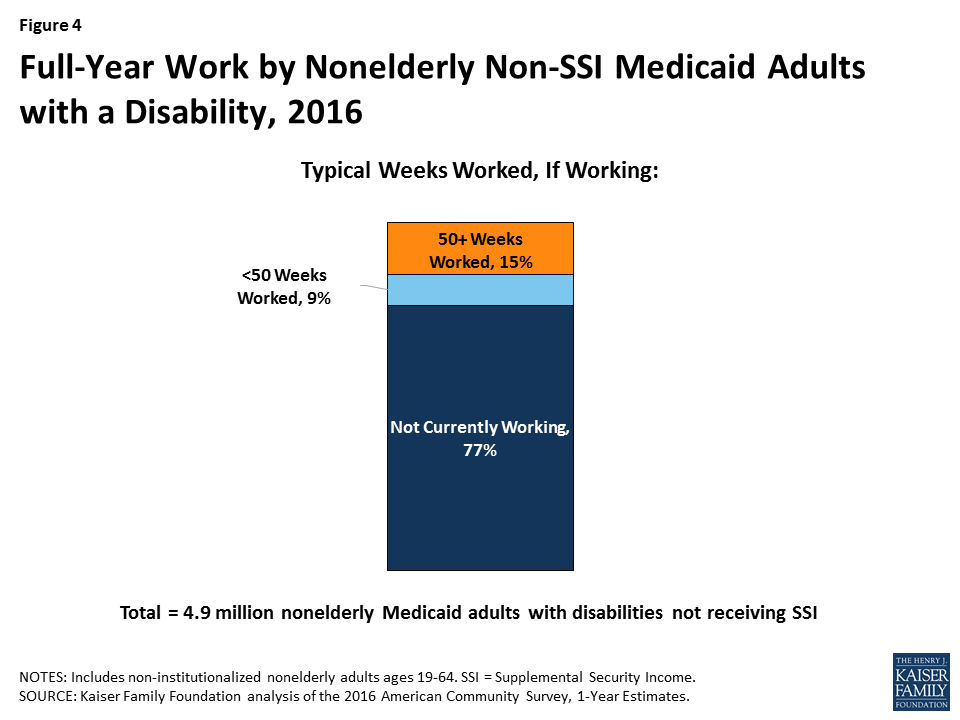
Among those who are working, 15 percent of non-SSI adults with disabilities typically are working for the full year (50 or more weeks) (Figure 4). Another nine percent are working, but typically for less than the entire year. People with disabilities may experience health issues related to their disability that prevent them from working consistently over time or from working every week.
What are the Characteristics of Medicaid Adults with Disabilities?
Nonelderly Medicaid adults with a disability may have health problems that limit their ability to work, or to work full-time, even though their needs do not rise to the stringent SSI level. Over half of non-SSI adults with disabilities report serious difficulty with mobility (52%), and a majority (51%) report serious difficulty with cognitive functioning (Figure 5). Over two in five (42%) non-SSI adults with disabilities report serious difficulty with independent living tasks, such as visiting a doctor’s office or shopping alone. Over one in five (21%) non-SSI adults with disabilities report serious difficulty with self-care tasks, such as dressing or bathing. Smaller shares report serious difficulty with vision (18%) and hearing (14%), compared to the other limitations that make up the ACS disability definition.
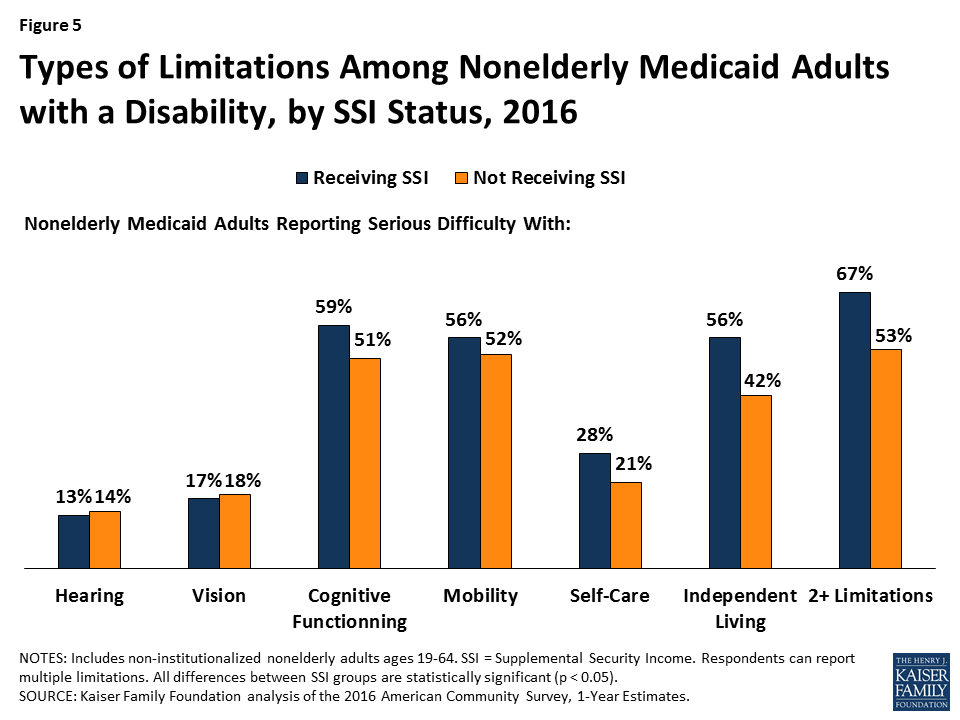
Most nonelderly Medicaid adults with a disability have multiple functional limitations. Over half (53%) of those without SSI have two or more of the six ACS functional limitations, compared to two-thirds (67%) of those with SSI (Figure 5).
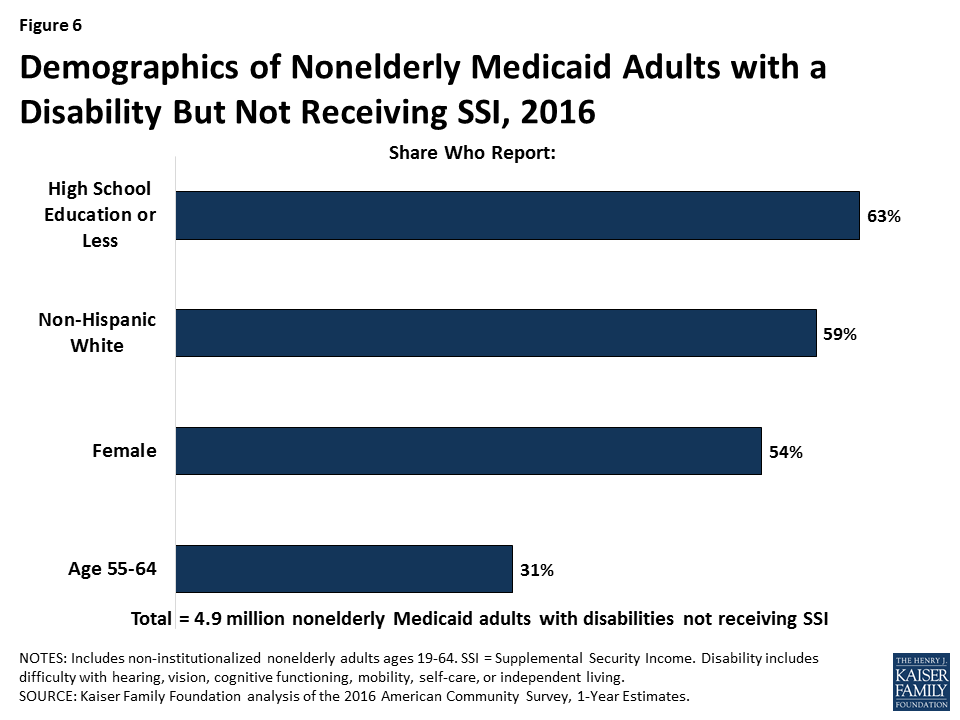
Over six in 10 (63%) non-SSI adults with disabilities have a high school education or less, a factor that could create additional barriers to meeting a work requirement (Figure 6). About six in 10 (59%) non-SSI adults are non-Hispanic white, 54 percent are female, and more than three in 10 (31%) are ages 55 to 64 (Figure 6).
Looking Ahead
If they are not exempted, waivers that condition Medicaid eligibility on meeting a work requirement could adversely impact people with disabilities who have limitations that interfere with their ability to work but do not rise to the stringent SSI level of disability. While Kentucky’s waiver does not apply to people who receive SSI or other people who are eligible for Medicaid “based on a disability,” 59 percent of nonelderly Medicaid adults with disabilities in Kentucky do not receive SSI; this share is 57 percent nationally and ranges from 47 percent to 65 percent in the nine states with pending work requirement waivers.
Kentucky’s waiver requires people who are determined to be “medically frail” to be exempt from the work requirement, but there is no detail about how that process will be administered or whether all people with serious functional difficulties that impede their ability to work will qualify for an exemption. People who are classified as “medically frail” also will be exempt from other waiver provisions that can result in the loss of coverage, including the six-month coverage lockouts for failure to pay premiums (for those above 100% FPL), failure to timely renew eligibility, and failure to timely report a change in circumstances that affects eligibility.5 Kentucky’s waiver also requires the state to provide exemptions or reasonable modifications to the work requirement and other program rules under the Americans with Disabilities Act (ADA), Section 504 of the Rehabilitation Act, and Section 1557 of the ACA to assist people with disabilities and prevent eligible people from losing coverage.
Experience in TANF shows that work requirements can result in people with disabilities losing benefits for which they are eligible. Key issues to watch to determine the impact of Medicaid work requirement waivers on people with disabilities include whether states will have adequate staff, money, and administrative capacity to implement complex program rules; whether the medical frailty process will correctly identify and exempt all people who cannot comply with a work requirement because of a disability; what types of reasonable modifications and support services the state will provide under the ADA to enable people with disabilities to comply; how many people with disabilities will lose coverage for which they remain eligible; and whether they are able to successfully use the appeals process to regain or prevent lapses in coverage.
Appendix
| Appendix Table 1: Nonelderly Medicaid Adults by Disability and SSI Status, 2016 | |||||
| Total Nonelderly Medicaid Adults | Nonelderly Medicaid Adults with a Disability | Nonelderly Medicaid Adults with a Disability but Not SSI | |||
| Number | Share of Total Nonelderly Medicaid Adults | Number | Share of Nonelderly Medicaid Adults with a Disability | ||
| United States Total | 29,177,700 | 8,661,500 | 30% | 4,900,400 | 57% |
| Alabama | 326,800 | 143,900 | 44% | 64,300 | 45% |
| Alaska | 57,900 | 18,600 | 32% | 10,500 | 56% |
| Arizona | 765,900 | 200,300 | 26% | 130,100 | 65% |
| Arkansas | 324,300 | 117,000 | 36% | 63,900 | 55% |
| California | 5,187,300 | 1,018,900 | 20% | 612,500 | 60% |
| Colorado | 511,300 | 124,500 | 24% | 81,800 | 66% |
| Connecticut | 363,800 | 83,100 | 23% | 56,500 | 68% |
| Delaware | 88,500 | 24,700 | 28% | 14,000 | 57% |
| DC | 105,300 | 28,500 | 27% | 19,100 | 67% |
| Florida | 1,410,100 | 480,400 | 34% | 234,600 | 49% |
| Georgia | 563,900 | 227,900 | 40% | 99,200 | 44% |
| Hawaii | 112,200 | 22,700 | 20% | 13,300 | 58% |
| Idaho | 85,200 | 38,500 | 45% | 15,200 | 39% |
| Illinois | 1,186,200 | 299,800 | 25% | 191,400 | 64% |
| Indiana | 499,200 | 184,500 | 37% | 118,400 | 64% |
| Iowa | 272,300 | 82,200 | 30% | 49,500 | 60% |
| Kansas | 123,800 | 56,400 | 46% | 27,500 | 49% |
| Kentucky | 615,200 | 217,800 | 35% | 129,300 | 59% |
| Louisiana | 461,400 | 176,300 | 38% | 90,300 | 51% |
| Maine | 120,400 | 55,500 | 46% | 26,300 | 47% |
| Maryland | 493,900 | 140,500 | 28% | 82,100 | 58% |
| Massachusetts | 902,000 | 218,600 | 24% | 128,100 | 59% |
| Michigan | 1,144,800 | 381,800 | 33% | 220,700 | 58% |
| Minnesota | 491,200 | 127,200 | 26% | 82,200 | 65% |
| Mississippi | 246,200 | 108,200 | 44% | 53,800 | 50% |
| Missouri | 311,400 | 146,800 | 47% | 88,100 | 60% |
| Montana | 90,100 | 35,700 | 40% | 21,600 | 60% |
| Nebraska | 71,100 | 32,000 | 45% | 15,000 | 47% |
| Nevada | 256,300 | 73,500 | 29% | 46,200 | 63% |
| New Hampshire | 80,300 | 26,100 | 33% | 15,800 | 60% |
| New Jersey | 694,600 | 171,900 | 25% | 90,100 | 52% |
| New Mexico | 325,300 | 84,800 | 26% | 49,900 | 59% |
| New York | 2,721,500 | 592,900 | 22% | 342,900 | 58% |
| North Carolina | 642,300 | 245,300 | 38% | 126,700 | 52% |
| North Dakota | 35,600 | 14,900 | 42% | 9,900 | 66% |
| Ohio | 1,224,600 | 373,800 | 31% | 241,400 | 65% |
| Oklahoma | 201,600 | 92,300 | 46% | 52,300 | 57% |
| Oregon | 498,000 | 144,100 | 29% | 92,900 | 64% |
| Pennsylvania | 1,185,100 | 439,700 | 37% | 259,500 | 59% |
| Rhode Island | 120,600 | 42,200 | 35% | 18,800 | 45% |
| South Carolina | 354,000 | 137,700 | 39% | 69,000 | 50% |
| South Dakota | 37,300 | 15,300 | 41% | 7,800 | 51% |
| Tennessee | 592,400 | 228,200 | 39% | 117,700 | 52% |
| Texas | 1,247,200 | 513,700 | 41% | 231,200 | 45% |
| Utah | 128,600 | 46,800 | 36% | 22,300 | 48% |
| Vermont | 85,600 | 24,300 | 28% | 12,900 | 53% |
| Virginia | 330,000 | 130,300 | 39% | 72,400 | 56% |
| Washington | 727,400 | 219,000 | 30% | 136,600 | 62% |
| West Virginia | 277,000 | 98,100 | 35% | 60,800 | 62% |
| Wisconsin | 452,600 | 142,500 | 31% | 79,500 | 56% |
| Wyoming | 28,200 | 11,600 | 41% | 4,800 | 41% |
| NOTES: Includes non-institutionalized nonelderly adults ages 19-64. SSI = Supplemental Security Income. Disability includes serious difficulty with hearing, vision, cognitive functioning, mobility, self-care, or independent living.SOURCE: Kaiser Family Foundation analysis based on the 2016 American Community Survey, 1-Year Estimates. | |||||
| Appendix Table 2: Work Status of Nonelderly Medicaid Adults with a Disability but Not SSI, 2016 | ||||||
| Total Non-SSI Medicaid Adults with Disabilities | Total Working | Share Working | Share Working 20+ Hours/Week | Share Working <20 Hours/Week | Share Unemployed or Not in Labor Force | |
| United States Total | 4,900,400 | 1,150,800 | 23% | 19% | 4% | 77% |
| Alabama | 64,300 | 6,700 | 10% | 9% | 2% | 90% |
| Alaska | 10,500 | 2,700 | 26% | 21% | * | 74% |
| Arizona | 130,100 | 30,500 | 23% | 19% | 4% | 77% |
| Arkansas | 63,900 | 14,000 | 22% | 19% | 3% | 78% |
| California | 612,500 | 156,200 | 26% | 22% | 4% | 74% |
| Colorado | 81,800 | 22,600 | 28% | 22% | 5% | 72% |
| Connecticut | 56,500 | 12,600 | 22% | 19% | 3% | 78% |
| Delaware | 14,000 | 3,800 | 27% | 19% | * | 73% |
| DC | 19,100 | 4,100 | 21% | 20% | * | 79% |
| Florida | 234,600 | 42,400 | 18% | 16% | 2% | 82% |
| Georgia | 99,200 | 17,100 | 17% | 15% | 3% | 83% |
| Hawaii | 13,300 | 2,600 | 20% | 16% | * | 80% |
| Idaho | 15,200 | 3,600 | 24% | 17% | * | 76% |
| Illinois | 191,400 | 41,700 | 22% | 18% | 4% | 78% |
| Indiana | 118,400 | 26,700 | 23% | 19% | 4% | 77% |
| Iowa | 49,500 | 17,100 | 34% | 25% | 9% | 66% |
| Kansas | 27,500 | 7,600 | 28% | 22% | * | 72% |
| Kentucky | 129,300 | 31,100 | 24% | 22% | 2% | 76% |
| Louisiana | 90,300 | 17,200 | 19% | 16% | 3% | 81% |
| Maine | 26,300 | 4,200 | 16% | 12% | * | 84% |
| Maryland | 82,100 | 23,500 | 29% | 25% | 4% | 71% |
| Massachusetts | 128,100 | 37,700 | 29% | 24% | 5% | 71% |
| Michigan | 220,700 | 55,400 | 25% | 20% | 5% | 75% |
| Minnesota | 82,200 | 30,900 | 38% | 28% | 9% | 62% |
| Mississippi | 53,800 | 7,000 | 13% | 11% | * | 87% |
| Missouri | 88,100 | 12,800 | 15% | 12% | 3% | 85% |
| Montana | 21,600 | 6,400 | 30% | 22% | * | 70% |
| Nebraska | 15,000 | 4,400 | 29% | 25% | * | 71% |
| Nevada | 46,200 | 9,500 | 20% | 17% | 4% | 80% |
| New Hampshire | 15,800 | 3,500 | 23% | 20% | * | 77% |
| New Jersey | 90,100 | 21,200 | 24% | 19% | 5% | 76% |
| New Mexico | 49,900 | 12,000 | 24% | 21% | * | 76% |
| New York | 342,900 | 90,800 | 26% | 22% | 4% | 74% |
| North Carolina | 126,700 | 22,500 | 18% | 14% | 4% | 82% |
| North Dakota | 9,900 | * | 38% | * | * | 62% |
| Ohio | 241,400 | 62,500 | 26% | 21% | 5% | 74% |
| Oklahoma | 52,300 | 8,800 | 17% | 15% | * | 83% |
| Oregon | 92,900 | 29,200 | 31% | 26% | 6% | 69% |
| Pennsylvania | 259,500 | 62,200 | 24% | 19% | 5% | 76% |
| Rhode Island | 18,800 | 5,900 | 31% | 27% | * | 69% |
| South Carolina | 69,000 | 12,100 | 17% | 15% | * | 83% |
| South Dakota | 7,800 | 3,400 | 44% | 30% | * | 56% |
| Tennessee | 117,700 | 23,500 | 20% | 18% | 2% | 80% |
| Texas | 231,200 | 49,100 | 21% | 17% | 4% | 79% |
| Utah | 22,300 | 6,500 | 29% | 25% | * | 71% |
| Vermont | 12,900 | 4,100 | 32% | 28% | * | 68% |
| Virginia | 72,400 | 13,600 | 19% | 16% | * | 81% |
| Washington | 136,600 | 31,800 | 23% | 18% | 6% | 77% |
| West Virginia | 60,800 | 11,900 | 20% | 16% | 3% | 80% |
| Wisconsin | 79,500 | 19,400 | 24% | 20% | 5% | 76% |
| Wyoming | 4,800 | 1,200 | 24% | 19% | * | 76% |
| NOTES: Includes non-institutionalized nonelderly adults ages 19-64. SSI = Supplemental Security Income. Disability = serious difficulty with hearing, vision, cognitive functioning, mobility, self-care, or independent living.* indicates data do not meet standards of statistical reliability to report.SOURCE: Kaiser Family Foundation analysis based on the 2016 American Community Survey, 1-Year Estimates. | ||||||
Endnotes
- In addition to the work requirement, Kentucky’s waiver includes coverage lockouts for failing to pay premiums, timely renew eligibility, and timely report changes affecting eligibility, among other provisions. ↩︎
- The ACS questions used to classify an individual as having a disability include: (1) Is this person deaf, or does he/she have serious difficulty hearing? (2) Is this person blind, or does he/she have serious difficulty seeing, even when wearing glasses? (3) Because of a physical, mental, or emotional condition, does this person have serious difficulty concentrating, remembering, or making decisions? (4) Does this person have serious difficulty walking or climbing stairs? (5) Does this person have difficulty dressing or bathing? (6) Because of a physical, mental, or emotional condition, does this person have difficulty doing errands alone, such as visiting a doctor’s office or shopping? U.S. Census Bureau, How Disability Data are Collected from the American Community Survey, (Oct. 17, 2017), https://www.census.gov/topics/health/disability/guidance/data-collection-acs.html. ↩︎
- The maximum SSI benefit is about 74 percent of the federal poverty level (FPL, $9,000/year for an individual in 2018), and the asset limit is $2,000. The ACA Medicaid expansion covers individuals up to 138% FPL ($16,735/year for an individual in 2018) without an asset test. States have the option to extend financial eligibility for many disability-related Medicaid coverage pathways up to 300% of SSI ($27,000/year in 2018). ↩︎
- People who qualify for Medicaid both as an expansion adult and based on a disability can choose the group through which they enroll in coverage; benefit packages may differ by coverage group. 42 C.F.R. § 435.911 (c) (2), (d). ↩︎
- In addition, people who are medically frail will be exempt from the six-month healthy behavior incentive account suspension and account point deduction (for those at or below 100% FPL who choose to pay premiums but stop paying) and will not have to wait for the 60-day premium payment period to expire before coverage begins (for those who do not pay premiums). ↩︎