CHIP Enrollment Snapshot: December 2013
Issue Brief
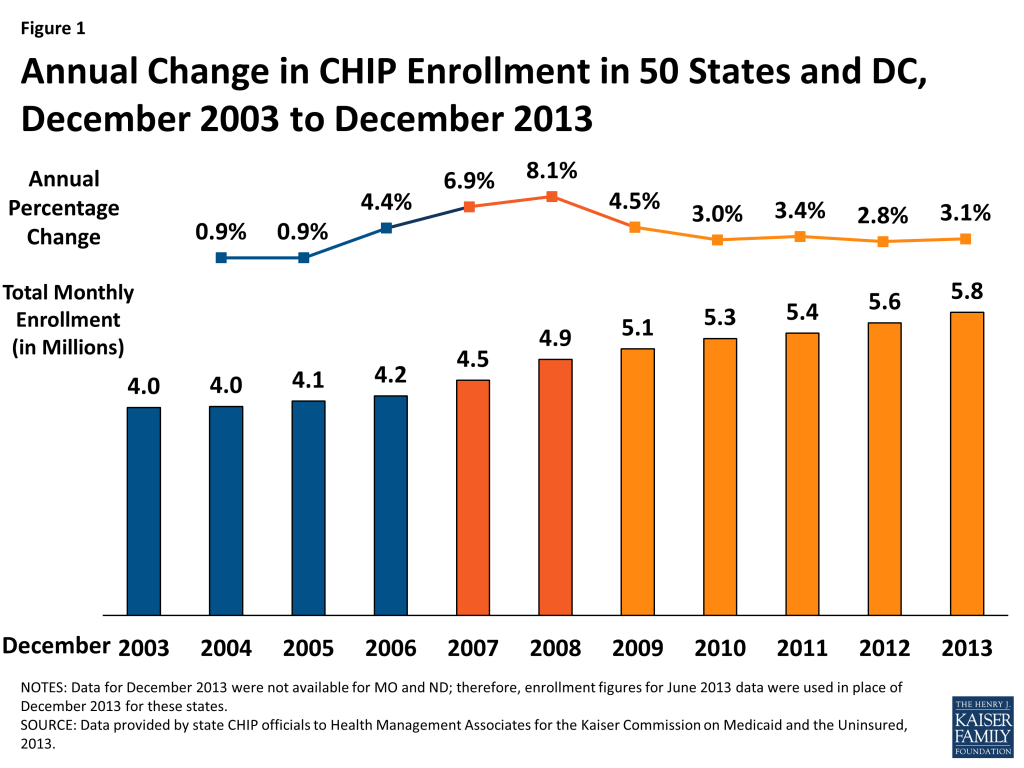
In December 2013, nearly 5.8 million children were enrolled in the Children’s Health Insurance Program (CHIP.) Enrollment in December 2013 increased on net by 175,020 or by 3.1 percent, compared to one year earlier. Since 2011, annual rates of growth have remained fairly steady, hovering around 3 percent. In contrast, during the height of the Recession, enrollment increased annually by 6.9 to 8.1 percent. (Figure 1, Appendix Tables 1 and 2)
CHIP, combined with Medicaid, provides a crucial safety net of coverage for low-income children. Both programs, aided by maintenance of eligibility (MOE) provisions maintained under the Affordable Care Act (ACA) helped to stave off increases in the number of uninsured children. Between 2007 and 2012, the uninsured rate for children dropped from 10.9% to 9.2%, despite a decline in the share of children with employer-sponsored coverage.1 While the MOE provisions for adults ended in January 2014, the MOE provisions for children remain in effect until October 2019. However, the ACA only extended CHIP funding through October 2015; Congress would need to appropriate additional funds in order for allotments to be available after October 2015. This, combined with the advent of new coverage options available through the marketplaces, raises questions about the program’s future role.
This report focuses on changes in monthly CHIP enrollment between December 2012 and December 2013. This is a long standing report that collects monthly CHIP enrollment data for December (and June, not reported here) going back to 2000. The most recent data included in this report predate preliminary data released by CMS that show the early effects of full implementation of the ACA. While the data provided in this report are not directly comparable to the data released by CMS (see methodology for more details,) they provide context for the preliminary data released by CMS, illustrating historical trends in CHIP enrollment.
ACA Eligibility Changes for Children
The ACA requires that Medicaid cover children with incomes up to 133 percent of the federal poverty level (FPL) as of January 2014. Before this change, states were required to cover children under the age of six in families with income of at least 133 percent FPL and school-age children and teens with incomes up to 100 percent FPL in Medicaid. Many states already covered children with incomes up to 133 percent FPL in Medicaid, but due to the change in law, 21 states needed to transition some children, mostly school-age children with incomes between 100 and 133 (a.k.a. Stairstep children) from their CHIP state plans to their Medicaid state plans.2 (Figure 2) These children remain eligible for the Title XXI Federal CHIP match rate.
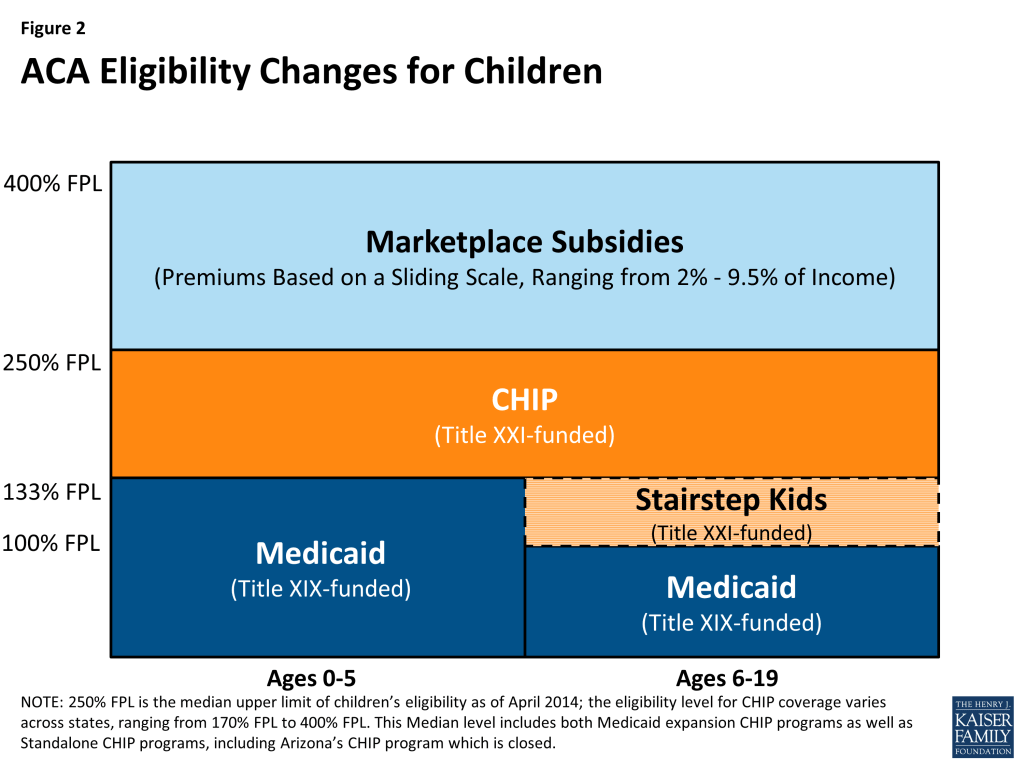
As of April 2014, more than half of the states (29, including DC) cover children in families with incomes at or above 250% FPL and 19, including DC, cover children in families with incomes at or above 300% FPL either through Medicaid or CHIP. Thirty-seven states continue to operate standalone CHIP programs, most in combination with CHIP Medicaid expansions, for higher income children.3
A few of the 21 states that covered “Stairstep” children under separate CHIP programs decided to move these children before the requirement was in place. New York and Colorado implemented an early transition of children from CHIP to Medicaid but are maintaining separate CHIP programs. Meanwhile, New Hampshire and most recently California transitioned all CHIP kids to Medicaid, not just these older children with incomes under 133 percent FPL. The remaining 17 states will transition an estimated 13 percent to 48 percent of their CHIP coverage to Medicaid.4
Note About this Report: This CHIP enrollment report series has always included Title XXI-funded enrollees only (children enrolled in Medicaid expansion CHIP programs and stand-alone CHIP programs) while its companion on Medicaid enrollment has included Title XIX-funded enrollees only; this has ensured an unduplicated count between Medicaid and CHIP children. Because of difficulties identifying which of these children are in fact being transitioned and to continue to ensure unduplicated counts with the companion report for Medicaid, these “Stairstep” children are included as CHIP enrollees in this report. Therefore, the early transitions described above are accounted for within this report rather than in the Medicaid Enrollment report.
Continued improvement in economic conditions likely resulted in both some growth as children shifted from Medicaid to CHIP and some declines as family incomes continued to increase above CHIP eligibility levels. CHIP offers coverage to low-income children in families who do not have access to affordable coverage but whose incomes are above Medicaid eligibility levels. Therefore, economic pressures provide both upward and downward pressure on enrollment. As the economy continues to improve, as it did during 2013, family income rises, which results in some children shifting from Medicaid to CHIP coverage. However, economic conditions improving can also result in some children leaving the program as income increases above CHIP eligibility levels for higher income families.During the period from December 2012 to December 2013, there were a number of factors likely influencing CHIP enrollment in different directions, most notably:
Successful outreach and enrollment efforts for new Marketplaces likely pushed enrollment up in some states. Implementation of the major coverage provisions of the ACA had begun but had not been completed. Broad outreach efforts to encourage individuals to apply for coverage (through CHIP, Medicaid, or the Marketplaces) were well underway; such efforts in the past have been noted to apply upward pressure on CHIP enrollment. CHIP programs also face the same ACA requirements in terms of enrollment simplifications, coordination with Medicaid and the new Marketplaces, as well as the use of Modified Adjust Gross Income beginning in 2014. The full effect of these changes would occur just after this data collection period.
Problems implementing new enrollment systems for the Federally Facilitated Marketplace (FFM) and State Based Marketplaces (SBM) likely put downward pressure on CHIP enrollment growth. States and the Federal Government faced IT systems challenges, particularly early on in the open enrollment period, which may have applied some downward pressure on CHIP enrollment during this period. States that relied on FFMs had significant problems with “account transfers” from the FFM to agencies handling CHIP enrollment. Many children were assessed or determined eligible for CHIP through the FFMs, but because of system problems, accounts could not be easily transferred to effectuate enrollment. There were also some SBMs that also faced similar issues. Although problems persist, some progress in resolving these issues was made after the timeframe for this report.
Enrollment Trends
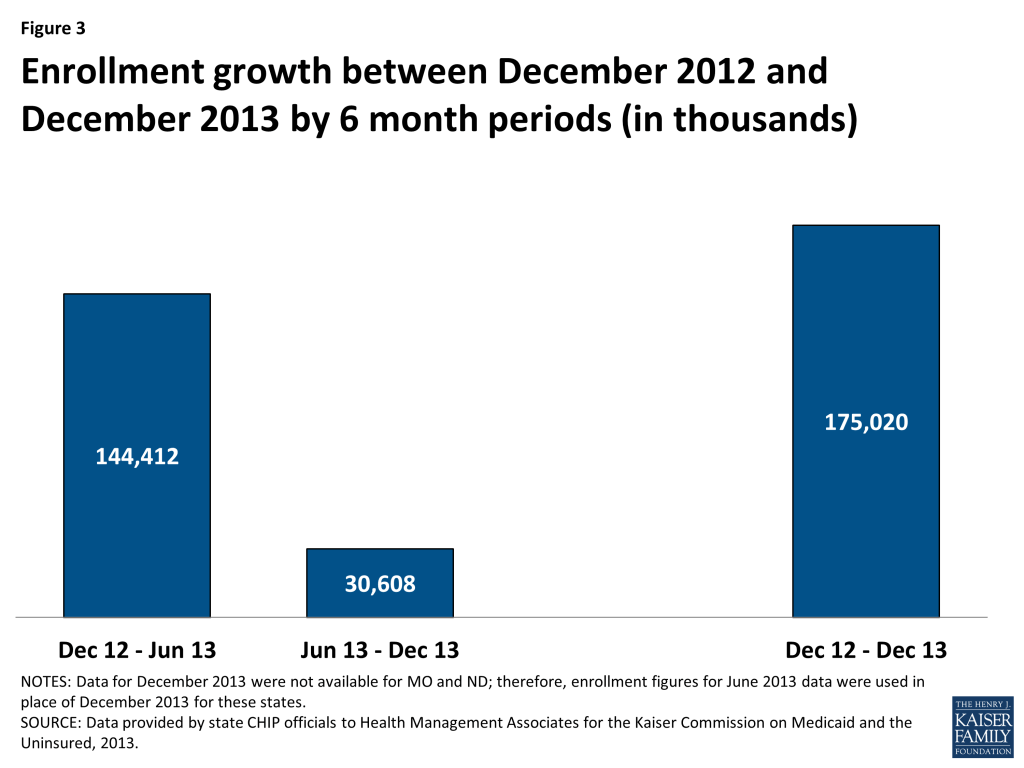
On net, CHIP enrollment increased by 175,020 between December 2012 and December 2013 despite slow enrollment growth in the second half of the period. CHIP enrollment increased to nearly 5.8 million as 175,020 more individuals (on net) were enrolled in coverage in December 2013 compared to December 2012. Enrollment growth over the year was on track with previous trends but slowed in the second half of this 12 month period (June 2013 to December 2013.) There were 144,412 more children on net enrolled in CHIP in June 2013 compared to December 2012; in contrast, CHIP enrollment increased by only 30,608 between June 2013 and December 2013. (Figure 3) The slow growth noted in the second half of the year (June 2013 to December 2013,) may be a reflection of the initial difficulties states and the federal government faced with IT systems and file transfers.
The net CHIP enrollment growth includes increases in 29 states and decreases in 22 states. Over half of states (29) reported enrollment increases during this period as 270,136 more children were enrolled in CHIP in these states in December 2013 compared to one year earlier. In contrast, 22 states saw enrollment declines as 95,116 fewer children were enrolled in these states in December 2013 compared to one year earlier. (Figure 4)
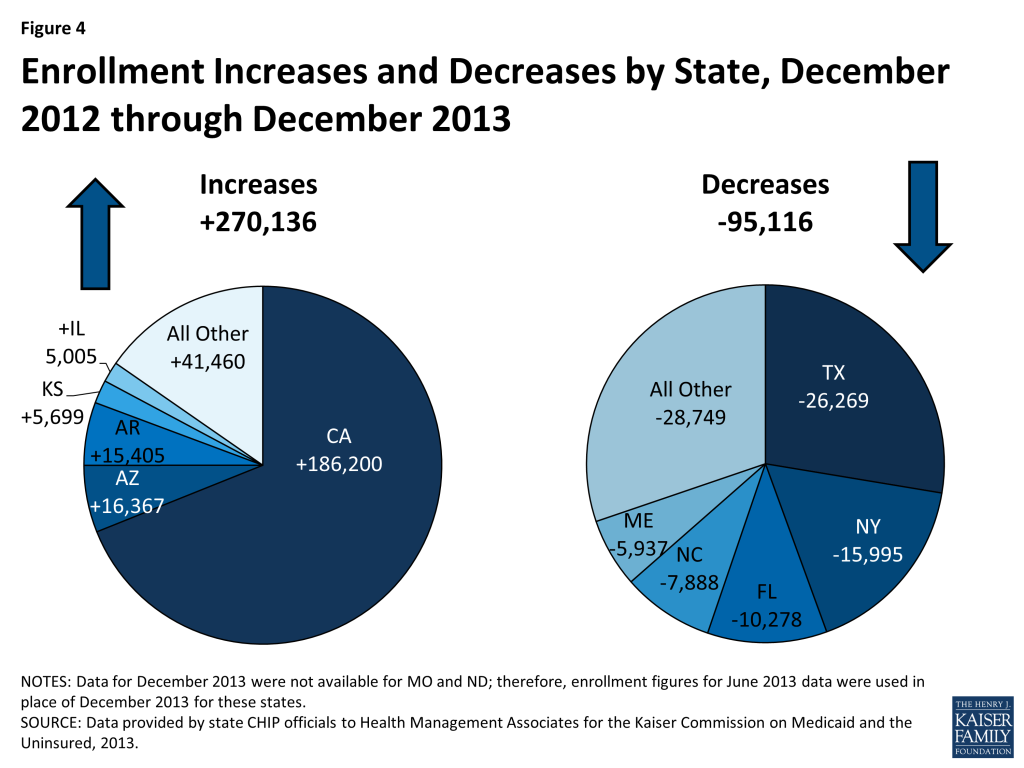
The three states that were driving these increases include:
- California’s CHIP enrollment increased in California by 16.4 percent as 186,200 additional children were enrolled in December 2013 compared to December 2012. It is important to note that the transition of children previously enrolled in the Title XXI Healthy Families to Medi-Cal (Medicaid) would not affect CHIP enrollment numbers reflected in this report because these children are still included in the CHIP counts. The increase in the number of children enrolled in CHIP may be related to outreach and enrollment efforts tied to expanded Medicaid and CHIP coverage programs in California, and also to the improving economy with children moving up the income scale between Medicaid and CHIP.
- Arizona saw CHIP enrollment growth of 54 percent as an additional 16,367 children were enrolled in CHIP in December 2013 compared to one year earlier due to a new temporary program, KidsCare II, that began enrolling children in May 2012. This program ended January 31, 2014; the state sent out notices to approximately 14,000 families with incomes over 133% FPL that they would need to apply for coverage through the Marketplace. The original KidsCare program still exists, but enrollment remains frozen, meaning no new applications are being accepted and children who lose this coverage due to failure to pay premiums will not be able to reenroll later. According to the state, just over 2,600 children remain enrolled in the original KidsCare program.5 The original KidsCare has been closed to new enrollment since December 2009 due to state budget shortfalls. CHIP enrollment steadily declined for several reporting periods, reaching its lowest level in over a decade in June 2012, when enrollment totaled only 12,238 (compared to over 64,000 before the enrollment freeze was first implemented.)
- Arkansas saw a 20 percent increase in CHIP enrollment between December 2013 and December 2012 as enrollment increased by 16,367. All of this enrollment growth occurred in the second half of the period; Arkansas actually saw a small decline in CHIP enrollment in the first six months of this period (December 2012 to June 2013.) It is likely that the sharp increase in enrollment was due in part to the state’s adoption of fast track enrollment options made available through CMS in an effort to help states launch the Medicaid expansion and efficiently enroll eligible individuals. Specifically, Arkansas was one of five states that implemented the fast track enrollment option allowing states to enroll individuals based on existing data from their Supplemental Nutrition Assistance Program. Arkansas, along with West Virginia, used this process to not only enroll adults but also children who were eligible but not enrolled.6
The largest declines in CHIP enrollment occurred in Texas, New York, and Flordia; the factors underlying these declines however are not readily apparent.
CONCLUSION
Overall, CHIP enrollment growth remained on track with previous trends, despite much slower growth seen in the second half of this period (June 2013 to December 2013.) Economic improvements apply both upward and downward pressure on CHIP enrollment; as income increases some children shift from Medicaid to CHIP while others transition off the program as their income rises above CHIP eligibility levels. Like Medicaid, CHIP programs also saw some upward (through increased outreach) and downward pressure (from enrollment systems issues) related to the implementation of the ACA. CHIP programs, along with state Medicaid programs continue to play a critical role in assuring health coverage for uninsured children. However, the future of the program remains uncertain as funding is slated to end in October 2015 unless Congress acts.
Methodology
The data in this report reflect the number of children, including individuals covered under the unborn child option, enrolled in CHIP programs in each state. State CHIP officials provided data specifically for the month of December 2013. States also were asked to review data in previous reports in this series and to update data as might be appropriate for previous periods. The data for this report were requested in March 2014; responses for most states were returned by May 2014. Data for specific states in reports issued by CMS may differ from data in this report. Beyond the “point-in-time” versus “ever-enrolled” counts described below, differences occur when states provide data for this report for a point-in-time other than the final day of a quarter, when states update enrollment counts, e.g., for retroactive eligibility of a Medicaid-expansion CHIP program.
The data in this report are “point-in-time,” meaning the number of individuals enrolled in a specific month, such as December 2013. A “point-in-time” count is distinct from the “ever-enrolled” count, which is provided in reports issued by CMS. The annual count of children ever-enrolled will always exceed the number enrolled at any point- in-time, as long as new enrollments and departures occur during the year. Recent experience shows that one-third of CHIP enrollees enrolled at any time during the year were not enrolled at the end of the year.
Net Change. The data collected for this report are net changes in enrollment across the program and within select eligibility groups, taking into account the net impact of children enrolling and disenrolling from the CHIP program. Because this data are not individual level data and states do not make a distinction between enrollment among current beneficiaries and new beneficiaries, it is not possible to determine from this data the number of children that left the program and the number that newly enrolled in a given time period. For example, this data set cannot be used to determine how many of the 5.8 million beneficiaries enrolled in December 2013 had been enrolled in December 2012.
Differences between this report and preliminary data released by CMS of monthly enrollment trends. Starting in April 2014, CMS began publishing monthly reports that include total Medicaid and CHIP enrollment as part of an initiative to provide data on a broad set of Medicaid and CHIP eligibility and enrollment performance indicators to inform program management and oversight.7 However, this data resource, while providing some of the most timely Medicaid and CHIP enrollment data in the program’s history, is still in its early stages of development. Notable differences between that data and the data provided here include:
- Inclusion of Medicaid. The CMS report combines enrollment figures for Medicaid (Title XIX) and CHIP (Title XXI.) We report these two groups separately; CHIP enrollment (Title XXI) is included in this report and Medicaid enrollment (Title XIX) is included in a separate report https://www.kff.org/medicaid/issue-brief/medicaid-enrollment-snapshot-december-2013.
- Reporting Method. CMS asks states to submit their enrollment data through an online portal each month, revising data reported for the previous month only. As discussed above, we ask states to report data for June and December of each year. States are asked to submit updated data as far back as they desire each time the data are collected.
- Retroactive Eligibles. Medicaid expansion CHIP programs allow for up to three months of retroactive eligibility. Because of the timeliness of the data collection process, the CMS data do not generally reflect retroactive enrollment. For this report, we ask states to include retroactive enrollment whenever possible.
- Trend. This data sources goes back to 2000, showing enrollment trends in monthly enrollment for December and June between 2000 and 2014. The CMS data captures monthly enrollment before open enrollment for the Marketplaces began (average of enrollment between June and September 2013) and enrollment for January, February and March 2014.
Tables
| Table A-1: Total CHIP Enrollment by State (Monthly Enrollment), December 2006 – 2013 | ||||||||
| State | 2006 | 2007 | 2008 | 2009 | 2010 | 2011 | 2012 | 2013 |
| Alabama | 65,739 | 70,078 | 70,858 | 72,206 | 75,246 | 83,865 | 85,762 | 84,431 |
| Alaska | 8,598 | 7,121 | 8,831 | 9,714 | 10,420 | 11,075 | 10,823 | 10,199 |
| Arizona | 58,246 | 64,115 | 64,377 | 46,886 | 23,980 | 13,536 | 30,394 | 46,761 |
| Arkansas | 69,076 | 68,319 | 67,426 | 67,420 | 70,152 | 71,823 | 77,768 | 93,173 |
| California* | 938,618 | 990,585 | 1,104,029 | 1,114,791 | 1,110,419 | 1,138,507 | 1,137,946 | 1,324,146 |
| Colorado | 45,404 | 57,985 | 62,778 | 69,640 | 66,577 | 72,037 | 85,028 | 88,513 |
| Connecticut | 16,579 | 16,460 | 13,100 | 14,726 | 13,793 | 13,185 | 12,709 | 12,874 |
| DC | 5,210 | 5,032 | 5,615 | 6,528 | 6,440 | 6,538 | 6,578 | 6,843 |
| Delaware | 4,950 | 6,008 | 6,301 | 6,397 | 5,487 | 6,356 | 6,908 | 6,285 |
| Florida | 201,616 | 231,177 | 218,717 | 236,671 | 255,169 | 251,450 | 256,551 | 246,273 |
| Georgia | 273,175 | 254,820 | 208,086 | 207,617 | 203,861 | 201,022 | 223,064 | 222,373 |
| Hawaii | 16,600 | 17,706 | 20,350 | 23,276 | 24,973 | 27,778 | 28,495 | 29,784 |
| Idaho | 16,624 | 25,680 | 28,408 | 27,852 | 22,250 | 25,071 | 24,017 | 26,166 |
| Illinois | 166,727 | 182,675 | 221,995 | 226,396 | 240,587 | 255,180 | 246,252 | 251,257 |
| Indiana | 71,963 | 72,091 | 69,364 | 75,706 | 82,599 | 97,143 | 83,466 | 84,541 |
| Iowa | 33,882 | 34,195 | 38,737 | 46,423 | 50,140 | 63,726 | 62,063 | 64,493 |
| Kansas | 35,181 | 37,748 | 39,606 | 39,554 | 39,522 | 46,601 | 50,402 | 56,101 |
| Kentucky | 52,067 | 53,467 | 53,575 | 61,398 | 64,114 | 69,206 | 66,782 | 64,844 |
| Louisiana | 100,672 | 113,140 | 126,035 | 122,856 | 125,052 | 122,487 | 121,208 | 121,699 |
| Maine | 14,196 | 14,187 | 15,130 | 16,859 | 15,969 | 16,760 | 17,946 | 12,009 |
| Maryland | 104,812 | 107,396 | 105,798 | 97,153 | 97,375 | 97,838 | 97,905 | 98,552 |
| Massachusetts | 88,178 | 97,339 | 98,588 | 106,995 | 117,380 | 114,113 | 116,870 | 121,775 |
| Michigan | 44,540 | 42,157 | 44,659 | 39,185 | 42,012 | 44,248 | 45,327 | 49,549 |
| Minnesota | 2,756 | 2,640 | 2,239 | 2,056 | 1,763 | 2,072 | 2,006 | 1,658 |
| Mississippi | 60,190 | 63,111 | 66,022 | 67,683 | 68,044 | 70,683 | 69,958 | 69,609 |
| Missouri* | 67,839 | 60,108 | 64,678 | 67,713 | 73,228 | 73,763 | 72,000 | 69,854 |
| Montana | 13,112 | 15,700 | 15,700 | 20,330 | 22,047 | 26,601 | 30,337 | 31,844 |
| Nebraska | 24,908 | 25,973 | 26,885 | 26,156 | 29,658 | 31,269 | 31,395 | 31,939 |
| Nevada | 28,039 | 29,456 | 23,356 | 21,515 | 21,002 | 24,364 | 20,880 | 22,116 |
| New Hampshire | 7,626 | 7,870 | 8,622 | 8,330 | 8,914 | 9,286 | 11,662 | 12,911 |
| New Jersey | 124,523 | 115,812 | 125,120 | 146,217 | 161,913 | 165,294 | 169,534 | 172,764 |
| New Mexico | 8,794 | 9,991 | 10,041 | 8,883 | 8,274 | 7,925 | 7,927 | 7,448 |
| New York | 387,204 | 371,985 | 366,649 | 389,947 | 400,086 | 425,178 | 476,718 | 460,723 |
| North Carolina** | 109,006 | 117,066 | 124,572 | 132,273 | 175,945 | 186,099 | 198,569 | 190,681 |
| North Dakota* | 4,488 | 4,820 | 4,635 | 4,184 | 4,767 | 4,816 | 4,943 | 4,956 |
| Ohio | 145,094 | 144,041 | 153,387 | 160,340 | 161,638 | 163,499 | 156,929 | 151,195 |
| Oklahoma | 66,593 | 65,290 | 67,589 | 71,163 | 67,984 | 60,570 | 71,768 | 73,867 |
| Oregon | 32,351 | 40,359 | 47,930 | 50,547 | 63,428 | 71,141 | 75,295 | 79,899 |
| Pennsylvania | 141,868 | 165,227 | 180,615 | 195,245 | 190,798 | 191,213 | 186,586 | 184,501 |
| Rhode Island | 12,716 | 11,328 | 12,182 | 13,595 | 14,821 | 15,533 | 15,244 | 15,647 |
| South Carolina | 33,253 | 41,468 | 50,390 | 55,145 | 59,113 | 65,027 | 67,321 | 66,818 |
| South Dakota | 11,162 | 11,575 | 11,943 | 12,254 | 12,905 | 13,107 | 13,436 | 13,712 |
| Tennessee | – | 46,367 | 61,998 | 74,078 | 77,157 | 77,864 | 79,431 | 84,349 |
| Texas | 326,231 | 398,818 | 514,774 | 561,929 | 571,257 | 596,145 | 622,920 | 596,651 |
| Utah | 33,206 | 31,536 | 37,754 | 42,296 | 37,686 | 37,131 | 36,078 | 33,877 |
| Vermont | 3,065 | 3,481 | 3,482 | 3,451 | 3,539 | 4,052 | 4,189 | 4,042 |
| Virginia | 81,300 | 86,503 | 95,468 | 100,618 | 106,873 | 111,703 | 117,750 | 113,216 |
| Washington | 12,075 | 21,011 | 23,242 | 26,424 | 30,654 | 31,384 | 31,965 | 28,293 |
| West Virginia | 25,273 | 24,839 | 24,374 | 25,053 | 24,323 | 24,888 | 24,802 | 25,011 |
| Wisconsin | 31,261 | 33,913 | 68,513 | 80,275 | 95,182 | 93,144 | 92,756 | 91,412 |
| Wyoming | 5,385 | 5,631 | 5,776 | 5,399 | 5,521 | 5,558 | 5,859 | 5,908 |
| Total | 4,231,971 | 4,525,400 | 4,890,299 | 5,109,348 | 5,262,037 | 5,438,854 | 5,592,522 | 5,767,542 |
| NOTES: Data refers to CHIP coverage of children (including those covered under the unborn child option) funded through Title XXI. *Two states (MO and ND) were not able to provide CHIP data for December 2013. CHIP enrollment data reported for here for December 2013 for MO and ND was from June 2013, not December 2013. **NC was unable to provided updated figures for Medicaid expansion CHIP; data reported here for December 2012 and 2013 reflect updated enrollment for standalone CHIP in this state, but reflect June 2012 data for Medicaid expansion CHIP in this state.SOURCE: Compiled by Health Management Associates from state CHIP enrollment reports for KCMU. | ||||||||
| Table A-2: Total CHIP Enrollment by State (Percentage Change), December 2005 – 2013 | ||||||||
State | 05-06 | 06-07 | 07-08 | 08-09 | 09-10 | 10-11 | 11-12 | 12-13 |
| Alabama | 0.5% | 6.6% | 1.1% | 1.9% | 4.2% | 11.5% | 2.3% | -1.6% |
| Alaska | -17.0% | -17.2% | 24.0% | 10.0% | 7.3% | 6.3% | -2.3% | -5.8% |
| Arizona | 7.1% | 10.1% | 0.4% | -27.2% | -48.9% | -43.6% | 124.5% | 53.8% |
| Arkansas | 10.6% | -1.1% | -1.3% | 0.0% | 4.1% | 2.4% | 8.3% | 19.8% |
| California* | 14.5% | 5.5% | 11.5% | 1.0% | -0.4% | 2.5% | 0.0% | 16.4% |
| Colorado | -1.1% | 27.7% | 8.3% | 10.9% | -4.4% | 8.2% | 18.0% | 4.1% |
| Connecticut | 13.1% | -0.7% | -20.4% | 12.4% | -6.3% | -4.4% | -3.6% | 1.3% |
| DC | 26.8% | -3.4% | 11.6% | 16.3% | -1.3% | 1.5% | 0.6% | 4.0% |
| Delaware | 6.3% | 21.4% | 4.9% | 1.5% | -14.2% | 15.8% | 8.7% | -9.0% |
| Florida | 4.0% | 14.7% | -5.4% | 8.2% | 7.8% | -1.5% | 2.0% | -4.0% |
| Georgia | 14.5% | -6.7% | -18.3% | -0.2% | -1.8% | -1.4% | 11.0% | -0.3% |
| Hawaii | 8.4% | 6.7% | 14.9% | 14.4% | 7.3% | 11.2% | 2.6% | 4.5% |
| Idaho | 20.2% | 54.5% | 10.6% | -2.0% | -20.1% | 12.7% | -4.2% | 8.9% |
| Illinois | 21.6% | 9.6% | 21.5% | 2.0% | 6.3% | 6.1% | -3.5% | 2.0% |
| Indiana | 1.1% | 0.2% | -3.8% | 9.1% | 9.1% | 17.6% | -14.1% | 1.3% |
| Iowa | -6.8% | 0.9% | 13.3% | 19.8% | 8.0% | 27.1% | -2.6% | 3.9% |
| Kansas | -5.1% | 7.3% | 4.9% | -0.1% | -0.1% | 17.9% | 8.2% | 11.3% |
| Kentucky | 2.5% | 2.7% | 0.2% | 14.6% | 4.4% | 7.9% | -3.5% | -2.9% |
| Louisiana | -8.0% | 12.4% | 11.4% | -2.5% | 1.8% | -2.1% | -1.0% | 0.4% |
| Maine | -3.5% | -0.1% | 6.6% | 11.4% | -5.3% | 5.0% | 7.1% | -33.1% |
| Maryland | 5.8% | 2.5% | -1.5% | -8.2% | 0.2% | 0.5% | 0.1% | 0.7% |
| Massachusetts | 17.7% | 10.4% | 1.3% | 8.5% | 9.7% | -2.8% | 2.4% | 4.2% |
| Michigan | -22.0% | -5.4% | 5.9% | -12.3% | 7.2% | 5.3% | 2.4% | 9.3% |
| Minnesota | 29.1% | -4.2% | -15.2% | -8.2% | -14.3% | 17.5% | -3.2% | -17.3% |
| Mississippi | -6.8% | 4.9% | 4.6% | 2.5% | 0.5% | 3.9% | -1.0% | -0.5% |
| Missouri* | -6.4% | -11.4% | 7.6% | 4.7% | 8.1% | 0.7% | -2.4% | -3.0% |
| Montana | 9.8% | 19.7% | 0.0% | 29.5% | 8.4% | 20.7% | 14.0% | 5.0% |
| Nebraska | 3.4% | 4.3% | 3.5% | -2.7% | 13.4% | 5.4% | 0.4% | 1.7% |
| Nevada | 2.7% | 5.1% | -20.7% | -7.9% | -2.4% | 16.0% | -14.3% | 5.9% |
| New Hampshire | -0.1% | 3.2% | 9.6% | -3.4% | 7.0% | 4.2% | 25.6% | 10.7% |
| New Jersey | 1.2% | -7.0% | 8.0% | 16.9% | 10.7% | 2.1% | 2.6% | 1.9% |
| New Mexico | -24.2% | 13.6% | 0.5% | -11.5% | -6.9% | -4.2% | 0.0% | -6.0% |
| New York | -3.5% | -3.9% | -1.4% | 6.4% | 2.6% | 6.3% | 12.1% | -3.4% |
| North Carolina | -18.8% | 7.4% | 6.4% | 6.2% | 33.0% | 5.8% | 6.7% | -4.0% |
| North Dakota* | 21.7% | 7.4% | -3.8% | -9.7% | 13.9% | 1.0% | 2.6% | 0.3% |
| Ohio | 15.7% | -0.7% | 6.5% | 4.5% | 0.8% | 1.2% | -4.0% | -3.7% |
| Oklahoma | 9.6% | -2.0% | 3.5% | 5.3% | -4.5% | -10.9% | 18.5% | 2.9% |
| Oregon | 10.8% | 24.8% | 18.8% | 5.5% | 25.5% | 12.2% | 5.8% | 6.1% |
| Pennsylvania | 2.7% | 16.5% | 9.3% | 8.1% | -2.3% | 0.2% | -2.4% | -1.1% |
| Rhode Island | 6.1% | -10.9% | 7.5% | 11.6% | 9.0% | 4.8% | -1.9% | 2.6% |
| South Carolina | -24.0% | 24.7% | 21.5% | 9.4% | 7.2% | 10.0% | 3.5% | -0.7% |
| South Dakota | -0.1% | 3.7% | 3.2% | 2.6% | 5.3% | 1.6% | 2.5% | 2.1% |
| Tennessee | – | – | 33.7% | 19.5% | 4.2% | 0.9% | 2.0% | 6.2% |
| Texas | 1.0% | 22.3% | 29.1% | 9.2% | 1.7% | 4.4% | 4.5% | -4.2% |
| Utah | -5.1% | -5.0% | 19.7% | 12.0% | -10.9% | -1.5% | -2.8% | -6.1% |
| Vermont | -1.7% | 13.6% | 0.0% | -0.9% | 2.5% | 14.5% | 3.4% | -3.5% |
| Virginia | 6.3% | 6.4% | 10.4% | 5.4% | 6.2% | 4.5% | 5.4% | -3.9% |
| Washington | -40.6% | 74.0% | 10.6% | 13.7% | 16.0% | 2.4% | 1.9% | -11.5% |
| West Virginia | 2.5% | -1.7% | -1.9% | 2.8% | -2.9% | 2.3% | -0.3% | 0.8% |
| Wisconsin | 6.0% | 8.5% | 102.0% | 17.2% | 18.6% | -2.1% | -0.4% | -1.4% |
| Wyoming | 10.1% | 4.6% | 2.6% | -6.5% | 2.3% | 0.7% | 5.4% | 0.8% |
| Total | 4.4% | 6.9% | 8.1% | 4.5% | 3.0% | 3.4% | 2.8% | 3.1% |
| NOTES: Data refers to CHIP coverage of children (including those covered under the unborn child option) funded through Title XXI. *Two states (MO and ND) were not able to provide CHIP data for December 2013. CHIP enrollment data reported for here for December 2013 for MO and ND was from June 2013, not December 2013. **NC was unable to provided updated figures for Medicaid expansion CHIP; data reported here for December 2012 and 2013 reflect updated enrollment for standalone CHIP in this state, but reflect June 2012 data for Medicaid expansion CHIP in this state.SOURCE: Compiled by Health Management Associates from state CHIP enrollment reports for KCMU. | ||||||||
Endnotes
- Kaiser Commission on Medicaid and the Uninsured, The Uninsured: A Primer – Key Facts about Health Insurance on the Eve of Coverage Expansions. (Washington, DC: Kaiser Commission on Medicaid and the Uninsured,) October 2013. http://modern.kff.org/report-section/the-uninsured-a-primer-2013-3-how-and-why-has-the-number-of-uninsured-people-changed/. ↩︎
- While most children with income up to 400% FPL that do not qualify for CHIP in their state will be eligible for tax credits to purchase coverage in the Marketplace, some children will not be eligible for tax credits because a parent may have access to “affordable” employer coverage. However, the affordability test for employer coverage is based on a calculation of the individual coverage relative to a workers wages (not the cost of a family policy). This situation is referred to as the “family glitch.” ↩︎
- See Medicaid/CHIP MAGI Eligibility Levels by FPL, Medicaid Moving Forward 2014, Eligibility Data http://medicaid.gov/AffordableCareAct/Medicaid-Moving-Forward-2014/medicaid-moving-forward-2014.html#. ↩︎
- Wesley Prater and Joan Alker, Georgetown University Center for Children and Families, Aligning Eligibility for Children: Moving the Stairstep Kids to Medicaid, (Washington, DC: Kaiser Commission on Medicaid and the Uninsured,) August 2013. http://modern.kff.org/medicaid/issue-brief/aligning-eligibility-for-children-moving-the-stairstep-kids-to-medicaid/. ↩︎
- “KidsCare II – Arizona’s Temporary Children’s Health Insurance Program (CHIP) ends January 31, 2014; Regular KidsCare Enrollment Update,” Arizona Health Care Cost Containment System (AHCCCS), accessed May 27, 2014. http://www.azahcccs.gov/applicants/KidsCareII.aspx. KidsCare Coverage Moving Forward. Arizona Health Care Cost Containment System (AHCCCS), (Arizona: AHCCCS,) June 26, 2013. http://www.azahcccs.gov/publicnotices/Downloads/KidsCareCoverage.pdf ↩︎
- Artiga, Samantha. Fast Track to Coverage: Facilitating Enrollment of Eligible People into the Medicaid Expansion. (Washington, DC: Kaiser Family Foundation,) November 2013. https://modern.kff.org/medicaid/issue-brief/fast-track-to-coverage-facilitating-enrollment-of-eligible-people-into-the-medicaid-expansion/. ↩︎
- See Monthly Medicaid and CHIP reports, Medicaid Moving Forward 2014, Eligibility Data http://medicaid.gov/AffordableCareAct/Medicaid-Moving-Forward-2014/medicaid-moving-forward-2014.html#. ↩︎