As the Economy Improves, the Number of Uninsured Is Falling But Not Because of a Rebound in Employer Sponsored Insurance
Executive Summary
The “Great Recession” that started roughly in 2007 and peaked in 2010 affected many individuals, indicated by steep rises in unemployment and accompanying declines in incomes and increases in poverty rates. These economic changes were accompanied by changes in health insurance coverage. Coverage trends since the start of the recession and in the post-2010 recovery are associated not only with these direct economic effects, but also with broader demographic trends, existing underlying coverage trends, changes in workforce, and regional population shifts. This brief examines changes in insurance coverage in light of all these factors.
The recession was marked by an increase of almost 6 million uninsured individuals between 2007 and 2010. The losses in coverage were mostly driven by large numbers of individuals losing employer-sponsored insurance, although gains in Medicaid coverage partly offset these losses. The recession caused an increase in the low-income population, a group that tends to have lower employer coverage rates, higher Medicaid coverage rates, and higher uninsured rates than other groups. Increased economic opportunities after the recession between 2010 and 2012 saw this population decrease, and correspondingly saw a decrease in national uninsured rates.
The main contributor to increasing post-recession coverage rates, even with increased employment, was Medicaid, not employer coverage. Employer coverage rates did stabilize after 2010 after long trends of decline predating the recession, but this change was likely caused by provisions in the Affordable Care Act (ACA) that allowed young adults to continue as dependents on parents’ private plans until age 26. Although full-time work increased and joblessness decreased after the recession, employer coverage rates continue to decline for many. This is especially true in small-to-medium firms and in firms that have historically low coverage rates. These firms grew the most among all firms in terms of employment after the recession.
Population shifts also contributed to coverage trends. The Northeast and Midwest, despite having the largest gains in coverage post-recession (partly because of Medicaid policies), also saw decreases in overall population. The West had slightly lower gains in coverage while the South did not experience significant gains in coverage. However, these regions experienced population growth. This dynamic will be important in considering the ACA’s impact, since most states that are not currently expanding Medicaid are in these two regions.
Issue Brief: Introduction
Though the effects of the Great Recession, which peaked in 2010, are still being felt today, the economy is slowly improving. Since 2010, the unemployment rate has fallen, while real gross domestic product (GDP) and real personal incomes have increased. In this brief we address the question of whether the decline in employer sponsored insurance (ESI) and the associated increases in uninsured rates that occurred with the sharp decline in economic activity between 2007 and 2010 have begun to reverse now that the economy is improving. We find that there has been very little change in the ESI rate, in fact there is some evidence that it is continuing to decline albeit at a much slower rate. There continues to be an increase in public coverage which has resulted in a decline in the number of uninsured in the last two years, both among adults and children. There has been an increase in ESI coverage among young adults, because of the Affordable Care Act (ACA) provisions allowing them to retain family coverage.
Issue Brief: The Improving Economic Picture
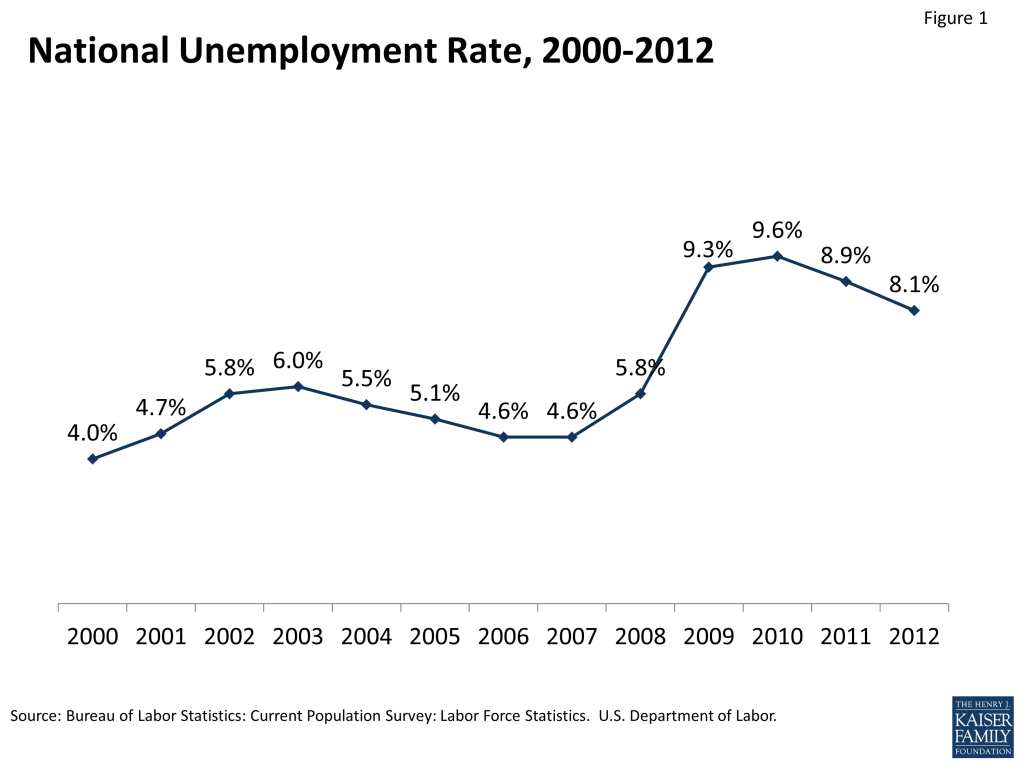
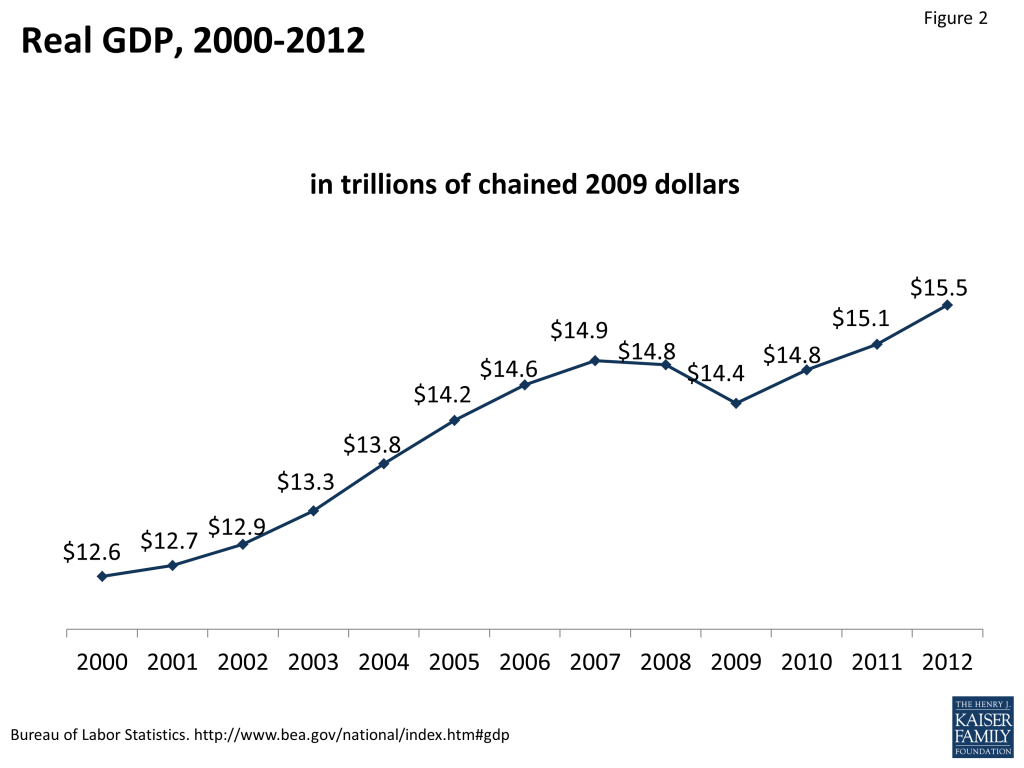
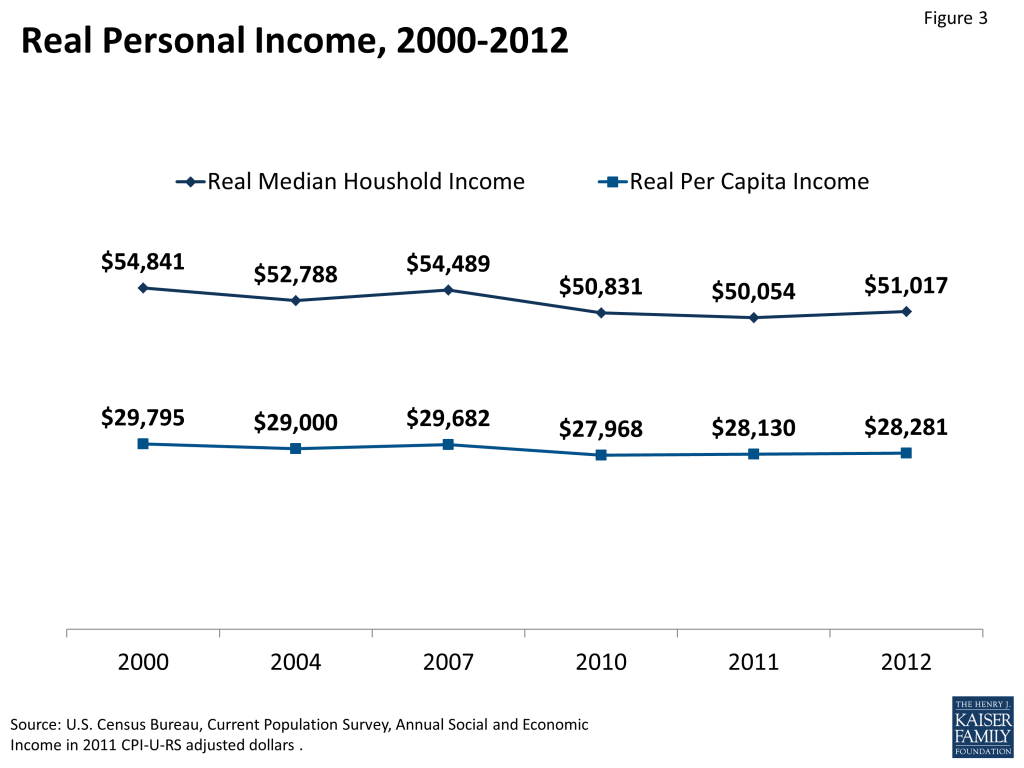
Economic indicators suggest a modest economic recovery since the peak of the recession in 2010. The unemployment rate increased from 4.6 percent in 2007 to peak at 9.6 percent in 2010 (Figure 1). By 2012, the unemployment rate had fallen to 8.1 percent. The most recent data (December 2013) show that the unemployment rate has continued to fall to 6.7 percent. Real GDP fell from $14.9 trillion in 2007 to $14.4 trillion in 2009. Beginning in 2010, real GDP has increased reaching $15.5 trillion in 2012 (Figure 2). Real personal incomes, shown in Figure 3, fell between 2007 and 2010 but increased by 2012. Real median household income fell from $54,489 in 2007 to $50,831 in 2010, but reached $51,017 by 2012. Real per capita income fell from $29,682 in 2007 to $27,968 in 2010 and increased to $28,281 by 2012.
Issue Brief: Changes In Coverage Among The Nonelderly Population
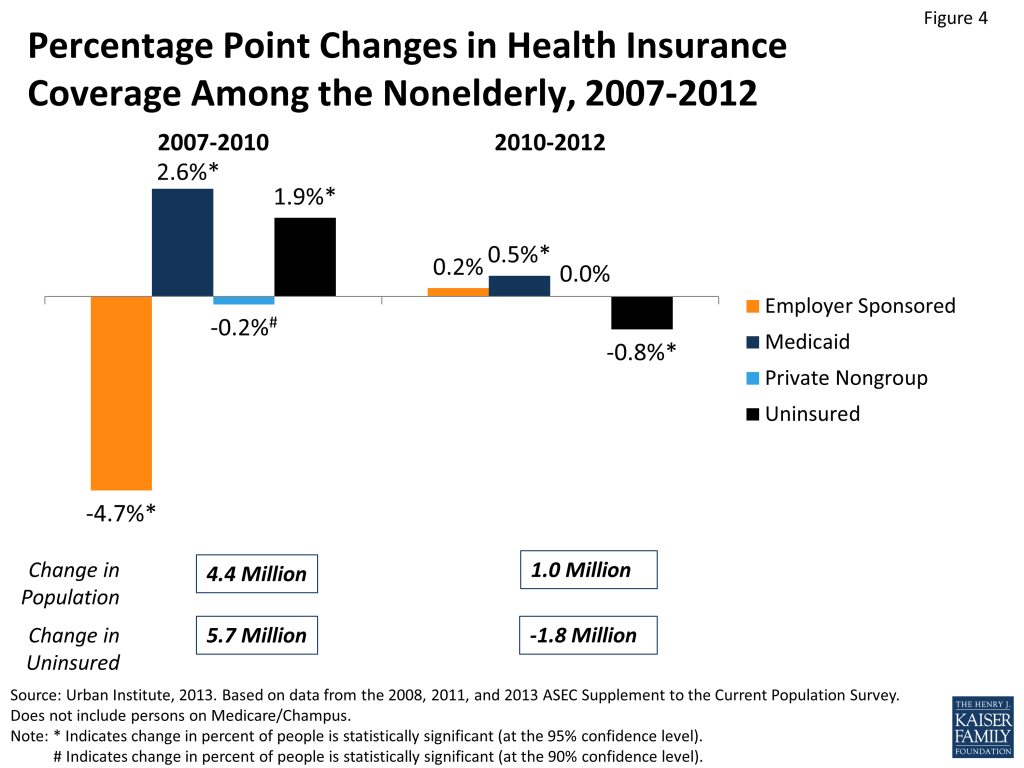
Figure 4 and Table 1 show the changes in health insurance coverage between 2007 and 2012. In the early years of the recession, from 2007 to 2010, the ESI rate fell dramatically from 64.3 percent to 59.7 percent. During this period, 9.5 million people lost ESI coverage. There was no significant change in the rate of private non-group coverage during this period. Some of the loss of ESI was offset by increases in Medicaid and Children’s Health Insurance Program (CHIP) coverage. There was an increase in Medicaid/CHIP coverage from 11.8 percent to 14.4 percent from 2007 to 2010, meaning 7.4 million more people had public coverage. The net result was an increase in the uninsured rate from 16.6 percent to 18.5 percent, an increase of 5.7 million individuals, between 2007 and 2010. Between 2010 and 2012, when the economy began to improve, the loss of health insurance coverage generally halted (Figure 4). There was no change in the non-group coverage rate. However, there was an increase of 0.5 percentage points in Medicaid and CHIP coverage, meaning 1.5 million people gained Medicaid or CHIP coverage. There were also an additional 1.1 million individuals who had ESI coverage, mostly young adults (data not shown). These modest increases in coverage resulted in the uninsured rate falling from 18.5 percent to 17.7 percent and the number of uninsured falling by 1.8 million.
Changes in Coverage by Income
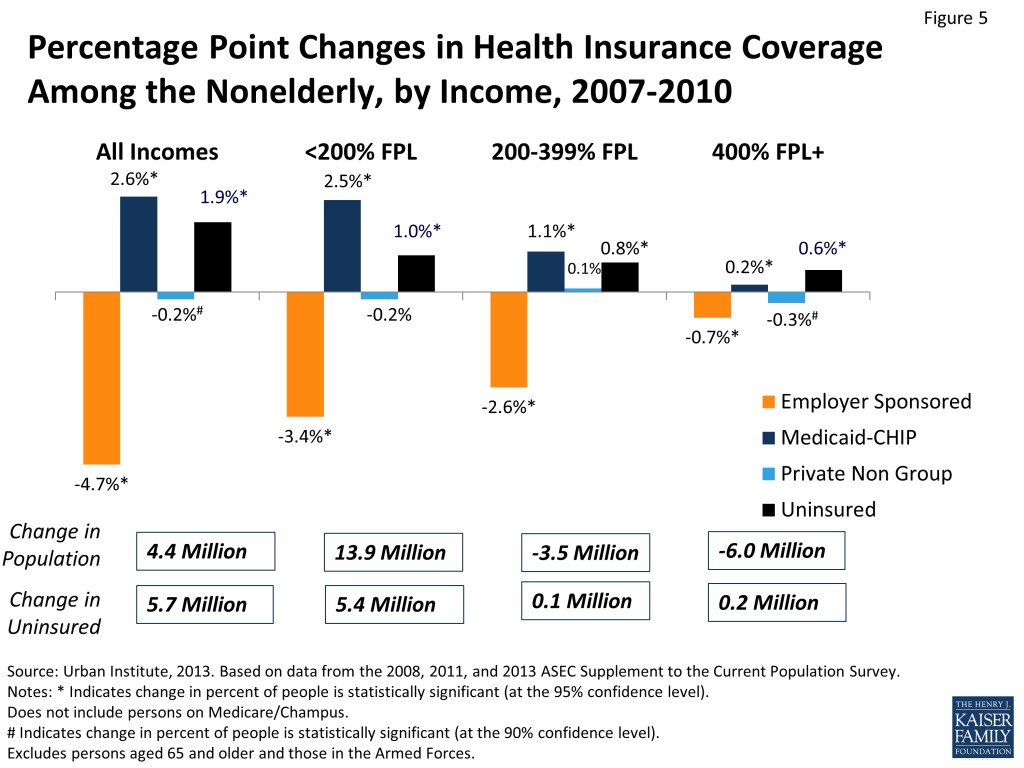
Much of the change in uninsured between 2007 and 2012 occurred among those with incomes below 200 percent of the federal poverty level (FPL). Between 2007 and 2010, the number of people in the middle-income group – those with incomes of 200 to 399 percent FPL – fell by 3.5 million and the number of individuals with incomes at or above 400 percent FPL fell by 6.0 million. All of the net population growth was among those with incomes below 200 percent FPL. Over the three-year period, an additional 13.9 million people had incomes below 200 percent FPL (Figure 5). The lowest income group experienced the sharpest decline in ESI coverage – from 31.4 percent to 28.1 percent. They also experienced the largest increase in Medicaid/CHIP coverage. The uninsured rate in this group increased from 31.2 to 32.3 percent, and there was an increase of 5.4 million uninsured low-income individuals. This increase in the uninsured population happened because of both the increase in the uninsured rate and the increase in the size of the low-income population.
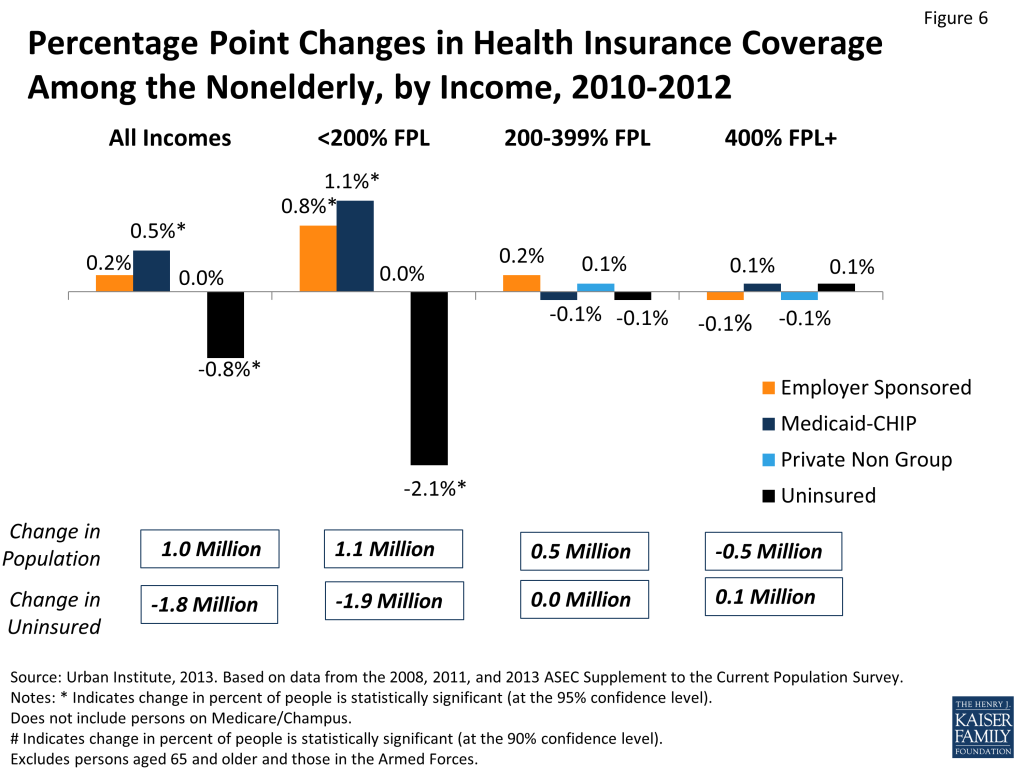
Between 2010 and 2012, the most important changes (Figure 6) continued to occur among low-income individuals. The low-income population continued to increase, though not as much as in the previous three years. Almost all of the increase in public coverage occurred among those with incomes below 200 percent FPL, as did virtually all of the reduction in the uninsured. Among those with incomes below 200 percent FPL, the number of uninsured fell by 1.9 million, accounting for the entire drop in the number of uninsured over this period.
Changes in Coverage by Age
Historically, coverage options for adults—particularly low-income adults—were more limited than those for children due to limits on Medicaid eligibility for adults. We next examine the changes in insurance coverage for adults and children separately, given the differences in availability of public coverage between the two groups.
Adults
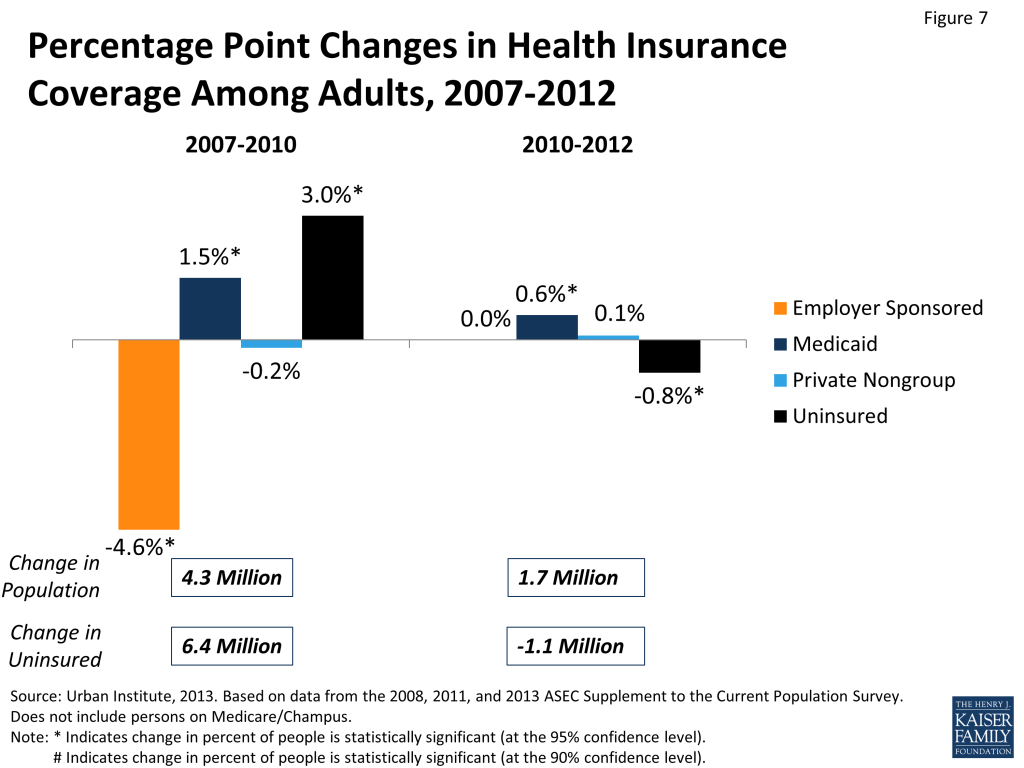
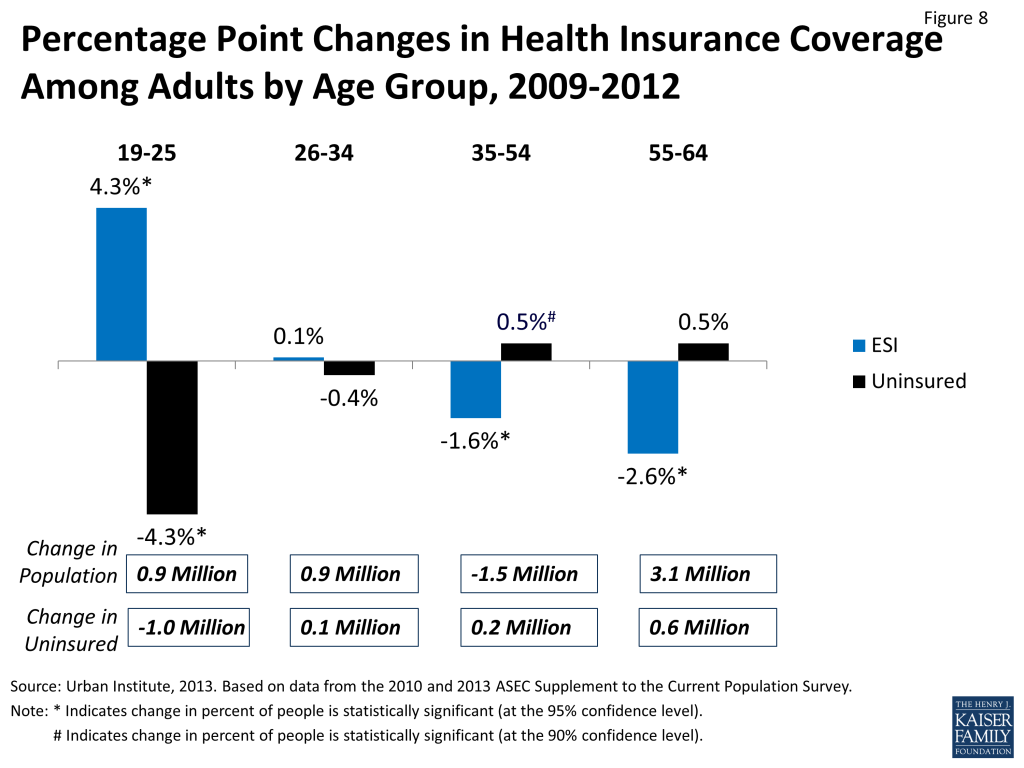
There was a 4.6 percentage point decline in ESI among adults in the early years of the recession, which was partially offset by a 1.5 percentage point increase in Medicaid enrollment (Figure 7). Thus, the uninsured rate increased by 3.0 percentage points, from 19.1 percent to 22.0 percent. The increase in the number of uninsured adults was 6.4 million from 2007 to 2010. Most of the increase was among low-income adults, where the number of uninsured increased by 5.6 million (Table 2). Between 2010 and 2012, the overall ESI rate among adults did not change, but as a result of the increase in public and nongroup coverage, the uninsured rate declined by 0.8 percentage points, from 22.0 to 21.3 percent. The number of uninsured adults declined by 1.1 million. All of the decline was among low-income adults (Table 2). Changes in coverage among adults are affected by ACA provisions that allow young adults to stay on their parents’ policy. Because the policy was enacted in 2010, in Figure 8 we used 2009 as the base year because we wanted to make sure that we were able to clearly see the effects pre and post implementation of the provision. Although there appears to have been no real change in ESI coverage among adults between 2009 and 2012, there are in fact two offsetting trends that become apparent when ESI coverage among adults is broken out by age cohorts. Figure 8 and Table 3 show that among young adults (ages 19-26), ESI coverage increased by 4.3 percentage points from 2009 to 2012. In contrast, during this same period, individuals in the two oldest age groups (ages 35-54 and ages 55-64) experienced a continuing decline in ESI coverage. For those between the ages of 35 and 54 there was a statistically significant decrease in ESI coverage of 1.6 percentage points, and adults between the ages of 55 and 64 saw an even larger loss of ESI coverage of 2.6 percentage points. The overall rates of ESI among adults appear to be flattening out because the dramatic increase in ESI among young adults is masking the continuing decrease in ESI that is occurring among the two older age cohorts. The age-related trends underlying the seemingly constant rate of ESI among all adults have significant implications. The increase in ESI among young adults implies that the provision in the ACA that allow children up to age 26 to stay on their parents’ insurance as of September 2010 is having the intended effects; whereas the decrease in ESI among older individuals, ages 35-64, indicates that the bulk of the working force is continuing to experience significant declines in ESI coverage.
Children
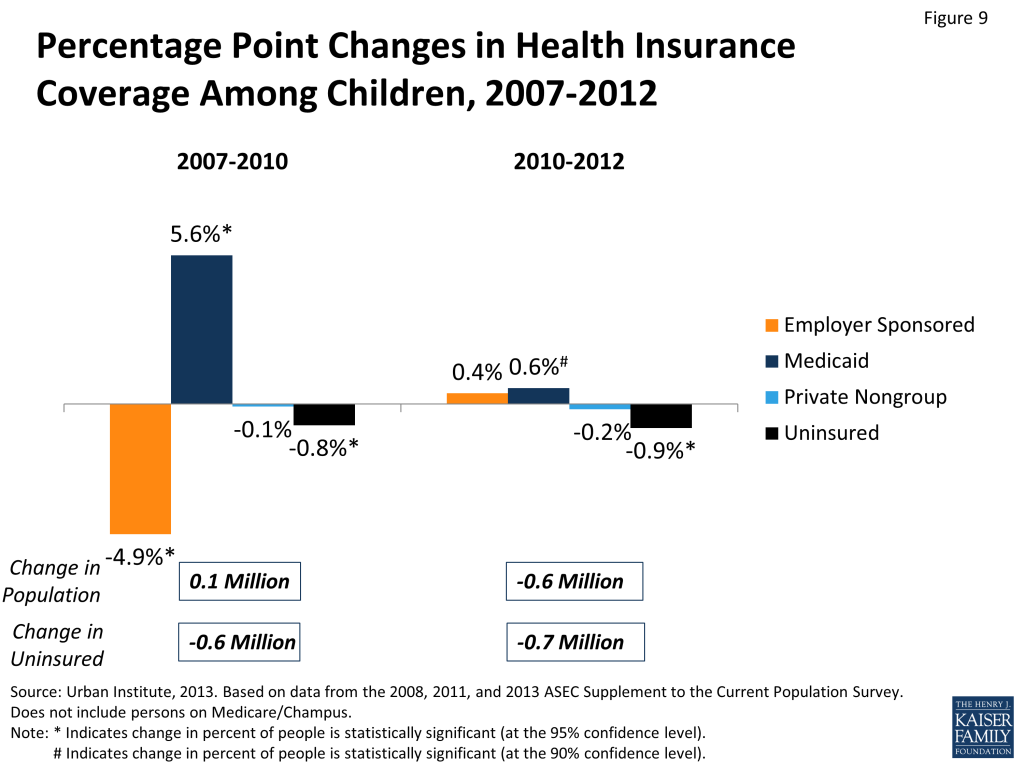
Patterns of coverage changes between 2007 and 2012 differ between children and adults. In the early years of the Great Recession, 2007 to 2010, the decline in ESI coverage was slightly larger for children than for adults: the ESI rate for children dropped 4.9 percentage points compared to 4.6 for adults. However, there was a much larger increase in Medicaid and CHIP coverage for children than there was for adults. Among children, Medicaid/CHIP coverage rose from 23.5 percent to 29.1 percent, or an increase of 4.4 million children (Figure 9). As a result, despite the severe recession and sharp decline in ESI coverage, the uninsured rate actually fell for children. Between 2007 and 2010, the number of uninsured children fell by 600,000. Between 2010 and 2012, there was a small but not statistically significant increase in the ESI rate among children, and there was a small increase in public coverage (Figure 9). Because of the small increases in public and private coverage, there was a small decline in the uninsured rate among children, from 10.1 percent to 9.2 percent, a decrease of 700,000 children. Thus, the uninsured rate for children declined in both periods throughout 2007 to 2012.
Changes in Coverage by Family Work Status
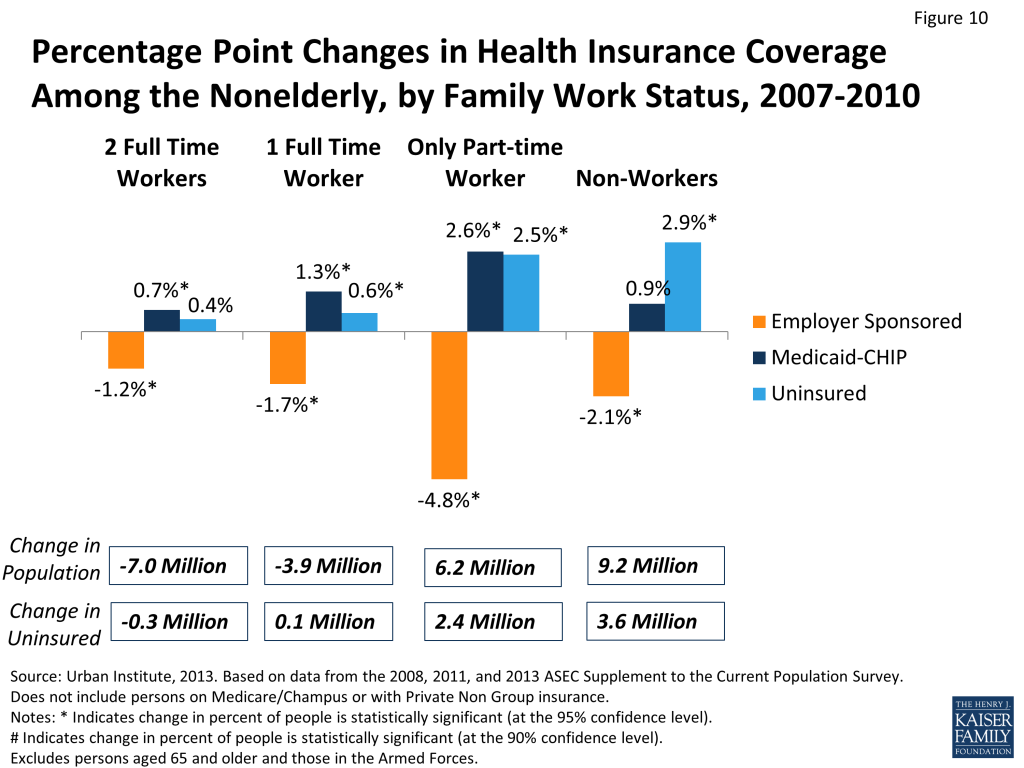
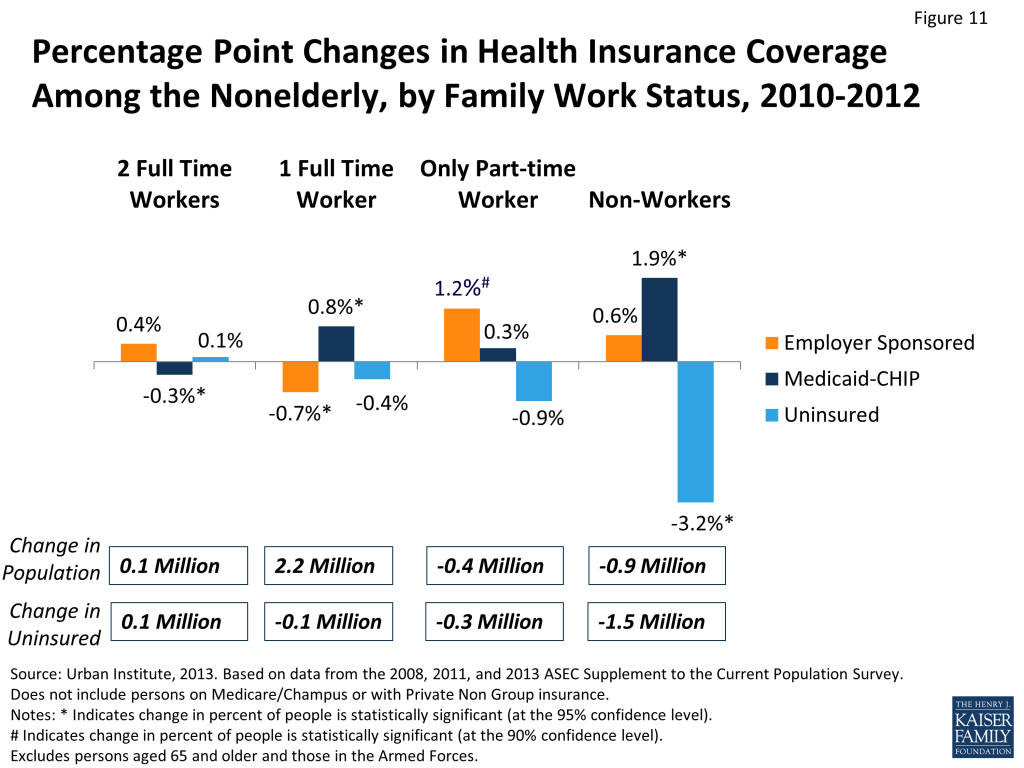
Consistent with declines in incomes, there were major shifts in patterns of family work status during the recession (Table 5). The number of individuals in households with one or two full-time workers fell by 3.9 million and 7.0 million respectively between 2007 and 2010 (Figure 10). At the same time, there was an increase of 6.2 million in the number of individuals living in households with only part-time workers and an increase of 9.2 million individuals living in households with no workers. Since the likelihood of lacking ESI coverage and the uninsured rate is much higher in households with only a part-time worker or no workers, the changes in employment affected the ESI rates. In addition to changes in work status, there were declines in ESI rates both among those who remained in two full-time workers or one full-time worker households by 1.2 percentage points and 1.7 percentage points respectively. Similarly, there were declines in rates of ESI in households with only a part-time worker or no workers as well. Thus, declines in ESI coverage were not simply caused by the shift from full-time to part-time and no worker households; the likelihood of having ESI coverage also declined among households with workers of any work status. Because of the shifts among work status groups, all of the increase in the uninsured occurred among individuals living in households with part-time or no-workers; increases of 2.4 million and 3.6 million uninsured people respectively. From 2010 to 2012 this pattern changed (Figure 11). There was an increase of 2.2 million individuals living in households with one full-time worker and declines in the number of individuals living in households with only a part-time and no worker. There was a small increase in the rate of ESI for families with 2 full-time workers, with part-time workers and with no workers, though the increase was only significant for families with a part-time workers. Among households with one full-time worker the ESI rate continued to decline from 64.7 percent to 64.0 percent. Thus, among those in households with one full-time worker – almost 140 million people – the likelihood of ESI coverage is continuing to fall.
Changes in Coverage by Demographic Characteristics
In addition to declines in incomes and employment discussed in previous sections, there were also two important demographic changes that have occurred in recent years. The first is the decline in the white population and an increase in the number of Hispanics, blacks, and “others.” The “others” category includes American Indians, Alaska Natives, Asians, Pacific Islanders, and anyone with two or more races.. From 2007 to 2012, the white population declined by 6.1 million people while the number of Hispanics increased by 6.5 million and “others” by 4.5 million. The shift in demographics is important particularly since Hispanics have much lower rates of ESI and higher uninsured rates than whites. The “other” group tends to have coverage patterns that are much closer to that of whites. In addition, geographically, there was stagnant population growth in the Northeast, a decline in population size in the Midwest, and increases of 4.0 million and 2.0 million people in the South and West respectively. Thus, the population continued to shift toward regions in which there were lower ESI rates and higher likelihood of being uninsured.
Race/Ethnicity
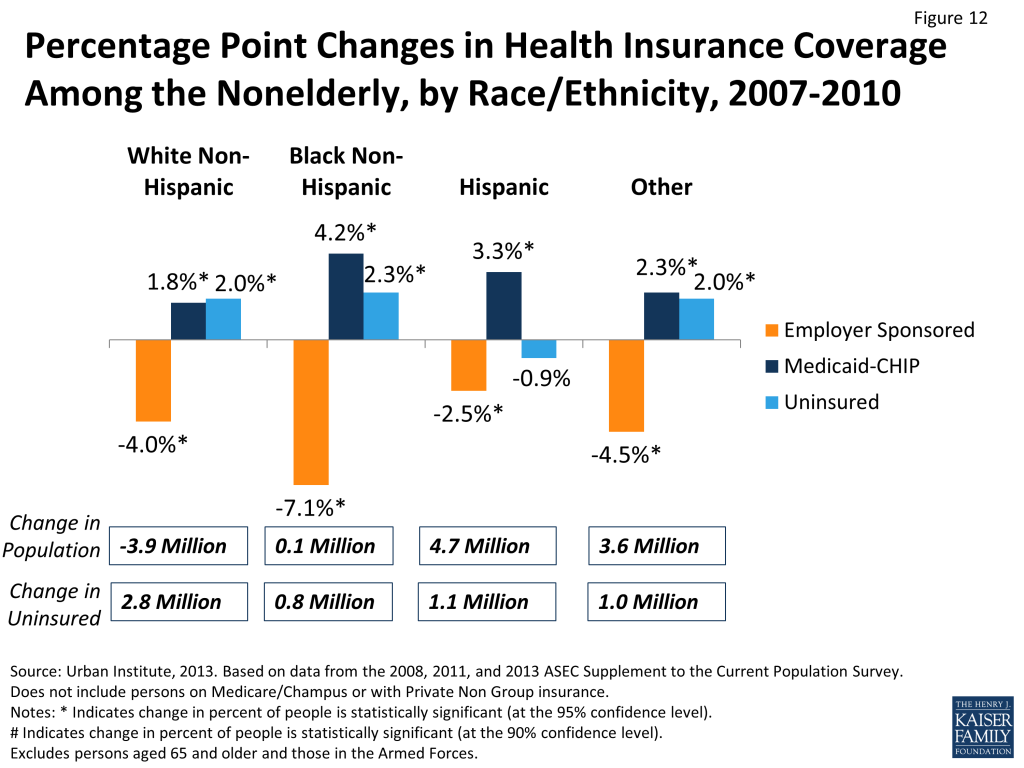
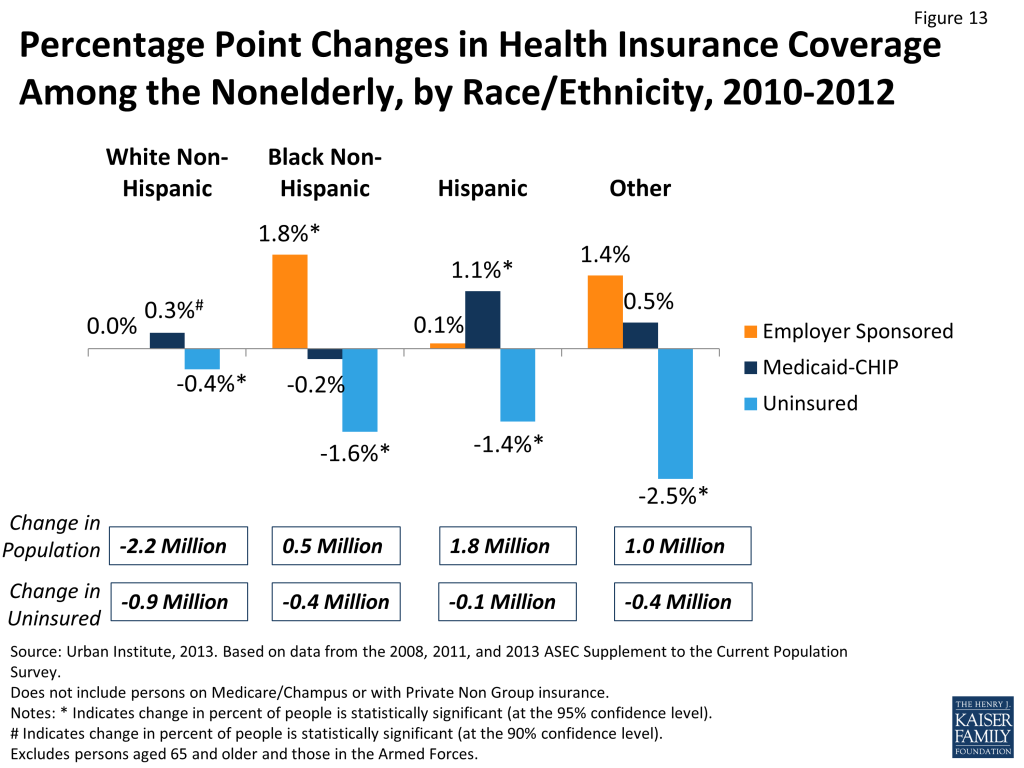
Between 2007 and 2010, all racial and ethnic groups saw declines in ESI and increases in uninsured rates (Table 6 and Figure 12). Among whites, there was a decline in ESI coverage, which was somewhat offset by Medicaid and CHIP coverage. The uninsured rate among whites increased from 11.7 percent to 13.7 percent and the number of uninsured increased by 2.8 million. Among blacks, there was a very large drop in ESI coverage from 53.4 percent to 46.3 percent. Again, some of this was offset by public coverage, but the uninsured rate increased from 19.9 percent to 22.1 percent and the number of uninsured black individuals increased by 800,000. Hispanics saw a smaller than average drop in ESI coverage although ESI coverage rates were already lower than those for other groups. Hispanics also experienced an increase in public coverage and no significant change in uninsured rate. However, because of the increase in the size of Hispanic population, the number of uninsured Hispanics increased by 1.1 million. The “other” group saw a decline in ESI coverage about equal to the national average. Public coverage for this group increased, as did the uninsured rate from 17.0 percent to 19.0 percent. The increase in the number of uninsured in this group was 1.0 million. Racial and ethnic group coverage trends changed starting in 2010 (Figure 13). From 2010 to 2012, the ESI rate stayed constant for whites but increased sharply for blacks. There were small, but statistically insignificant changes in ESI rates for the other two racial and ethnic groups. Overall, there was an increase in public coverage, particularly among Hispanics. The uninsured rate declined for each group, larger declines for blacks, Hispanics, and ”others”; 1.6 percentage points, 1.4 percentage points, and 2.5 percentage points respectively. The stabilization of ESI rates, or in some cases increases, coupled with continued small increases in public coverage led to an overall decline in uninsured rates for all racial and ethnic groups. For each group, there were fewer uninsured individuals. But for each group the rate of ESI coverage was lower in 2012 than it was in 2007.
Geographic Region
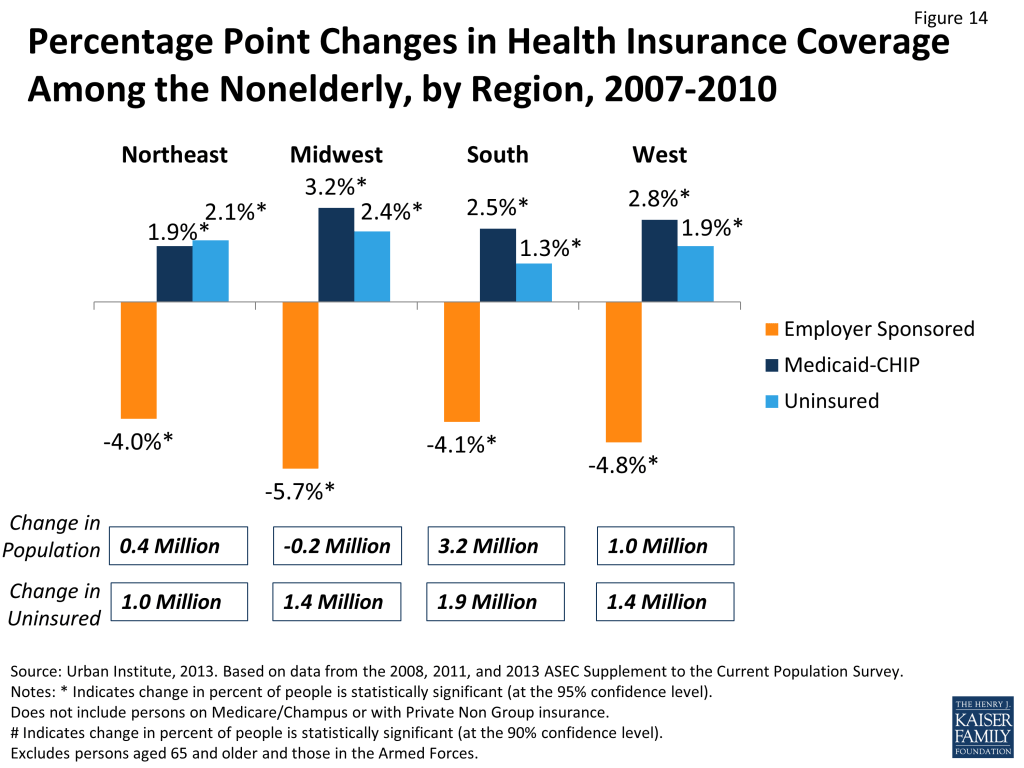
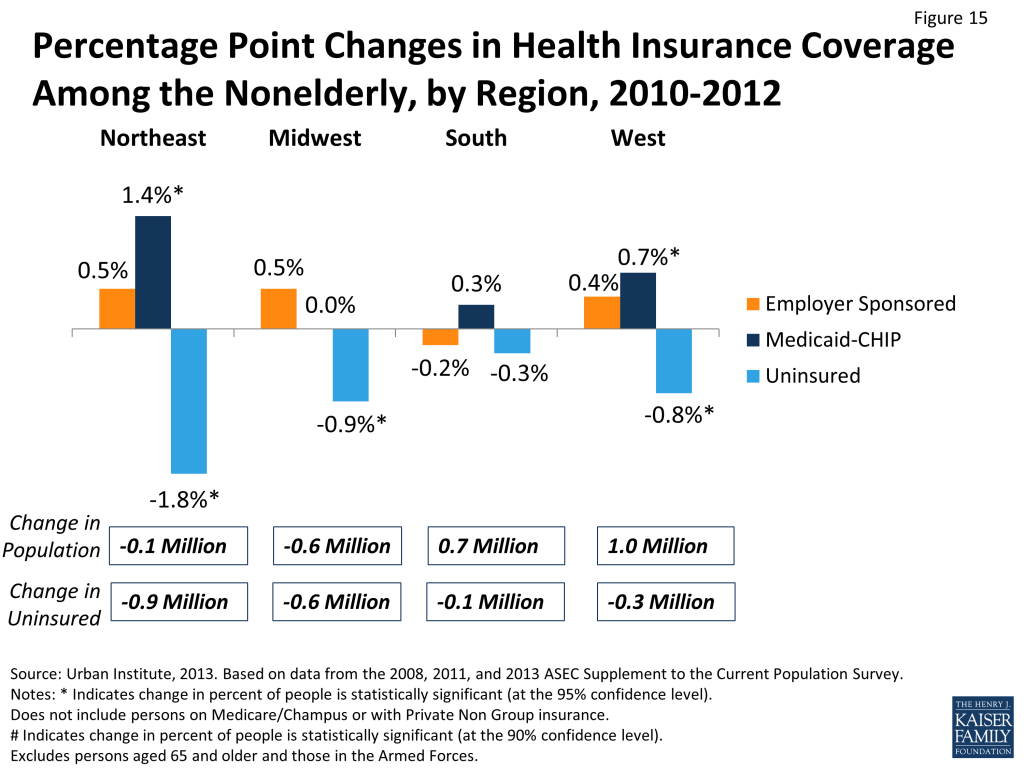
The shift in populations among regions between 2007 and 2010 was also important, as regions have different underlying uninsured rates and ESI rates. Overall, the shift of the population towards the South and West lowered ESI rates and raised uninsured rates nationwide, as these regions have lower coverage rates than other regions. Still, all regions saw drops in ESI and increases in uninsured between 2007 and 2010 (Figure 14). The Northeast, which saw little change in overall population, had a sharp decline of 4.0 percentage points in the ESI rate and an increase in the uninsured rate of 2.1 percentage points. The number of uninsured in the Northeast increased by 1.0 million. The Midwest saw the sharpest drop in ESI coverage – 5.7 percentage points – and the largest increase in the uninsured rate – 2.4 percentage points, corresponding to 1.4 million more uninsured people. The South saw a 4.1 percentage point decline in the ESI coverage rate that was partially offset by an increase in Medicaid and CHIP coverage. But the uninsured rate in the South increased from 20.4 percent to 21.7 percent, an increase that, combined with population growth in that region, led to an increase of 1.9 million uninsured individuals. Similarly in the West, the 4.8 percentage point decline in ESI rate was not fully offset by increases in public coverage and the uninsured rate increased by 1.9 percentage points or 1.4 million individuals. In the last two years, ESI rates were largely unchanged in each region (Figure 15). There were increases in public coverage, particularly in Northeast and West. In the Northeast, the large increase in public coverage resulted in the number of uninsured declining by almost 1 million individuals, about as much as it had increased between 2007 and 2010. In contrast, the small changes in coverage in the South did little to reverse the large increase in the uninsured population seen in the first three years.
Issue Brief: Changes In Coverage Among Workers
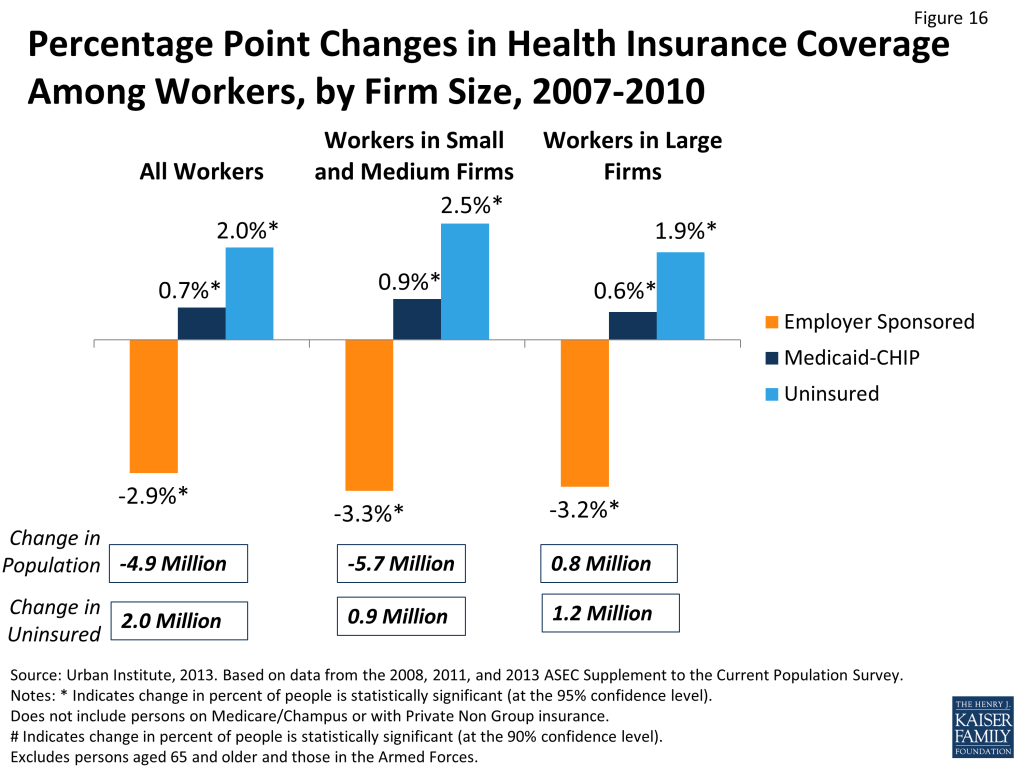
While the previous sections have looked at all nonelderly individuals, this section will look solely at nonelderly workers. Between 2007 and 2010 the number of workers declined by 4.9 million (Table 8). All of this decrease was experienced in small and medium size firms (<1,000 workers) or among the self-employed. Overall, there was a decline in the rate of ESI among workers from 72.5 percent to 69.6 percent, meaning 7.7 million fewer workers had ESI. The percentage of workers without coverage increased from 17.6 percent to 19.6 percent, resulting in 2 million more uninsured workers. The decline in the rate of ESI coverage occurred in each firm size category; from 65.6 percent to 62.3 percent in small and medium firms and from 83.5 percent to 80.3 percent in large firms (Figure 16). There was an increase of almost 1 million uninsured workers in small and medium firms and 1.2 million in large firms.
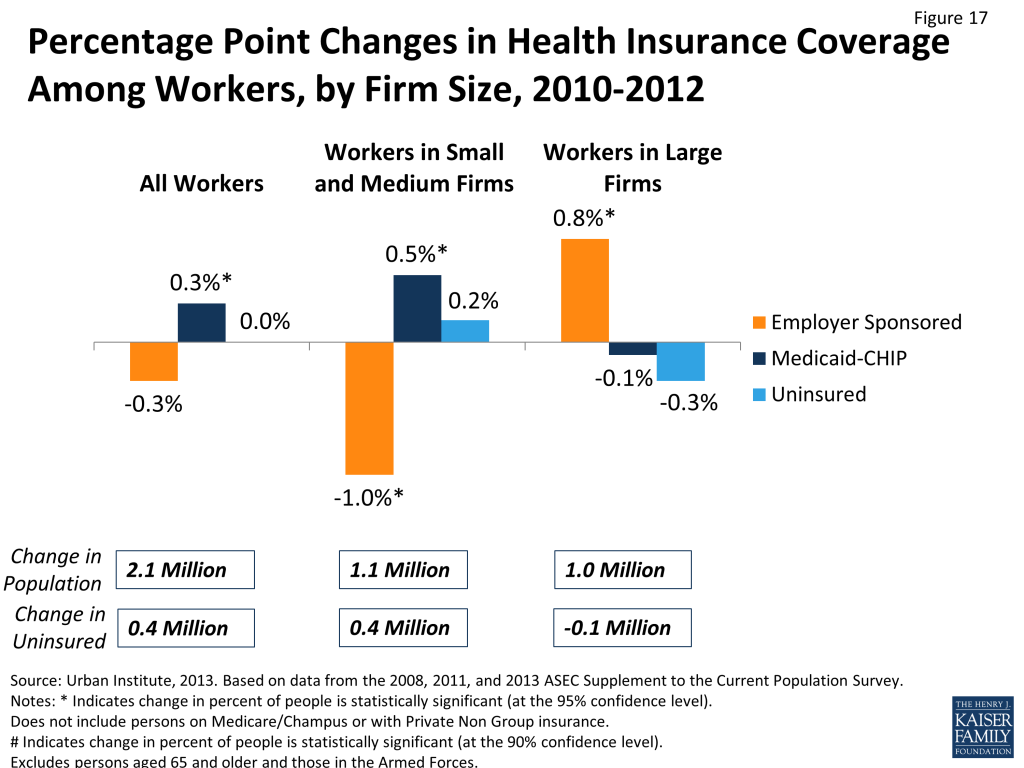
Between 2010 and 2012, the number of workers increased by 2.1 million, with 1.1 million more workers in small and medium sized firms and 1.0 million in large firms. The rate of ESI continued to decline for all workers by about half a percentage point (Figure 17). All of the decline in the ESI rate was in small and medium size firms. In large firms, the ESI rate increased slightly (0.8 percentage points).
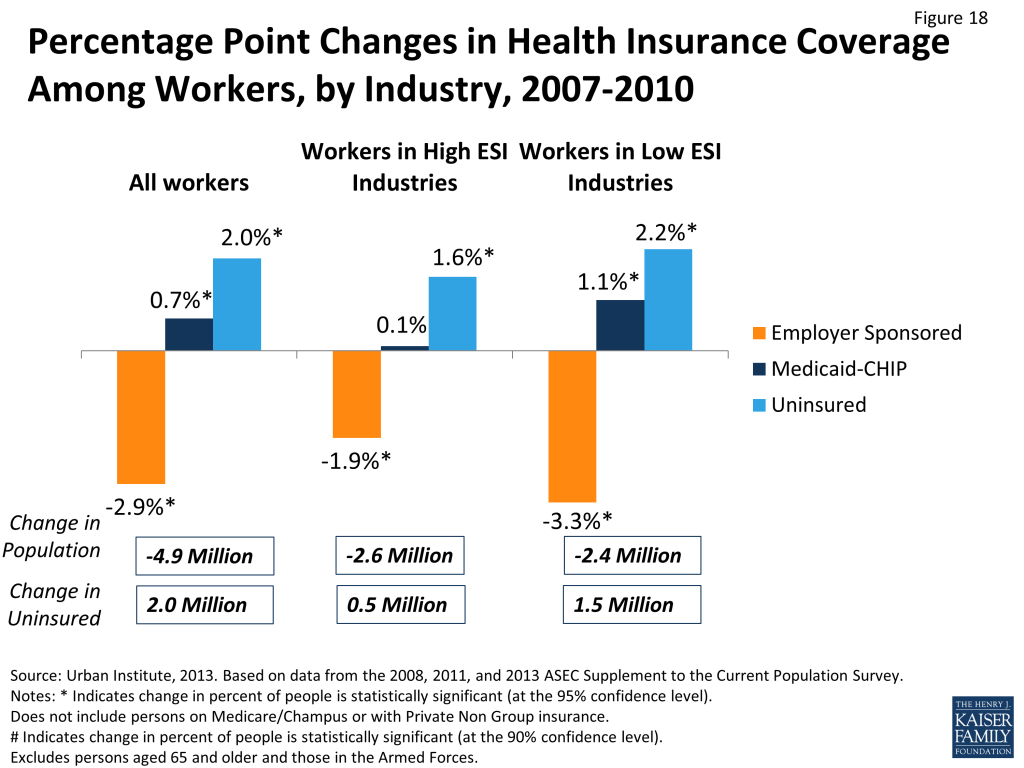
There are also differences in coverage changes between those workers in industries with high rates of ESI coverage and those in industries with lower rates of ESI coverage (Table 9). High ESI industries are those with high ESI coverage rates (more than 80 percent in 2012). This group consisted primarily of finance, manufacturing, information and communications firms. Low ESI industries had ESI rates lower than 80 percent in 2012. These industries included primarily agriculture, construction, and wholesale and retail trade. Between 2007 and 2010, the decline in the number of workers, 4.9 million, was roughly split evenly between high and low ESI industries. However, the drop in the rate of employer sponsored insurance was greater in low ESI industries than high ESI industries—3.3 percentage points (66.0 percent to 62.7 percent) versus 1.9 percentage points (84.4 percent to 82.5 percent) (Figure 18). The increase in the uninsured rate among workers was also higher in low ESI industries. Thus, most growth in the number of uninsured workers during this period was among those in low ESI industries.
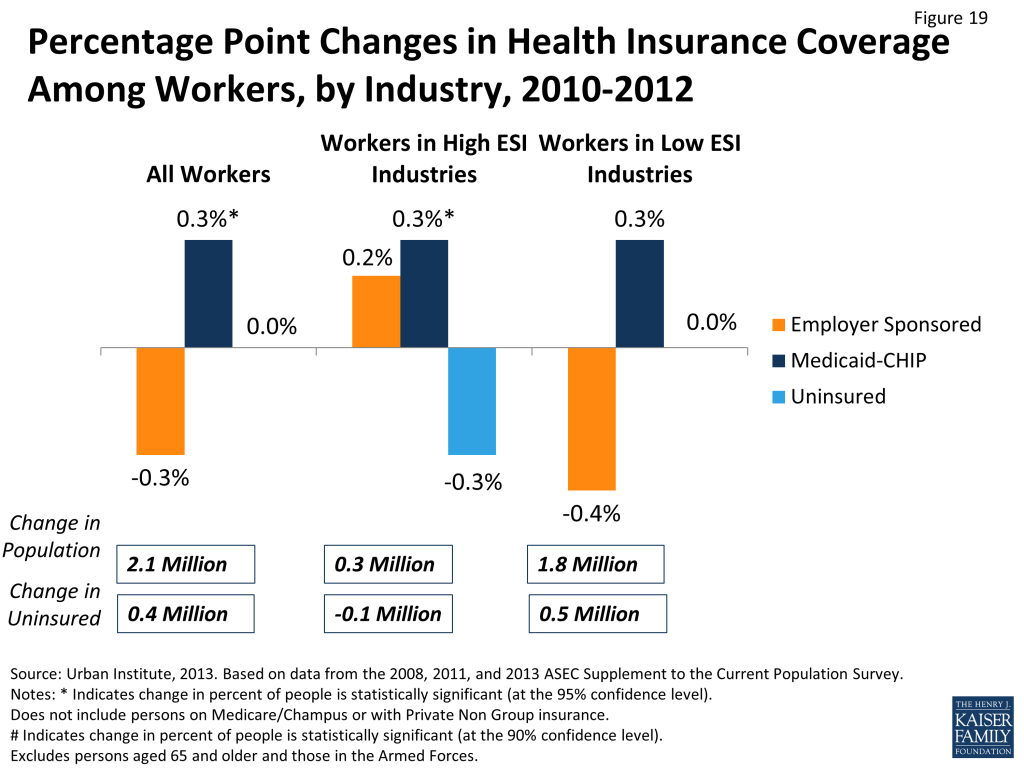
Almost all of the growth in workers between 2010 and 2012 —1.8 million out of 2.1 million total—was in low ESI industries. At the same time, the rate of ESI continued to decline in low ESI industries, falling from 62.7 to 62.3 percent. The rate of ESI stabilized in the high ESI industries.
Thus, while there were some gains in coverage for some workers in more recent years, most of the job growth that has occurred since the peak of the Great Recession has been in industries or firms where the rate of ESI continues to decline. These trends indicate that economic recovery may not be accompanied by large gains in employer coverage.
Conclusion
This analysis provides insight into changing uninsured rates since the recession and has several implications for what might happen to coverage moving forward. First, while the rate of employer sponsored insurance has stabilized for some groups in recent years, it has not led to large gains in ESI as the economy has improved. The overall stability of the ESI rate between 2010 and 2012 in part reflects the movement of the number of workers towards full time work, which would itself increase the ESI rate as full-time workers are more likely to have insurance than part-time or non-workers. However, the ESI rate among full-time workers as a group has actually declined, offsetting the potential positive effect of increases in full-time workers on coverage. Similarly, the rate of ESI continued to decline in low ESI industries and among small and medium firms, which have had sizable job growth in recent years. Given patterns of coverage for adults over age 26, which are not impacted by the ACA policy allowing young adults to stay on parents’ coverage and are thus indicative of underlying trends, it appears that an underlying trend of declining ESI persists. While coverage expansions under the Affordable Care Act will create more coverage options outside of employer-based coverage, ESI is still expected to remain the foundation of the health insurance system moving forward. Thus, it will be important to monitor whether recent trends in ESI coverage continue and whether and how the ACA can fill in gaps in availability of ESI.
Second, most of the changes in the uninsured occurred among low-income individuals. The severe recession and associated slow economic growth are increasing the size of this group. The number of people living in families with incomes below twice the poverty level grew by 13.9 million between 2007 and 2010 and another 1.1 million between 2010 and 2012. The low-income population saw large declines in coverage leading up to the peak of the recession (2007 to 2010) and small gains in coverage as the economy has started to improve (2010 to 2012). These changes have largely driven overall coverage, indicating that coverage for the low-income population is an important contributor to national trends. Correspondingly, coverage expansions under the ACA focus on increasing coverage for people with low or moderate incomes. However, with about half of states not expanding their Medicaid programs, many low-income adults are likely to remain uninsured.
Last, coverage changes for different age groups indicate that policies regarding the availability of insurance can make a difference in coverage patterns. During and after the recession, coverage for children was stabilized by growth in Medicaid and CHIP enrollment that offset loss of private coverage. In contrast, adults, who were less likely to be eligible for Medicaid, had smaller gains in public coverage to offset losses in private insurance, particularly during the period leading up to the peak of the recession (2007-2010). In more recent years, gains in private coverage among young adults (age 19-25), reflecting a 2010 ACA policy enabling these individuals to remain on their parents’ coverage, drove a decline in the number of uninsured adults. These patterns indicate that recent policies to expand coverage available to people of other ages may affect coverage moving forward. Given that the largest increases in the number of uninsured continue to be in the South and West, regions where many states have been the most resistant toward the expansion in the ACA, it will be important to monitor how availability of affordable coverage affects patterns in the future.
This issue brief was prepared by John Holahan and Megan McGrath of the Urban Institute
Appendix: Methods Notes
The data for this report is based on Urban Institute analysis of the Census Bureau’s March Supplement to the Current Population Survey (the CPS Annual Social and Economic Supplement or ASEC). The CPS supplement is the primary source of annual health insurance coverage information in the United States.
There is debate over whether the CPS is measuring the number of uninsured for an entire year (as intended) or whether responses more closely reflect the number of uninsured at a point-in-time. In this paper, we assume that the CPS is essentially a measurement of point-in-time coverage, primarily because the number of uninsured in the CPS has historically been significantly closer to point-in-time estimates and well above the full year estimates of other surveys. While there is also a concern that the CPS understates Medicaid/CHIP enrollment and thus, possibly overstates the number of uninsured,*none of the estimates presented here have been adjusted to take into account possible underreporting of Medicaid/CHIP coverage. However, it is unlikely that the size of the Medicaid undercount varies substantially over time.
We use the health insurance unit (HIU) as the unit of analysis for determining family-level income. A HIU includes members of the nuclear family who can be covered under one health insurance policy (i.e., policyholder, spouse, children who are under age 19 and full-time students under age 23). Use of HIUs in determining family-level income leads to results that differ from those obtained when household income is used because the latter includes the income of all relatives and unrelated individuals living together. The income of the HIU more accurately reflects the income available to individuals when purchasing private insurance or determining eligibility for public programs. We look at changes in coverage dividing the population into three income groups based on percent of the federal poverty level (FPL). The FPL’s are useful because they adjust for both inflation and family size.
In 2011, the Census Bureau revised its health coverage imputation methodology for those who did not respond to health insurance questions. The revisions address the differences between the way that health insurance coverage is collected in the CPS ASEC and the way it is imputed. Previously, dependent coverage assignments were limited only to the policyholder’s spouse and/or children. The revisions now allow all members in the household to be assigned dependent coverage, and the increase in the imputed number of dependents with coverage more accurately reflects individual reporting. These revisions were reflected in the calendar year 2010 CPS ASEC data, and revised extracts were released for 1999 to 2009 data years allowing a methodologically consistent trend to be examined from 1999 to 2010. Overall, the new editing process led to a 0.6 percentage point decrease in the number of uninsured in 2009. The release of the 2010 Census has impacted our use of the 2010 CPS dataset and our ability to create time trends spanning the last decade. Every year, the CPS survey is weighted according to the most recent Census so that the results of the survey sample may be generalized to reflect the composition of the entire population. Since 2000, the CPS datasets have been created using weights based on the demographic information from the 2000 Decennial Census. With the release of the 2010 Decennial Census, the Census Bureau updated the previously published 2010 CPS data using weights based on the newly gathered information from the 2010 Census. While this update enables the 2010 CPS dataset to more accurately reflect the current demographics of the population, it leads to two different sets of estimates for 2010: those based on the 2000 weights and those based on the 2010 weights. It is important to take note that CPS data for previous years in the decade continues to use weights based on the 2000 Census. Through rigorous testing, we found that the changes resulting from the updates were too small to be considered statistically significant, with a few minor exceptions. The most important is in race/ethnicity, where the change in weights resulted in a statistically significant decrease in the total number of whites and a statistically significant increase in the total number of Hispanics and people from other races. There were no changes in the rates of ESI, Medicaid, or other forms of insurance. However, the changes in the numbers of whites, Hispanics, and “other race/ethnicity” meant that some of the reported decline in the number of whites without insurance and increase in the number of Hispanics and “other” were due to the change in weights. For example, 600,000 of the 1.4 million person decline in the number of white uninsured that we report in this paper was due to the change in weights (reflecting a greater decline in the white population). Similarly, there were 300,000 more Hispanic uninsured and 400,000 more “other” uninsured because of the larger estimated size of these populations.
We use NHIS data to assign coverage to young adults, ages 15-26 years old, who report private coverage from outside the household but don’t report what that coverage is. We analyzed the corresponding year’s NHIS data to obtain the total proportion who have such coverage and the share of ESI among those with coverage outside the household. We applied this proportion to the CPS, assigning these individuals to either ESI or private non group coverage so that the rates match those seen among this population in the NHIS. This method results in the overall share among this group with ESI and private non group coverage matching that of the NHIS.
* Davern M, Klerman JA, Ziegenfuss J, Lynch V, Baugh D, Greenberg G. A partially corrected estimate of Medicaid enrollment and uninsurance: results from an imputational model developed off linked survey and administrative data. J Econ Soc Meas. 2009; 34(4):219-40; Call KT, Davidson G, Sommers AS, Feldman R, Farseth P, Rockwood T. Uncovering the missing Medicaid cases and assessing their bias for estimates of the uninsured. Inquiry Winter 2001/2002;38(4): 396-408
Tables
| Table 1: Nonelderly | ||||||||
| Coverage Distribution within Income Category | Change (Millions of People) | Coverage Distribution within Income Category | Change (Millions of People) | |||||
| 2007 | 2010 | 2007-10 | 2012 | 2010-12 | 2007-12 | |||
| All Incomes (millions of people) | 261.4 | 265.9 | 4.4a | 266.9 | 1.0a | 5.5a | ||
| Employer | 64.3% | 59.7% | -4.7%* | -9.5a | 59.8% | 0.2% | 1.1b | -8.5a |
| Medicaid/CHIP | 11.8% | 14.4% | 2.6%* | 7.4a | 14.9% | 0.5%* | 1.5a | 9.0a |
| Medicare/TRICARE/Other federal | 2.5% | 2.9% | 0.3%* | 1.0a | 3.0% | 0.1% | 0.3 | 1.3a |
| Private Nongroup | 4.8% | 4.6% | -0.2%# | -0.2 | 4.6% | 0.0% | 0.0 | -0.2 |
| Uninsured | 16.6% | 18.5% | 1.9%* | 5.7a | 17.7% | -0.8%* | -1.8a | 3.9a |
| Less than 200% of FPL | 91.0 | 105.0 | 13.9a | 106.1 | 1.1b | 15.0a | ||
| Employer | 31.4% | 28.1% | -3.4%* | 0.8a | 28.9% | 0.8%* | 1.2a | 2.0a |
| Medicaid/CHIP | 29.2% | 31.7% | 2.5%* | 6.7a | 32.8% | 1.1%* | 1.5a | 8.2a |
| Medicare/TRICARE/Other federal | 3.7% | 3.7% | 0.1% | 0.6a | 4.0% | 0.2%# | 0.3a | 0.9a |
| Private Nongroup | 4.4% | 4.2% | -0.2% | 0.4a | 4.2% | 0.0% | 0.0 | 0.4a |
| Uninsured | 31.2% | 32.3% | 1.0%* | 5.4a | 30.2% | -2.1%* | -1.9a | 3.6a |
| 200 to 399% of FPL | 75.2 | 71.7 | -3.5a | 72.2 | 0.5 | -3.0a | ||
| Employer | 74.0% | 71.4% | -2.6%* | -4.4a | 71.6% | 0.2% | 0.5 | -3.9a |
| Medicaid/CHIP | 4.5% | 5.6% | 1.1%* | 0.6a | 5.5% | -0.1% | 0.0 | 0.6a |
| Medicare/TRICARE/Other federal | 2.4% | 3.0% | 0.6%* | 0.3a | 2.9% | -0.1% | -0.1 | 0.3a |
| Private Nongroup | 5.0% | 5.1% | 0.1% | -0.1 | 5.3% | 0.1% | 0.1 | 0.0 |
| Uninsured | 14.0% | 14.8% | 0.8%* | 0.1 | 14.7% | -0.1% | 0.0 | 0.1 |
| 400% of FPL and above | 95.2 | 89.2 | -6.0a | 88.6 | -0.5 | -6.6a | ||
| Employer | 88.1% | 87.4% | -0.7%* | -5.9a | 87.3% | -0.1% | -0.6 | -6.5a |
| Medicaid/CHIP | 0.8% | 1.0% | 0.2%* | 0.2a | 1.1% | 0.1% | 0.0 | 0.2a |
| Medicare/TRICARE/Other federal | 1.5% | 1.7% | 0.2%# | 0.1 | 1.8% | 0.1% | 0.0 | 0.1 |
| Private Nongroup | 4.9% | 4.7% | -0.3%# | -0.5a | 4.6% | -0.1% | -0.1 | -0.6a |
| Uninsured | 4.6% | 5.2% | 0.6%* | 0.2 | 5.3% | 0.1% | 0.1 | 0.3b |
| Source: Urban Institute, 2013. Based on data from the 2008, 2011, and 2013 ASEC Supplement to the Current Population Survey.Note: Excludes persons aged 65 and older and those in the Armed Forces.* Indicates change in percent of people is statistically significant (at the 95% confidence level).# Indicates change in percent of people is statistically significant (at the 90% confidence level).a Indicates change in numbers of people is statistically significant (at the 95% confidence level).b Indicates change in numbers of people is statistically significant (at the 90% confidence level). | ||||||||
| Table 2: Adults by Income | ||||||||
| Coverage Distribution within Income Category | Change (Millions of People) | Coverage Distribution within Income Category | Change (Millions of People) | |||||
| 2007 | 2010 | 2007-10 | 2012 | 2010-12 | 2007-12 | |||
| All Incomes (millions of people) | 182.8 | 187.1 | 4.3a | 188.7 | 1.7b | 6.0a | ||
| Employer | 65.9% | 61.3% | -4.6%* | -5.8a | 61.3% | 0.0% | 1.1 | -4.7a |
| Medicaid/CHIP | 6.7% | 8.2% | 1.5%* | 3.0a | 8.7% | 0.6%* | 1.2a | 4.2a |
| Medicare/TRICARE/Other federal | 3.0% | 3.4% | 0.4%* | 0.8a | 3.5% | 0.1% | 0.3 | 1.1a |
| Private Nongroup | 5.3% | 5.1% | -0.2% | -0.1 | 5.2% | 0.1% | 0.2 | 0.1 |
| Uninsured | 19.1% | 22.0% | 3.0%* | 6.4a | 21.3% | -0.8%* | -1.1a | 5.3a |
| Less than 200% of FPL | 57.5 | 67.7 | 10.2a | 69.2 | 1.5a | 11.7a | ||
| Employer | 32.0% | 28.8% | -3.2%* | 1.1a | 30.0% | 1.2%* | 1.2a | 2.4a |
| Medicaid/CHIP | 18.4% | 19.6% | 1.2%* | 2.7a | 20.6% | 1.0%* | 1.0a | 3.7a |
| Medicare/TRICARE/Other federal | 5.0% | 4.9% | -0.2% | 0.4a | 5.2% | 0.3% | 0.3a | 0.7a |
| Private Nongroup | 5.6% | 5.2% | -0.3% | 0.4a | 5.3% | 0.0% | 0.1 | 0.4a |
| Uninsured | 39.0% | 41.5% | 2.4%* | 5.6a | 39.0% | -2.5%* | -1.1a | 4.5a |
| 200 to 399% of FPL | 52.3 | 50.6 | -1.7a | 51.4 | 0.8 | -0.9b | ||
| Employer | 72.8% | 69.9% | -2.9%* | -2.7a | 70.0% | 0.1% | 0.6 | -2.1a |
| Medicaid/CHIP | 2.4% | 3.0% | 0.6%* | 0.3a | 3.3% | 0.3% | 0.2b | 0.4a |
| Medicare/TRICARE/Other federal | 2.7% | 3.5% | 0.7%* | 0.3a | 3.3% | -0.2% | -0.1 | 0.3a |
| Private Nongroup | 5.3% | 5.6% | 0.3% | 0.1 | 5.7% | 0.1% | 0.1 | 0.1 |
| Uninsured | 16.7% | 18.0% | 1.3%* | 0.4b | 17.7% | -0.3% | 0.0 | 0.4b |
| 400% of FPL and above | 73.0 | 68.8 | 0.0% | -4.2a | 68.2 | -0.6 | -4.8a | |
| Employer | 87.7% | 87.0% | -4.2a | 86.6% | -0.4% | -0.8 | -4.9a | |
| Medicaid/CHIP | 0.6% | 0.7% | 0.1% | 0.0 | 0.8% | 0.1% | 0.0 | 0.1b |
| Medicare/TRICARE/Other federal | 1.6% | 1.8% | 0.2%# | 0.1 | 1.9% | 0.1% | 0.1 | 0.1 |
| Private Nongroup | 5.0% | 4.6% | -0.4%* | -0.5a | 4.7% | 0.1% | 0.0 | -0.5a |
| Uninsured | 5.1% | 5.9% | 0.8%* | 0.4a | 6.0% | 0.1% | 0.0 | 0.4a |
| Source: Urban Institute, 2013. Based on data from the 2008, 2011, and 2013 ASEC Supplement to the Current Population Survey.Note: Excludes persons aged 65 and older and those in the Armed Forces.* Indicates change in percent of people is statistically significant (at the 95% confidence level).# Indicates change in percent of people is statistically significant (at the 90% confidence level).a Indicates change in numbers of people is statistically significant (at the 95% confidence level).b Indicates change in numbers of people is statistically significant (at the 90% confidence level). | ||||||||
| Table 3: Adults by Age | ||||||||
| Coverage Distribution within Income Category | Change (Millions of People) | Coverage Distribution within Income Category | Change (Millions of People) | |||||
| 2007 | 2009 | 2007-09 | 2012 | 2009-12 | 2007-12 | |||
| Adults 19-25 | 28.2 | 29.1 | 0.9a | 30.0 | 0.9a | 1.8a | ||
| Employer | 54.7% | 50.1% | -4.5%* | -0.8a | 54.4% | 4.3%* | 1.7a | 0.9a |
| Medicaid/CHIP | 9.4% | 11.3% | 1.9%* | 0.6a | 11.5% | 0.2% | 0.2 | 0.8a |
| Medicare/TRICARE/Other federal | 1.5% | 1.6% | 0.1% | 0.0 | 1.9% | 0.3%# | 0.1a | 0.2a |
| Private Nongroup | 5.2% | 5.4% | 0.2% | 0.1 | 4.9% | -0.5%# | -0.1 | 0.0 |
| Uninsured | 29.3% | 31.7% | 2.3%* | 1.0a | 27.4% | -4.3%* | -1.0a | -0.1 |
| Adults 26-34 | 35.6 | 36.4 | 0.8a | 37.3 | 0.9a | 1.7a | ||
| Employer | 63.2% | 57.1% | -6.1%* | -1.7a | 57.2% | 0.1% | 0.5 | -1.2a |
| Medicaid/CHIP | 6.8% | 9.0% | 2.1%* | 0.8a | 9.1% | 0.2% | 0.1 | 1.0a |
| Medicare/TRICARE/Other federal | 1.2% | 1.6% | 0.4%* | 0.1a | 1.7% | 0.1% | 0.1 | 0.2a |
| Private Nongroup | 4.4% | 4.5% | 0.1% | 0.1 | 4.5% | 0.0% | 0.0 | 0.1 |
| Uninsured | 24.4% | 27.9% | 3.5%* | 1.5a | 27.4% | -0.4% | 0.1 | 1.6a |
| Adults 35-54 | 85.7 | 84.5 | -1.2a | 83.0 | -1.5a | -2.7a | ||
| Employer | 69.9% | 66.4% | -3.6%* | -3.9a | 64.8% | -1.6%* | -2.3a | -6.2a |
| Medicaid/CHIP | 6.0% | 7.2% | 1.1%* | 0.9a | 7.8% | 0.6%* | 0.4a | 1.3a |
| Medicare/TRICARE/Other federal | 2.4% | 2.6% | 0.2%# | 0.2 | 2.9% | 0.2% | 0.1 | 0.3a |
| Private Nongroup | 5.2% | 4.7% | -0.5%* | -0.5a | 4.9% | 0.2% | 0.1 | -0.4a |
| Uninsured | 16.4% | 19.1% | 2.7%* | 2.1a | 19.7% | 0.5%# | 0.2 | 2.3a |
| Adults 55-64 | 33.3 | 35.4 | 2.1a | 38.5 | 3.1a | 5.2a | ||
| Employer | 68.0% | 65.8% | -2.2%* | 0.7b | 63.2% | -2.6%* | 1.1a | 1.7a |
| Medicaid/CHIP | 6.1% | 7.0% | 1.0%* | 0.5a | 8.1% | 1.1%* | 0.6a | 1.1a |
| Medicare/TRICARE/Other federal | 7.9% | 7.7% | -0.2% | 0.1 | 7.9% | 0.2% | 0.3a | 0.4a |
| Private Nongroup | 6.5% | 6.0% | -0.5%# | 0.0 | 6.8% | 0.8%* | 0.5a | 0.4a |
| Uninsured | 11.6% | 13.4% | 1.9%* | 0.9a | 14.0% | 0.5% | 0.6a | 1.5a |
| Source: Urban Institute, 2013. Based on data from the 2008, 2011, and 2013 ASEC Supplement to the Current Population Survey.Note: Excludes persons aged 65 and older and those in the Armed Forces.* Indicates change in percent of people is statistically significant (at the 95% confidence level).# Indicates change in percent of people is statistically significant (at the 90% confidence level).a Indicates change in numbers of people is statistically significant (at the 95% confidence level).b Indicates change in numbers of people is statistically significant (at the 90% confidence level). | ||||||||
| Table 4: Children by Income | ||||||||
| Coverage Distribution within Income Category | Change (Millions of People) | Coverage Distribution within Income Category | Change (Millions of People) | |||||
| 2007 | 2010 | 2007-10 | 2012 | 2010-12 | 2007-12 | |||
| All Incomes (millions of people) | 78.6 | 78.8 | 0.1 | 78.2 | -0.6 | -0.5 | ||
| Employer | 60.6% | 55.8% | -4.9%* | -3.8a | 56.2% | 0.4% | 0.0 | -3.7a |
| Medicaid/CHIP | 23.5% | 29.1% | 5.6%* | 4.4a | 29.7% | 0.6%# | 0.3 | 4.8a |
| Medicare/TRICARE/Other federal | 1.4% | 1.6% | 0.2%* | 0.2a | 1.6% | 0.0% | 0.0 | 0.2a |
| Private Nongroup | 3.6% | 3.4% | -0.1% | -0.1 | 3.2% | -0.2% | -0.2 | -0.3a |
| Uninsured | 10.9% | 10.1% | -0.8%* | -0.6a | 9.2% | -0.9%* | -0.7a | -1.4a |
| Less than 200% of FPL | 33.6 | 37.3 | 3.7a | 36.9 | -0.4 | 3.3a | ||
| Employer | 30.5% | 26.8% | -3.7%* | -0.3 | 26.9% | 0.1% | -0.1 | -0.3 |
| Medicaid/CHIP | 47.7% | 53.6% | 5.9%* | 4.0a | 55.5% | 1.9%* | 0.5 | 4.5a |
| Medicare/TRICARE/Other federal | 1.4% | 1.7% | 0.3%* | 0.2a | 1.7% | 0.0% | 0.0 | 0.2a |
| Private Nongroup | 2.5% | 2.4% | -0.2% | 0.0 | 2.2% | -0.1% | -0.1 | 0.0 |
| Uninsured | 17.9% | 15.6% | -2.3%* | -0.2 | 13.7% | -1.9%* | -0.8a | -1.0a |
| 200 to 399% of FPL | 22.8 | 21.1 | -1.8a | 20.8 | -0.3 | -2.1a | ||
| Employer | 76.7% | 75.0% | -1.7%* | -1.7a | 75.5% | 0.5% | -0.1 | -1.8a |
| Medicaid/CHIP | 9.4% | 11.8% | 2.4%* | 0.3a | 11.1% | -0.7% | -0.2 | 0.2 |
| Medicare/TRICARE/Other federal | 1.7% | 1.9% | 0.3% | 0.0 | 1.9% | 0.0% | 0.0 | 0.0 |
| Private Nongroup | 4.2% | 4.0% | -0.2% | -0.1b | 4.1% | 0.1% | 0.0 | -0.1 |
| Uninsured | 8.0% | 7.2% | -0.8%# | -0.3a | 7.3% | 0.1% | 0.0 | -0.3a |
| 400% of FPL and above | 22.2 | 20.4 | -1.8a | 20.5 | 0.1 | -1.7a | ||
| Employer | 89.6% | 88.8% | -0.8%# | -1.8a | 89.5% | 0.7% | 0.2 | -1.6a |
| Medicaid/CHIP | 1.5% | 2.2% | 0.8%* | 0.1a | 2.2% | -0.1% | 0.0 | 0.1a |
| Medicare/TRICARE/Other federal | 1.2% | 1.3% | 0.1% | 0.0 | 1.2% | -0.1% | 0.0 | 0.0 |
| Private Nongroup | 4.5% | 4.8% | 0.3% | 0.0 | 4.2% | -0.7%# | -0.1b | -0.1a |
| Uninsured | 3.2% | 2.9% | -0.3% | -0.1a | 3.0% | 0.1% | 0.0 | -0.1b |
| Source: Urban Institute, 2013. Based on data from the 2008, 2011, and 2013 ASEC Supplement to the Current Population Survey.Note: Excludes persons aged 65 and older and those in the Armed Forces.* Indicates change in percent of people is statistically significant (at the 95% confidence level).# Indicates change in percent of people is statistically significant (at the 90% confidence level).a Indicates change in numbers of people is statistically significant (at the 95% confidence level).b Indicates change in numbers of people is statistically significant (at the 90% confidence level). | ||||||||
| Table 5: Nonelderly by Family Work Status | ||||||||
| Coverage Distribution within Income Category | Change (Millions of People) | Coverage Distribution within Income Category | Change (Millions of People) | |||||
| 2007 | 2010 | 2007-10 | 2012 | 2010-12 | 2007-12 | |||
| 2 Full-time Workers | 72.9 | 65.9 | -7.0a | 66.0 | 0.1 | -6.9a | ||
| Employer | 85.1% | 83.9% | -1.2%* | -6.8a | 84.3% | 0.4% | 0.4 | -6.4a |
| Medicaid/CHIP | 3.1% | 3.7% | 0.7%* | 0.2a | 3.4% | -0.3%* | -0.2a | 0.0 |
| Medicare/TRICARE/Other federal | 1.1% | 1.3% | 0.1% | 0.0 | 1.1% | -0.2% | -0.1 | -0.1 |
| Private Nongroup | 3.3% | 3.4% | 0.1% | -0.2b | 3.4% | 0.0% | 0.0 | -0.2b |
| Uninsured | 7.4% | 7.7% | 0.4% | -0.3b | 7.8% | 0.1% | 0.1 | -0.2 |
| 1 Full-time Worker | 139.6 | 135.7 | -3.9a | 137.9 | 2.2a | -1.7a | ||
| Employer | 66.4% | 64.7% | -1.7%* | -4.9a | 64.0% | -0.7%* | 0.5 | -4.5a |
| Medicaid/CHIP | 9.3% | 10.5% | 1.3%* | 1.4a | 11.4% | 0.8%* | 1.4a | 2.7a |
| Medicare/TRICARE/Other federal | 1.5% | 1.7% | 0.2%* | 0.2b | 1.9% | 0.2%* | 0.3a | 0.5a |
| Private Nongroup | 5.0% | 4.7% | -0.3%* | -0.6a | 4.7% | 0.0% | 0.1 | -0.5a |
| Uninsured | 17.8% | 18.3% | 0.6%* | 0.1 | 18.0% | -0.4% | -0.1 | 0.0 |
| Only Part-Time Workers | 18.6 | 24.8 | 6.2a | 24.5 | -0.4 | 5.8a | ||
| Employer | 37.2% | 32.3% | -4.8%* | 1.1a | 33.5% | 1.2%# | 0.2 | 1.3a |
| Medicaid/CHIP | 23.2% | 25.9% | 2.6%* | 2.1a | 26.2% | 0.3% | 0.0 | 2.1a |
| Medicare/TRICARE/Other federal | 3.0% | 3.3% | 0.3% | 0.3a | 3.2% | -0.1% | 0.0 | 0.2a |
| Private Nongroup | 8.2% | 7.6% | -0.6% | 0.4a | 7.1% | -0.5% | -0.2 | 0.2a |
| Uninsured | 28.4% | 30.8% | 2.5%* | 2.4a | 30.0% | -0.9% | -0.3 | 2.1a |
| Non-workers | 30.2 | 39.5 | 9.2a | 38.5 | -0.9a | 8.3a | ||
| Employer | 21.2% | 19.1% | -2.1%* | 1.1a | 19.6% | 0.6% | 0.0 | 1.2a |
| Medicaid/CHIP | 37.2% | 38.0% | 0.9% | 3.8a | 40.0% | 1.9%* | 0.4 | 4.2a |
| Medicare/TRICARE/Other federal | 10.2% | 9.1% | -1.1%* | 0.5a | 9.6% | 0.5% | 0.1 | 0.6a |
| Private Nongroup | 5.1% | 4.5% | -0.6%* | 0.2a | 4.7% | 0.2% | 0.1 | 0.3a |
| Uninsured | 26.4% | 29.3% | 2.9%* | 3.6a | 26.1% | -3.2%* | -1.5a | 2.1a |
| Source: Urban Institute, 2013. Based on data from the 2008, 2011, and 2013 ASEC Supplement to the Current Population Survey.Note: Excludes persons aged 65 and older and those in the Armed Forces.* Indicates change in percent of people is statistically significant (at the 95% confidence level).# Indicates change in percent of people is statistically significant (at the 90% confidence level).a Indicates change in numbers of people is statistically significant (at the 95% confidence level).b Indicates change in numbers of people is statistically significant (at the 90% confidence level). | ||||||||
| Table 6: Nonelderly by Race/Ethnicity | ||||||||
| Coverage Distribution within Income Category | Change (Millions of People) | Coverage Distribution within Income Category | Change (Millions of People) | |||||
| 2007 | 2010 | 2007-10 | 2012 | 2010-12 | 2007-12 | |||
| White Only (Non-Hispanic) | 166.7 | 162.8 | -3.9a | 160.5 | -2.2a | -6.1a | ||
| Employer | 72.3% | 68.3% | -4.0%* | -9.3a | 68.3% | 0.0% | -1.4a | -10.8a |
| Medicaid/CHIP | 7.6% | 9.4% | 1.8%* | 2.6a | 9.7% | 0.3%# | 0.3 | 2.8a |
| Medicare/TRICARE/Other federal | 2.7% | 3.0% | 0.4%* | 0.5a | 3.2% | 0.2%# | 0.2 | 0.7a |
| Private Nongroup | 5.8% | 5.6% | -0.2% | -0.5a | 5.5% | -0.1% | -0.3 | -0.8a |
| Uninsured | 11.7% | 13.7% | 2.0%* | 2.8a | 13.3% | -0.4%* | -0.9a | 1.9a |
| Black Only (Non-Hispanic) | 33.2 | 33.3 | 0.1 | 33.7 | 0.5 | 0.6 | ||
| Employer | 53.4% | 46.3% | -7.1%* | -2.3a | 48.0% | 1.8%* | 0.8a | -1.5a |
| Medicaid/CHIP | 21.0% | 25.2% | 4.2%* | 1.4a | 25.0% | -0.2% | 0.0 | 1.4a |
| Medicare/TRICARE/Other federal | 3.4% | 3.8% | 0.4% | 0.1 | 3.8% | 0.0% | 0.0 | 0.2b |
| Private Nongroup | 2.4% | 2.6% | 0.2% | 0.1 | 2.6% | 0.0% | 0.0 | 0.1 |
| Uninsured | 19.9% | 22.1% | 2.3%* | 0.8a | 20.6% | -1.6%* | -0.4b | 0.3 |
| Hispanic | 43.4 | 48.1 | 4.7 | 49.9 | 1.8# | 6.5a | ||
| Employer | 42.5% | 40.0% | -2.5%* | 0.8a | 40.2% | 0.1% | 0.8a | 1.6a |
| Medicaid/CHIP | 20.3% | 23.6% | 3.3%* | 2.5a | 24.7% | 1.1%* | 1.0a | 3.5a |
| Medicare/TRICARE/Other federal | 1.5% | 1.9% | 0.4%* | 0.3a | 1.8% | -0.1% | 0.0 | 0.2a |
| Private Nongroup | 2.7% | 2.4% | -0.3% | 0.0 | 2.7% | 0.3% | 0.2a | 0.2b |
| Uninsured | 32.9% | 32.1% | -0.9% | 1.1a | 30.7% | -1.4%* | -0.1 | 1.0a |
| Other | 18.2 | 21.7 | 3.6a | 22.7 | 1.0a | 4.5a | ||
| Employer | 63.5% | 59.0% | -4.5%* | 1.3a | 60.4% | 1.4% | 0.9a | 2.2a |
| Medicaid/CHIP | 12.2% | 14.6% | 2.3%* | 0.9a | 15.1% | 0.5% | 0.3b | 1.2a |
| Medicare/TRICARE/Other federal | 2.3% | 2.2% | -0.1% | 0.1 | 2.5% | 0.2% | 0.1 | 0.1a |
| Private Nongroup | 5.1% | 5.3% | 0.2% | 0.2a | 5.5% | 0.3% | 0.1 | 0.3a |
| Uninsured | 17.0% | 19.0% | 2.0%* | 1.0a | 16.5% | -2.5%* | -0.4a | 0.7a |
| Source: Urban Institute, 2013. Based on data from the 2008, 2011, and 2013 ASEC Supplement to the Current Population Survey.Note: Excludes persons aged 65 and older and those in the Armed Forces.* Indicates change in percent of people is statistically significant (at the 95% confidence level).# Indicates change in percent of people is statistically significant (at the 90% confidence level).a Indicates change in numbers of people is statistically significant (at the 95% confidence level).b Indicates change in numbers of people is statistically significant (at the 90% confidence level). | ||||||||
| Table 7: Nonelderly by Region | ||||||||
| Coverage Distribution within Income Category | Change (Millions of People) | Coverage Distribution within Income Category | Change (Millions of People) | |||||
| 2007 | 2010 | 2007-10 | 2012 | 2010-12 | 2007-12 | |||
| Northeast | 46.6 | 47.0 | 0.4a | 46.9 | -0.1 | 0.3b | ||
| Employer | 69.0% | 65.0% | -4.0%* | -1.6a | 65.5% | 0.5% | 0.2 | -1.4a |
| Medicaid/CHIP | 13.2% | 15.0% | 1.9%* | 0.9a | 16.4% | 1.4%* | 0.6a | 1.6a |
| Medicare/TRICARE/Other federal | 1.5% | 1.7% | 0.2%# | 0.1b | 1.9% | 0.1% | 0.1 | 0.2a |
| Private Nongroup | 4.3% | 4.1% | -0.2% | -0.1 | 3.9% | -0.2% | -0.1 | -0.2b |
| Uninsured | 12.1% | 14.2% | 2.1%* | 1.0a | 12.4% | -1.8%* | -0.9a | 0.2 |
| Midwest | 57.4 | 57.2 | -0.2 | 56.5 | -0.6a | -0.8a | ||
| Employer | 70.1% | 64.4% | -5.7%* | -3.4a | 64.8% | 0.5% | -0.2 | -3.6a |
| Medicaid/CHIP | 10.7% | 13.9% | 3.2%* | 1.8a | 13.8% | 0.0% | -0.1 | 1.7a |
| Medicare/TRICARE/Other federal | 2.3% | 2.4% | 0.1% | 0.1 | 2.5% | 0.1% | 0.0 | 0.1 |
| Private Nongroup | 4.5% | 4.5% | 0.0% | 0.0 | 5.0% | 0.4%* | 0.2b | 0.2b |
| Uninsured | 12.4% | 14.8% | 2.4%* | 1.4a | 13.9% | -0.9%* | -0.6a | 0.8a |
| South | 95.5 | 98.8 | 3.2a | 99.5 | 0.7a | 4.0a | ||
| Employer | 60.4% | 56.3% | -4.1%* | -2.1a | 56.1% | -0.2% | 0.2 | -1.9a |
| Medicaid/CHIP | 11.4% | 13.9% | 2.5%* | 2.9a | 14.2% | 0.3% | 0.4 | 3.3a |
| Medicare/TRICARE/Other federal | 3.5% | 3.8% | 0.3%* | 0.4a | 3.9% | 0.1% | 0.1 | 0.6a |
| Private Nongroup | 4.3% | 4.2% | -0.1% | 0.1 | 4.3% | 0.1% | 0.1 | 0.2 |
| Uninsured | 20.4% | 21.7% | 1.3%* | 1.9a | 21.4% | -0.3% | -0.1 | 1.8a |
| West | 61.9 | 62.9 | 1.0a | 63.9 | 1.0a | 2.0a | ||
| Employer | 61.5% | 56.6% | -4.8%* | -2.4a | 57.0% | 0.4% | 0.8a | -1.6a |
| Medicaid/CHIP | 12.2% | 15.0% | 2.8%* | 1.9a | 15.7% | 0.7%* | 0.6a | 2.5a |
| Medicare/TRICARE/Other federal | 2.1% | 2.6% | 0.5%* | 0.3a | 2.7% | 0.1% | 0.1 | 0.4a |
| Private Nongroup | 6.1% | 5.7% | -0.4% | -0.2 | 5.3% | -0.4%# | -0.2 | -0.4a |
| Uninsured | 18.1% | 20.0% | 1.9%* | 1.4a | 19.3% | -0.8%* | -0.3 | 1.1a |
| Source: Urban Institute, 2013. Based on data from the 2008, 2011, and 2013 ASEC Supplement to the Current Population Survey.Note: Excludes persons aged 65 and older and those in the Armed Forces.* Indicates change in percent of people is statistically significant (at the 95% confidence level).# Indicates change in percent of people is statistically significant (at the 90% confidence level).a Indicates change in numbers of people is statistically significant (at the 95% confidence level).b Indicates change in numbers of people is statistically significant (at the 90% confidence level). | ||||||||
| Table 8: Workers by Firm Size | ||||||||
| Coverage Distribution within Income Category | Change(Millions of People) | Coverage Distribution within Income Category | Change (Millions of People) | |||||
| 2007 | 2010 | 2007-10 | 2012 | 2010-12 | 2007-12 | |||
| All Workers | 147.8 | 142.9 | -4.9a | 145.0 | 2.1a | -2.8a | ||
| Employer | 72.5% | 69.6% | -2.9%* | -7.7a | 69.3% | -0.3% | 1.0b | -6.7a |
| Medicaid/CHIP | 3.5% | 4.3% | 0.7%* | 0.9a | 4.5% | 0.3%* | 0.5a | 1.4a |
| Medicare/TRICARE/Other federal | 1.3% | 1.4% | 0.1%* | 0.1 | 1.5% | 0.1% | 0.1 | 0.3a |
| Private Nongroup | 5.1% | 5.1% | 0.0% | -0.3 | 5.1% | 0.0% | 0.1 | -0.2 |
| Uninsured | 17.6% | 19.6% | 2.0%* | 2.0a | 19.6% | 0.0% | 0.4 | 2.4a |
| Small and Medium(Less than 1000 workers) or Self-Employed | 90.6 | 84.9 | -5.7a | 86.0 | 1.1b | -4.6a | ||
| Employer | 65.6% | 62.3% | -3.3%* | -6.5a | 61.3% | -1.0%* | -0.2 | -6.7a |
| Medicaid/CHIP | 4.0% | 4.9% | 0.9%* | 0.5a | 5.4% | 0.5%* | 0.5a | 1.0a |
| Medicare/TRICARE/Other federal | 1.3% | 1.4% | 0.0% | 0.0 | 1.5% | 0.2%# | 0.2a | 0.1 |
| Private Nongroup | 6.9% | 6.8% | -0.2% | -0.5a | 7.0% | 0.2% | 0.2 | -0.3b |
| Uninsured | 22.2% | 24.7% | 2.5%* | 0.9a | 24.8% | 0.2% | 0.4 | 1.3a |
| Large Firms (1000 workers or more) | 57.2 | 58.0 | 0.8 | 58.9 | 1.0a | 1.8a | ||
| Employer | 83.5% | 80.3% | -3.2%* | -1.2a | 81.1% | 0.8%* | 1.2a | 0.1 |
| Medicaid/CHIP | 2.8% | 3.3% | 0.6%* | 0.4a | 3.3% | -0.1% | 0.0 | 0.4a |
| Medicare/TRICARE/Other federal | 1.2% | 1.5% | 0.3%* | 0.2a | 1.4% | -0.1% | 0.0 | 0.1a |
| Private Nongroup | 2.2% | 2.6% | 0.4%* | 0.3a | 2.3% | -0.3%* | -0.2b | 0.1 |
| Uninsured | 10.3% | 12.2% | 1.9%* | 1.2a | 11.9% | -0.3% | -0.1 | 1.1a |
| Source: Urban Institute, 2013. Based on data from the 2008, 2011, and 2013 ASEC Supplement to the Current Population Survey.Note: Excludes children, persons aged 65 and older and those in the Armed Forces.* Indicates change in percent of people is statistically significant (at the 95% confidence level).# Indicates change in percent of people is statistically significant (at the 90% confidence level).a Indicates change in numbers of people is statistically significant (at the 95% confidence level).b Indicates change in numbers of people is statistically significant (at the 90% confidence level). | ||||||||
| Table 9: Workers by Industry Type | ||||||||
| Coverage Distribution within Income Category | Change(Millions of People) | Coverage Distribution within Income Category | Change (Millions of People) | |||||
| 2007 | 2010 | 2007-10 | 2012 | 2010-12 | 2007-12 | |||
| All Workers | 147.8 | 142.9 | -4.9a | 145.0 | 2.1a | -2.8a | ||
| Employer | 72.5% | 69.6% | -2.9%* | -7.7a | 69.3% | -0.3% | 1.0b | -6.7a |
| Medicaid/CHIP | 3.5% | 4.3% | 0.7%* | 0.9a | 4.5% | 0.3%* | 0.5a | 1.4a |
| Medicare/TRICARE/Other federal | 1.3% | 1.4% | 0.1%* | 0.1 | 1.5% | 0.1% | 0.1 | 0.3a |
| Private Nongroup | 5.1% | 5.1% | 0.0% | -0.3 | 5.1% | 0.0% | 0.1 | -0.2 |
| Uninsured | 17.6% | 19.6% | 2.0%* | 2.0a | 19.6% | 0.0% | 0.4 | 2.4a |
| Workers in High ESI Industries1 | 52.3 | 49.7 | -2.6a | 50.0 | 0.3 | -2.3a | ||
| Employer | 84.4% | 82.5% | -1.9%* | -3.1a | 82.7% | 0.2% | 0.3 | -2.8a |
| Medicaid/CHIP | 1.8% | 1.9% | 0.1% | 0.0 | 2.2% | 0.3%* | 0.2a | 0.1b |
| Medicare/TRICARE/Other federal | 0.9% | 1.2% | 0.3%* | 0.1a | 1.0% | -0.1% | -0.1 | 0.1 |
| Private Nongroup | 3.6% | 3.6% | 0.0% | -0.1 | 3.5% | -0.1% | -0.1 | -0.1 |
| Uninsured | 9.3% | 10.8% | 1.6%* | 0.5a | 10.6% | -0.3% | -0.1 | 0.4a |
| Workers in Low ESI Industries2 | 95.5 | 93.2 | -2.4a | 95.0 | 1.8a | -0.5 | ||
| Employer | 66.0% | 62.7% | -3.3%* | -4.6a | 62.3% | -0.4% | 0.7 | -3.9a |
| Medicaid/CHIP | 4.4% | 5.5% | 1.1%* | 0.9a | 5.8% | 0.3% | 0.4a | 1.2a |
| Medicare/TRICARE/Other federal | 1.5% | 1.6% | 0.1% | 0.0 | 1.7% | 0.1% | 0.2b | 0.2a |
| Private Nongroup | 5.9% | 5.9% | 0.0% | -0.2 | 5.9% | 0.0% | 0.1 | -0.1 |
| Uninsured | 22.1% | 24.3% | 2.2%* | 1.5a | 24.3% | 0.0% | 0.5 | 2.0a |
| Source: Urban Institute, 2013. Based on data from the 2008, 2011, and 2013 ASEC Supplement to the Current Population Survey.Note: Excludes children, persons aged 65 and older and those in the Armed Forces.1 High ESI Industries include industries with an ESI rate of 80% or higher in 2012: Finanace;Manufacturing; Info and Communications; Education; Utilities; Mining; and Public Administration.2 Low ESI Industries include industries with an ESI rate of lower than 80% in 2012: Agriculture;Arts/Entertainment/Recreation; Construction; Former Military; Health and Social Services; Other Services, Professional;Transportation; and Wholesale and Retail Trade.* Indicates change in percent of people is statistically significant (at the 95% confidence level).# Indicates change in percent of people is statistically significant (at the 90% confidence level).a Indicates change in numbers of people is statistically significant (at the 95% confidence level).b Indicates change in numbers of people is statistically significant (at the 90% confidence level). | ||||||||