Language Barriers in Health Care: Findings from the KFF Survey on Racism, Discrimination, and Health
Findings
In the U.S., there are about 26 million people who have limited English proficiency (LEP), meaning they speak English less than very well, making up about 8% of people ages five and older. Most U.S. adults with LEP speak Spanish (62%), followed by Chinese (7%), Vietnamese (3%), Arabic (2%), and Tagalog (2%), with the remainder speaking a variety of different languages from regions across the world. Hispanic people account for nearly two-thirds (62%) of the LEP population, while over a fifth (22%) of individuals with LEP are Asian. The remainder of individuals with LEP are White (11%) or Black (4%) or of other racial and ethnic backgrounds. Adults with LEP are also more likely to be low-income—nearly one in five individuals with LEP have family income below 200% of the federal poverty level, compared with one in ten English-proficient individuals. This brief examines health care experiences among U.S. adults with LEP, drawing on findings from the KFF Survey on Racism, Discrimination, and Health.1 For more information about U.S. immigrants with LEP, see this brief. The data identify ongoing barriers and disparities adults with LEP face in accessing health care and suggest that having access to providers who speak their preferred language helps reduce these barriers and may improve certain health care experiences.
Health and Health Care Experiences Among Adults with LEP
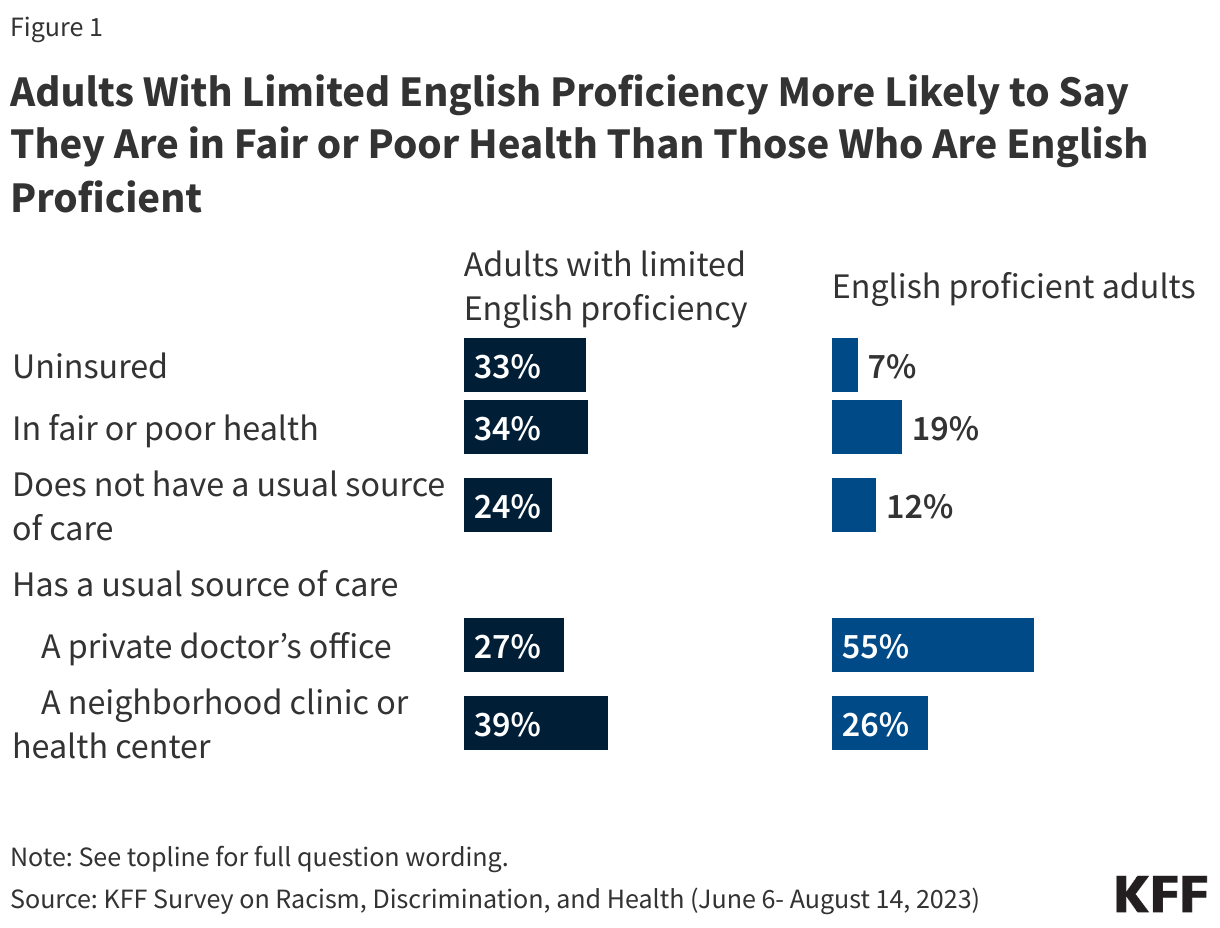
Adults with LEP report worse health status and increased barriers in accessing health care compared to English proficient adults.2 Adults who have LEP are more likely to report their physical health as “fair” or “poor” compared with adults who are English proficient (34% vs. 19%). Despite this difference in health status, adults with LEP report less use of care and greater barriers to accessing health care compared to their English proficient counterparts. Adults who have LEP are less likely to say they had a health care visit in the past three years than English proficient adults (86% vs. 95%). In addition, consistent with other analysis, adults who have LEP are more likely than those who are English proficient to report being uninsured (33% vs. 7%). They also are less likely to say they have a usual source of care other than the emergency room (74% vs. 88%). Notably, four in ten adults with LEP (39%) say their usual source of care is a neighborhood clinic or health center, highlighting the importance of community health centers in providing linguistically appropriate and culturally competent care.
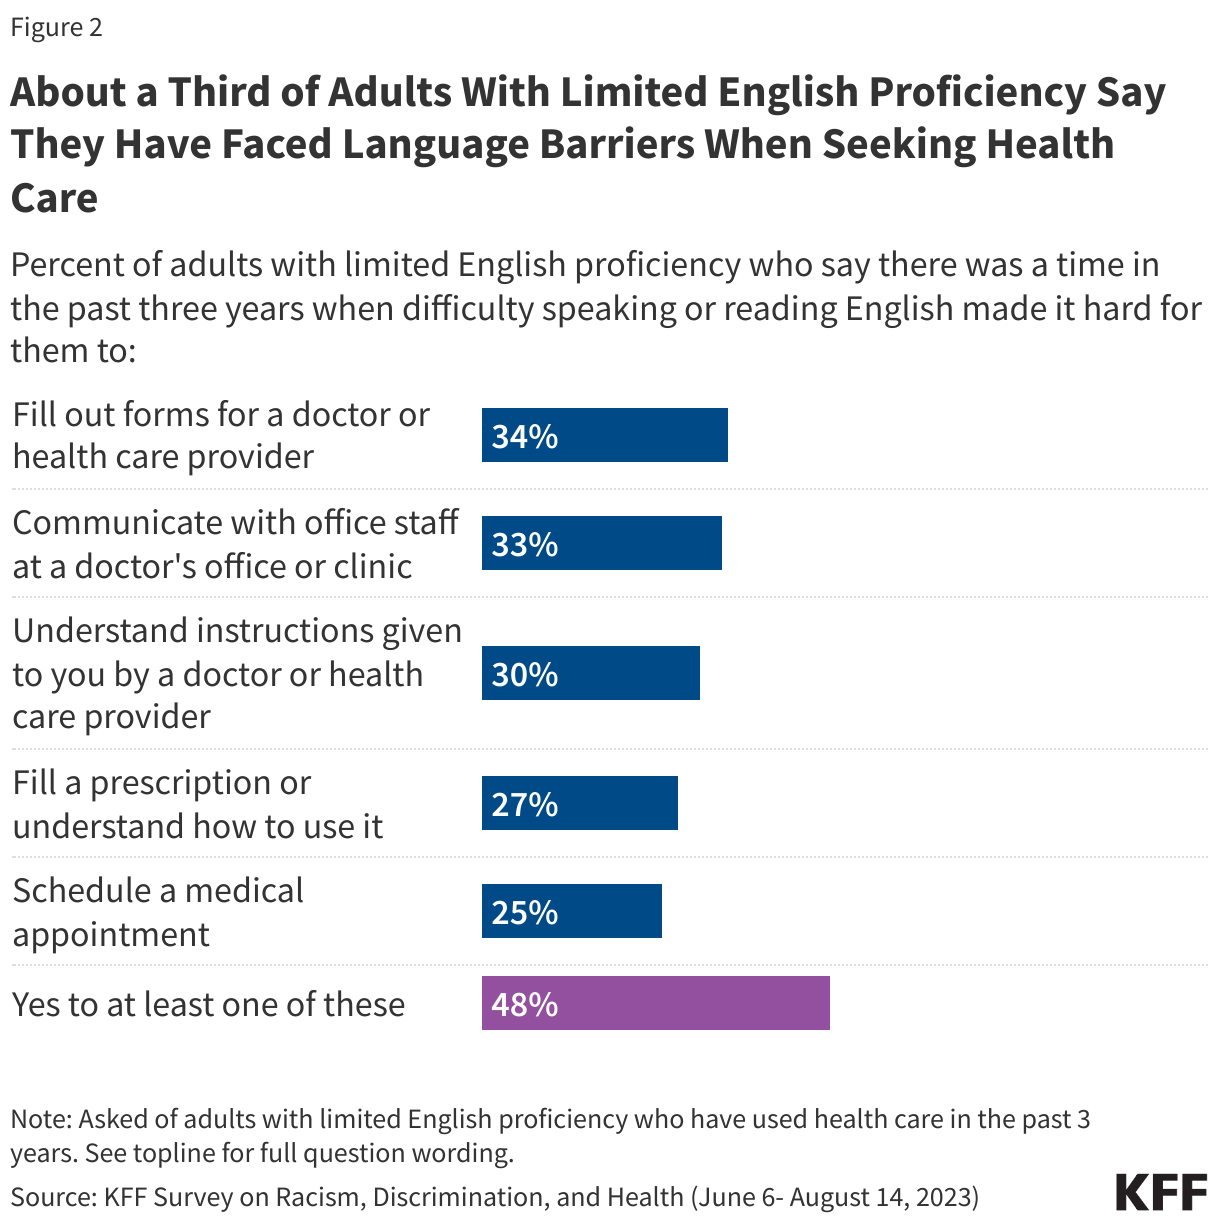
About half of adults with LEP say they encountered at least one language barrier in a health care setting in the last three years. This includes about a third of LEP adults who say there was a time in the past three years when difficulty speaking or reading English made it hard for them to fill out forms for a health care provider (34%) or communicate with medical office staff (33%), three in ten who report difficulty understanding a health care provider’s instructions (30%), and about a quarter who say language barriers made it difficult to fill a prescription or understand how to use it (27%) or schedule a medical appointment (25%).
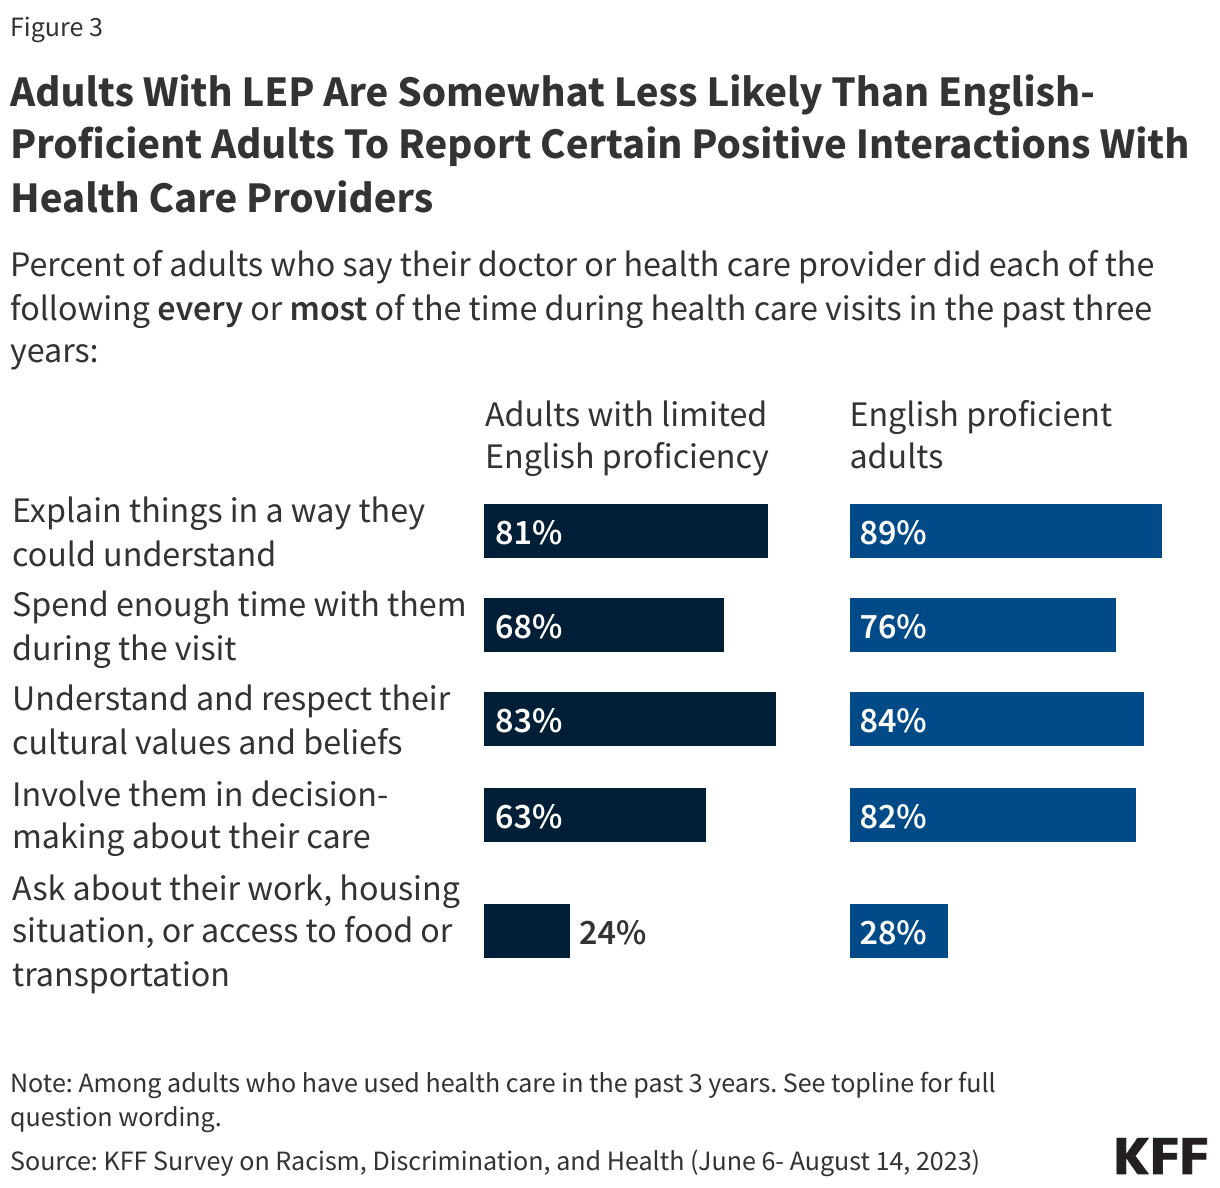
Adults with LEP report having positive, respectful interactions with health care providers somewhat less frequently compared to those who are English proficient. Overall, most adults report having mostly positive interactions with health care providers in the past three years, with majorities regardless of English proficiency saying their providers explained things in a way they could understand, spent enough time with them, understood and respected their cultural beliefs, and involved them in decision-making at least most of the time. However, adults with LEP report some of these experiences less frequently compared to those who are English proficient, including a provider explaining things in a way they could understand (81% vs. 89%), spending enough time during visits (68% vs. 76%), and involving them in decision-making about their care (63% vs. 82%).
Adults with LEP express lower levels of comfort asking questions of their health care providers compared to those who are English proficient. While most adults, regardless of English proficiency, say they have felt at least “somewhat” comfortable asking doctors and other health care providers questions about their health or treatment in the past three year, about half (54%) of adults with LEP say they feel “very comfortable,” which is lower than the two-thirds (66%) of English proficient adults who say the same.
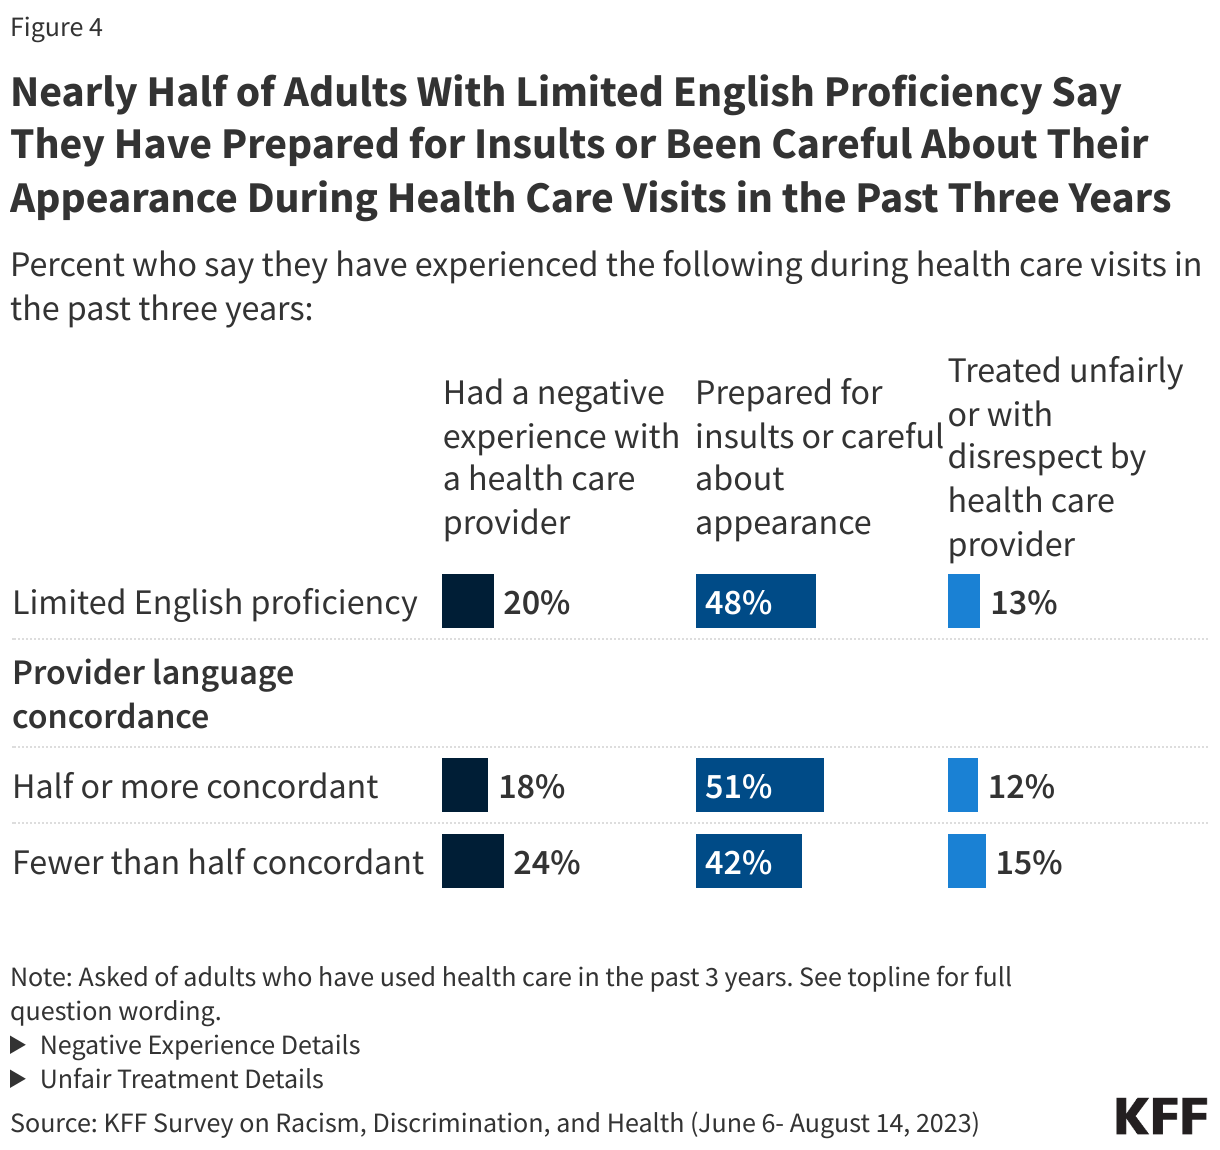
About one in five adults with LEP report a negative experience with a provider, one in eight report being treated unfairly or with disrespect, and about half report practicing vigilant behaviors associated with health care visits. Among adults with LEP, one in five reports experiencing at least one of several negative experiences with a health care provider in the past three years, including a provider ignoring a direct request or question (11%), assuming something about them without asking (8%), suggesting they were personally to blame for a health problem (8%), or refusing to prescribe needed pain medication (8%). In addition, one in eight (13%) adults with LEP say there was a time in the past three years when a health care provider or their staff treated them unfairly or with disrespect because of their race or ethnic background or for some other reason. Reflecting these experiences, about half (48%) of adults with LEP say they feel they have to be very careful about their appearance in order to be treated fairly (44%) and/or prepare for possible insults from a provider or their staff (18%) at least some of the time during health care visits. Adults with LEP do not report these experiences at significantly higher rates compared with those who are English proficient.
Importance of Linguistically Concordant Care
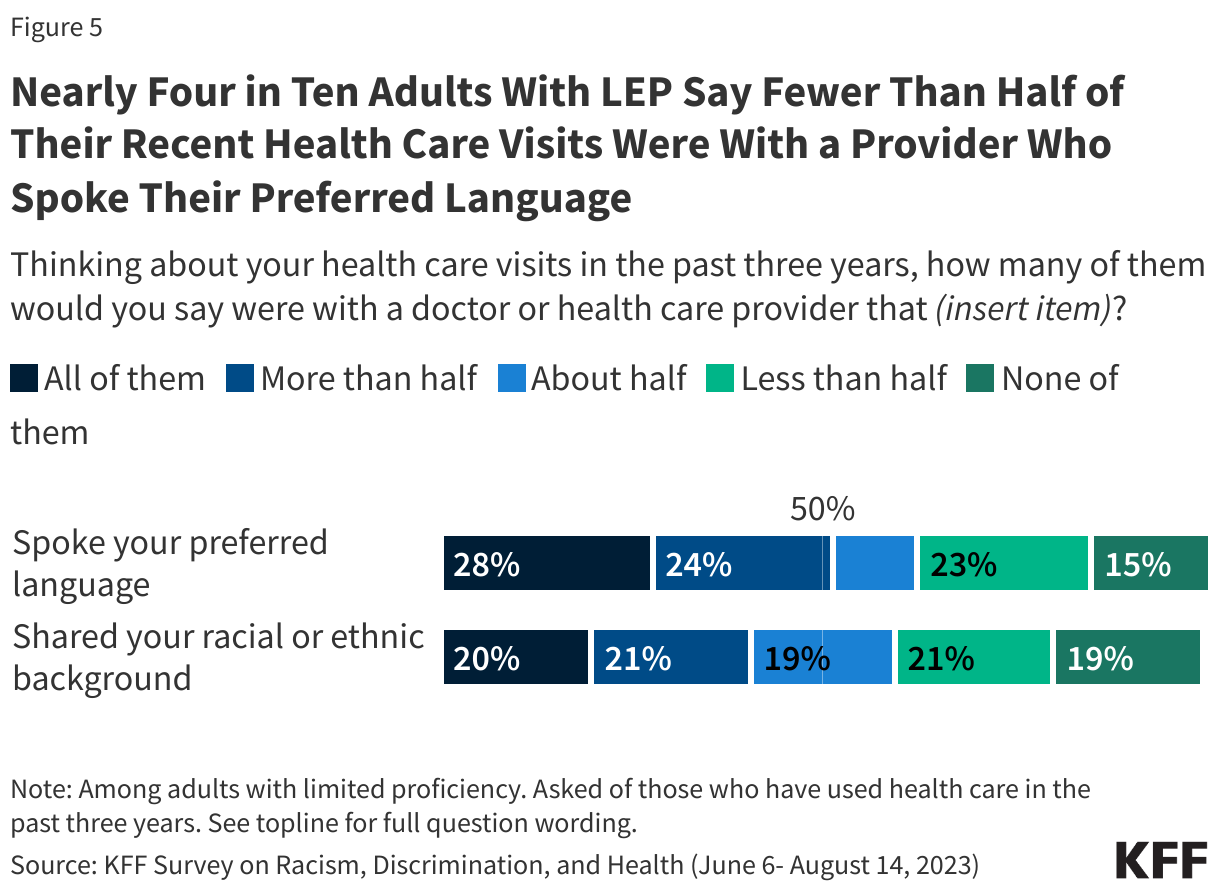
Nearly four in ten adults with LEP say fewer than half of their recent health care visits were with a provider who spoke their preferred language. While six in ten (63%) adults with LEP say at least half of their health care visits in the past three years were with a doctor or health care provider that spoke their preferred language, just 28% say that all of them were. Almost four in ten (37%) say that fewer than half of their visits were with a language concordant provider, including 15% who say they had no health care visits in the past three years with a provider who spoke their preferred language. In addition, among adults with LEP, four in ten say fewer than half of their health care visits in the past year were with a provider who shared their racial and ethnic background.
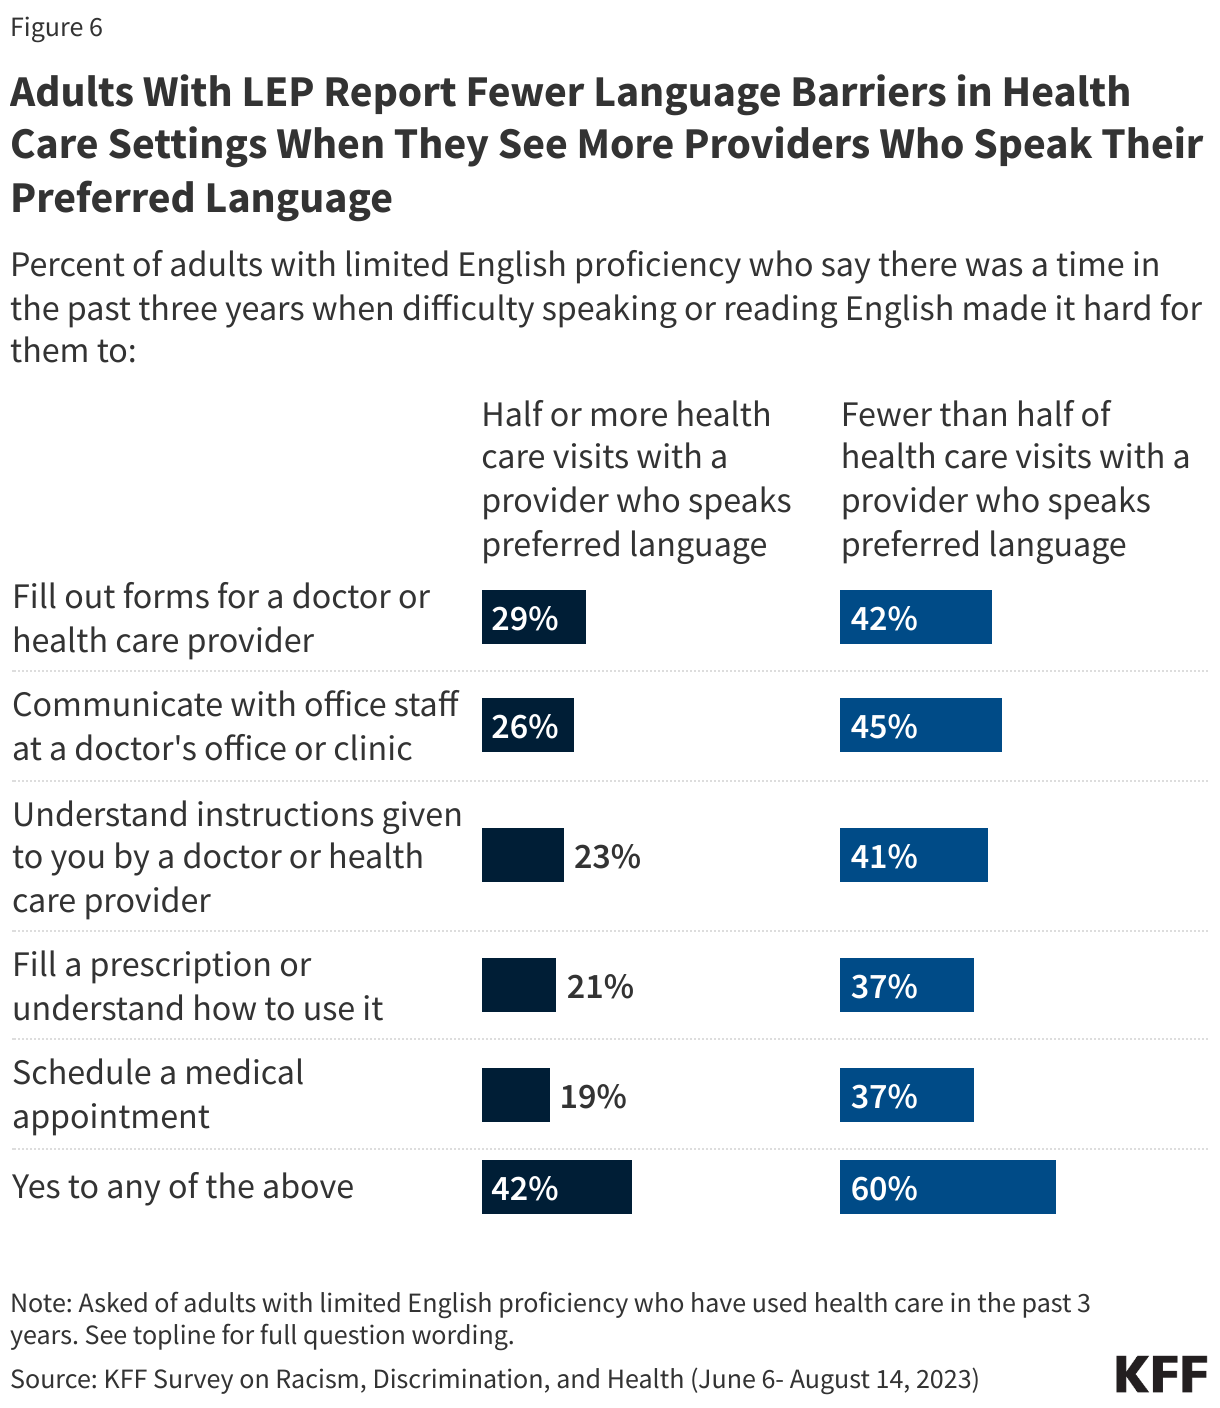
Adults with LEP who have more visits with providers who speak their preferred language are less likely to report facing language barriers while getting health care. Overall, four in ten LEP adults who say at least half of their health care visits in the past three years were with a provider who spoke their preferred language report experiencing at least one language barrier, compared with six in ten among those who had fewer than half of their health care visits with a language-concordant provider. For example, 45% of LEP adults who say less than half of their health care visits were with a provider who spoke their preferred language say they had trouble communicating with medical office staff, compared with 26% of those who had half or more of their health care visits with a language concordant provider.
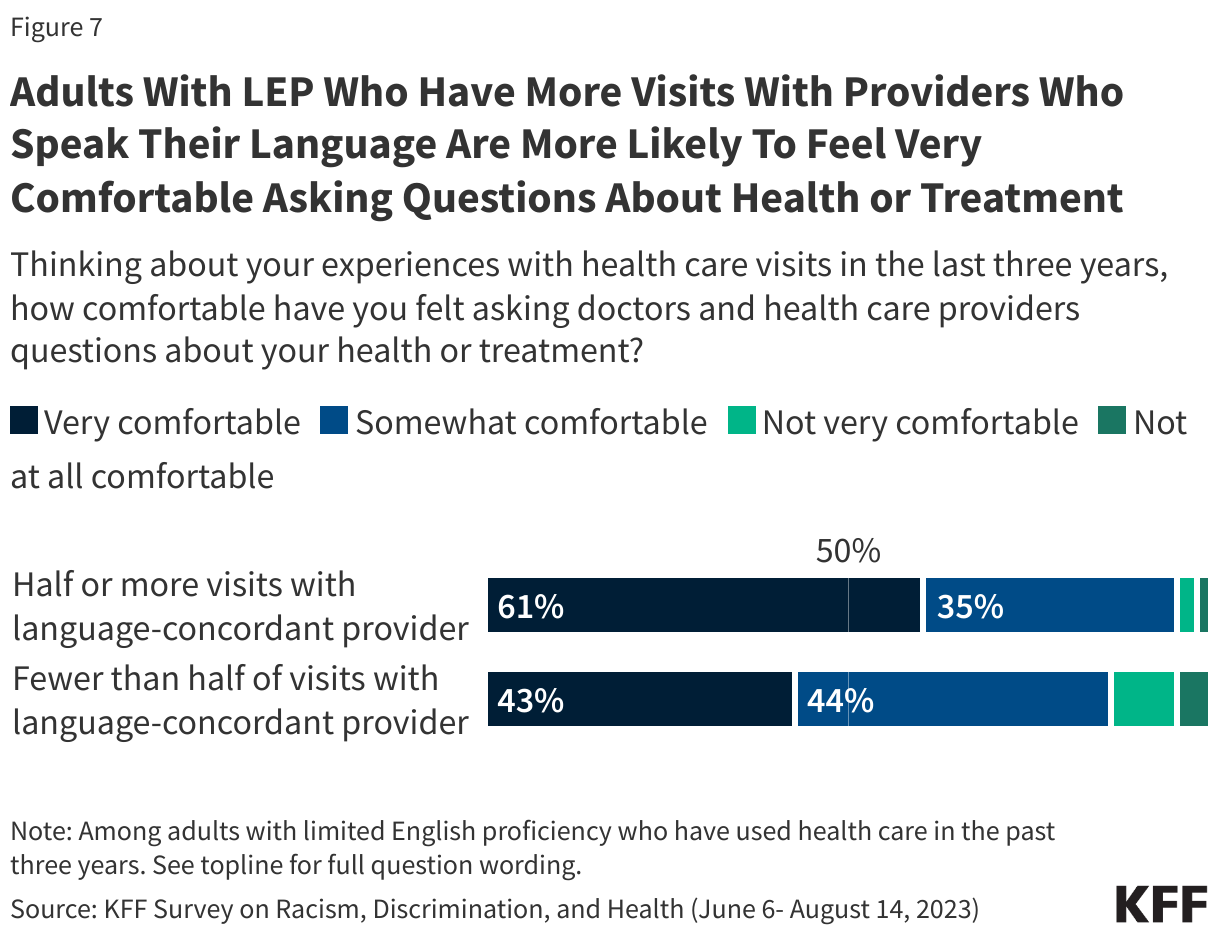
Adults with LEP who have more visits with a provider who speaks their preferred language are more likely to say they are comfortable asking questions about their health and treatment compared to those with fewer visits with a language concordant provider. Six in ten (61%) LEP adults who had at least half their visits with providers who spoke their preferred language say they have felt very comfortable asking questions compared to four in ten (43%) of those who had fewer visits with a language concordant provider.
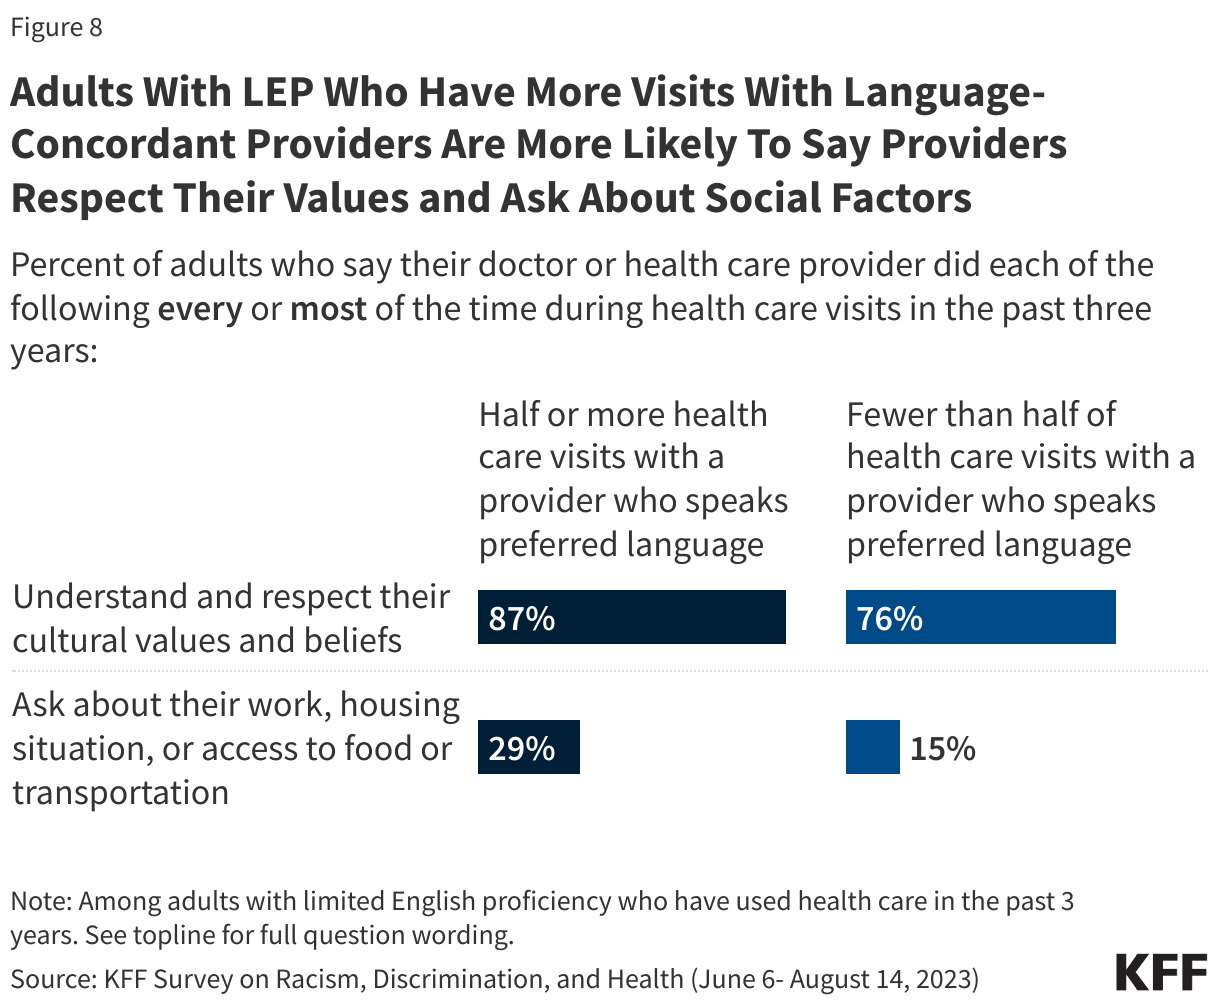
Adults with LEP who have more visits with language-concordant providers are more likely to say their providers usually respect their cultural values and beliefs and ask them about social factors like access to work, food, and housing. Among adults with LEP, those who had at least half of their health care visits with a provider who spoke their preferred language are more likely to say their providers understood and respected their cultural values and beliefs most or every time compared with those who had fewer visits with language-concordant providers (87% vs. 76%). While few LEP adults overall say their provider asked them about their work, housing situation or access to food or transportation during recent health care visits, those who had at least half of their visits with language concordant providers are more likely than those who had fewer visits with such providers to say this happened at least most of the time (29% vs. 15%).
Methodology
The Survey on Racism, Discrimination, and Health was designed and analyzed by researchers at KFF. The survey was conducted June 6 – August 14, 2023, online and by telephone among a nationally representative sample of 6,292 U.S. adults in English (5,706), Spanish (520), Chinese (37), Korean (16), and Vietnamese (13).
The sample includes 5,073 adults who were reached through an address-based sample (ABS) and completed the survey online (4,529) or over the phone (544). An additional 1,219 adults were reached through a random digit dial telephone (RDD) sample of prepaid (pay-as-you-go) cell phone numbers. Marketing Systems Groups (MSG) provided both the ABS and RDD sample. All fieldwork was managed by SSRS of Glen Mills, PA; sampling design and weighting was done in collaboration with KFF.
Sampling strategy:
The project was designed to reach a large sample of Black adults, Hispanic adults, and Asian adults. To accomplish this, the sampling strategy included increased efforts to reach geographic areas with larger shares of the population having less than a college education and larger shares of households with a Hispanic, Black, and/or Asian resident within the ABS sample, and geographic areas with larger shares of Hispanic and non-Hispanic Black adults within the RDD sample.
The ABS was divided into areas (strata) based on the share of households with a Hispanic, Black, and/or Asian resident, as well as the share of the population with a college degree within each Census block group. To increase the likelihood of reaching the populations of interest, strata with higher incidence of Hispanic, Black, and Asian households, and with lower educational attainment, were oversampled in the ABS design. The RDD sample of prepaid (pay-as-you-go) cell phone numbers was disproportionately stratified to reach Hispanic and non-Hispanic Black respondents based on incidence of these populations at the county level.
Incentives:
Respondents received a $10 incentive for their participation, with interviews completed by phone receiving a mailed check and web respondents receiving a $10 electronic gift card incentive to their choice of six companies, a Visa gift card, or a CharityChoice donation.
Community and expert input:
Input from organizations and individuals that directly serve or have expertise in issues facing historically underserved or marginalized populations helped shape the questionnaire and reporting. These community representatives were offered a modest honorarium for their time and effort to provide input, attend meetings, and offer their expertise on dissemination of findings.
Translation:
After the content of the questionnaire was largely finalized, SSRS conducted a telephone pretest in English and adjustments were made to the questionnaire. Following the English pretest, Cetra Language Solutions translated the survey instrument from English into the four languages outlined above and checked the CATI and web programming to ensure translations were properly overlayed. Additionally, phone interviewing supervisors fluent in each language reviewed the final programmed survey to ensure all translations were accurate and reflected the same meaning as the English version of the survey.
Data quality check:
A series of data quality checks were run on the final data. The online questionnaire included two questions designed to establish that respondents were paying attention and cases were monitored for data quality including item non-response, mean length, and straight lining. Cases were removed from the data if they failed two or more of these quality checks. Based on this criterion, 4 cases were removed.
Weighting:
The combined cell phone and ABS samples were weighted to match the sample’s demographics to the national U.S. adult population using data from the Census Bureau’s 2021 Current Population Survey (CPS). The combined sample was divided into five groups based on race or ethnicity (White alone, non-Hispanic; Hispanic; Black alone, non-Hispanic; Asian alone, non-Hispanic; and other race or multi-racial, non-Hispanic) and each group was weighted separately. Within each group, the weighting parameters included sex, age, education, nativity, citizenship, census region, urbanicity, and household tenure. For the Hispanic and Asian groups, English language proficiency and country of origin were also included in the weighting adjustment. The general population weight combines the five groups and weights them proportionally to their population size.
A separate weight was created for the American Indian and Alaska Native (AIAN) sample using data from the Census Bureau’s 2022 American Community Survey (ACS). The weighting parameters for this group included sex, education, race and ethnicity, region, nativity, and citizenship. For more information on the AIAN sample including some limitations, adjustments made to make the sample more representative, and considerations for data interpretation, see Appendix 2.
All weights also take into account differences in the probability of selection for each sample type (ABS and prepaid cell phone). This includes adjustment for the sample design and geographic stratification of the samples, and within household probability of selection.
The margin of sampling error including the design effect for the full sample is plus or minus 2 percentage points. Numbers of respondents and margins of sampling error for key subgroups are shown in the table below. Appendix 1 provides more detail on how race and ethnicity was measured in this survey and the coding of the analysis groups. For results based on other subgroups, the margin of sampling error may be higher. All tests of statistical significance account for the design effect due to weighting. Dependent t-tests were used to test for statistical significance across the overlapping groups.
Sample sizes and margins of sampling error for other subgroups are available by request. Sampling error is only one of many potential sources of error and there may be other unmeasured error in this or any other public opinion poll. KFF public opinion and survey research is a charter member of the Transparency Initiative of the American Association for Public Opinion Research.
| Group | N (unweighted) | M.O.S.E. |
| Total | 6,292 | ± 2 percentage points |
| Race/Ethnicity | ||
| White, non-Hispanic (alone) | 1,725 | ± 3 percentage points |
| Black (alone or in combination) | 1,991 | ± 3 percentage points |
| Hispanic | 1,775 | ± 3 percentage points |
| Asian (alone or in combination) | 693 | ± 5 percentage points |
| American Indian and Alaska Native (alone or in combination) | 267 | ± 8 percentage points |
Endnotes
- The KFF Survey on Racism, Discrimination, and Health was conducted in English plus four additional languages: Spanish, Chinese, Vietnamese and Korean. While it is not comprehensive of all adults with LEP, these languages make up about three fourths of the LEP population in the U.S. The survey results may somewhat overrepresent Spanish speakers, who make up 62% of the overall U.S. LEP population but 82% of respondents with LEP from the survey. ↩︎
- In this report Adults with Limited English Proficiency (LEP) are adults who responded the survey in a language other than English and self-identified as speaking English less than u201cvery well.u201d English-proficient adults are those who responded the survey in English or responded in another language and self-identified as speaking English u201cvery well.u201d ↩︎
